william pitt union energy improvement report
TRANSCRIPT

Case study:
William Pitt Union—Energy and Atmosphere
Graduate Group 3
Dejia Kong
Wanting Jiang
Liying Yin
Yazheng Song
Yaning Liu
4/20/2014
1

1. Description and requirement of 2030 DISTRICT
The Pittsburgh 2030 District is a collaborative community of high performance buildings in Downtown Pittsburgh working towards 50% reductions in energy use, water use, and transportation emission and with new construction reaching carbon neutrality by the year 2030 (Pittsburgh 2030 District Team , 2013).
In order to reach these 50% reduction goals, The Pittsburgh 2030 has sets baselines for each reduction category. For energy part, which matters to our project the most, they use Environmental Protection Agency’s (EPA) Energy Star Portfolio Manager tool, which based on 2003 Commercial Building Energy Consumption Survey (CBECS) data as their measuring tools for reduction goals. Specific information such as location, space use profile, and number of regular occupants, operating hours, and other parameters are being included during the measuring process.
Case studies under 2030 District
We found two successful cases in Seattle 2030 District that has some similarities with our project; we set them as our study cases.
1) The Dexter Horton
The Dexter Horton building is a historic landmark located in the core of downtown Seattle, it was built in 1922, which has a similar history span with William Pitt Union. In order to make efficiency improvements, the building management team started their renovations in 2006. Within one year of implementing retrofits, the Dexter Horton building jumped from an energy rating of 60 to 78 and is currently holding a rating of 96 and got LEED-EB Gold Certification (Seattle 2030 District, 2007). Innovative Measures include motion and occupancy light sensors in stairwells, variable frequency drive air conditioning, install heat exchanger and ongoing energy commissioning. The first three methods will also be utilized in our project.
2) Joseph Vance Building
The Joseph Vance Building was built in 1929 in downtown Seattle, also has a similar history span with William Pitt Union. Since the Rose Smart Growth Investment Fund acquired this building in 2006, the Fund has made significant investments in renovating the buildings to improve energy efficiency and environmental performance. Through the reconstruction, the Vance Building achieved LEED-EB Gold certification and already exceeds the 2030 energy goal. Innovative Measures used in this building include energy Star rated reflective roof system, restoration of operable windows, mecco shades and light shelves,
2

weather stripping, all lighting fixtures updated with high efficiency fixtures, commissioning of steam system, replacement of steam traps, local temperature control valves at radiators, new mechanical ventilation systems in corridors
2. William Pitt Union background
The William Pitt Union, which was created as the Schenley Hotel in 1898, was now changed into the student union building of the University of Pittsburgh. Schenley Hotel designed by architects Rutan&Russell. The entrepreneur Franklin Nocola and his first stockholders erected the beaux-arts structure on land. Schenley Hotel was the first large, steel-framed hotel in Pittsburgh. Then it was sold to the University of Pittsburgh in 1956 and underwent a $1million ($8.67 million in 2014 dollars) renovation to convert it to university use. The top four floors served as a men’s dormitory called Schenley House, the rest of the floors served as a student union named Schenley Hall. After that, the Schenley Hall ballroom in the Union was the site of a luncheon for Nikita Khrushchev, chairman of the Soviet Union, and various Soviet and U.S. officials during the height of the cold war in September 1959.
In 1980, the University of Pittsburgh spent a $ 13.9 million ($39.8 million in 2014 dollars) renovation and restoration for the Union because the increasing population of the student. The duration of this project is 18-month and led by Williams Trebilcock Whitehead. Seven upper floors served as modern offices for students and the student affairs administration. The 10th floor, which had been added several years after the hotel was first built, was removed to relieve stress on the building.
The turn-of-the-century character of the main floor was restored through careful restoration of the Louis XV mirrored ballroom, the lower lounge that had enclosed the original Bigelow Boulevard-side porch 13 years after the hotel was originally built, and the marbled-wall former hotel lobby, now called the Tansky Family Lounge. Moreover, the basement was transformed into a functional lower level with a new Forbes Avenue Entrance and plaza. The original wooden hotel room doors salvage from the upstairs renovationswere used for the walls of the lower level student recreation room, now called "Nordy's Place". Further, a third west entrance facing the university's Schenley Quadrangle and Litchfield Tower dormitories was added and included a new multi-level glass roofed atrium just inside the new entrance. The renovations were completed in 1983 and the building was renamed the William Pitt Union. Now the William Pitt Union serves as the student union and hub of the University of Pittsburgh and includes a variety of lounges, ballrooms, reception, performance, and meeting spaces.
In 2007, the recreation room on the ground floor of the union was renovated and by resolution of the Pitt Student Government Board in December 2007, was named "Nordy's Place" in honor of Chancellor Mark Nordenberg whom the board resolved was a student favorite and worthy of the honor.
3

In 2009, renovations to the second floor improved the accommodations of the student careers center and renovations to the fifth floor provided six new meeting spaces for student organizations. Moreover, a formal area was created where student organizations can host special events such as workshops and award presentations. In 2010, a $2 million project was undertaken to renovate 9,200 square feet (850 m2) of space on the ninth floor and created a new student study and lounge area, a 20-person conference room, a kitchen/coffee area, file/storage areas, and new offices for Residence Life, and Pitt Arts, and Student Volunteer Outreach.
A $1.93 million renovation of the Assembly Room included uncovering three large windows to allow in natural light, a stage extension and technology upgrades. Moreover, a $390,000 renovation of first floor restrooms and $1.85 million renovation of the lower levels of the union included its food court and dining spaces. All of these renovations were completed in 2013.
3. Project description and goals
Our primary object of this project is to change the William Pitt Union into a more environmental friendly building. By doing so, we will make several modifications based on the existing building. And the whole process will follow the LEED—Energy and atmosphere step by step with a special focus on prerequisite: minimum energy performance and also credit2: optimize energy performance. After finishing all the changes by using Revit, Green Building Studio and Tally, we are going to make a cost plan in order to find out the total savings for the building and analysis the impacts of these changes.
LEED Analysis
Energy efficiency in a green building starts with a focus on design that reduces overall energy needs, such as building orientation and glazing selection, and the choice of climate-appropriate building materials. Strategies such as passive heating and cooling, natural ventilation, and high-efficiency HVAC systems partnered with smart controls further reduce a building’s energy use.
We did the step-by-step guidance for prerequisite credit. First, we determine Pittsburgh Climate Zone 5A from ASHRAE APPENDIX B; and then, we review and address ASHRAE mandatory requirements and set up our baseline model by using Revit. After that, we set our energy saving target as 20% comparing with the 50% reduction for 2030 District since we do not include water usage and transportation factors in our case, so we think 20% reduction is a reasonable number. The last step is by following the flowchart in the LEED reference guide, we select Option 1—whole-building energy simulation as our final option.
Modeling
4

First of all, we built the model of William Pitt Union (Figure 1) by using the Revit software based on the information that got from the building manager and our own investigation. Since we are not permitted to get the data of the WPU so what we have now are just building area and the HVAC system. The building is 10 stories above grade with 178,726 sq. area. The heating system is hot water perimeter through a 4 pipe system on floors 1 through 9. The main floor and lower levels are steam heat and chilled water. We consider all exterior windows and doors into account to make sure that the estimate be more realistic. Then we adjust the location to the exact location of WPU, William Pitt Union, Forbes Avenue, Pittsburgh, PA 15213. By doing so, it guarantees that all the energy and cost analysis are based on the real situation of Pittsburgh.
Figure 1 Model of William Pitt Union
5

Pre-design/Planning
To improve the performance of the WPU and to meet the requirements for LEED rating system, we used a Design-Build process. Considering the practical situation of William Pitt Union and the information that we can get, we just analyzed and improved one aspect of the building: energy and atmosphere and the alternatives that we decided to change are roofing, glazing, lighting and HVAC system.
1) Roofing
We decided to use the Cool Roof - R50 continuous ins. over roof deck. Cool roofs are highly reflective and emissive, which means they reflect sunlight and reradiate absorbed heat as light energy back to the atmosphere, rather than transferring absorbed heat to the building below. However, traditional dark roofs do not reflect light and emit heat, so heat is easily absorbed by the roof and penetrates through to the building interior, increasing cooling costs. So, by using cool roof, it can reduce cooling load during hot summer months and equate to substantial annual energy and cost savings.
Cool roofs, through mitigation of the urban heat island effect and reduction of ambient air temperatures, in turn improve air quality. Smog is created by photochemical reactions of air pollutants and these reactions increase at higher temperatures. Therefore, by reducing the air temperature, cool roofs decrease the rate of smog formation. Cool roofs directly reduce the air conditioning use for buildings by reducing heat gain in the building below, but they also indirectly reduce air conditioning use in urban areas by helping lower ambient air temperatures. Therefore, with cooler daytime temperatures, buildings and vehicles use less air conditioning and save additional energy. In turn, this results in a reduction in the CO2 emissions from electricity generating power plants.
What’s more, Cities can be 2° to 8°F warmer than surrounding areas due to dark materials, including roofs, which absorb the sun’s light energy as heat during the day and release it at night as heat.3 This phenomenon removes the opportunity for air to cool down at night and results in higher temperatures being maintained longer. By immediately reflecting solar radiation back into the atmosphere and reemitting some portion of it as infrared light, cool roofs result in cooler air temperatures for the surrounding urban environment during hot summer months.
2) GlazingConsidering the weather condition of Pittsburgh, we decided to apply the insulated
Clear Low-e (Low-emissive) Cold Climate material to the windows. A low-e glass window (which stands for low emissivity) is simply a windowpane coated in microscopic layers of metallic oxides. The coating appears invisible to the naked eye, allowing as much natural light into the house as possible. Windows treated with Low-e coatings are proven to reduce
6

energy consumption, decrease fading of fabrics, such as window treatments, and increase overall comfort in your home. Since Pittsburgh’s winter is long and cold, we think by using low-e glass windows, it can help keep the room warm and reduce the usage of electric. Even if windows manufactured with low-e coatings typically cost about 10 to 15 percent more than regular windows, they reduce energy loss by as much as 30 to 50 percent.
Furthermore, this improvement in the building envelope—particularly when coupled with other strategies that improve the efficiency of the building envelope—ultimately impacts the demands of building HVAC systems. These benefits should be included in evaluating the lifecycle costs of installing efficient windows.
3) LightingFor several parts of the building, like the restrooms, there is no need to turn on the
lights all day. So we are considering using occupancy sensors during renovations. Sensors are considered most suitable when the space is intermittently occupied, meaning it is unoccupied for two or more hours per day, and where the lights are typically left on when the space is unoccupied. Appropriate applications include offices, classrooms, copy rooms, restrooms, storage areas, conference rooms, warehouses, break rooms, corridors, filing areas, and other spaces. There are several benefits of using the sensors. First, less energy is wasted with motion sensors because the light turns off after a short period of time. Since they do not run continually, the bulbs will burn out less frequently in a motion sensor light than in a traditional fixture. Besides, lighting up the path to your front door reduces the chances you will trip on a bush or other obstruction. The brief illumination also helps you find your keys, unlock the door and get inside the home faster.
4) HVAC systemThe intent of this item is to reduce ozone depletion. We changed the WPU’s HVAC
system from Central VAV Electric Residential Heat to Central VAV, HW Heat, Chiller 5.96 COP, and Boilers 84.5 eff. HVAC systems are classified as either self-contained unit packages or as central systems. With central systems, the primary conversion from fuel such as gas or electricity takes place in a central location, with some form of thermal energy distributed throughout the building or facility.
Central systems are a combination of central supply subsystem and multiple end use subsystems. There are many variations of combined central supply and end use zone systems. The most frequently used combination is central hot and chilled water distributed to multiple fan systems. The fan systems use water-to-air heat exchangers called coils to provide hot and/or cold air for the controlled spaces. End-use subsystems can be fan systems or terminal units. If the end use subsystems are fan systems, they can be single or multiple zone type. The benefits of this HVAC system are below: 1) Maintain thermal comfort conditions; 2) Maintain optimum indoor air quality; 3) Reduce energy use; 4) Safe
7

plant operation; 5) To reduce manpower costs; 6) Identify maintenance problems; 7) Efficient plant operation to match the load; 8) Monitoring system performance.
Conceptual Energy Analysis
Conceptual energy analysis is one way to perform energy analysis on conceptual mass and building element models within design workflow. The energy analytical model feature in Revit building design software provides tools for fast, flexible creation of models for energy simulation. We can get whole building energy analysis results within Revit, powered by Green Building Studio cloud-based energy analysis service. Green Building Studio provides a wide variety of energy use data so that we can improve analysis quality and find potential opportunities for energy savings.
With this analysis, owners can make sustainable design decisions early in the design process. It also can gain insight into energy consumption and building lifecycle costs early in the design process without disrupting workflow. Using Revit to do the conceptual energy analysis. The energy analyze result not only show the energy performance of the building, but also can compare the energy performance of multiple alternative designs. Often comparing the construction cost to the lifecycle cost is an important metric for balancing environmental design and construction. EUI, or energy use intensity, is a per-floor-area unit of measurement that describes a building’s energy use by area. EUI represents the energy consumed by a building relative to its size and as such can be informative when comparing options of different sizes.
Total EUI sums these two and incorporates all transmission, delivery, and production losses, thereby enabling a complete assessment of energy efficiency (Conceptual Energy Analysis Results and Compare). We are also going to use the Tally and Green Building Studio to acquire a basic energy simulation. Since we will do the conceptual analysis without accurate data, we leave out some specific parts, like porches and elevator shaft. To do a closer analyze, we don’t omit the glass roof because of the high cost of a roof. Instead, we expand the glass roof to the whole podium building area to make up the parts that we skipped.
Green Building Studio is another useful energy analysis software. It enables architects and designers to perform whole building analysis, optimize energy consumption, and work toward carbon-neutral building designs earlier in the process. Cloud-based energy-efficiency software helps teams achieve sustainable building designs faster and more accurately with powerful energy and carbon analysis tools. For every project located in the United States, Green Building Studio provides an ENERGYSTAR score to compare the energy efficiency of your design to similar energy-efficient buildings, including a LEED point estimate for glazing factor and water credits. For this project, since the glass roof is set to make up other skipped parts, the glass area is greater than 2%, which required by LEED that
8

project achieve a minimum glazing factor of 2% in a minimum of 75% of all regularly occupied areas.
Energy analysis for the original buildingBefore analyzing, it is necessary to define some words. First is the functional unit of
this project, it means the usable floor space of WPU. Then reference flow represents the amount of material required to produce WPU designed in order to save more energy, over the full life of the building. We assure that reference buildings are functionally equivalent in terms of scope, size, and relevant performance of WPU. The LCA results in the report represent an analysis of WPU. The object of study represents the complete architectural, structural, and finish systems of WPU, and it is used to compare the relative contributions of building systems to environmental impacts and for comparative study with one or more reference buildings.
The analysis accounts for the full cradle-to-grave life cycle of WPU studied, including material manufacturing, maintenance and replacement, and eventual end-of-life (disposal, incineration, and/or recycling), the materials and energy used across all life cycle stages are also included. Manufacturing includes cradle-to-gate manufacturing wherever possible. This includes raw material extraction and processing, intermediate transportation, and final manufacturing and assembly.
However, due to data limitations, some manufacturing steps have been excluded such as the material and energy requirements for assembling doors and windows. The manufacturing scope is listed for each entry, detailing any specific inclusions or exclusions that fall outside of the cradle-to-gate scope. We analyze environmental impacts of WPU from the following aspects: acidification potential (AP), eutrophication potential (EP), global warming potential (GWP), ozone depletion potential (ODP), smog formation potential (SFP), and primary energy demand (PED). Acidification potential refers to the emission of SO2. The acidification potential is a measure of a molecule’s capacity to increase the hydrogen ion (H+) concentration in the presence of water, thus decreasing the pH value. Potential effects include fish mortality, forest decline, and the deterioration of building materials. Eutrophication covers all potential impacts of excessively high levels of macronutrients, the most important of which are nitrogen (N) and phosphorus (P). Nutrient enrichment may cause an undesirable shift in species composition and elevated biomass production in both aquatic and terrestrial ecosystems. In aquatic ecosystems increased biomass production may lead to depressed oxygen levels, because of the additional consumption of oxygen in biomass decomposition. Global warming potential refers to the greenhouse gas emissions, such as CO2 and methane. These emissions are causing an increase in the absorption of radiation emitted by the earth, increasing the natural greenhouse effect. This may in turn have adverse impacts on ecosystem health, human health, and material welfare. The results that Tally provides are based on different classification methods.
9

Through this figure, we can learn that the emission of SO2 is mostly caused by wood and plastics, then caused by concrete; the emission of N is mostly caused by wood and plastics; the emission of CO2 is caused by every materials averagely; the emission of CFC is mostly caused by wood and plastics, then caused by concrete; the emission of O3 is mostly caused by wood and plastics, than caused by concrete. As a result, it shows us wood and plastics of WPU impact the environment greatly, then comes to the concrete.
Figure 2 Tally per CSI Division, itemized by Material
Analysis results of Green Building Studio (GBS)GBS is a Web-based service provider on energy analysis of the building design. GBS
enables architects and engineers to perceive the energy impact prior to the actual construction of the projected building. GBS is practical means of avoiding unnecessary expenditure in energy consumption. So we used the GBS to compare the proposed model
10

with the baseline model to determine the anticipated energy cost savings. Figure 3 is the baseline energy, carbon and cost summary of WPU.
Figure 3 Baseline energy analysis of WPU
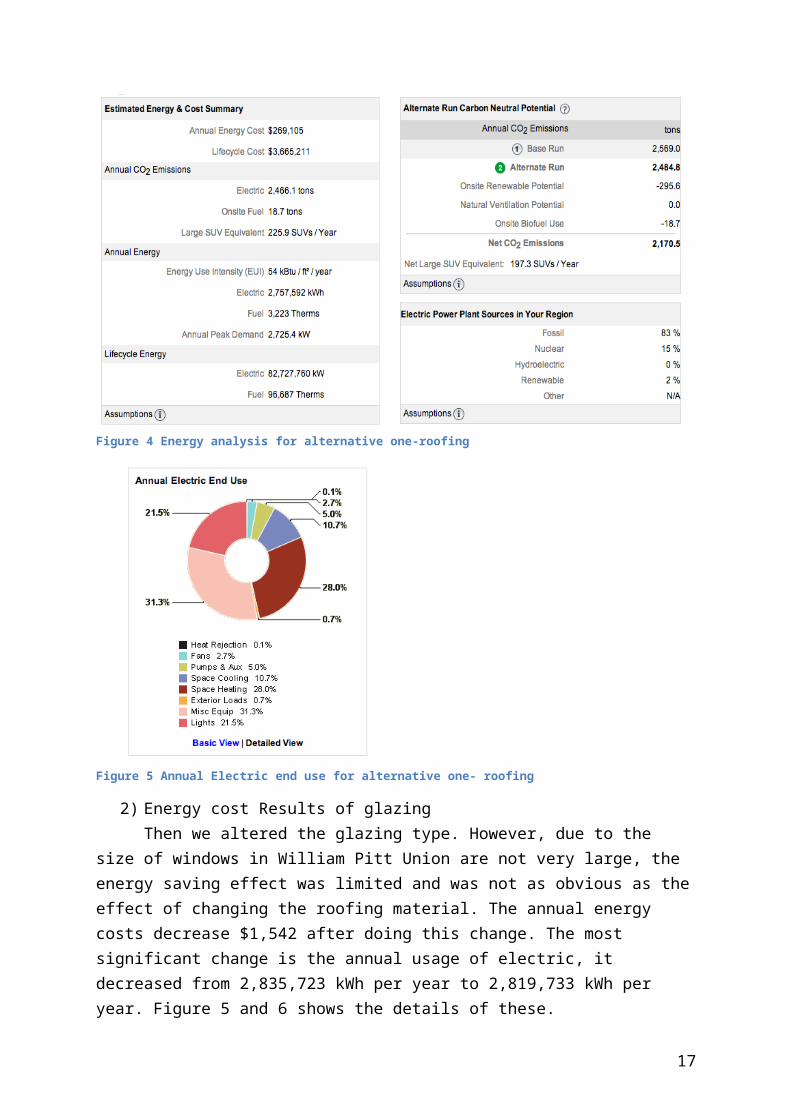
1) Energy cost Results of Roofing After changing the roofing from traditional one to the Cool-Roof, we can easily find that the annual energy cost, lifecycle cost decreased by 2.72% and 2.80% separately and annual CO2 emission also decreased 84.2 tons per year. Besides, the electronic consumption decreased by 2.76%. Figure 4 shows the details. The reason for the decreasing is that the cool roof has the heat insulation effect, which can reduce the use of air condition. As a consequence, both the emissions of CO2 and usage of electric will decrease. And figure 5 shows annual electric end use after changing the roof. From the chart, we can see that misc. equipment and lights consumed relatively more electric.
11
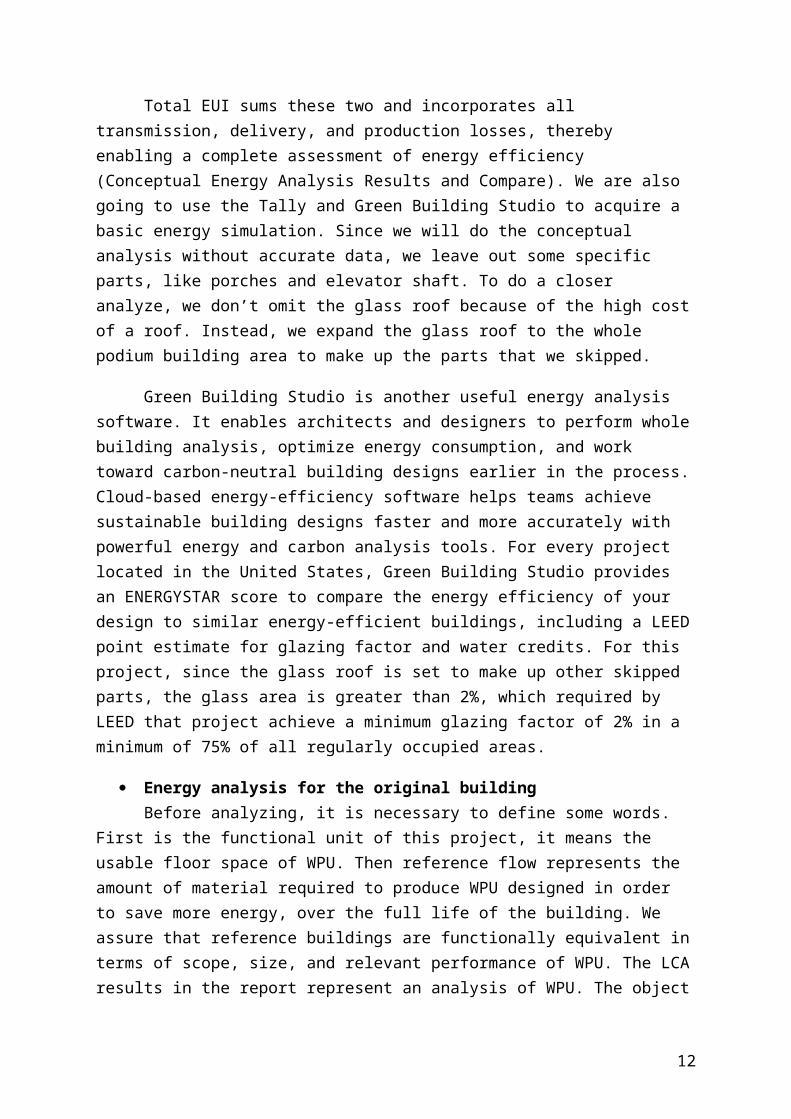
Figure 4 Energy analysis for alternative one-roofing
Figure 5 Annual Electric end use for alternative one- roofing
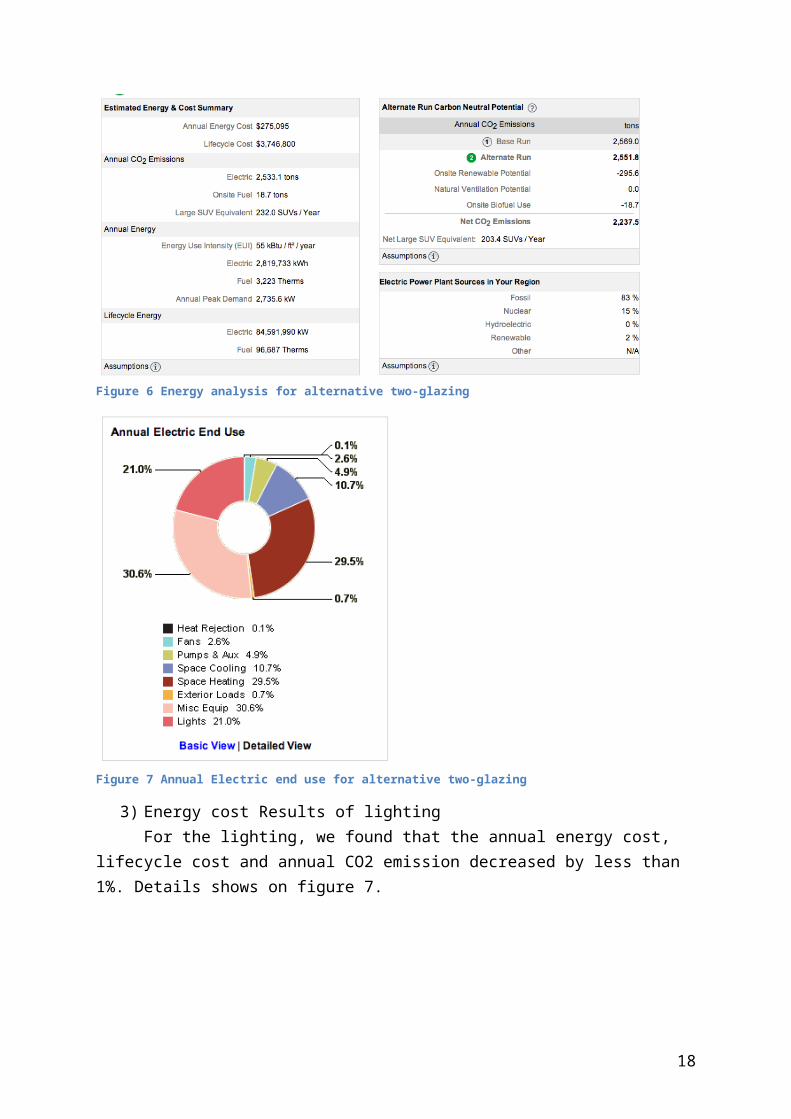
2) Energy cost Results of glazingThen we altered the glazing type. However, due to the size of windows in William
Pitt Union are not very large, the energy saving effect was limited and was not as obvious as the effect of changing the roofing material. The annual energy costs decrease $1,542 after doing this change. The most significant change is the annual usage of electric, it decreased from 2,835,723 kWh per year to 2,819,733 kWh per year. Figure 5 and 6 shows the details of these.
12

Figure 6 Energy analysis for alternative two-glazing
Figure 7 Annual Electric end use for alternative two-glazing
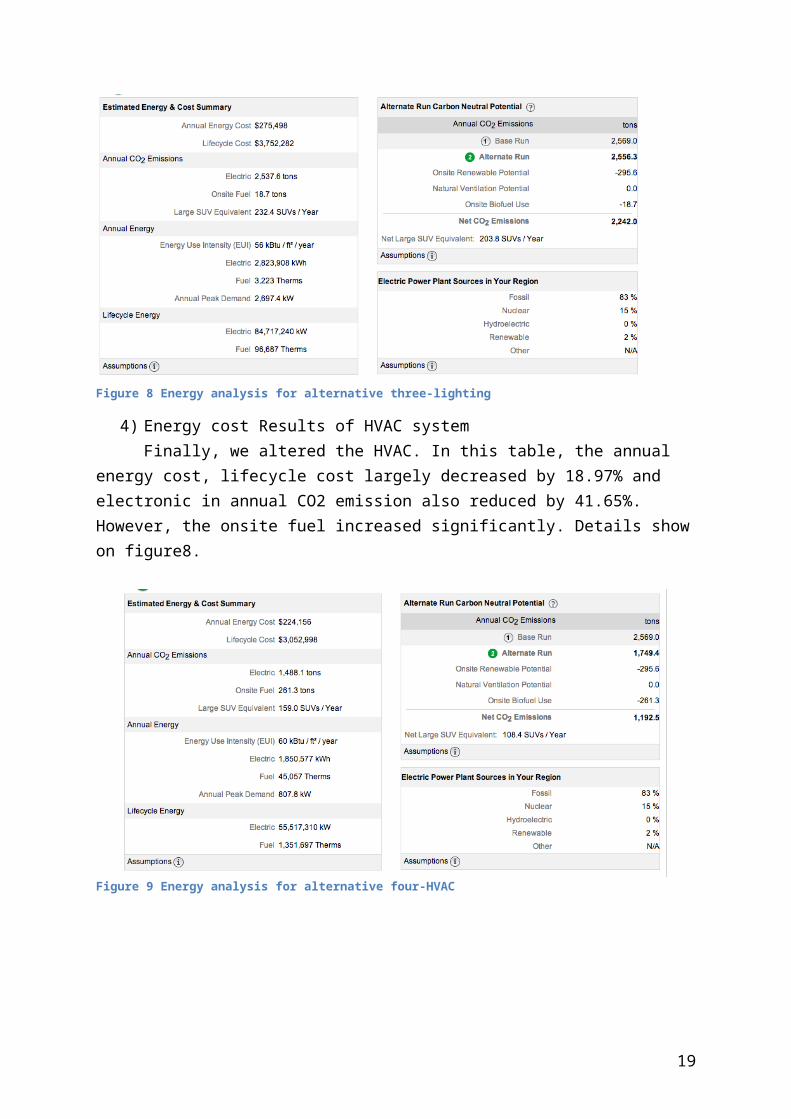
3) Energy cost Results of lightingFor the lighting, we found that the annual energy cost, lifecycle cost and annual CO2
emission decreased by less than 1%. Details shows on figure 7.
13

Figure 8 Energy analysis for alternative three-lighting
4) Energy cost Results of HVAC systemFinally, we altered the HVAC. In this table, the annual energy cost, lifecycle cost
largely decreased by 18.97% and electronic in annual CO2 emission also reduced by 41.65%. However, the onsite fuel increased significantly. Details show on figure8.
Figure 9 Energy analysis for alternative four-HVAC
14

Figure 10 Annual Electric end use for alternative four-HVAC
Here we want to talk about the energy use intensity. The EUI is expressed as energy per square foot per year. It’s calculated by dividing the total energy consumed by the building in one year (measured in kBtu or GJ) by the total gross floor area of the building. Generally, a low EUI signifies good energy performance. Figure 10 shows the details.
In electricity aspect, obviously, HVAC lead to the best energy performance due to the low energy consumption for space heat. However, in natural gas aspect, we can see that HVAC consumed a considerable energy for space heat. It leads to the intensity of fuel use in a high level. Therefore, the total energy use of electricity and natural gas, cool roof- R 50, shows a better energy performance. And HVAC consumed too much energy for space heat; therefore, it reflects a disappointed energy performance.
4. Cost Plan
Much money will be spent to finish all these modifications. So, we used the data, like the unit price of labor, materials from the website, and calculate the total cost to finish all these works. Then we made a comparison between the total cost and the energy savings to find out the results of this project and the credits that we will get. Table 1 shows the labor costs to do the changings. Table 2 shows the material cost. Table 3 shows the total savings.
Labor Costs
Roof
Unit cost ($/h)Units Durations (hours) Total costs ($)
Labor 30 4 20 2400Windows
15

Carpenter 45 6 40 10800LightingLabor 30 5 35 5250HVACLabor 30 4 48 5,760
Total Costs 24,210
Table 1 Labor Cost
Table2: Material cost
Labor cost($)
Material cost ($)
Annual energy cost ($)
Lifecycle cost ($)
Roof Original 0 32098 276,637 3,767,795Alternative 2400 56171.5 269,105 3,665,211Savings -2400 -24073.5 7532 102,584
Windows Original 0 71136 276,637 3,767,795Alternative 9600 98496 275,095 3,746,800Savings -9600 -27360 1542 20,995
Lighting Original 0 1620 276,637 3,767,795Alternative 5250 2700 275,498 3,752,282Savings -5250 -1080 1,139 15,513
HVAC Original 0 480 276,637 3,767,795Alternative 5,760 569 224,156 3,052,998
16
RoofMaterial Unit price ($/sq.ft) Quantity (sq) Total cost ($)
Original material Steel-Insulation on metalEPDM
2 16049 32098
Alternative material Cool roof-R50 coutinuous ins.Roof deck
3.5 16049 56171.5
Lighting
Material Unit price ($) Quantity(Num) Total cost ($)Original material ordinary lighting controls 18 90 1620
Alternative material Occupancy/Daylighting sensors & controls
30 90 2700
Glazing
Material Unit price ($/sq.ft) Quantity (sq) Total cost ($)Original material ordinary glazing 13 5,472 71136
Alternative material Insulated Clear Low-e Cold Climate
18 5,472 98496
HVAC systemMaterial Unit price ($) Quantity (sq) Total cost ($)
Original material Central VAV ElectricResidential Heat 480 1 480
Alternative material Central VAV, HW Heat, Chiller 569 1 569
Savings -5,760 89 52,481 714,797Table 3: savings
So after changing all these, the annual energy cost can reduces $38,559. The labor cost is $24,210.And the total cost of the material and devices increases $52,602.5. So it will take almost 1 year to gain benefit from those changes (See equation 1).
Equation1:52,513.5+24,210
62,694=1.22
Conclusions and LimitationsIn this project, we used Revit to build the WPU model, Tally to analysis the original
building’s energy cost. Then, we choose the alternatives through the GBS software in order to make WPU more environmental friendly. Then GBS made comparisons between the old building and the new one. The results all came out automatic, like the energy consumption and cost consumption. After we calculated the cost to change all these materials, we put all these data together, followed by the LEED Reference Guide to score our project. Since we just considered the energy and atmosphere of the LEED category, we just got 10 points of LEED evaluation system (See equation 2).
Equation2: 276,637−213,943
276,637=22.66 %
5. Limitations There are some limitations of our project. Firstly, transportation requirements between the manufacturer and installation or use of the product, and at the end-of-life of the product, are excluded from this report. Secondly, infrastructure required for the manufacturing and assembly of building materials, as well as packaging materials, is not included and are considered outside the scope of assessment. So the analysis of WPU is not so comprehensive and there still a lot can be improved.
17
BibliographyAbout the Pittsburgh 2030 District. (n.d.). Retrieved from Pittsburgh 2030 District: http://www.2030districts.org/pittsburgh/aboutAuroras. (2014, 01 17). Pittsburgh 2030 District Energy Baseline Finalized! . Retrieved from Pittsburgh 2030 District : w.2030districts.org/pittsburgh/news/pittsburgh-2030-district-energy-baseline-finalizedPittsburgh 2030 District Team . (2013). PITTSBURGH 2030 DISTRICT ENERGY BASELINE . Pittsburgh: Pittsburgh 2030 District.Seattle 2030 District. (2007). Dexter Horton Building Statistics. Seattle.Blake, Sharon S. (August 20, 2013). "Changing Spaces: William Pitt Union Eatery and Litchfield Towers Food Court Get Facelifts". Pitt Chronicle (Pittsburgh, PA: University of Pittsburgh). Retrieved August 26, 2013."Hotel Schenley - associated architects, engineers, etc. - Philadelphia Architects and Buildings". Philadelphiabuildings.org. Retrieved 2014-02-03."Pittsburgh History and Landmarks Foundation: PHLF Plaques & Registries". 2007-01-27. Archived from the original on 2007-01-27. Retrieved 2009-07-10."Pitt photo tour: William Pitt Union". University of Pittsburgh. Retrieved 2010-10-06.
18
19