william c. hiss ’66 kate m. doria ‘10 “diamonds in the ro
TRANSCRIPT
Defining Promise: Twenty-five Years of Optional Testing at Bates College,
1984-2009
William C. Hiss ’66
Executive Director for International Advancement and Lecturer in Asian Studies
Kate M. Doria ‘10
Bates College, Lewiston, ME
“Diamonds in the Rough: Why Every Institution of Higher Education Will Want to
Attract and Admit Dyslexic Students”
Stanford Graduate School of Business
Stanford University
June 3, 2011
2
To begin, a comment on my title, “Defining Promise,” as a kind of three-sided verbal
hologram. The phrase refers first to defining the promise of students who apply to our
colleges and universities, in this case a college with a 25-year policy of optional
standardized testing in admissions. Second, it refers to the promises which colleges and
universities make to our students, to recognize their intellectual and human potential, and
provide benefits from friendships to job skills. Third, colleges and universities make
promises to society, to develop the knowledge and skills our country needs, and in
consideration of which we are given benefits, including tax-free status. The first version
of “Defining Promise” is the subject of this paper: defining the promise of students. But
the latter two issues are not abstractions: we are having a conversation today about which
students colleges and universities can serve, and what benefits accrue to students,
universities, and society.
Two years after the Bates faculty voted to make SAT’s, now SAT I’s, optional for
admission, I gave part of the closing keynote address at the NACAC national meeting, on
the topic, “Admissions as Ministry.” Four of us who had trained to be ministers and
ended up as deans of admissions—Betsy DeLaHunt, Dick Moll, Zina Zacque and I—
drew out, often with piquant humor, the parallels between the two careers, catching
people at important watershed moments in their lives. Admissions deans, faced with the
selection versus recruitment worlds, might say, “Wait a minute. Who am I supposed to
be, Paul Tillich or Billy Graham?” Our Presidents would say, “Both, and look snappy,
too.” It was my best shot to say why I made Admissions my life’s work, and people
came up afterwards to hug us, often crying. On the plane home I saw my suit was ruined,
from wet make-up.
It seemed no accident to me, then or now, that three of the four of us on that platform
had led institutions to make testing optional. It was not that testing came from the forces
of darkness—it hadn’t. Bates is an active if left-wing member of the College Board,
heavily using three of their services: AP, and two great data analysis tools, the EPS and
ASQ. But in 1984, testing seemed to us to be occupying too much emotional space in
the middle of the system. So we tried another tack, not with evidence that we knew it
would be better or a statement of moral rectitude. But it was both a predictive and an
ethical issue for us. It was an attempt to say, How can we find stronger, more promising
students, help them believe in themselves, and turn their energies to what Howard
Gardner calls “good work”?
3
We will look at some fruits of that thinking today. With a few comments at the
beginning, this is mostly a lightening tour through the data of 25 years of optional testing.
4
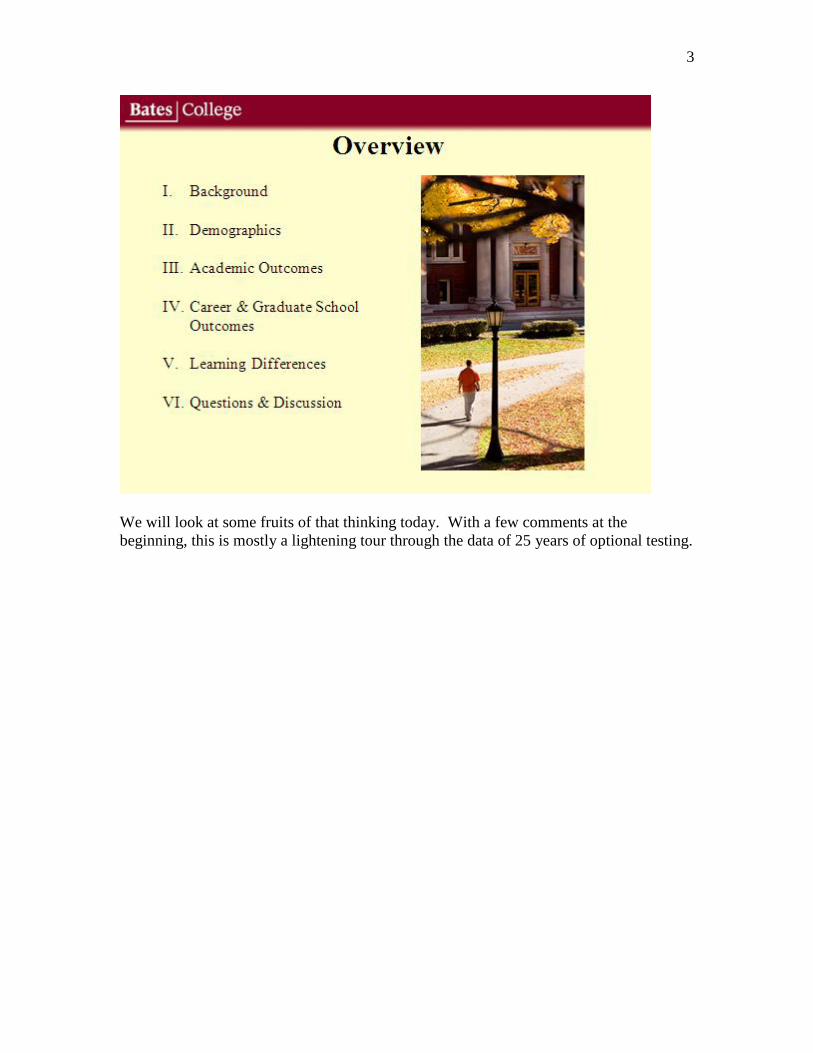
Some of you may know Woody Allen’s wonderful movie, “Annie Hall”, where he talks
about a fellow who thought he was a chicken. People tried to get his relatives to get him
into some therapy to get over this obsession about being a chicken, and the relatives said,
“Well, we would, but we need the eggs.”
At some levels, this discussion is about holding on obsessively to something that
demonstrably may not make any sense. We might say to our young people, “You are not
a chicken!” and say to each other, “These are not eggs.”
And a Japanese Haiku from a fellow who teaches Asian fiction and film at Bates: This
research is about being willing to take down a structure to see more clearly, to try a
different way.
5
From the outset, Bates has shared its data and research on the policy. We have published
our research at 5-year intervals, providing the data to anyone who asked for it. I want to
offer praise to my co-author on this paper, Kate Doria, here today with us. Kate
graduated from Bates last year and did the statistical analyses you will see, with two
Bates statistical masters hanging over her shoulders. Last year we gave an earlier version
of this paper together at a parallel conference at Yale, two weeks before she received her
undergraduate degree. No surprise, first Carleton and then Amherst thought Kate looked
like a young star as an institutional researcher.
There have been astonishingly consistent findings, and now with the long 25-year
timeline, some intriguing alumni outcome data. Admissions research, like medical
research, is always at least 4 years behind the decisions, or 7 years to get a 6-year
graduation rate and get the research done, while grad school data reflect more delays
before students start their programs. Finally, these are flesh and blood people, with a few
fascinating curveballs: one of 2009’s graduating Seniors was thrown out for a badly
conceived prank in 1955, and came back to finish his degree at age 73, to thunderous
applause at Commencement.
The report contains roughly 25 images on which we will comment, but running like a
scarlet thread through the data are three fundamental issues:
(1) Does requiring the tests open or truncate access to higher education? Call this a
marketing issue --who will apply?—or an access issue—who is admitted? Do the tests
6
artificially truncate the pool of people who would succeed if they could be admitted and
given a chance?
(2) How predictive are the tests? Are they consistently predictive across populations?
Are they “standardized” because people take the same test, or because their predictive
value is consistent? As you will see, we seriously question the latter argument.
(3) What are the definitions of intelligence and achievement which a college (or society)
signals to its youth with such a policy? What are the career and graduate degree results of
our policy?
These are at root questions of social ethics and social policy: who gets to go to college?
What are the definitions of intelligence and achievement? Two of America’s lodestone
educational thinkers, Howard Gardner at the Harvard Ed School, and the author Jonathon
Kozol, have been our North Stars. Professor Gardner sees Bates as a small Petri dish of
his work on intelligence intelligences, and as an “in the trenches” disciple of Gardner and
Kozol, I acknowledge with a deep bow of gratitude his new gestalt on human
intelligence.
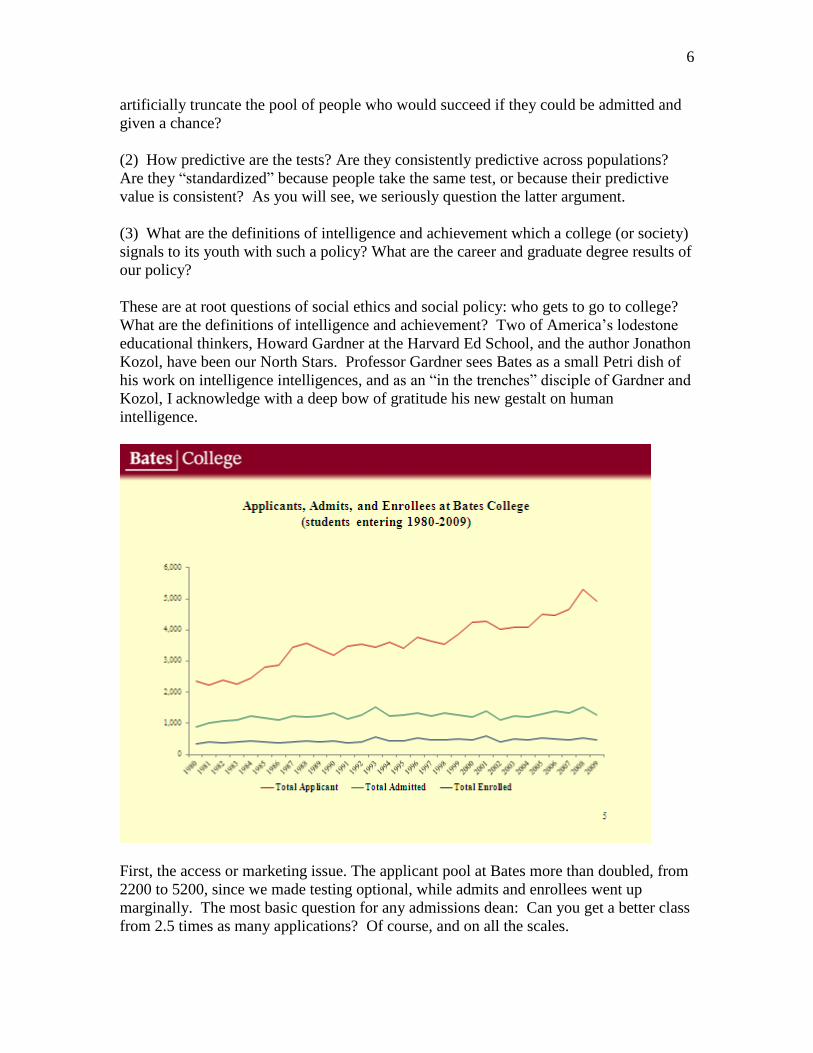
First, the access or marketing issue. The applicant pool at Bates more than doubled, from
2200 to 5200, since we made testing optional, while admits and enrollees went up
marginally. The most basic question for any admissions dean: Can you get a better class
from 2.5 times as many applications? Of course, and on all the scales.
7
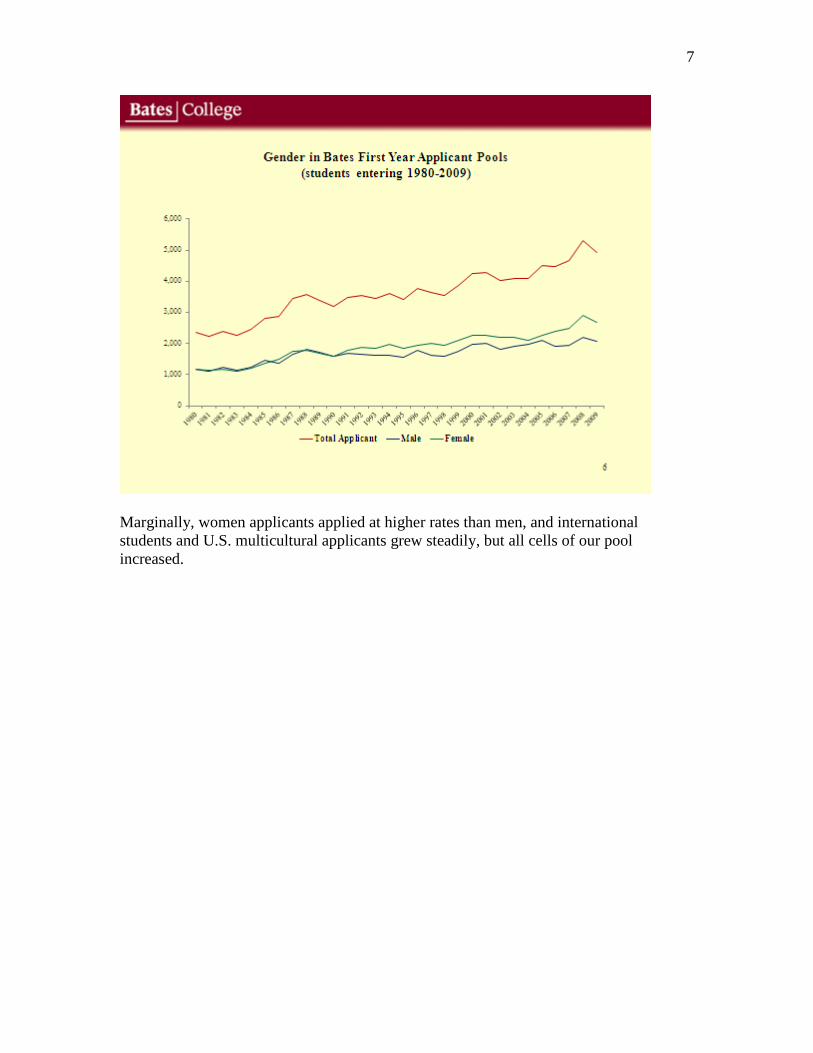
Marginally, women applicants applied at higher rates than men, and international
students and U.S. multicultural applicants grew steadily, but all cells of our pool
increased.
8
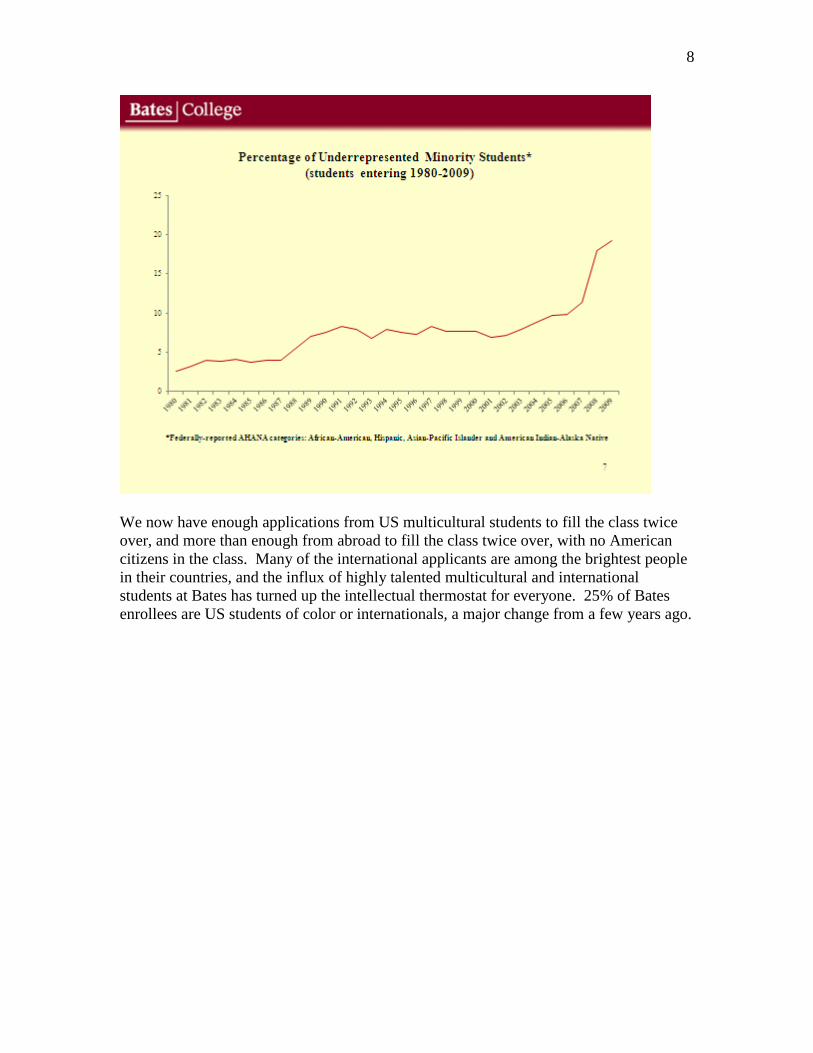
We now have enough applications from US multicultural students to fill the class twice
over, and more than enough from abroad to fill the class twice over, with no American
citizens in the class. Many of the international applicants are among the brightest people
in their countries, and the influx of highly talented multicultural and international
students at Bates has turned up the intellectual thermostat for everyone. 25% of Bates
enrollees are US students of color or internationals, a major change from a few years ago.
9
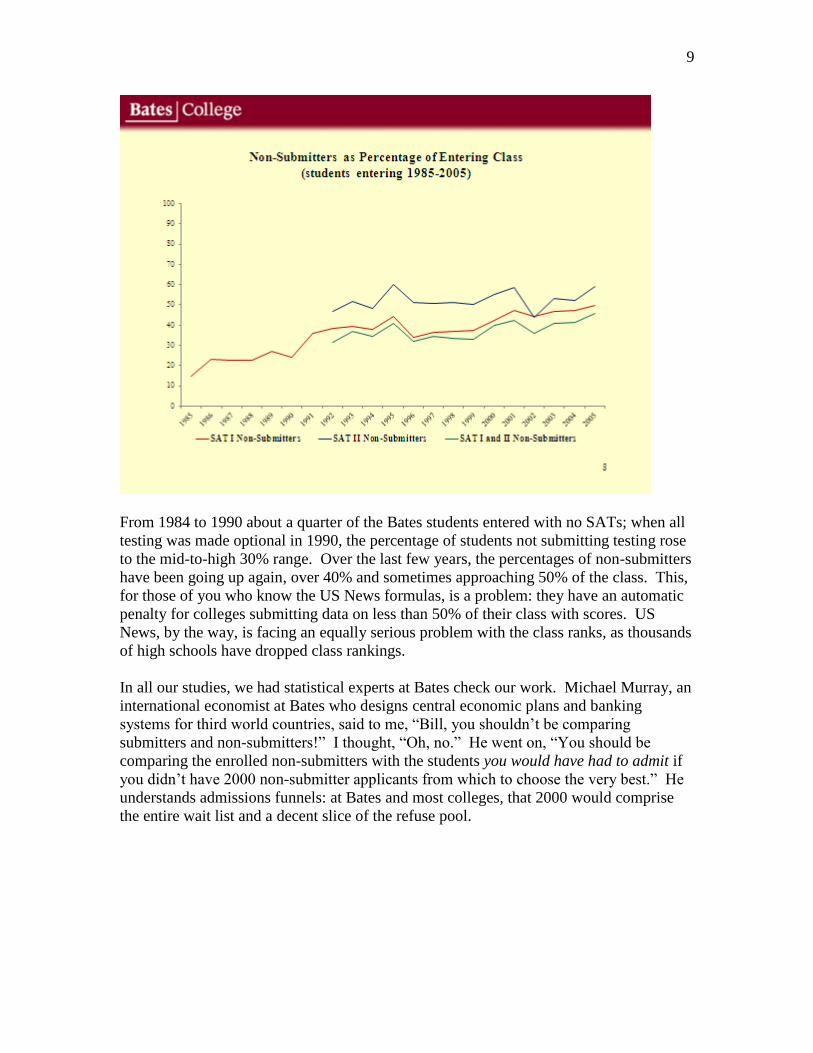
From 1984 to 1990 about a quarter of the Bates students entered with no SATs; when all
testing was made optional in 1990, the percentage of students not submitting testing rose
to the mid-to-high 30% range. Over the last few years, the percentages of non-submitters
have been going up again, over 40% and sometimes approaching 50% of the class. This,
for those of you who know the US News formulas, is a problem: they have an automatic
penalty for colleges submitting data on less than 50% of their class with scores. US
News, by the way, is facing an equally serious problem with the class ranks, as thousands
of high schools have dropped class rankings.
In all our studies, we had statistical experts at Bates check our work. Michael Murray, an
international economist at Bates who designs central economic plans and banking
systems for third world countries, said to me, “Bill, you shouldn’t be comparing
submitters and non-submitters!” I thought, “Oh, no.” He went on, “You should be
comparing the enrolled non-submitters with the students you would have had to admit if
you didn’t have 2000 non-submitter applicants from which to choose the very best.” He
understands admissions funnels: at Bates and most colleges, that 2000 would comprise
the entire wait list and a decent slice of the refuse pool.
10
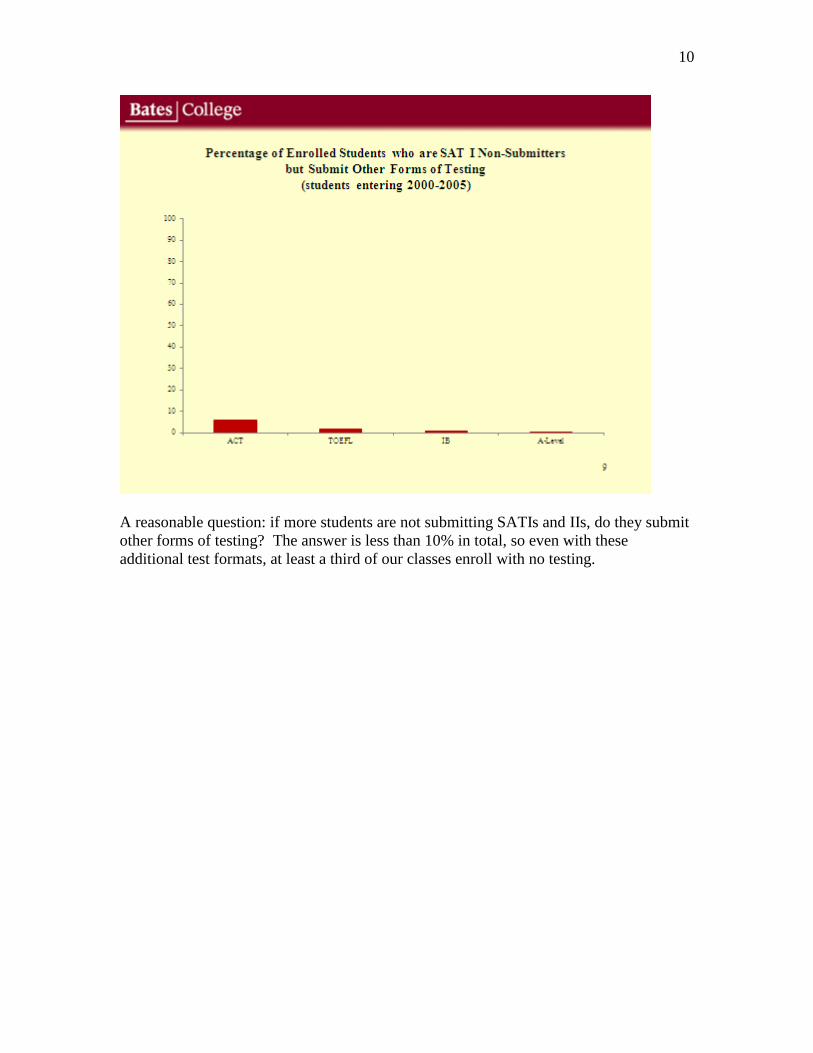
A reasonable question: if more students are not submitting SATIs and IIs, do they submit
other forms of testing? The answer is less than 10% in total, so even with these
additional test formats, at least a third of our classes enroll with no testing.
11
What do the submitters and non-submitters look like? These next few slides are a
snapshot of use of the policy by various populations of students.
12
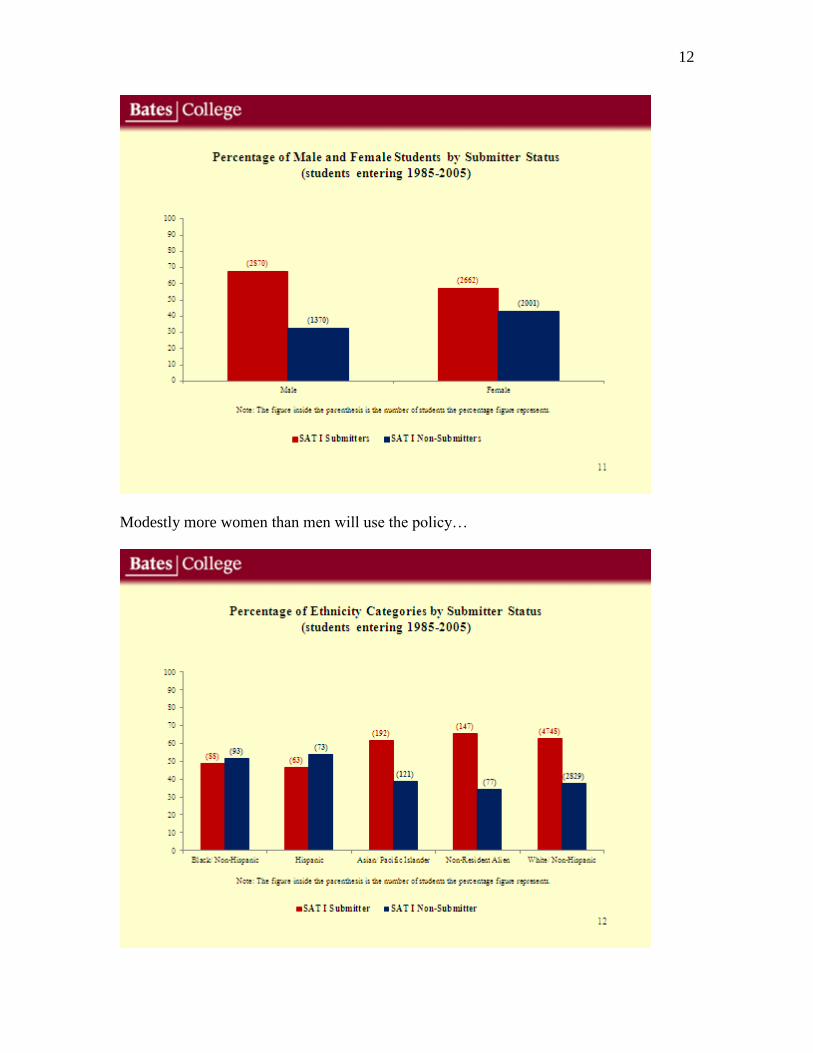
Modestly more women than men will use the policy…

13
…And use by non-whites is about 8% higher than for whites. Hispanic and Black
students will have a majority of enrollees using an optional testing policy, at a rate about
10%-15% higher than the class averages.
Something important should be pointed out here. Optional testing is often assumed to be
a device for an affirmative action policy, to open a narrow statistical review to a more
complex, subtle reading. As you will see, it works as a technique for affirmative action:
the students succeed and graduate. But note the arithmetic numbers at the top of the bar
charts: white students using the policy outnumber the students of color by five to one.
The policy appeals to all the subgroups which folk wisdom would tell you are the
students unlikely to be helped by testing: women, rural and blue collar students,
immigrants, LD students, students with spike talents in something (studio and performing
arts, athletics, debate, leadership), and dual-language students, no matter what their
ethnicity or citizenship.
We also noticed that the immigrant, multicultural and international students were often
getting the best jobs and graduate school placements. The two youngest Bates Trustees in
the history of the College are a Vietnamese immigrant debater from Texas who was
working for Warren Buffett by the time he was 24, and a half Russian-half Senegalese
woman who was the youngest person ever chosen to be a White House Fellow in the
history of the program. Our poster child for optional testing has been a Vietnamese
refugee camp immigrant. Only having spoken English for a few years, she was the
valedictorian of her high school class of 320, but had a 400 Verbal--we share that score
with her permission—and applied to Bates as a non-submitter. She graduated Magna,
PBK in Biology from Bates, founded a tutoring program for other immigrants, earned her
MD from Brown, and was appointed as an internist to the medical faculty at Dartmouth.
Since virtually all demographic growth in America reflects immigrants or people of
color, we should ask ourselves, How did you do on the SAT--when you took it in
Vietnamese? Or Spanish?
14
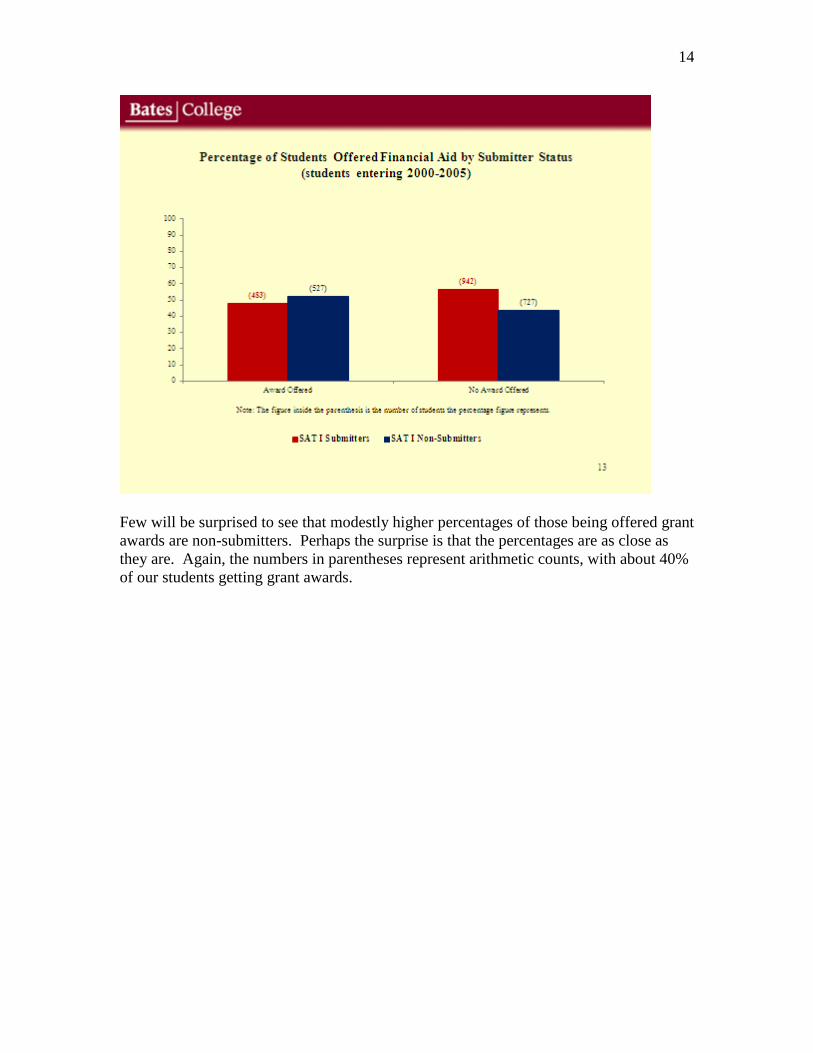
Few will be surprised to see that modestly higher percentages of those being offered grant
awards are non-submitters. Perhaps the surprise is that the percentages are as close as
they are. Again, the numbers in parentheses represent arithmetic counts, with about 40%
of our students getting grant awards.
15
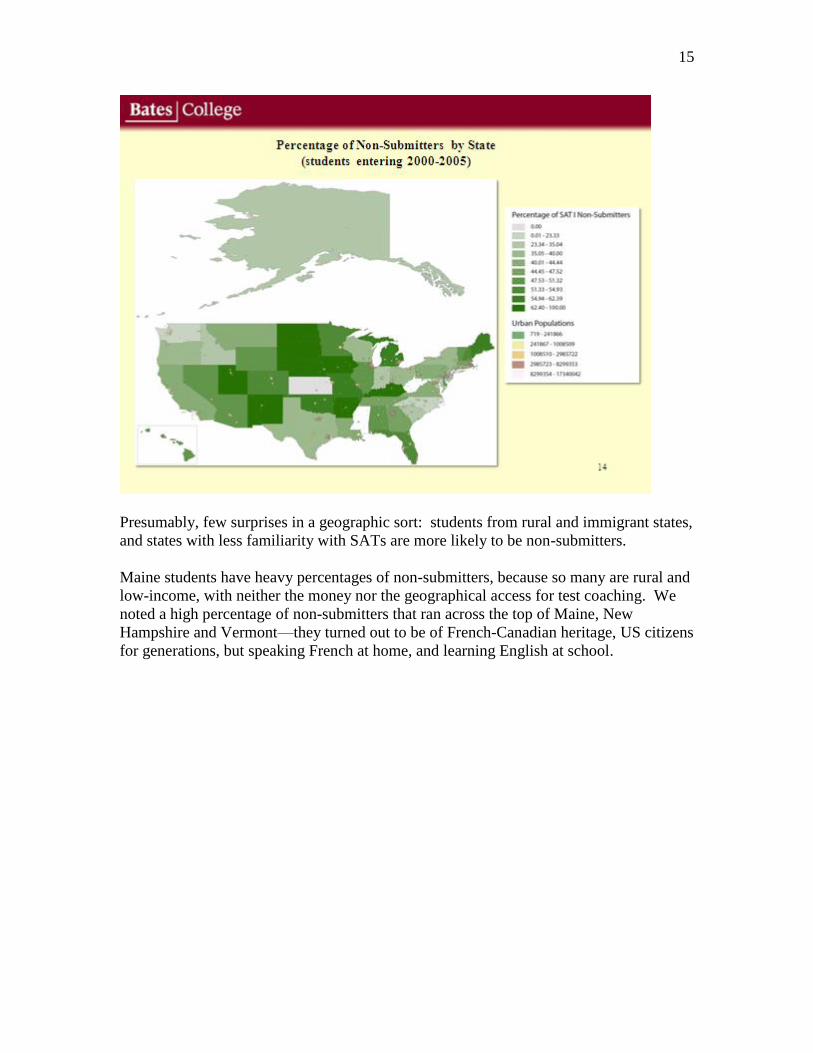
Presumably, few surprises in a geographic sort: students from rural and immigrant states,
and states with less familiarity with SATs are more likely to be non-submitters.
Maine students have heavy percentages of non-submitters, because so many are rural and
low-income, with neither the money nor the geographical access for test coaching. We
noted a high percentage of non-submitters that ran across the top of Maine, New
Hampshire and Vermont—they turned out to be of French-Canadian heritage, US citizens
for generations, but speaking French at home, and learning English at school.

16
Now we get to the second major point, the heart of this report: What are the productive
results of the policy? If you take nothing else away, these next two slides are the heart of
it.
17
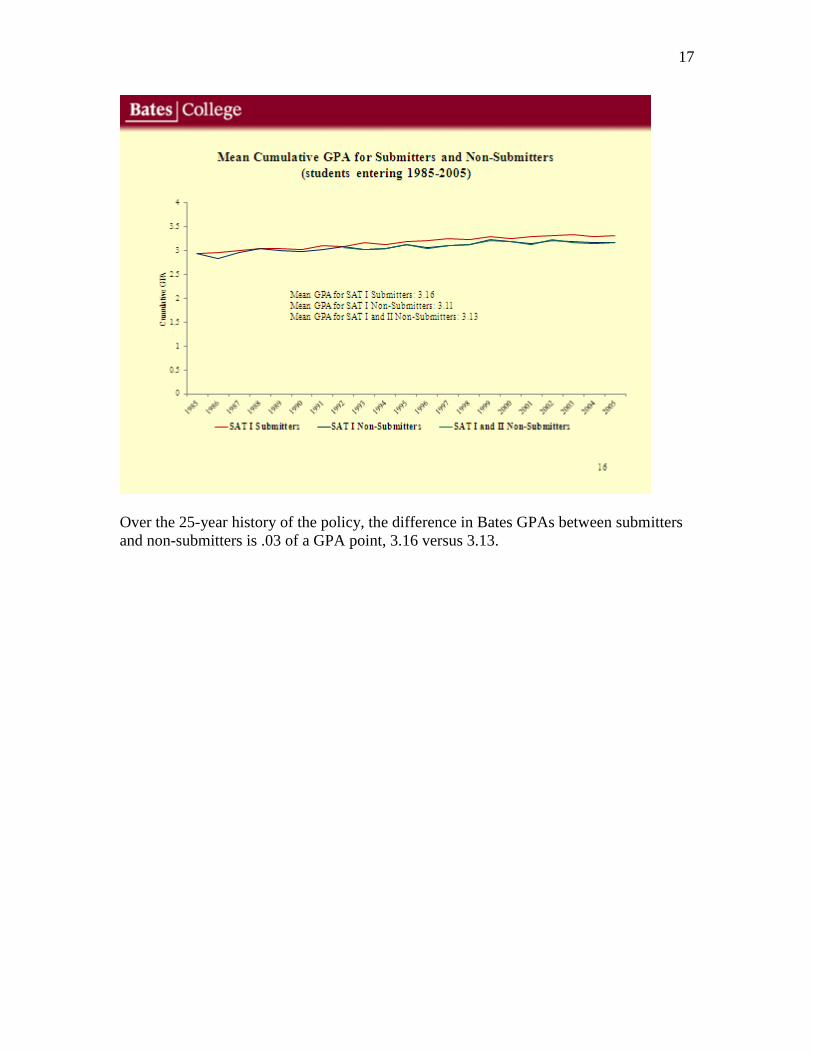
Over the 25-year history of the policy, the difference in Bates GPAs between submitters
and non-submitters is .03 of a GPA point, 3.16 versus 3.13.
18
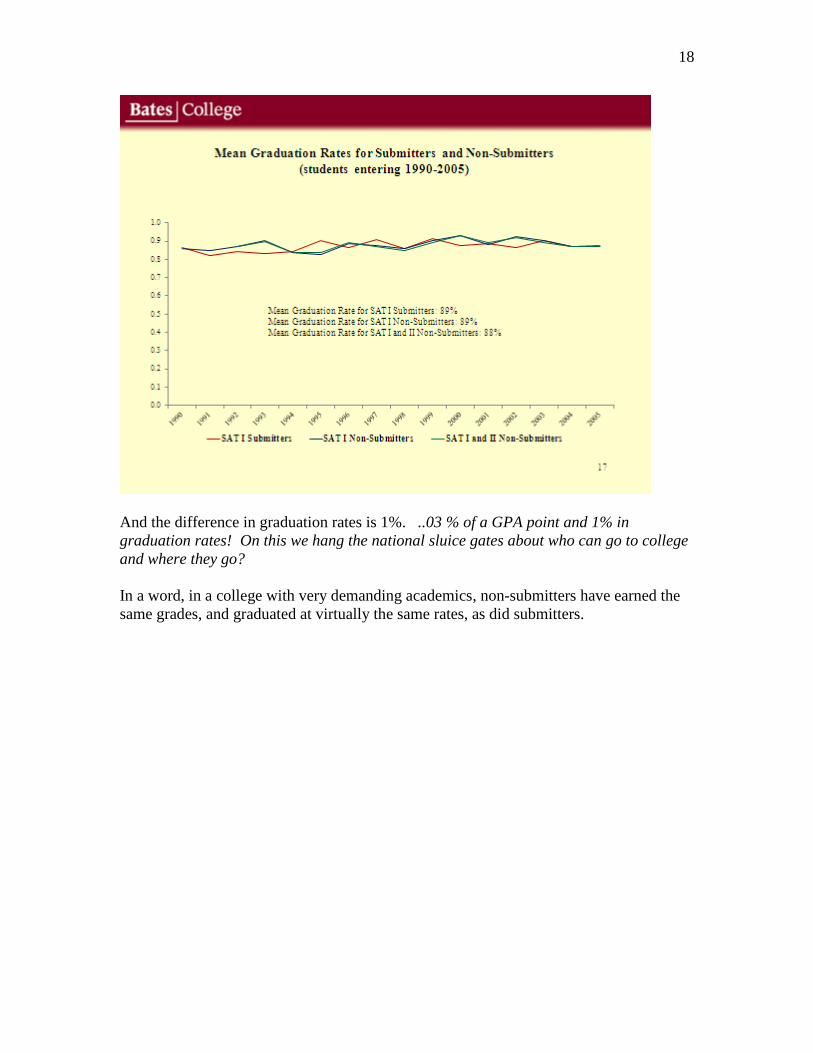
And the difference in graduation rates is 1%. ..03 % of a GPA point and 1% in
graduation rates! On this we hang the national sluice gates about who can go to college
and where they go?
In a word, in a college with very demanding academics, non-submitters have earned the
same grades, and graduated at virtually the same rates, as did submitters.
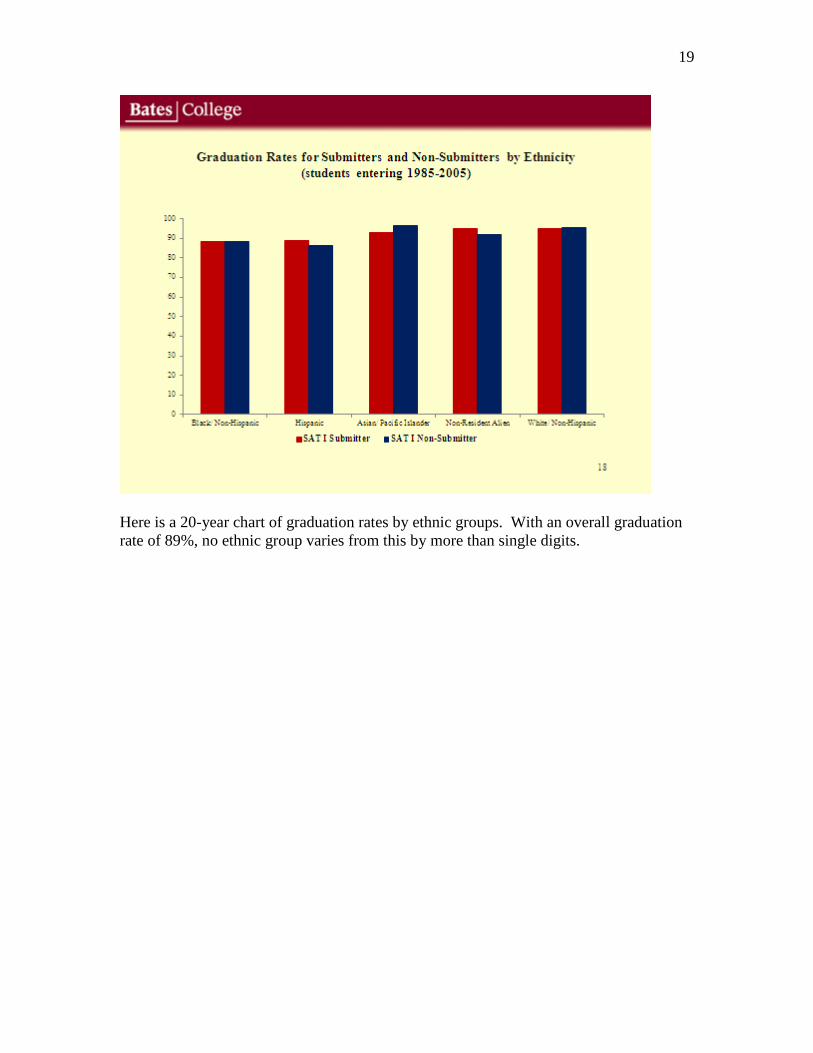
19
Here is a 20-year chart of graduation rates by ethnic groups. With an overall graduation
rate of 89%, no ethnic group varies from this by more than single digits.
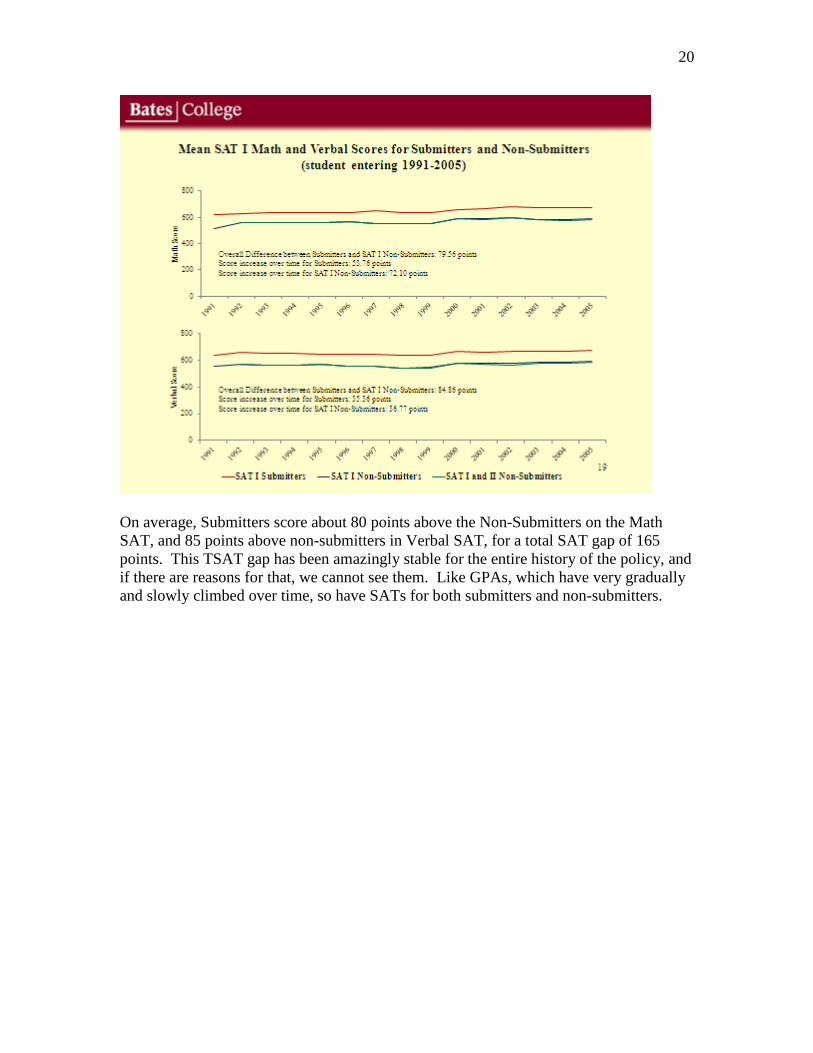
20
On average, Submitters score about 80 points above the Non-Submitters on the Math
SAT, and 85 points above non-submitters in Verbal SAT, for a total SAT gap of 165
points. This TSAT gap has been amazingly stable for the entire history of the policy, and
if there are reasons for that, we cannot see them. Like GPAs, which have very gradually
and slowly climbed over time, so have SATs for both submitters and non-submitters.
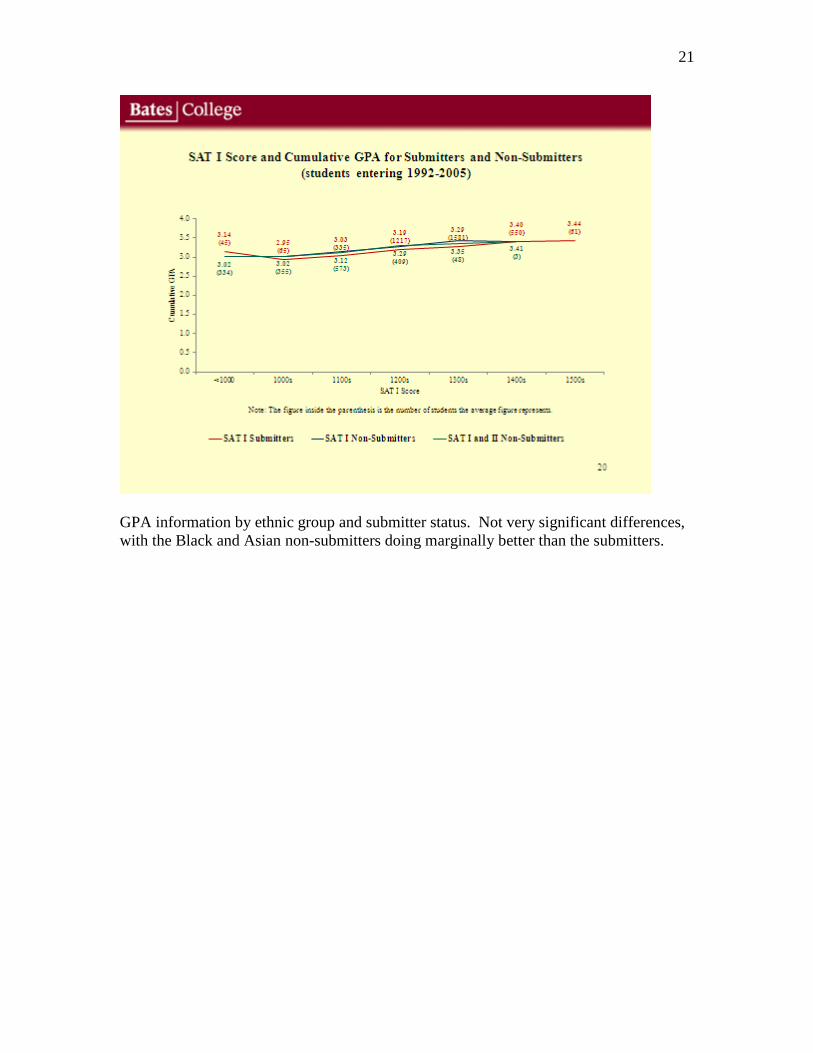
21
GPA information by ethnic group and submitter status. Not very significant differences,
with the Black and Asian non-submitters doing marginally better than the submitters.
22
Testing seems to have only very minor correlation with GPAs: non-submitters seem
marginally to outperform submitters with the same SAT scores, and for both groups, the
lines are virtually flat, because almost everyone is succeeding.
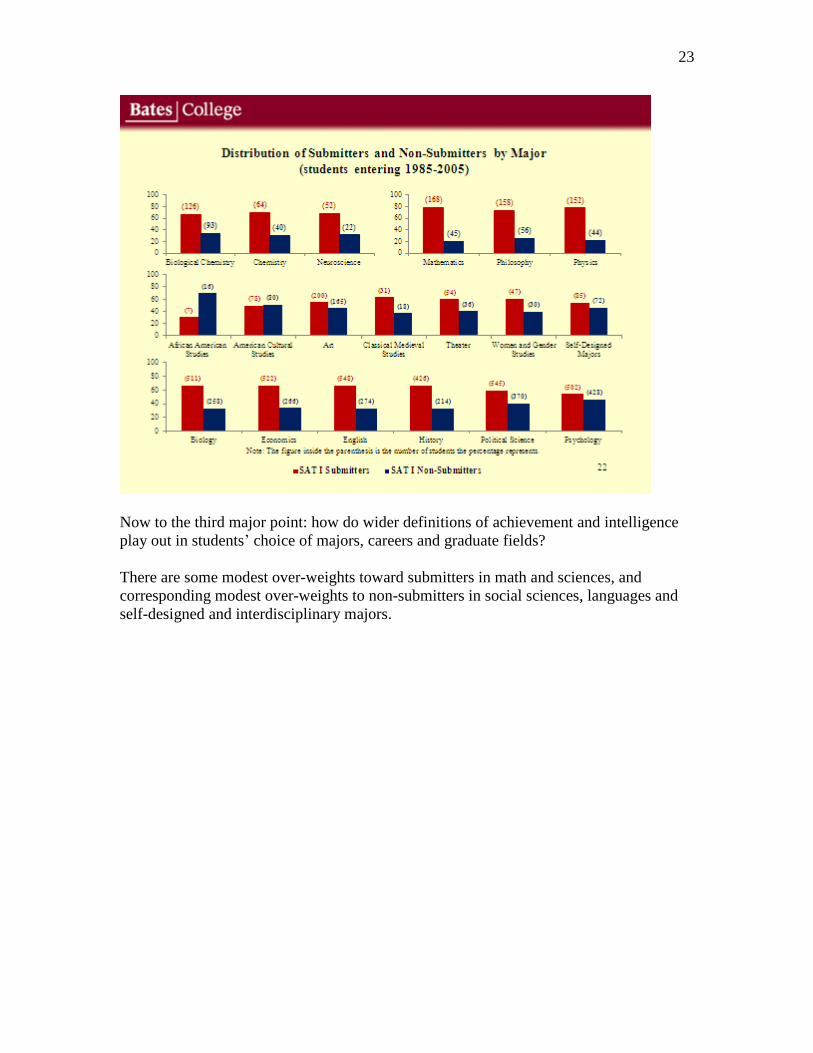
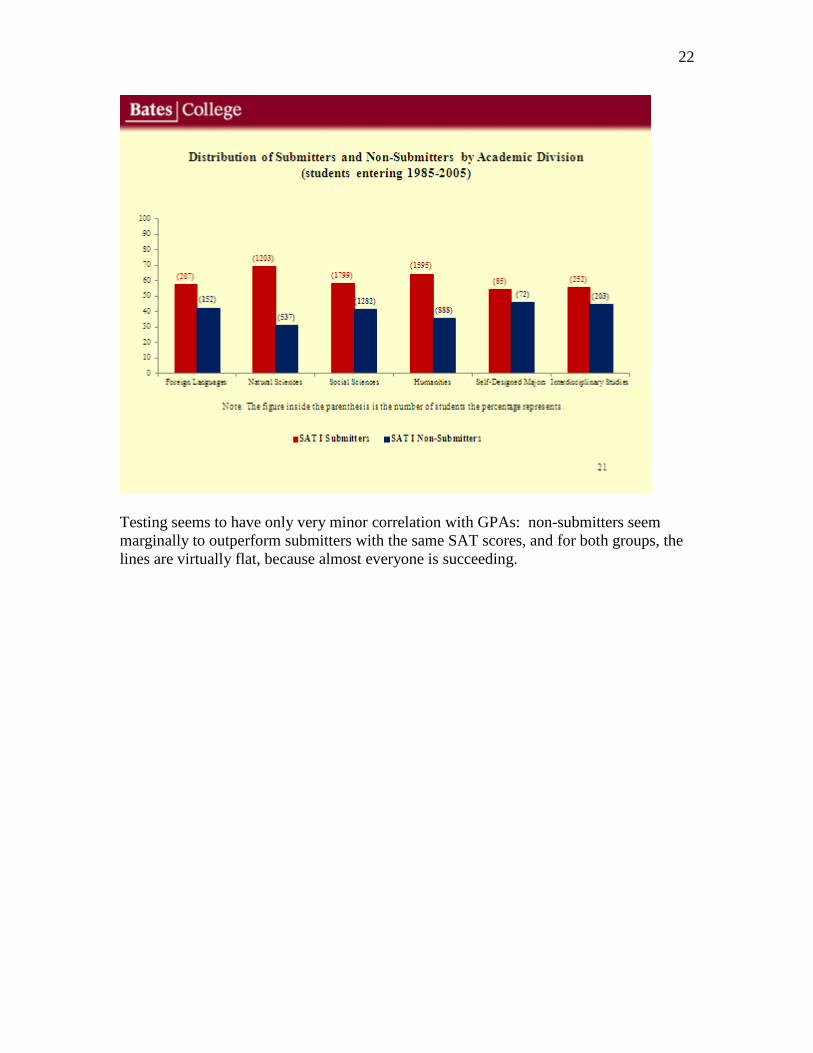
23
Now to the third major point: how do wider definitions of achievement and intelligence
play out in students’ choice of majors, careers and graduate fields?
There are some modest over-weights toward submitters in math and sciences, and
corresponding modest over-weights to non-submitters in social sciences, languages and
self-designed and interdisciplinary majors.
24
The patterns of distribution by majors are intriguing, and we have made four groupings of
majors in this slide. First, in three majors generally regarded as among the toughest at
Bates – chemistry, biological chemistry and neuroscience – the percentages of submitters
and non-submitters approximate the two-thirds, one-third ratio of classes as a whole.
Second, in only three of our 32 majors is there a clear imbalance toward submitters--
Math, Philosophy and Physics—but we found that there were no differences in GPA’s in
these majors. Third is a grouping of majors that folk wisdom would suggest are places
that might reward imagination, intuition, unconventional thinking, interest in other
cultures, and the like. In this group—African American Studies, American Cultural
Studies, Art, Classical and Medieval Studies, Theatre, Women and Gender Studies, and
Self-designed majors—there are patterns of non-submitters being equally or strongly
represented. In our largest majors—Biology, Economics, English, History, Political
Science and Psychology—there are only modest trends by submitters or non-submitters.
25
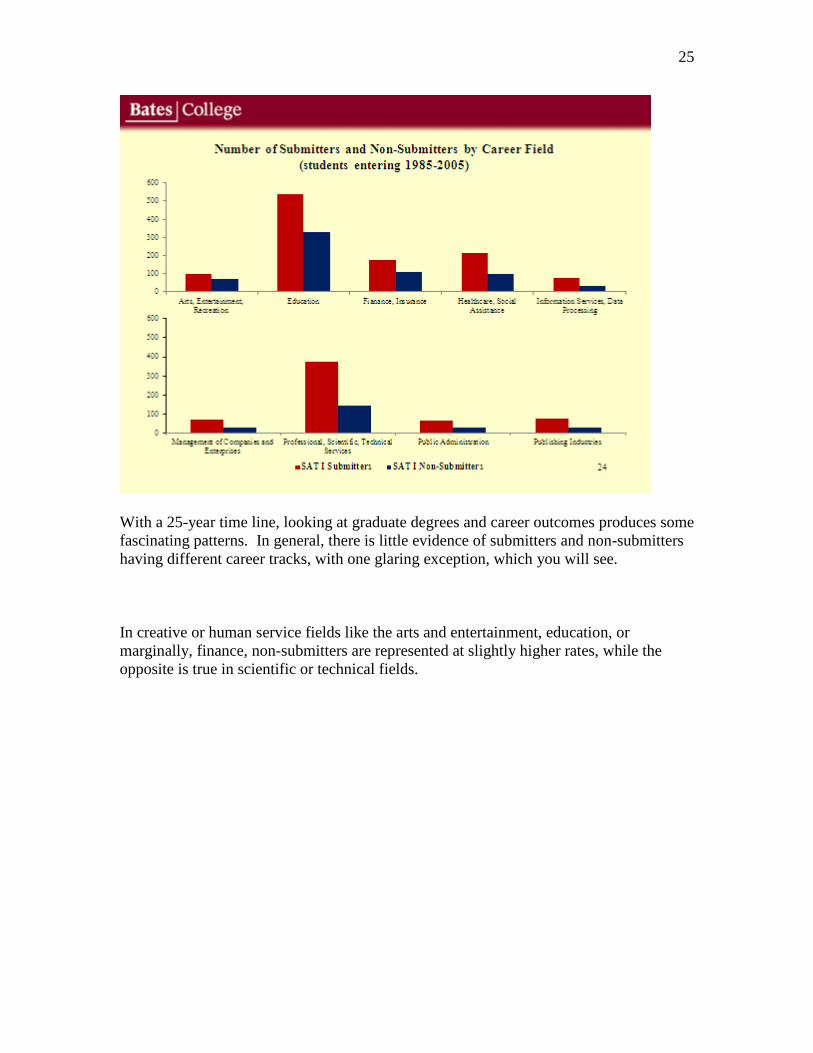
With a 25-year time line, looking at graduate degrees and career outcomes produces some
fascinating patterns. In general, there is little evidence of submitters and non-submitters
having different career tracks, with one glaring exception, which you will see.
In creative or human service fields like the arts and entertainment, education, or
marginally, finance, non-submitters are represented at slightly higher rates, while the
opposite is true in scientific or technical fields.
26
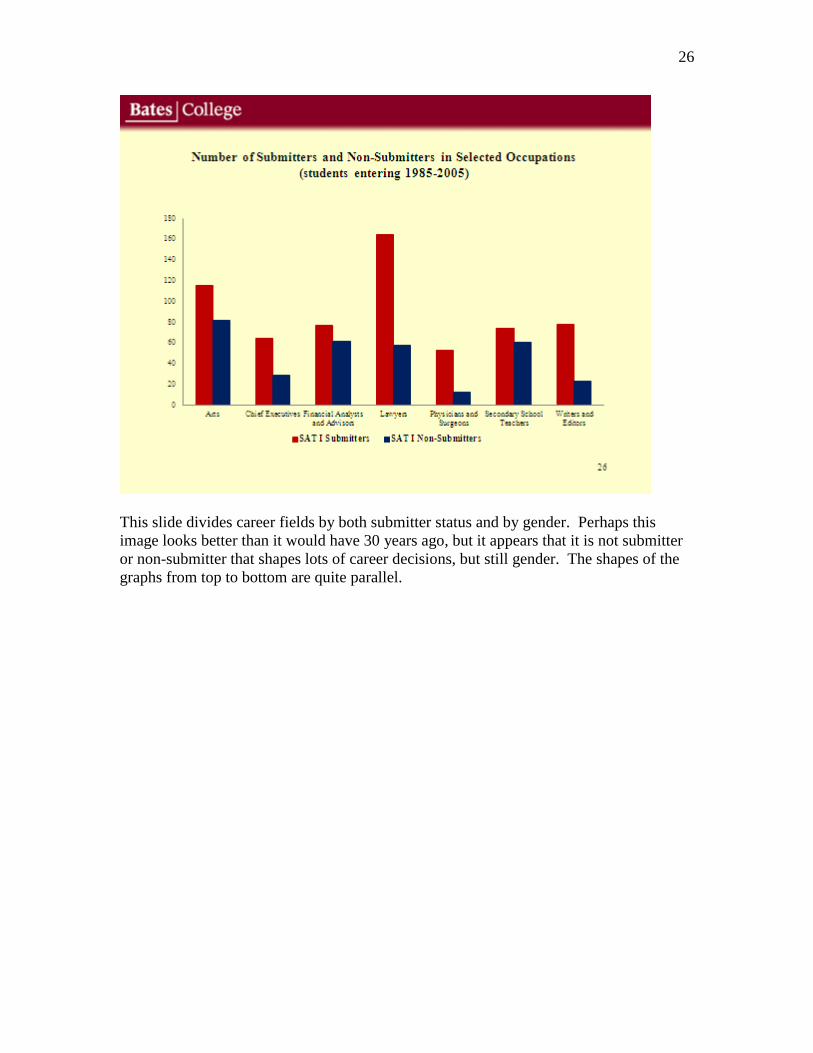
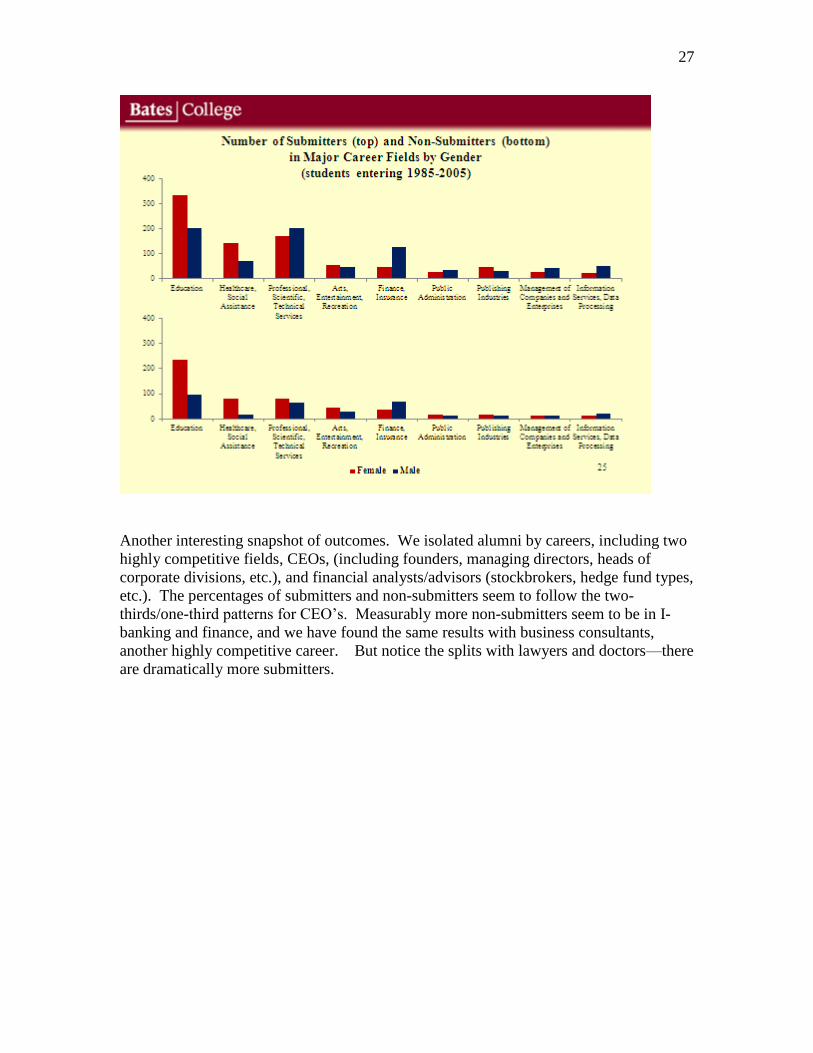
This slide divides career fields by both submitter status and by gender. Perhaps this
image looks better than it would have 30 years ago, but it appears that it is not submitter
or non-submitter that shapes lots of career decisions, but still gender. The shapes of the
graphs from top to bottom are quite parallel.
27
Another interesting snapshot of outcomes. We isolated alumni by careers, including two
highly competitive fields, CEOs, (including founders, managing directors, heads of
corporate divisions, etc.), and financial analysts/advisors (stockbrokers, hedge fund types,
etc.). The percentages of submitters and non-submitters seem to follow the two-
thirds/one-third patterns for CEO’s. Measurably more non-submitters seem to be in I-
banking and finance, and we have found the same results with business consultants,
another highly competitive career. But notice the splits with lawyers and doctors—there
are dramatically more submitters.
28
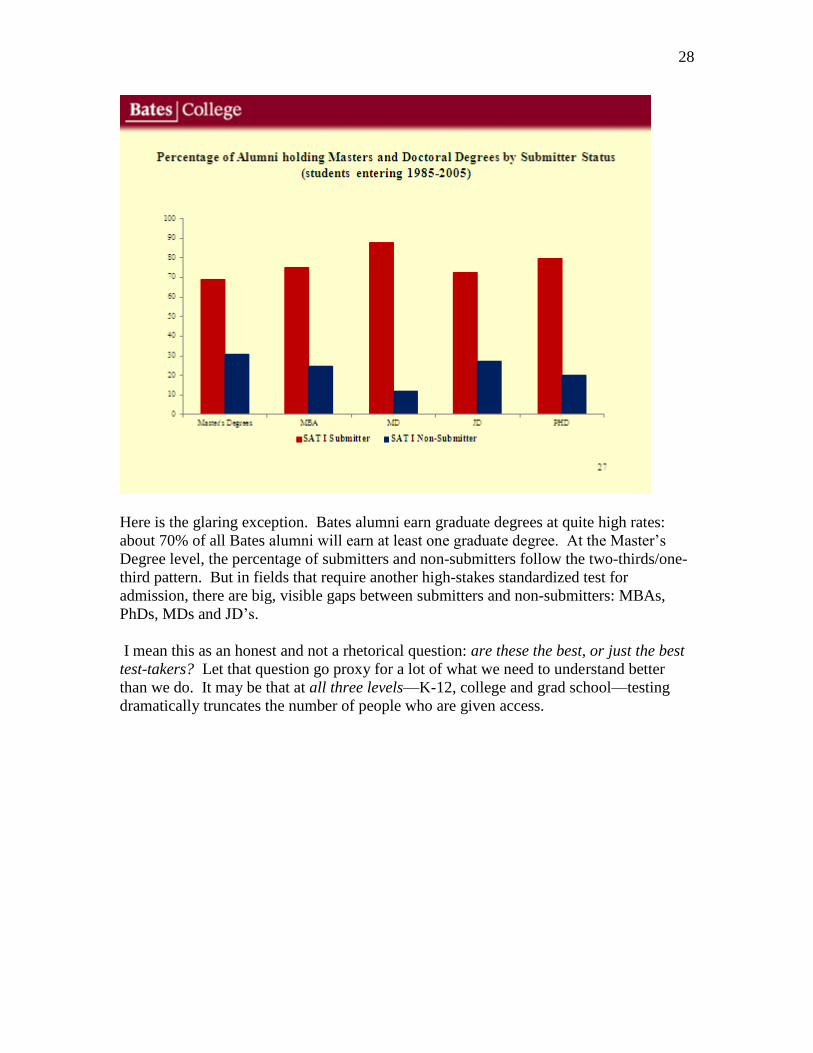
Here is the glaring exception. Bates alumni earn graduate degrees at quite high rates:
about 70% of all Bates alumni will earn at least one graduate degree. At the Master’s
Degree level, the percentage of submitters and non-submitters follow the two-thirds/one-
third pattern. But in fields that require another high-stakes standardized test for
admission, there are big, visible gaps between submitters and non-submitters: MBAs,
PhDs, MDs and JD’s.
I mean this as an honest and not a rhetorical question: are these the best, or just the best
test-takers? Let that question go proxy for a lot of what we need to understand better
than we do. It may be that at all three levels—K-12, college and grad school—testing
dramatically truncates the number of people who are given access.
29
Doing research to dig out information and performance on students at Bates with learning
differences was instructive. Just getting the data was a significant challenge, because it
was until quite recently treated as individual medical information, kept strictly
confidential, and not in electronic form.
30
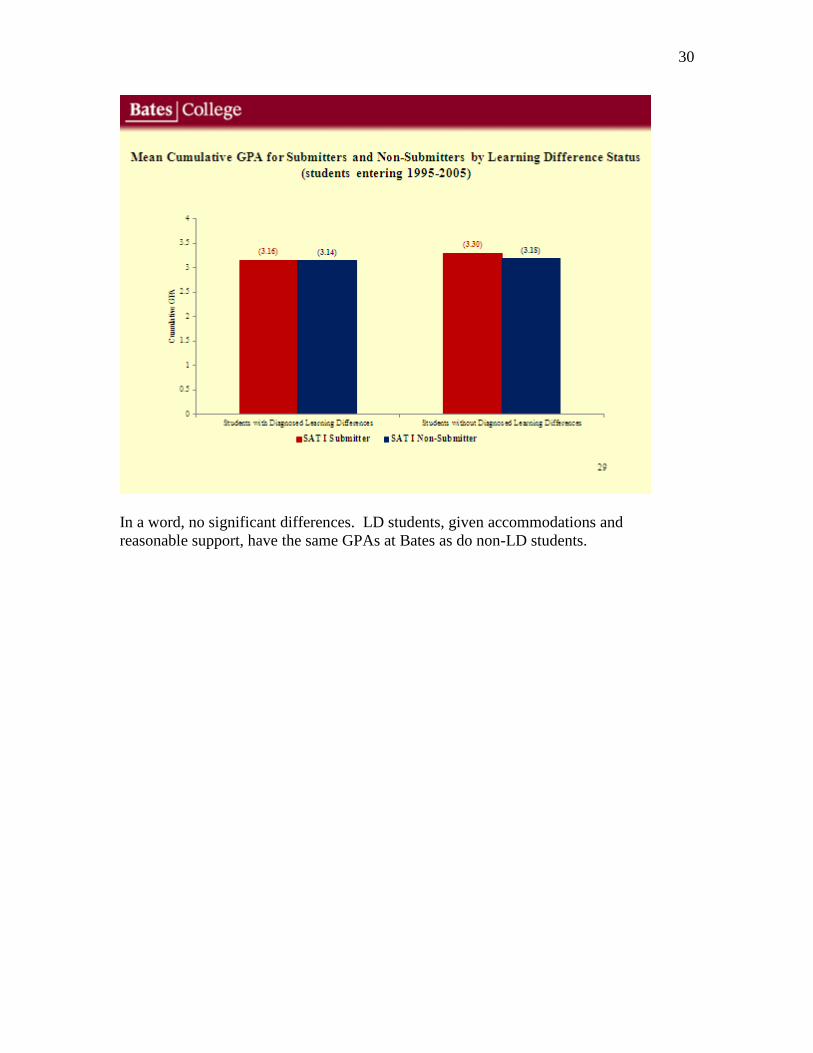
In a word, no significant differences. LD students, given accommodations and
reasonable support, have the same GPAs at Bates as do non-LD students.
31
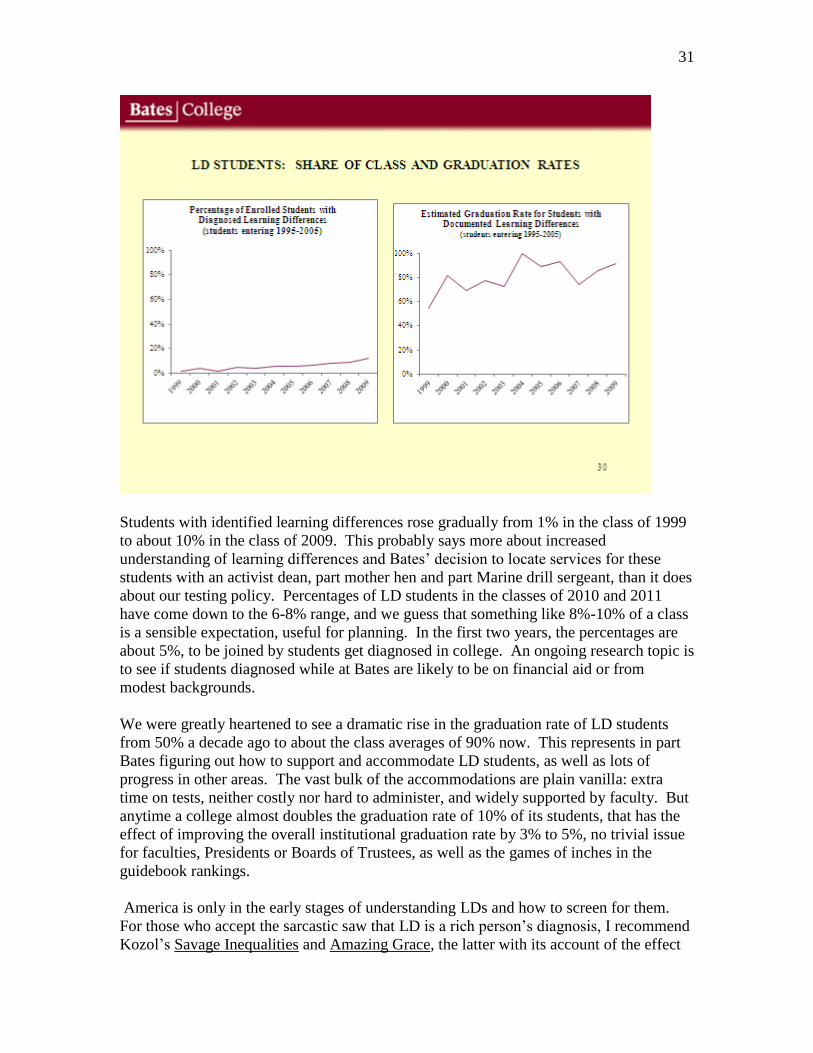
Students with identified learning differences rose gradually from 1% in the class of 1999
to about 10% in the class of 2009. This probably says more about increased
understanding of learning differences and Bates’ decision to locate services for these
students with an activist dean, part mother hen and part Marine drill sergeant, than it does
about our testing policy. Percentages of LD students in the classes of 2010 and 2011
have come down to the 6-8% range, and we guess that something like 8%-10% of a class
is a sensible expectation, useful for planning. In the first two years, the percentages are
about 5%, to be joined by students get diagnosed in college. An ongoing research topic is
to see if students diagnosed while at Bates are likely to be on financial aid or from
modest backgrounds.
We were greatly heartened to see a dramatic rise in the graduation rate of LD students
from 50% a decade ago to about the class averages of 90% now. This represents in part
Bates figuring out how to support and accommodate LD students, as well as lots of
progress in other areas. The vast bulk of the accommodations are plain vanilla: extra
time on tests, neither costly nor hard to administer, and widely supported by faculty. But
anytime a college almost doubles the graduation rate of 10% of its students, that has the
effect of improving the overall institutional graduation rate by 3% to 5%, no trivial issue
for faculties, Presidents or Boards of Trustees, as well as the games of inches in the
guidebook rankings.
America is only in the early stages of understanding LDs and how to screen for them.
For those who accept the sarcastic saw that LD is a rich person’s diagnosis, I recommend
Kozol’s Savage Inequalities and Amazing Grace, the latter with its account of the effect
32
of toxic municipal incinerators in the South Bronx on skyrocking LD and asthma rates in
those neighborhoods. I began my own teaching career in a junior high school in the
Morrisania section of the South Bronx, and a lot more about teaching in that school made
sense after I read Kozol’s book.
Our opening three policy questions were: Do the tests open or truncate access, how
predictive are they across populations, and what are the definitions of intelligence and
achievement that we signal with our policies?
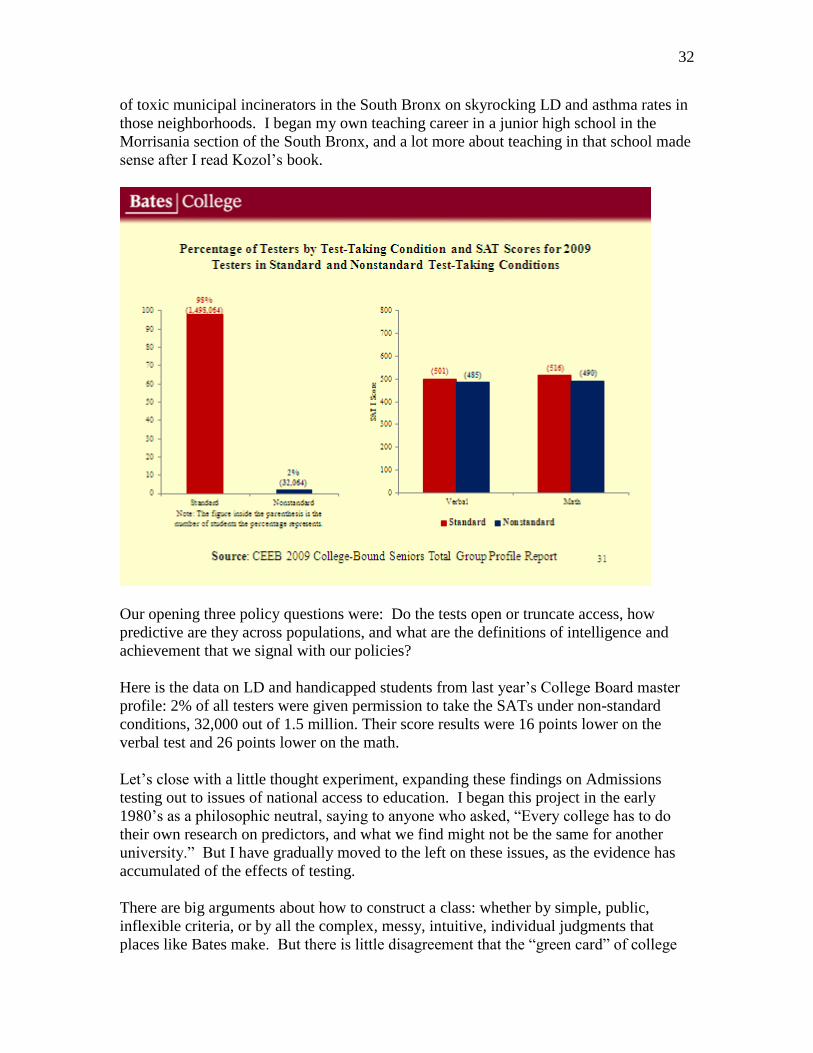
Here is the data on LD and handicapped students from last year’s College Board master
profile: 2% of all testers were given permission to take the SATs under non-standard
conditions, 32,000 out of 1.5 million. Their score results were 16 points lower on the
verbal test and 26 points lower on the math.
Let’s close with a little thought experiment, expanding these findings on Admissions
testing out to issues of national access to education. I began this project in the early
1980’s as a philosophic neutral, saying to anyone who asked, “Every college has to do
their own research on predictors, and what we find might not be the same for another
university.” But I have gradually moved to the left on these issues, as the evidence has
accumulated of the effects of testing.
There are big arguments about how to construct a class: whether by simple, public,
inflexible criteria, or by all the complex, messy, intuitive, individual judgments that
places like Bates make. But there is little disagreement that the “green card” of college

33
admission is the de facto ticket to economic survival in our society. How should a
society divvy up the chances for success? Is the purpose of admissions to maximize the
profile of scores and ranks, or maximize the average first-year GPA (or more
appropriately to focus on cumulative GPA and graduation rate), or to contribute to overall
social improvement to level some economic ground—or some mix of all three? This is
not a philosophic discussion. We all struggle with these issues, and don’t know if we
have it right. Our Presidents and Boards routinely tell us to be both Paul Tillich and Billy
Graham in selecting a class: “Yes, do it all!” they say.
What will societies do with people who are quite literally turned away from the door of
higher education, which has been our major national route to economic improvement?
Here in California we already see the answer: you incarcerate them. Along with other
states, California now spends more on incarceration than it does on higher education, and
at least from the recent Supreme Court decision, it has not worked.
The same questions Bates has asked about the SATs must be asked about No Child Left
Behind, which is largely driven by standardized testing results. Few of us know enough
about the particulars of the testing instruments being used in No Child Left Behind to
have an intelligent opinion on their reliability. Bates is one of a handful of colleges to
question the reliability of testing, and then carefully and publicly do the long-term
research. Are school systems evaluating the tests they are using? Do we know if we are
truncating our success rates by using testing, and if so, by how much and for whom?
Hazarding a guess, at the K-12 level we might find a result parallel to what Bates has
found, that human intelligence and ambition are far more complex and multi-faceted than
any standardized testing system can capture.
It is sometimes said that an optional testing policy will only work at a small college able
to read applicants individually and thoughtfully. With respect, we think this is nonsense.
Many research universities read folders just as carefully as small colleges. More
important, what are the public costs of not admitting students who would succeed, in
order to run a simple, inexpensive admissions process driven by class ranks and testing?
If Bates’ experience can be extrapolated, we may be throwing away as much as a third of
our national talent.
When Bates began this policy twenty-seven years ago, there were a few dozen colleges
on the Fairtest list not requiring or de-emphasizing testing. Now there are over 800
colleges and universities, including some major flagships. We badly need rigorous
research on their policies, done with a common protocol to see if Bates’ results will hold
up in a much wider study. Such a study would include, for example, some of the Texas
and the California State system campuses, some liberal arts schools like Bates, Smith or
Mt. Holyoke, perhaps a few interesting specialty art/music schools, and HBCU and MSI
institutions. I am happy to tell you that a few months ago, a foundation decided to give
me a grant for a major two-year national study to examine this question, and we plan to
study about thirty colleges and universities of various types with one form or another of
admissions access without required standardized tests. So my retirement has been
postponed, but perhaps with a sequel to this talk.
34
Thank you.