will biofuel mandates raise food prices? ujjayant chakravorty, marie-hélène hubert, michel moreaux...
TRANSCRIPT

Will Biofuel Mandates Raise Food Prices?
Ujjayant Chakravorty, Marie-Hélène Hubert, Michel Moreaux and Linda Nøstbakken
University of Alberta, University of Rennes and TSE
Berkeley Bioeconomy Conference, March 2011

US biofuel mandate

INTRODUCTION
• MANY STUDIES HAVE SHOWN THAT BIOFUEL MANDATES MAY LEAD TO A LARGE INCREASE IN FOOD PRICES
• 30-60% PRICE RISE PREDICTED
• WE DEVELOP A MODEL THAT HAS THE FOLLOWING FEATURES

• EXOGENOUS CHANGES IN INCOME DRIVE CHANGES IN THE DEMAND FOR VEGETABLES AND MEAT AND DAIRY PRODUCTS
• PER CAPITA MEAT AND DAIRY CONSUMPTION IN DEVELOPED COUNTRIES IS 4 TIMES THAT IN LDCS
• 3 KG CEREALS = 1 KG OF PORK• 5 KG CEREALS = 1 KG OF BEEF

Vegetable consumption in developing and
developed economies
Source: FAO 2003
Developing coun-tries
Industrial countries 220
230
240
250
260
270
280
290
246
264
278282
1965 1975 1985 1998
Kg/c
ap/y
ear

Meat and dairy consumption in developing
and developed economies
Source: FAO 2003
Developing coun-tries
Industrial countries0
50
100
150
200
250
300
350
38
248
71
300
1965 1975 1985 1998
Kg/c
ap/y
ear

• RICARDIAN LAND QUALITY (YIELDS AND PRODUCTION COSTS)
• CONVERSION COSTS OF MARGINAL LANDS
• RISING PRICE OF CRUDE OIL – A CONVEX COST FUNCTION FOR OIL

• US BIOFUEL MANDATE: 10 TO 36 BLN GALLONS BY 2022
• EU MANDATE: 2.5% TO 10% OF TRANSPORT FUELS

ELEMENTS OF THE MODEL
• WE HAVE 3 CONSUMPTION GOODS:
• MEAT AND DAIRY• VEGETABLES• TRANSPORT ENERGY
• DEMAND IS INDEPENDENT AND COBB-DOUGLAS

Table 1. Classification of regions by income (US$)
Regions Mean annual gross national income per
capita in (2000-2005) Major countries
US 42,040 - EU 36,000 - Other HICs 33,000 Canada, Japan MICs 936 - 11,455 China, India, Brazil, Indonesia, Malaysia LICs below 935 Mostly African countries
Source: World Bank (2010a)

• INCOME ELASTICITIES ARE PRODUCT AND REGION SPECIFIC
• THEY DECLINE WITH GDP/CAPITA IN LDCS
• BUT ARE CONSTANT IN RICH NATIONS

Table A3. Changes in income elasticities for food products conditional on per capita income Region Year Per capita
income (2005$/capita)
Vegetables Meat and dairy
US 2005 42,040 + 0.06 + 0.61 2050 57,767 + 0.05 + 0.59
EU 2005 36,000 + 0.09 + 0.51 2050 49,468 + 0.06 + 0.49
Other HICs 2005 34,000 + 0.07 + 0.57 2050 46,720 + 0.06 + 0.55
MICs 2005 7,050 + 0.30 + 0.90 2050 25,000 + 0.20 + 0.70
LICs 2005 1,500 + 0.40 + 1.20 2050 7,000 + 0.30 + 0.90
Source: Hertel et al. (2008b). Note: Income and price elasticities for vegetables and meat and dairy products vary with per capita income every model period of 5 years (Keyzer et al. 2005).

• REGIONAL PER CAPITA GDP AND POPULATION GROW EXOGENOUSLY (UN POPULATION DIVISION, NORDHAUS AND BOYER)

Distribution of land quality

Table 1. Land under Agriculture, Endowment of Marginal Lands and Yields by Land Class and Region
Land class US EU Other HICs
MICs LICs World
Land already under Agriculture (million ha)
1 100 100 25 300 150 675
2 40 30 20 250 250 590
3 30 20 20 240 40 350
Land available for farming (incl. marginal lands) (million ha)
1 0 0 0 0 0 0
2 0 0 0 300 300 600
3 0 0 0 500 500 1000
Initial crop yields (tons/ha)
1 4.0 4.0 4.0 3.5 2.5
2 2.5 2.0 2.2 2.0 1.5
3 1.7 1.7 1.7 1.0 0.7
Assumed annual growth in yields (% change)
1 0.9 0.9 0.9 1.2 1.1
2 0.7 0.7 0.7 1.0 0.8
3 0.6 0.6 0.6 0.8 0.7
Source: Land availability (Eswaran et al. 2003); marginal lands (FAO 2008a); agricultural yields (FAOSTAT); average annual growth rates adapted from Rosegrant et al. (2001).
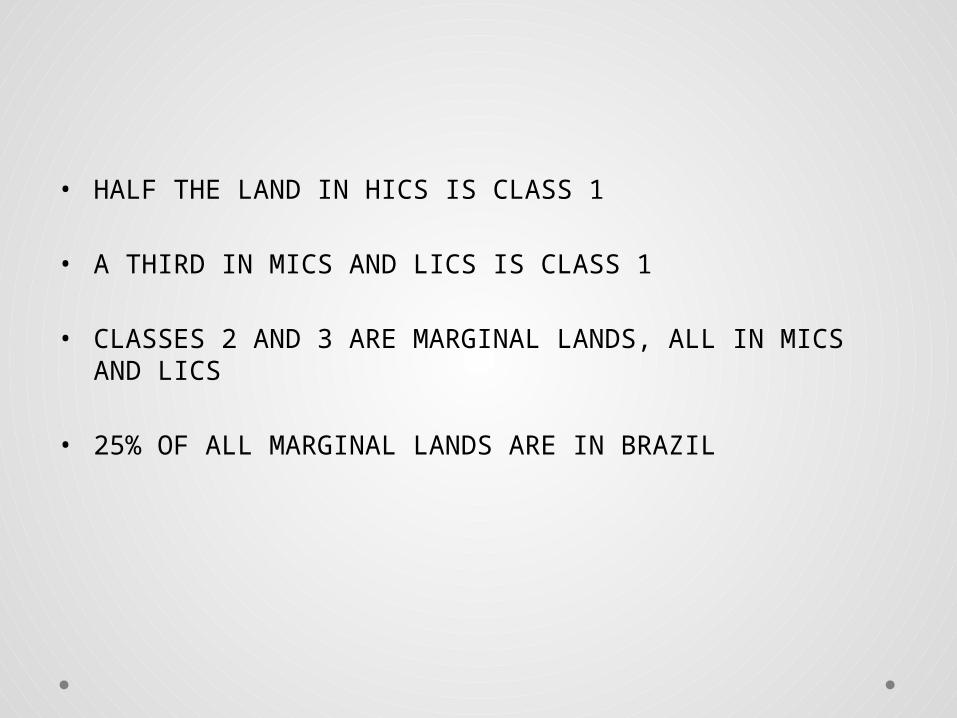
• HALF THE LAND IN HICS IS CLASS 1
• A THIRD IN MICS AND LICS IS CLASS 1
• CLASSES 2 AND 3 ARE MARGINAL LANDS, ALL IN MICS AND LICS
• 25% OF ALL MARGINAL LANDS ARE IN BRAZIL

• CONVERSION COSTS OF MARGINAL LANDS IS RISING AND CONVEX (SOHNGEN AND MENDELSOHN)
• FOOD PRODUCTION IS CRTS FOR EACH LAND CLASS
• ALL REGIONS EXHIBIT INCREASES IN AG PRODUCTIVITY AT DIFFERENTIAL RATES
• PRODUCTION COSTS ARE CONVEX AS CULTIVATION EXPANDS INTO LOWER QUALITY LANDS

• TRANSPORT FUEL IS PRODUCED FROM GASOLINE AND BIOFUELS BY MEANS OF A CES FUNCTION
• THE ELASTICITY OF SUBSTITUTION IS HIGHER IN HICS
• BATHTUB WORLD OIL MARKET

• REPRESENTATIVE BIOFUEL FOR EACH REGION:
• US: CORN ETHANOL• EU: RAPESEED BIODIESEL• BRAZIL/MICS: SUGARCANE ETHANOL• LICS: CASSAVA
• PRODUCTION COSTS DECLINE OVER TIME

Table 1. Characteristics of first generation biofuels
US EU Other HICs
MICs LICs4
Representative crop Crop type Corn Rapeseed3 Corn Sugar-cane Cassava
Proportion1 94% 75% 96% 84% 99% Energy yield per land class2
(gallons/hectare)
Land class 1 800 400 800 1,700 600 Land class 2 500 300 500 1,500 400 Land class 3 200 200 200 1,200 300
Cost of production ($/gallon) Processing 0.75 0.37 0.80 0.57 0.60
Energy 0.56 0.37 0.60 0.00 0.70 Value of by-products -0.30 -0.19 -0.30 0.00 0.00
Total 1.01 0.55 1.10 0.57 1.30
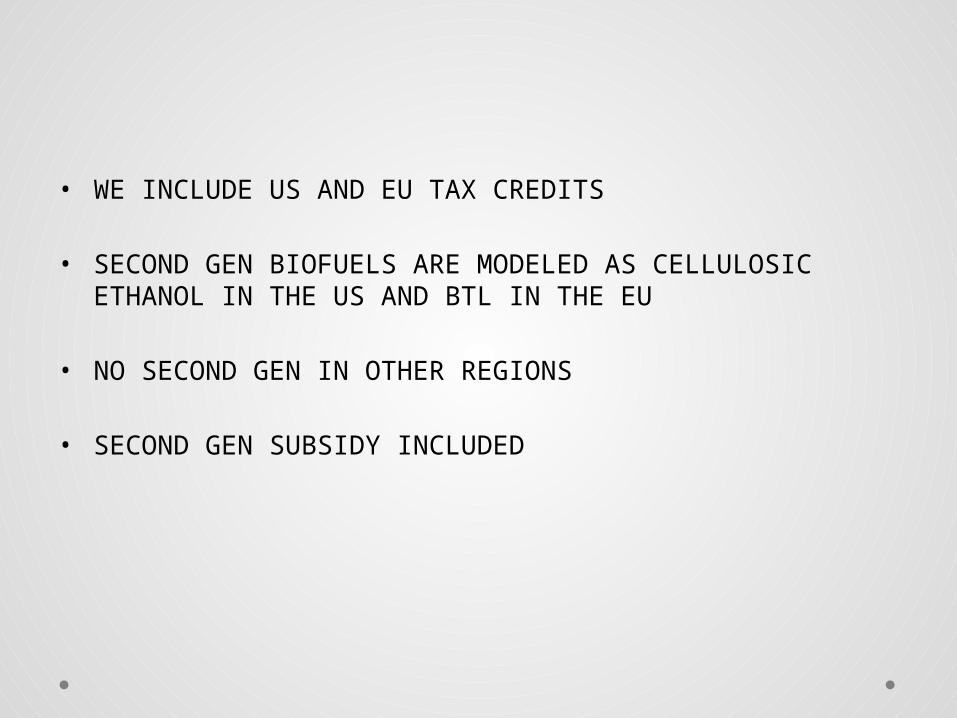
• WE INCLUDE US AND EU TAX CREDITS
• SECOND GEN BIOFUELS ARE MODELED AS CELLULOSIC ETHANOL IN THE US AND BTL IN THE EU
• NO SECOND GEN IN OTHER REGIONS
• SECOND GEN SUBSIDY INCLUDED

• THE MAXIMIZATION PROBLEM IS

Table 1. Food, biofuel and gasoline prices BASE FLEX USREG
Weighted world food price
($/ton)
2005 600 780 (30%) 726 (21%) 2025 864 1,133 (31%) 911 (5%) 2050 605 643 (6%) 639 (6%)
World biofuel price ($/gallon)
2005 2.2 2.2 (0%) 2.2 (0%) 2025 3.1 3.6 (16%) 3.3 (5%) 2050 1.7 1.8 (6%) 1.7 (0%)
World gasoline price
($/gallon)
2005 1.9 1.9 (0%) 1.9 (-1%)
2025 2.9 2.9 (-1%) 2.9 (-1%) 2050 1.9 1.9 (-1%) 1.9 (-1%)
Notes: Weighted food price is the average of vegetable and meat prices weighted by the share of each commodity in total food consumption. The numbers in brackets represent the percentage change of food prices under the mandates compared to the BASE model. Gasoline prices are reported wholesale, without taxes.

World weighted food prices

Biofuel production (billion gallons)
US EU MICS BASE USREG BASE USREG BASE USREG
Total biofuel production
2005 8.5 8.5 3.6 3.6 7.7 7.7 2025 13.7 35.1 3.0 7.5 12.3 11.4 2050 28.6 35.1 19.3 19.2 37.1 34.6
First gen biofuel production
2005 8.5 8.5 3.6 3.6 7.7 7.7 2025 7.2 14.1 3.0 3.6 12.3 11.4 2050 13.1 14.1 3.8 3.7 37.1 34.6
Second gen biofuel production
2005 0 0 0 0 0 0 2025 6.5 21.0 0 3.9 0 0 2050 15.5 21.0 15.5 15.5 0 0
Notes: Our numbers are calibrated to observed data. From 2005 to 2009, US average biofuel production was 8.3 billion gallons, 3.3 billion for the EU and 7.5 for MICs (FAPRI 2010). Second gen fuel supply was negligible.
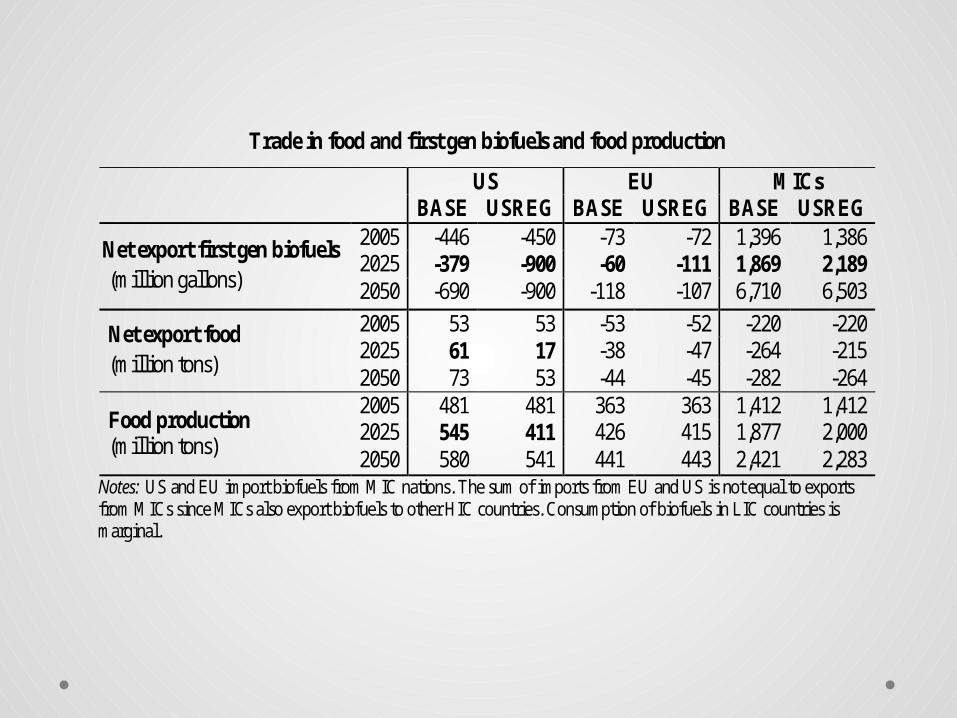
Trade in food and first gen biofuels and food production
US EU MICs
BASE USREG BASE USREG BASE USREG
N Net export first gen biofuels (million gallons)
2005 -446 -450 -73 -72 1,396 1,386 2025 -379 -900 -60 -111 1,869 2,189 2050 -690 -900 -118 -107 6,710 6,503
Net export food (million tons)
2005 53 53 -53 -52 -220 -220 2025 61 17 -38 -47 -264 -215 2050 73 53 -44 -45 -282 -264
Food production (million tons)
2005 481 481 363 363 1,412 1,412 2025 545 411 426 415 1,877 2,000 2050 580 541 441 443 2,421 2,283
Notes: US and EU import biofuels from MIC nations. The sum of imports from EU and US is not equal to exports from MICs since MICs also export biofuels to other HIC countries. Consumption of biofuels in LIC countries is marginal.

Land allocation to food and energy production (in million ha) US EU MICs BASE USREG BASE USREG BASE USREG
Land under food production
2005 166
166
137
137
786
786 2025 151
110
132
127
933
958
2050 108
108
98
101
943
898 Land under
biofuel production
2005 12
12
6
6
7
7 2025 27
68
11
16
10
9
2050 70
70
45
42
21
20 Total
cultivated land
2005 178 178 143 143 793 793 2025 178 178 143 143 943 967 2050 178 178 143 143 964 918
Notes: Land allocation in Other HICs and LICs are similar across the different scenarios.

Effects of US second generation mandates on biofuel and food production (in year 2025)
First gen biofuel
production
Second gen biofuel
production
Net export biofuel
Food production
billion gallons million gallons million tons
US USREG 14.1 21.0 -900 411 FLEX 23.4 11.4 -1,232 444
MICs USREG 11.4 0 2,189 2,029 FLEX 11.9 0 2,501 2,000
Notes: We only report the regions impacted most by second gen biofuel regulation. The numbers do not change significantly for the EU.

(a) First Gen biofuel use in US(b) Second Gen biofuel use in US

Welfare impacts of US and EU mandates: Change in total surplus relative to baseline

Implicit biofuel subsidies in the US and EU ($/gallon)

SENSITIVITY ANALYSIS
• WE PERFORM SENSITIVITY WITH RESPECT TO
• 20% LOWER OIL RESERVES (INCREASE IN PRICE OF OIL)• 50% HIGHER COST OF LAND CONVERSION• NO TARIFFS FOR BIOFUELS• 15% LOWER COST OF SECOND GEN FUELS (IEA• 15% HIGHER YIELDS FROM BIOTECHNOLOGY• CHINA AND INDIA IMPOSE EU-LIKE MANDATES• CONSTANT CRUDE OIL PRICES• NO PREFERENCE FOR MEAT AND DAIRY PRODUCTS

CONCLUDING REMARKS
• SIGNIFICANT LAND CONVERSION
• FOOD PRICES ARE QUITE ROBUST TO MANDATES INCLUDING IN CHINA AND INDIA
• (ALTHOUGH MAY AFFECT POORER CONSUMERS AND FOOD SECURITY)
• ABUNDANT OIL IMPLIES LOWER IMPACTS ON FOOD PRICES AND LARGER DIRECT EMISSIONS
• SCARCE OIL IMPLIES LARGER INDIRECT EMISSIONS

LIMITATIONS OF THE STUDY
• STRATEGIC IMPACTS
• BETTER MODELING OF FOOD CONSUMPTION CHOICES
• FOOD SECURITY