wildlife trust of south & west wales...wildlife trust of south & west wales skomer island...
TRANSCRIPT

WILDLIFE TRUST OF SOUTH & WEST WALES
SKOMER ISLAND NATIONAL NATURE RESERVE
ANNUAL REPORT
2016
B. Büche, E. Stubbings, L. Newman

Contents 1 Summary ................................................................................................................................................... 1
1.1 Weather .............................................................................................................................................. 2
2 Monitoring and Recording .......................................................................................................................... 4
2.1 Birds.................................................................................................................................................... 4
Feature 1: Seabirds ............................................................................................................................... 4
Feature 2: Manx Shearwater ................................................................................................................. 4
Feature 3: Storm Petrel ......................................................................................................................... 6
Feature 4: Lesser Black-backed Gull ..................................................................................................... 6
Feature 5: Black-legged Kittiwake ......................................................................................................... 7
Feature 6: Puffin .................................................................................................................................... 8
Feature 7: Guillemot ............................................................................................................................ 10
Feature 8: Razorbill ............................................................................................................................. 11
Feature 9: Fulmar ................................................................................................................................ 12
Feature 11: Shag ................................................................................................................................. 13
Feature 12: Herring Gull ...................................................................................................................... 14
Feature 13: Great Black-backed Gull ................................................................................................... 15
Feature 14: Short-eared Owl ............................................................................................................... 16
Feature 15: Chough ............................................................................................................................. 16
Feature 16: Peregrine .......................................................................................................................... 16
Feature 17: Bird assemblage not qualifying ......................................................................................... 17
Feature 18: Little Owl .......................................................................................................................... 18
Feature 19: Canada Goose ................................................................................................................. 18
2.2 Mammals .......................................................................................................................................... 19
Feature 20 Skomer Vole ...................................................................................................................... 19
Feature 21 Grey Seal .......................................................................................................................... 19
Cetaceans ........................................................................................................................................... 20
Rabbits ................................................................................................................................................ 22
2.3 Invertenrates ..................................................................................................................................... 23
Feature 24: Lepidoptera ...................................................................................................................... 23
2.4. Lichens ............................................................................................................................................ 23
Feature 25:Lichen assemblage............................................................................................................ 23
2.5 Vegetation ......................................................................................................................................... 24
Feature 27:Vegetation ......................................................................................................................... 24
3 Research ................................................................................................................................................. 26
4 Visitors .................................................................................................................................................... 28
4.1 Day Visitors ....................................................................................................................................... 28
Day boat cancelations ......................................................................................................................... 29
4.2 Educational visits .............................................................................................................................. 29
4.4 Overnight Guests .............................................................................................................................. 30
4.5 Human Impact ................................................................................................................................... 32
Visitors ................................................................................................................................................ 32
Seaborne disturbance ......................................................................................................................... 32

Pollution .............................................................................................................................................. 32
5 Staff and Volunteers ................................................................................................................................ 33
5.1 Island staff......................................................................................................................................... 33
5.2 Lockley Lodge ................................................................................................................................... 33
5.3 Volunteers ......................................................................................................................................... 33
Weekly vols ......................................................................................................................................... 33
Work parties ........................................................................................................................................ 33
LTV’s ................................................................................................................................................... 33
6 Media, Interpretation and Events ............................................................................................................. 34
6.1 Media/Filming on Skomer .................................................................................................................. 34
6.2 Marketing, Publicity and Social Media ............................................................................................... 35
6.3 Interpretation ..................................................................................................................................... 36
6.4 Events ............................................................................................................................................... 36
West Coast Birdwatching events ......................................................................................................... 36
Photography Workshops with Andy Davies ......................................................................................... 36
Wednesday activities in August ........................................................................................................... 36
Skomer’s Hidden Secrets .................................................................................................................... 36
Shearwater Week ................................................................................................................................ 36
Pembrokeshire Coast National Park walks .......................................................................................... 36
7 Reserve Management ............................................................................................................................. 37
7.1 Management Plan ............................................................................................................................. 37
7.2 Species and Habitat Management .................................................................................................... 37
8 External groups and liaison...................................................................................................................... 38
ICAC.................................................................................................................................................... 38
Friends of Skokholm and Skomer ........................................................................................................ 38
Marine Conservation Zone MCZ .......................................................................................................... 38
Natural Resources Wales (NRW) ........................................................................................................ 38
Dale Sailing ......................................................................................................................................... 38
Others ................................................................................................................................................. 38
9 Acknowledgements ................................................................................................................................. 39

Table of tables
Table 1 Survival rates of adult Manx Shearwaters .................................................................................. 4 Table 2 Lesser Black-backed Gull population 2012-2016 ....................................................................... 6 Table 3 Survival rates of adult Lesser Black-backed Gulls ...................................................................... 7 Table 4 Kittiwake population in 2012-2016 ............................................................................................. 7 Table 5 Survival rates of adult Kittiwakes ................................................................................................ 8 Table 6 Puffin population 2012-2016 ...................................................................................................... 8 Table 7 Survival rates of adult Puffins ..................................................................................................... 9 Table 8 Puffin productivity ....................................................................................................................... 9 Table 9 Guillemot productivity ............................................................................................................... 10 Table 10 Razorbill population 2012-2016 ................................................................................................ 11 Table 11 Survival rates of adult Razorbills .............................................................................................. 11 Table 12 Razorbill productivity ................................................................................................................ 12 Table 13 Fulmar population .................................................................................................................... 12 Table 14 Fulmar productivity ................................................................................................................... 12 Table 15 Cormorant population .............................................................................................................. 13 Table 16 Shag population ....................................................................................................................... 13 Table 17 Herring Gull population ............................................................................................................ 14 Table 18 Survival rates of adult Herring Gulls ......................................................................................... 14 Table 19 Herring Gull productivity ........................................................................................................... 15 Table 20 Great Black-backed Gull population ......................................................................................... 15 Table 21 Great Black-backed Gull productivity ....................................................................................... 15 Table 22 Chough population ................................................................................................................... 16 Table 23 Provisional estimates of the UK and IoM peregrine population (numbers of breeding pairs) 2014 …………………………………………………………………………………………………………….17 Table 24 Canada Goose counts ............................................................................................................. 18 Table 25 Rabbit Numbers ....................................................................................................................... 24 Table 26 Number of no boat days over the previous four years. This does not include Mondays............ 29
Table of Figures Figure 1 Map of Skomer .......................................................................................................................... 3 Figure 2 Average haul-out of Grey Seals at Garland Stone .................................................................... 19 Figure 3 Average number of Common Dolphin sightings per week ........................................................ 21 Figure 4 Average number of Harbour Porpoise sightings per week ........................................................ 21 Figure 5 Mean number of Rabbits per hectare ....................................................................................... 24 Figure 6 Total number of visitors including hostel guests, day visitors and private landers over a 10 year period. ................................................................................................................................................. 28 Figure 7 Total number of day visitors in August and September over the past 10 years. ....................... 28 Figure 8 Educational visits in the past five years. ................................................................................... 29 Figure 9 Number of beds sold per year. ................................................................................................. 30 Figure 10 Percentage occupancy of the rooms in the hostel in August and September ......................... 30 Figure 11 Percentage of guests who rated each category good or excellent in 2016. ............................ 31 Figure 12 Media pieces on Skomer in 2016, broken down into categories. ........................................... 35

1
1 Summary All staff (except our Field Worker) moved out to the island on 28/2/16. On arrival to the island an assessment of the buildings was made and unfortunately a hole in the hostel roof was found. The flashing on the solar hot water panel had been ripped off buy the wind and water had seeped into the top floor of the hostel. The entire top floor was flooded and mouldy, the doors and floor boards warped. Furthermore there was a hole in the Ass. Warden/VO roof but little damage in the rooms below. On 9/3/17 Skomer experienced gale force winds and one corner of the North Haven roof blew off. 2016 was a good year for Fulmars and Puffins but not so good for the remainder of species. Guillemots were not counted (whole-island) in 2016, however the standard population plot counts were done and all other species were counted (whole-island). A total of 165 bird species were recorded in 2016 including one new addition to the island list (Gull-billed Tern). Record numbers of Yellow-browed Warblers and Pallas’s Warblers were observed in autumn. There were 16,103 day visitors and 1,189 overnight guests bringing the grand total to 17,292 visitors in 2016. It was a record breaking year with combined visitor numbers surpassing 17,000 for the first time.

2
1.1 WEATHER Yet another stormy winter with back to back storms – Storms Gertrude, Henry, Imogen, Jake and Kate all arriving in the new-year between January and March. The rest of spring saw more unsettled weather (although not as severe) which continued into June. The next spell of rough weather was towards the end of August by which time most birds had fledged. March – Strong winds on the 2nd and 9th and plenty of rain at the start of the month, turning more settled towards the end of the second week, becoming changeable again during the last week. Mean temperatures and rain fall around the seasonal average. April – The month again began with strong winds and rain, turning more settled with some warm and sunny spells. Wintery showers then fell on the 28th and 29th. Temperatures and rain fall again average for the time of year. May – May started wet and windy with westerly winds, and there was another unsettled interlude between the 17th and 22nd. Otherwise it was a generally warm month with frequent easterly winds, and plenty of dry sunny weather, but also some thundery downpours. June – The month started warm and dry but became unsettled, often with low pressure dominating, from the 10th. Winds were between north-west and north between the 15th and 18th. Mean temperatures
provisionally 1.3C above the long term average, but the positive anomaly was much larger by night than by day. Rain fall was almost double the long term average. July – The month began breezy and showery with westerly winds dominant, turning warm and sunny between the 17th and 23rd (being particularly hot on the 19th), then becoming unsettled again during the last week. August – Began wet with low pressure in charge with particularly strong south westerlies and rain on the 19th and 20th (force 6 and 8 respectively). There were some more significant settled spells during the second half of the month. September – September began unsettled, turning warmer and more settled in the second week before returning to more unsettled weather during the second half of the month. October – Almost completely dominated by easterly winds and settled sunny weather.

3
Figure 1 Map of Skomer

4
2 Monitoring and Recording
2.1 BIRDS
Feature 1: Seabirds
RH0/01 Record human disturbance on the island Human disturbance was recorded daily during bird log.
RH00/01 Record human disturbance from the sea Human disturbance from the sea was recorded daily during bird log.
RH00/02 Record all oil pollution incidents No oil pollution was recorded in 2016.
RA 10/09 Record any significant seabird burrow collapse No significant seabird burrow collapse was recorded in 2016.However due to the Yorkshire Fog die-back the island was extremely fragile. Great care was taken not to collapse burrows, however the Manx Shearwater researchers in North Haven had to reroof many of their study burrows after they collapsed.
Feature 2: Manx Shearwater
RA/11/01 Monitor Manx Shearwater total population Lower limit: not set. Census to be carried out every ten years. Next census scheduled for 2018.
RA 11/02 Monitor Manx Shearwater breeding population in study plots Lower limit: Any measurable decrease in the population detected in study plots. Attribute was within limits in 2016. For details see JNCC Seabird Monitoring on Skomer Island in 2016, section 5.1.
RA 11/03 Monitor survival rates of breeding Manx Shearwater Lower limit: 3 in any 5 consecutive years with a survival rate less than 86%. Attribute within limit, see table below. For more details see JNCC Seabird Monitoring on Skomer Island in 2016, section 5.3.
From To Estimated survival of Manx Shearwaters
2010 2011 0.870
2011 2012 0.869
2012 2013 0.892
2013 2014 0.872
2014 2015 0.724
2015 2016
Table 1 Survival rates of adult Manx Shearwaters
RA 11/04 Monitor Manx Shearwater productivity Lower limit: 0.5 chicks per breeding pair.

5
Attribute was within limits in 2016. Breeding success in 2016 was 0.63, for details see JNCC Seabird Monitoring on Skomer Island in 2016\\wwt-svr-01\profiles2\l.wilberforce\Desktop\Skomer Annual report 2016\JNCC Seabird Monitoring on Skomer Island in 2016.docx, section 5.2.

6
RH00/03 Record disturbance to rafting Manx Shearwaters No disturbance to rafting Manx Shearwaters was observed. However it is very difficult to judge whether rafting Manx Shearwaters get disturbed by for example tankers. Long-term Volunteer Cerren Richards did her personal project on distribution of Manx Shearwater rafts, see Influence of wind direction on the rafting Manx Shearwaters.
Feature 3: Storm Petrel
RA 10/09 Record predation of seabirds by owls Nest sites were surveyed and pellets collected. Storm Petrel remains were found around nest site, owl pellet analysis is pending. In 2016 we conducted a whole island Storm Petrel survey which estimated a total 220 (195-252) AOS on Skomer Island. For more details see NRW storm petrel census Skokholm Skomer SPA.pdf.
Feature 4: Lesser Black-backed Gull
RA 11/05 Monitor LBBGU total population Lower limit: 3 in any 5 consecutive years with less than 20,200 pairs. Attribute not within limit, see table below.
Year Lesser Black-backed Gull population
2012 8643
2013 8132
2014 8432
2015 7630
2016 6936
Table 2 Lesser Black-backed Gull population 2012-2016
For more details see JNCC Seabird Monitoring on Skomer Island in 2016, section 8.2.
RA 11/06 Monitor LBBGU relationship with national trends See JNCC Seabird Monitoring on Skomer Island in 2016, section 8.2

7
RA 11/07 Monitor LBBGU annual survival rate Lower limit: a mean of at least 84% over the preceding 10 year period Attribute within limits. The mean adult survival rate over the preceding 10 year period was 0.87 (see table below). For more details see JNCC Seabird Monitoring on Skomer Island in 2016, section 8.4.
From To Estimated survival of Lesser Black-backed Gulls
2005 2006 0.870
2006 2007 0.902
2007 2008 0.881
2008 2009 0.920
2009 2010 0.828
2010 2011 0.844
2011 2012 0.835
2012 2013 0.901
2013 2014 0.920
2014 2015 0.824
2015 2016
Table 3 Survival rates of adult Lesser Black-backed Gulls
RA 11/08 Monitor LBBGU productivity Provisional lower limit: 3 in any 5 consecutive years with fewer than 0.6 chicks per breeding pair. Attribute not within limit: In 2016 productivity was 0.36 chicks per breeding pair, for more details see JNCC Seabird Monitoring on Skomer Island in 2016, section 8.3.
Feature 5: Black-legged Kittiwake
RA 10/01 Record the impact of severe storms on Kittiwakes No major storm events were recorded in 2016.
RA 11/09 Monitor Kittiwake island population and distribution of colonies Lower limit: 3 in any 5 consecutive years with less than 2,000 individuals. There should be no loss of any established colony. (A colony will be considered established when it has contained breeding birds for three years or more). Attribute not within limit, see table below, however there was no loss of established colony.
Year Kittiwake population
2012 1594
2013 1045
2014 1488
2015 1546
2016 1477
Table 4 Kittiwake population in 2012-2016
For more details see JNCC Seabird Monitoring on Skomer Island in 2016, section 11.1.
RA 11/10 Monitor Kittiwake relationship with national trends See JNCC Seabird Monitoring on Skomer Island in 2016, section 11.1.
8
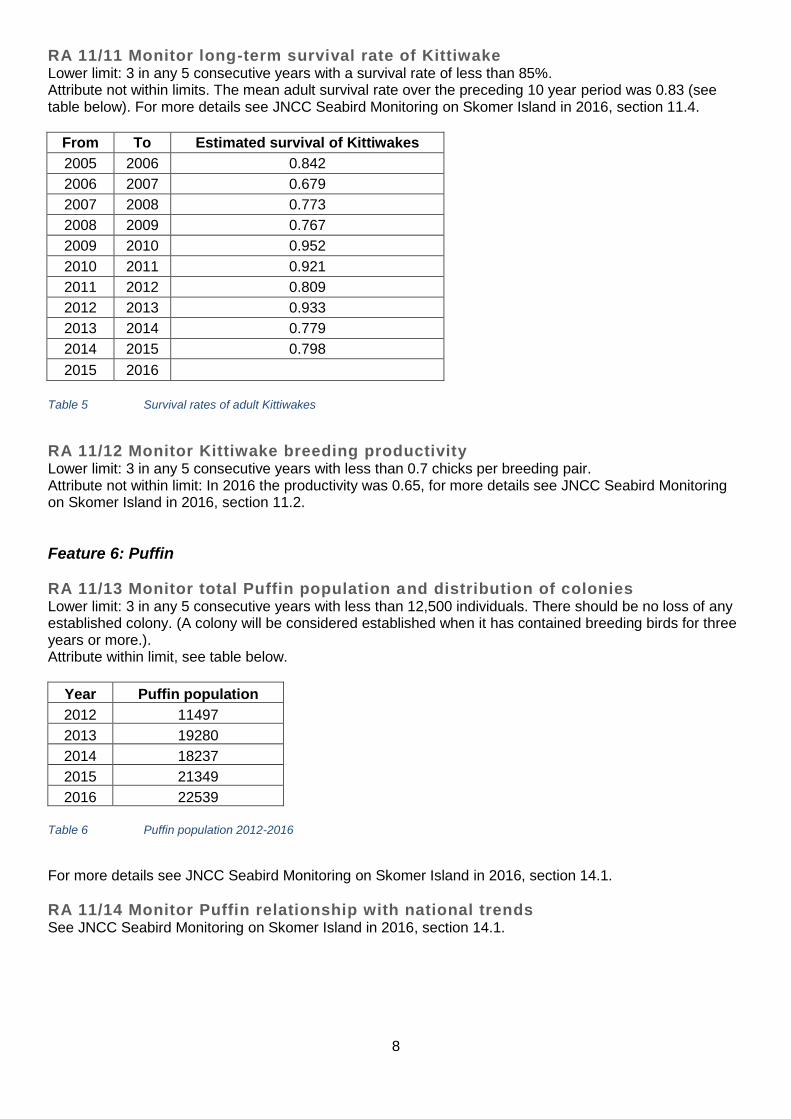
RA 11/11 Monitor long-term survival rate of Kittiwake Lower limit: 3 in any 5 consecutive years with a survival rate of less than 85%. Attribute not within limits. The mean adult survival rate over the preceding 10 year period was 0.83 (see table below). For more details see JNCC Seabird Monitoring on Skomer Island in 2016, section 11.4.
From To Estimated survival of Kittiwakes
2005 2006 0.842
2006 2007 0.679
2007 2008 0.773
2008 2009 0.767
2009 2010 0.952
2010 2011 0.921
2011 2012 0.809
2012 2013 0.933
2013 2014 0.779
2014 2015 0.798
2015 2016
Table 5 Survival rates of adult Kittiwakes
RA 11/12 Monitor Kittiwake breeding productivity Lower limit: 3 in any 5 consecutive years with less than 0.7 chicks per breeding pair. Attribute not within limit: In 2016 the productivity was 0.65, for more details see JNCC Seabird Monitoring on Skomer Island in 2016, section 11.2.
Feature 6: Puffin
RA 11/13 Monitor total Puffin population and distribution of colonies Lower limit: 3 in any 5 consecutive years with less than 12,500 individuals. There should be no loss of any established colony. (A colony will be considered established when it has contained breeding birds for three years or more.). Attribute within limit, see table below.
Year Puffin population
2012 11497
2013 19280
2014 18237
2015 21349
2016 22539
Table 6 Puffin population 2012-2016
For more details see JNCC Seabird Monitoring on Skomer Island in 2016, section 14.1.
RA 11/14 Monitor Puffin relationship with national trends See JNCC Seabird Monitoring on Skomer Island in 2016, section 14.1.

9
RA 11/15 Monitor annual survival rate of Puffins Lower limit: The mean adult survival rate should not fall below 86% over the preceding 10 year period. Attribute within limits: The mean adult survival rate over the preceding 10 year period was 0.88 (see table below). For more details see JNCC Seabird Monitoring on Skomer Island in 2016, section 14.6.
From To Estimated survival of Puffins
2005 2006 0.881
2006 2007 0.870
2007 2008 0.848
2008 2009 0.940
2009 2010 0.933
2010 2011 0.863
2011 2012 0.945
2012 2013 0.925
2013 2014 0.714
2014 2015 0.905
2015 2016
Table 7 Survival rates of adult Puffins
RA 11/16 Monitor annual Puffin breeding productivity Lower limit: 3 in any 5 consecutive years with less than 80% success. Attribute not within limits, (see table below). For more details see JNCC Seabird Monitoring on Skomer Island in 2016, section 14.2.
Year Puffin breeding productivity (%)
2016 78
2015 66
2014 53
2013 78
2012 85
Table 8 Puffin productivity
Wick Puffin study In 2016 the study to assess and compare Puffin productivity between the Wick and an undisturbed site on the Neck (the latter undertaken by the University of Gloucestershire) was continued. This study follows the methods used on the Neck as much as possible in order to make the data comparable. A productivity of 0.83 chicks fledged per active burrow compares positively to 0.83 in the undisturbed study area on the Neck. For more details see JNCC Seabird Monitoring on Skomer Island in 2016, section 5.2 and 2016 Wick Puffin productivity.

10
Feature 7: Guillemot
RA 10/02 Record timing of Guillemot breeding
RA 11/17 Monitor the total Guillemot population and distribution of colonies Lower limit: 3 in any 5 consecutive years with less than 21,600 individuals. Lower limit: There should be no loss of any established colony. (A colony will be considered established when it has contained breeding birds for three years or more.). Guillemots were not censused (whole island) in 2016. However the number of Common Guillemots within the study plots experienced an increase in 2016, with the population being 5.2% higher than the 2011-2015 five year mean, for more details see JNCC Seabird Monitoring on Skomer Island in 2016, section 12.2.
RA 11/18 Monitor Guillemot population in study plots See above.
RA 11/19 Monitor Guillemot relationship with national trends No comparison to national trends was conducted in 2016 as the whole island population of Guillemots was not counted.
RA 11/20 Monitor annual survival rate of breeding Guillemots Lower limit: 3 in any 5 consecutive years with a survival rate less than 85%. The survival of adult Guillemots suggested that survival in 2016 was slightly higher than in 2015, but lower than in many previous years. The study of annual survival of breeding Guillemots is being conducted by Tim Birkhead (Sheffield University) and due to funding cuts detailed data on the annual survival rate of Guillemots is not available anymore, hence the information on whether this attribute is within limits or not is lacking. For more details see JNCC Seabird Monitoring on Skomer Island in 2016, Appendix 1.
RA 11/21 Monitor annual Guillemot productivity at the Amos Breeding success on the Amos was 0.89, which is close to average if slightly higher than in previous years. For more details see JNCC Seabird Monitoring on Skomer Island in 2016, Appendix 1.
RA 11/22 Monitor Guillemot chick diet Lower limit: 3 in any 5 consecutive years with less than 70% Clupeids in diet or less than 3.0 feeds per chick per day. Chicks were, as usual, fed predominantly on clupeids, together with some sandeels and gadids. The study of Guillemot chick diet is being conducted by Tim Birkhead (Sheffield University) and due to funding cuts detailed data on chick diet of Guillemots is not available anymore, hence the information on whether this attribute is within limits or not is lacking. For more details see JNCC Seabird Monitoring on Skomer Island in 2016, Appendix 1.
RA 11/23 Monitor Guillemot annual breeding productivity Lower limit: 3 in any 5 consecutive years with less than 0.8 chicks per breeding pair. Attribute not within limits (see table below). For more details see JNCC Seabird Monitoring on Skomer Island in 2016, section 12.3. The breeding success at the Amos was higher and within limits, see RA 11/21
Year Productivity per active + regular site Productivity per active site only
2010 0.67 0.74
2011 0.52 0.59
2012 0.58 0.65
2013 0.63 0.75
2014 0.61 0.62
2015 0.76 0.76
2016 0.63 0.63
Table 9 Guillemot productivity
11
Feature 8: Razorbill
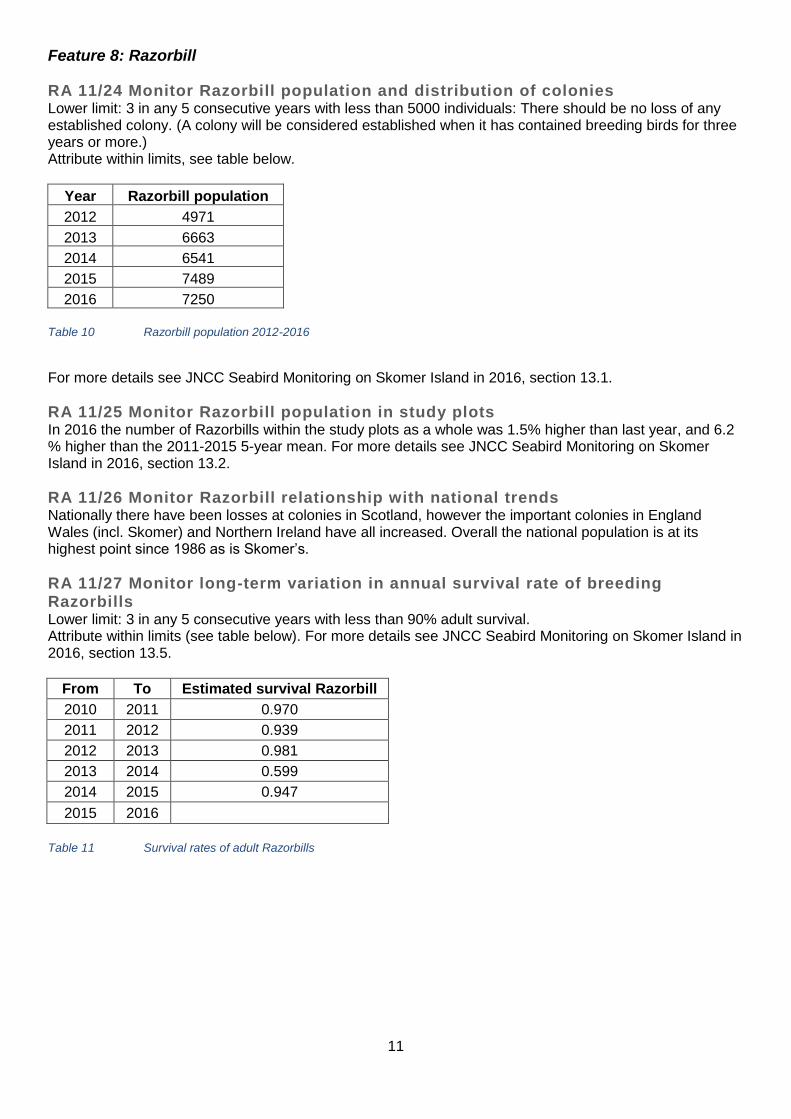
RA 11/24 Monitor Razorbill population and distribution of colonies Lower limit: 3 in any 5 consecutive years with less than 5000 individuals: There should be no loss of any established colony. (A colony will be considered established when it has contained breeding birds for three years or more.) Attribute within limits, see table below.
Year Razorbill population
2012 4971
2013 6663
2014 6541
2015 7489
2016 7250
Table 10 Razorbill population 2012-2016
For more details see JNCC Seabird Monitoring on Skomer Island in 2016, section 13.1.
RA 11/25 Monitor Razorbill population in study plots In 2016 the number of Razorbills within the study plots as a whole was 1.5% higher than last year, and 6.2 % higher than the 2011-2015 5-year mean. For more details see JNCC Seabird Monitoring on Skomer Island in 2016, section 13.2.
RA 11/26 Monitor Razorbill relationship with national trends Nationally there have been losses at colonies in Scotland, however the important colonies in England Wales (incl. Skomer) and Northern Ireland have all increased. Overall the national population is at its highest point since 1986 as is Skomer’s.
RA 11/27 Monitor long-term variation in annual survival rate of breeding Razorbills Lower limit: 3 in any 5 consecutive years with less than 90% adult survival. Attribute within limits (see table below). For more details see JNCC Seabird Monitoring on Skomer Island in 2016, section 13.5.
From To Estimated survival Razorbill
2010 2011 0.970
2011 2012 0.939
2012 2013 0.981
2013 2014 0.599
2014 2015 0.947
2015 2016
Table 11 Survival rates of adult Razorbills
12
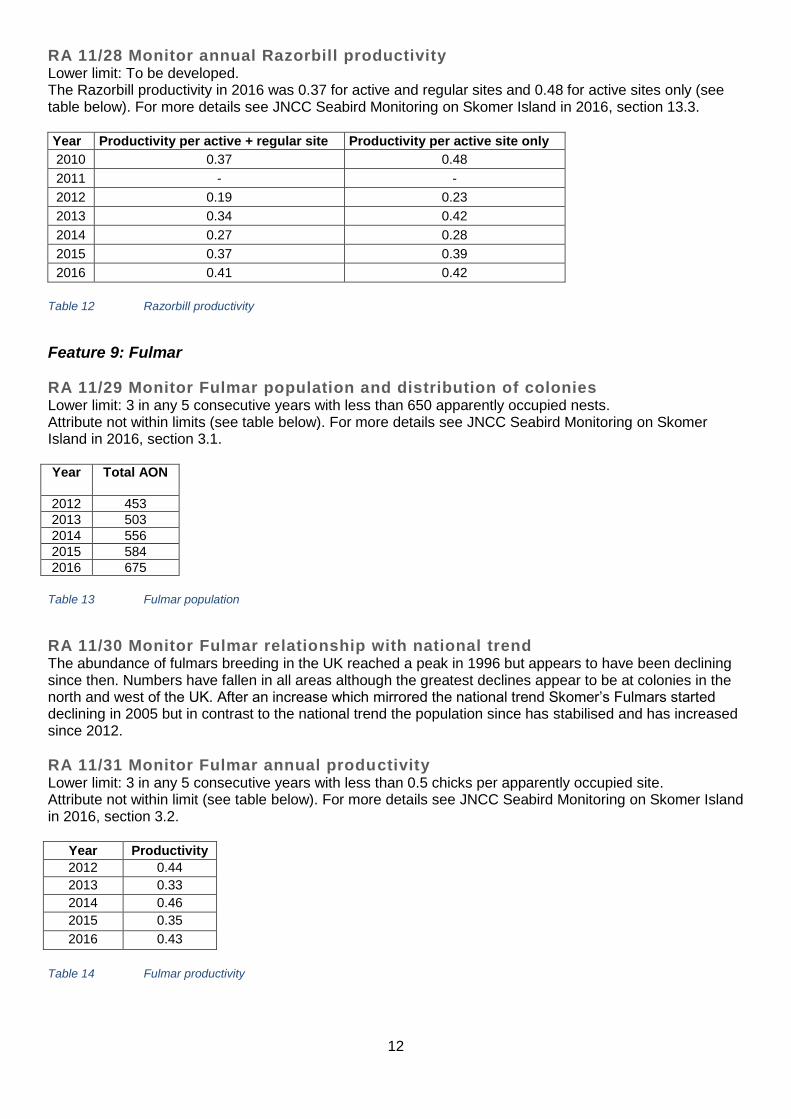
RA 11/28 Monitor annual Razorbill productivity Lower limit: To be developed. The Razorbill productivity in 2016 was 0.37 for active and regular sites and 0.48 for active sites only (see table below). For more details see JNCC Seabird Monitoring on Skomer Island in 2016, section 13.3. Year Productivity per active + regular site Productivity per active site only
2010 0.37 0.48
2011 - -
2012 0.19 0.23
2013 0.34 0.42
2014 0.27 0.28
2015 0.37 0.39
2016 0.41 0.42
Table 12 Razorbill productivity
Feature 9: Fulmar
RA 11/29 Monitor Fulmar population and distribution of colonies Lower limit: 3 in any 5 consecutive years with less than 650 apparently occupied nests. Attribute not within limits (see table below). For more details see JNCC Seabird Monitoring on Skomer Island in 2016, section 3.1. Year
Total AON
2012 453
2013 503
2014 556
2015 584
2016 675
Table 13 Fulmar population
RA 11/30 Monitor Fulmar relationship with national trend The abundance of fulmars breeding in the UK reached a peak in 1996 but appears to have been declining since then. Numbers have fallen in all areas although the greatest declines appear to be at colonies in the north and west of the UK. After an increase which mirrored the national trend Skomer’s Fulmars started declining in 2005 but in contrast to the national trend the population since has stabilised and has increased since 2012.
RA 11/31 Monitor Fulmar annual productivity Lower limit: 3 in any 5 consecutive years with less than 0.5 chicks per apparently occupied site. Attribute not within limit (see table below). For more details see JNCC Seabird Monitoring on Skomer Island in 2016, section 3.2.
Year Productivity
2012 0.44
2013 0.33
2014 0.46
2015 0.35
2016 0.43
Table 14 Fulmar productivity

13
RA 11/32 Monitor Cormorant population and distribution of colonies Lower limit: 3 in any 5 consecutive years with less than 8 pairs. Attribute not within limit (see table below). For more details see JNCC Seabird Monitoring on Skomer Island in 2016, section 6.1.
Year No of AON
2012 4
2013 7
2014 6
2015 7
2016 4
Table 15 Cormorant population
RA 11/33 Monitor Cormorant annual productivity In 2016 the Cormorant productivity was 1.5 chicks fledged per nesting pair. For more details see JNCC Seabird Monitoring on Skomer Island in 2016, section 6.2.
Feature 11: Shag
RA 11/34 Monitor Shag population and distribution of colonies Lower limit: 3 in any 5 consecutive years with less than 3 pairs. Attribute within limit (see table below). For more details see JNCC Seabird Monitoring on Skomer Island in 2016, section 7.1.
Year No of AON
2012 5
2013 5
2014 1
2015 4
2016 6
Table 16 Shag population
RA 11/35 Monitor Shag annual productivity In 2016 the Shag productivity was 1.33 chicks fledged per nesting pair. For more details see JNCC Seabird Monitoring on Skomer Island in 2016, section 7.2.

14
Feature 12: Herring Gull
RA 11/36 Monitor Herring Gull population and distribution of colonies Lower limit: 3 in any 5 consecutive years with less than 440 apparently occupied nests, there should be no loss of any established colony. (A colony will be considered established when it has contained breeding birds for three years or more.) Attribute not within limit (see table below). For more details see JNCC Seabird Monitoring on Skomer Island in 2016, section 9.1.
Year No of AON
2012 401
2013
2014 440
2015 377
2016 321
Table 17 Herring Gull population
RA 11/37 Monitor Herring Gull relationship with national trends See JNCC Seabird Monitoring on Skomer Island in 2016, section 9.1.
RA 11/38 Monitor long-term variation in annual survival rate of breeding Herring Gulls Lower limit: a mean of at least 84% over the preceding 10 year period. Attribute not within limit (see table below). The annual survival rate mean over the last 10 years is 0.81%. For more details see JNCC Seabird Monitoring on Skomer Island in 2016, section 9.3.
From To Estimated survival Herring Gull
2005 2006 0.781
2006 2007 0.806
2007 2008 0.891
2008 2009 0.880
2009 2010 0.692
2010 2011 0.798
2011 2012 0.752
2012 2013 0.751
2013 2014 0.971
2014 2015 0.800
2015 2016
Table 18 Survival rates of adult Herring Gulls

15
RA 11/39 Monitor Herring Gull annual productivity Lower limit: 3 in any 5 consecutive years with less than 0.7 chicks per breeding pair. Attribute not within limit (see table below). For more details see JNCC Seabird Monitoring on Skomer Island in 2016, section 9.2.
Year Productivity
2012 0.50
2013 0.86
2014 0.52
2015 0.69
2016 0.52
Table 19 Herring Gull productivity
Feature 13: Great Black-backed Gull
RA 10/03 Record seabird predation by GBBGU See JNCC Seabird Monitoring on Skomer Island in 2016, section 10.3.
RA 11/40 Monitor GBBGU population Lower limit: 3 in any 5 consecutive years with less than 100 pairs. Attribute within limit (see table below). For more details see JNCC Seabird Monitoring on Skomer Island in 2016, section 10.1.
Year No of AON
2012 96
2013 84
2014 107
2015 123
2016 108
Table 20 Great Black-backed Gull population
RA 11/41 Monitor GBBGU relationship with national trend See JNCC Seabird Monitoring on Skomer Island in 2016, section 10.1.
RA 11/42 Monitor GBBGU annual productivity Lower limit: 3 in any 5 consecutive years with fewer than 1.2 chicks per apparently occupied nest. Attribute within limit (see table below). For more details see JNCC Seabird Monitoring on Skomer Island in 2016, section 10.2.
Year Productivity
2012 0.92
2013 1.56
2014 1.88
2015 1.65
2016 1.44
Table 21 Great Black-backed Gull productivity

16
Feature 14: Short-eared Owl
RA 11/43 Monitor Short-eared Owl population and distribution of nests In 2016 two pairs nested; on Gorse Hill and in West Park, with 12 young fledging from the two nests. For more details see 2016 Skomer Island Wildlife Report, page 43.
Feature 15: Chough
RA 10/04 Record Chough productivity Lower limit: lower limit: 3 out of any 5 consecutive years with less 3 breeding pairs. Attribute within limit (see table below). For more details see Annual surveillance of choughs.
Year No of AON
2012 4-5
2013 3
2014 3
2015 3
2016 4
Table 22 Chough population
RA 11/44 Monitor Chough population and location of nests In 2016 four pairs appear to have attempted to breed at the Lantern, South Castle Beach Cave, the Basin and Payne’s Ledge. For more details see 2016 Skomer Island Wildlife Report, page 49.
RA 11/45 Monitor Chough relationship with national trends The result of the 2014 national census which was coordinated by the RSPB unfortunately has not been published, hence a comparison is not possible at this time.
Feature 16: Peregrine
RA 11/46 Monitor Peregrine population and distribution of nests In 2016 three pairs bred on Skomer. The territories were held at Protheroe’s Dock, High Cliff and Double Cliff. For more details see 2016 Skomer Island Wildlife Report, page 47.
17
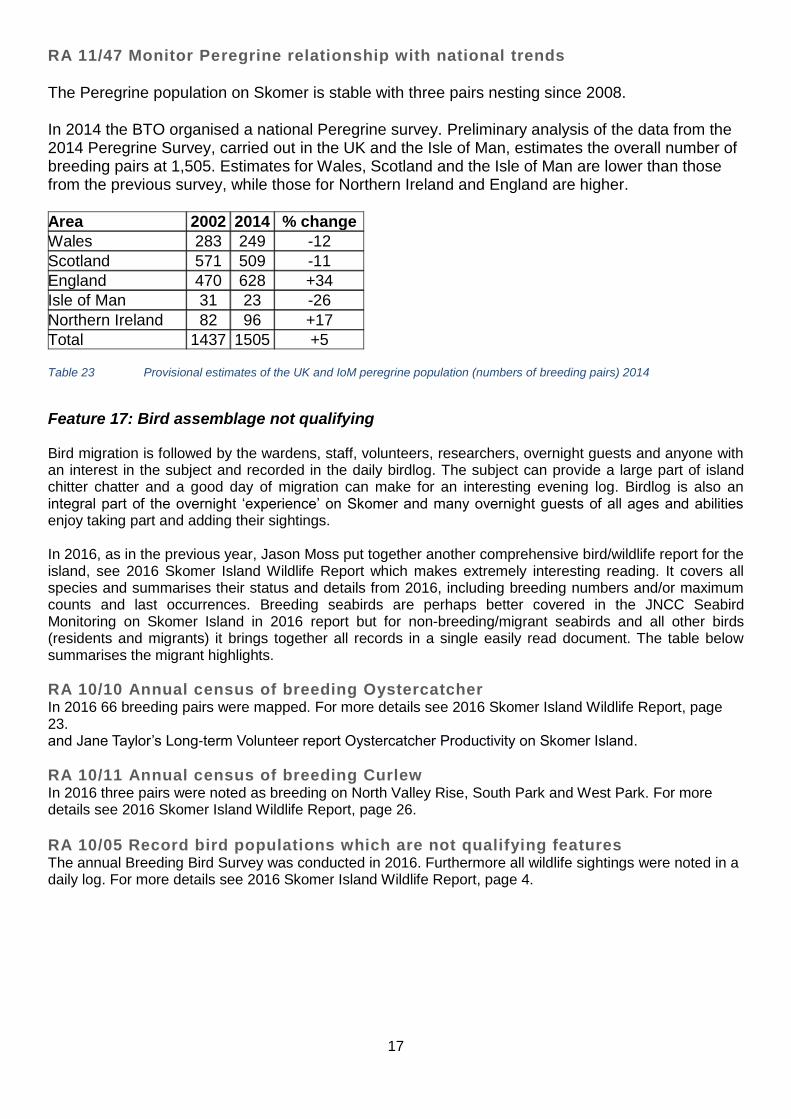
RA 11/47 Monitor Peregrine relationship with national trends
The Peregrine population on Skomer is stable with three pairs nesting since 2008.
In 2014 the BTO organised a national Peregrine survey. Preliminary analysis of the data from the 2014 Peregrine Survey, carried out in the UK and the Isle of Man, estimates the overall number of breeding pairs at 1,505. Estimates for Wales, Scotland and the Isle of Man are lower than those from the previous survey, while those for Northern Ireland and England are higher.
Area 2002 2014 % change
Wales 283 249 -12
Scotland 571 509 -11
England 470 628 +34
Isle of Man 31 23 -26
Northern Ireland 82 96 +17
Total 1437 1505 +5 Table 23 Provisional estimates of the UK and IoM peregrine population (numbers of breeding pairs) 2014
Feature 17: Bird assemblage not qualifying Bird migration is followed by the wardens, staff, volunteers, researchers, overnight guests and anyone with an interest in the subject and recorded in the daily birdlog. The subject can provide a large part of island chitter chatter and a good day of migration can make for an interesting evening log. Birdlog is also an integral part of the overnight ‘experience’ on Skomer and many overnight guests of all ages and abilities enjoy taking part and adding their sightings. In 2016, as in the previous year, Jason Moss put together another comprehensive bird/wildlife report for the island, see 2016 Skomer Island Wildlife Report which makes extremely interesting reading. It covers all species and summarises their status and details from 2016, including breeding numbers and/or maximum counts and last occurrences. Breeding seabirds are perhaps better covered in the JNCC Seabird Monitoring on Skomer Island in 2016 report but for non-breeding/migrant seabirds and all other birds (residents and migrants) it brings together all records in a single easily read document. The table below summarises the migrant highlights.
RA 10/10 Annual census of breeding Oystercatcher In 2016 66 breeding pairs were mapped. For more details see 2016 Skomer Island Wildlife Report, page 23. and Jane Taylor’s Long-term Volunteer report Oystercatcher Productivity on Skomer Island.
RA 10/11 Annual census of breeding Curlew In 2016 three pairs were noted as breeding on North Valley Rise, South Park and West Park. For more details see 2016 Skomer Island Wildlife Report, page 26.
RA 10/05 Record bird populations which are not qualifying features The annual Breeding Bird Survey was conducted in 2016. Furthermore all wildlife sightings were noted in a daily log. For more details see 2016 Skomer Island Wildlife Report, page 4.

18
Feature 18: Little Owl
RA 10/06 Annual census of Little Owl One pair was known to have bred in 2016. The first two chicks were seen on 4th June on the walls west of the Farm. For more details see 2016 Skomer Island Wildlife Report, page 42.
Feature 19: Canada Goose
RA 10/07 Annual census of breeding Canada Goose A total of 21 pairs nested on the island in 2016. For more details see 2016 Skomer Island Wildlife Report, page 7.
RA 10/08 Record Canada Geese in winter/noon breeding population Numbers dwindled dramatically in August as birds departed the island to moult, with only between two and six birds being noted on 13 days between 7th August and 6th September. Thereafter numbers increased significantly as birds commuted back and forth from the mainland, see table below. For more details see 2016 Skomer Island Wildlife Report, page 8.
Month Feb Mar Apr May Jun Jul Aug Sep Oct Nov
Max count 12 28 25 20 42 39 55 350 240 176
Table 24 Canada Goose counts
Constant Effort Site The CES (Constant Effort Site) study (a scheme operated by the British Trust of Ornithology (BTO) continued in 2016, delivered by island staff. This study looks into the adult survival and breeding success of passerines, particularly migrant warblers by use of standardised ringing. This involves ringing for a set period of time once in every ten day period between May and August and recording the species, age and measurements of all birds caught. The main species involved on Skomer are Sedge Warblers and Common Whitethroats. The data is then inputted onto the BTO’s database IPMR and used in their analysis and report on The State of the UK’s Birds. Nest recording was also carried out on the island to add to productivity and breeding data.

19
2.2 MAMMALS
Feature 20 Skomer Vole
RA 00/04 Record population of Skomer Voles in study plot In 2016 Dr. Tim Healing’s study on voles was conducted by Long-term Volunteer Alice Brooke. For more details see Skomer Voles in 2016.
Feature 21 Grey Seal Grey Seal productivity was monitored by WTSWW under NRW contract as an Marine Conservation Zone (MCZ) project. B. Büche and E. Stubbings carried out this work, assisted by Elisa Miquel-Riera who acted as Seal Assistant in October. Furthermore J. Moss, L. Newman and Long Term Volunteers helped collect the data. The report was submitted to NRW, for more details see Skomer Seal Report 2016. In 2016 we explored the fluctuation of haul-outs during a four hour period around low tide. On 23/8/17, 16/09/17 and 20/09/17 volunteers counted hauled-out seals on the Garland Stone every ten minutes beginning 110 minutes before low tide and ending 110 minutes after low tide. The data suggests that peak haul-out is reached during an ebbing tide and haul-out numbers decrease once the tide starts to flood, see figure below.
Figure 2 Average haul-out of Grey Seals at Garland Stone
RA00/01 Casual observation of seal behaviour See Skomer Seal Report 2016.pdf section 8.
RA00/02 Identification of individual breeding and hauled-out seals See Skomer Seal Report 2016.pdf section 10.
RA 00/06 Record any significant impart of severe storms on the seal population No severe storm events were noted in 2016.
RA 01/01 Monitor seal pup births and survival The total of 202 pups born on Skomer Island. 146 pups are known, or assumed, to have survived on Skomer, giving a survival rate of 72%.For more details see Skomer Seal Report 2016.pdf section 4.1 and 4.2.
0
2
4
6
8
10
12
14
16
-1.50 -1.00 -0.50 0.00 0.50 1.00 1.50
Av.
no
. of
seal
s
hours
Average haul-out at Garland Stone
20
RA 01/02 Monitoring seal attendance at haul-outs In 2016 the maximum haul-out (on the main haul-out sites) of 224 animals was recorded on 24 November. For more details see Skomer Seal Report 2016.pdf section 5.
Cetaceans Standardised hour-long cetacean watches were conducted on a weekly basis from the Garland Stone and Skomer Head. These were carried out to Sea Trust methodology by weekly volunteers. The data was then sent to the Sea Trust and the Marine Conservation Zone (MCZ) staff. All cetacean sightings were recorded in the daily wildlife log. For more details see figures below and 2016 Skomer Island Wildlife Report, page 137.. A total of 1227 Harbour Porpoise sightings were recorded in 2017 (28/2/17-31/10/17) and 431 Common Dolphin. The largest group of 40 Common Dolphin was seen on 21/06/17. On 14/7/16 a group of at least five Risso’s Dolphins where seen close to the Smalls. On 14/9/17 two were seen from Skomer and one on 24/9/17.

21
Figure 3 Average number of Common Dolphin sightings per week
Figure 4 Average number of Harbour Porpoise sightings per week
0
10
20
30
40
50
05
/06
/16
12
/06
/16
19
/06
/16
26
/06
/16
03
/07
/16
10
/07
/16
17
/07
/16
24
/07
/16
31
/07
/16
07
/08
/16
14
/08
/16
21
/08
/16
28
/08
/16
04
/09
/16
11
/09
/16
18
/09
/16
25
/09
/16
02
/10
/16
09
/10
/16
16
/10
/16
23
/10
/16
30
/10
/16
Av.
no
. of
do
lph
ins
Week beginning
Average number of Common Dolphin sightings per week 2016
02468
101214161820
28
/02
/16
06
/03
/16
13
/03
/16
20
/03
/16
27
/03
/16
03
/04
/16
10
/04
/16
17
/04
/16
24
/04
/16
01
/05
/16
08
/05
/16
15
/05
/16
22
/05
/16
29
/05
/16
05
/06
/16
12
/06
/16
19
/06
/16
26
/06
/16
03
/07
/16
10
/07
/16
17
/07
/16
24
/07
/16
31
/07
/16
07
/08
/16
14
/08
/16
21
/08
/16
28
/08
/16
04
/09
/16
11
/09
/16
18
/09
/16
25
/09
/16
02
/10
/16
09
/10
/16
16
/10
/16
23
/10
/16
30
/10
/16
Av.
no
. of
po
rpo
ise
Week beginning
Average number of Harbour Porpoise sightings per week 2016

22
Rabbits See Feature 27:Vegetation

23
2.3 INVERTENRATES
Feature 24: Lepidoptera
RA40/01 Annual butterfly transect The island butterfly transect was carried out once a week between April and the end of September. The butterfly transect data were entered online on to the Butterfly Conservation website. For more details see 2016 Skomer Island Wildlife Report, page 93 and 129. In 2014 we began recording the frequency of the form caeruleopunctata amongst our Small Coppers. This was continued in 2015 and 2016. In 2016 13% of all Small Coppers, seen well enough, had four blue spots on each hind wing, 19% had three or less and 68% had none at all.
Moths Regular moth trapping was carried out at the Farm and North Haven during the season. Moth trapping on Skomer has a long history and there are some interesting species on the island. Furthermore it is a fabulous people engagement tool, hence well worth keeping up. All moth records were also sent to the county moth recorder
Herpetiles Slow Worms, Common Lizards, Common Frogs, Common Toads and Palmate Newts, as well as any small mammals found under the refugia were recorded every week on two set transects. The Farm transect has been going for many years and the wider island transect was set up in 2013 and continued since. These were carried out by weekly volunteers and the data was sent to ARC (Amphibian and Reptile Conservation) Trust.
2.4. LICHENS
Feature 25:Lichen assemblage
RF50/01 Record lichen quadrats Project needs to be developed
RF50/02 Teloschistes Flavicans photo surveillance Project needs to be developedl The population of Teloschistes flavicans was present on the rocks at the top of the Amos and seems healthy.

24
2.5 VEGETATION Feature 27:Vegetation
RA 00/05 Annual Rabbit census Monthly Rabbit counts were done in the study plots on the central fields, the Wick grasslands and South Plateau. In 2016 the Rabbit numbers increased slightly after having been very low the previous year, see table and figure below.
Date 25/03/2016 28/04/2015 30/05/2016 29/06/2016 28/07/2016 31/08/2016 02/10/2016
Plot Plot 1 6 15 4 5 5 5 1
Plot 2 7 14 12 9 6 2 2
Plot 3 12 22 5 4 1 2 2
Plot 4 12 34 34 20 4 7 3
Wick Grassland 7 12 10 11 10 25 19
South Plateau 14 56 37 31 25 45 31
Table 25 Rabbit Numbers
Figure 5 Mean number of Rabbits per hectare
RF00/01 High resolution aerial photography Planned for 2017.
RF01/02 Fixed point photography Project needs to be developed. .
RF01/01 Permanent vegetation quadrats In 2016 no new vegetation quadrats were found and no monitoring of the existing ones was undertaken. Detailed project needs to be developed.
0
10
20
30
40
50
60
Me
an n
o o
f ra
bb
its.
/ha

25
RF20/01 Map the distribution of Bracken Planned for 2017 with high resolution aerial photography.
RF20/02 Map the distribution of Bluebell Planned for 2017 with high resolution aerial photography.
RF20/03 Map the distribution of Red Campion No undertaken in 2016.
RF20/04 Map the distribution of Ragwort Ragwort was present in normal/small numbers.
RF20/05 Record rare plants Euphorbia portlandica was present at the landing/boat slip. Limonium binervosum was present at South Castle Ranunculus tripartitus was present in Wick Stream Aspenium obovatum was present at Sales Point
Record of significant damage to vegetation In 2016 we experienced a die-off of Holcus lanatus mainly concentrated around North and South Haven. For more detail see Record of significant damage to vegetation.
NPMS In 2015 we started to contribute to the National Plant Monitoring Scheme (NPMS) and the monitoring continued in 2016. In spring and late summer, five plots are being surveyed and the data uploaded onto the NPMS web page. .
26
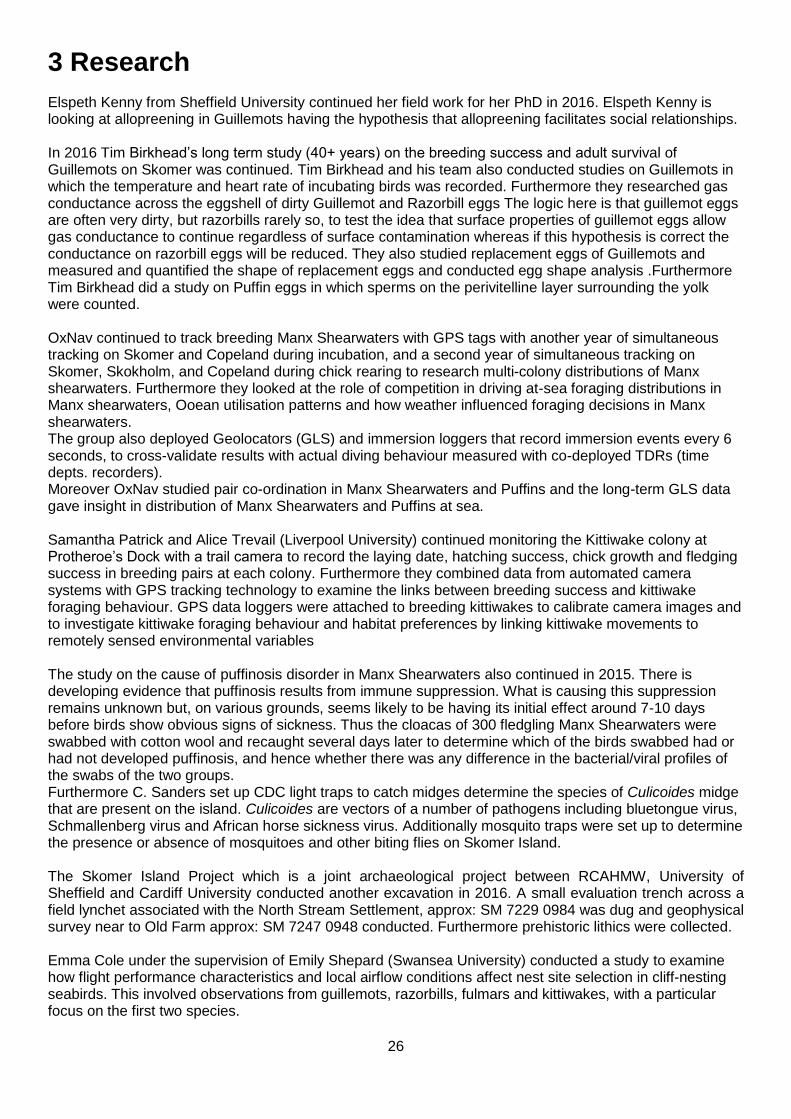
3 Research Elspeth Kenny from Sheffield University continued her field work for her PhD in 2016. Elspeth Kenny is looking at allopreening in Guillemots having the hypothesis that allopreening facilitates social relationships. In 2016 Tim Birkhead’s long term study (40+ years) on the breeding success and adult survival of Guillemots on Skomer was continued. Tim Birkhead and his team also conducted studies on Guillemots in which the temperature and heart rate of incubating birds was recorded. Furthermore they researched gas conductance across the eggshell of dirty Guillemot and Razorbill eggs The logic here is that guillemot eggs are often very dirty, but razorbills rarely so, to test the idea that surface properties of guillemot eggs allow gas conductance to continue regardless of surface contamination whereas if this hypothesis is correct the conductance on razorbill eggs will be reduced. They also studied replacement eggs of Guillemots and measured and quantified the shape of replacement eggs and conducted egg shape analysis .Furthermore Tim Birkhead did a study on Puffin eggs in which sperms on the perivitelline layer surrounding the yolk were counted. OxNav continued to track breeding Manx Shearwaters with GPS tags with another year of simultaneous tracking on Skomer and Copeland during incubation, and a second year of simultaneous tracking on Skomer, Skokholm, and Copeland during chick rearing to research multi-colony distributions of Manx shearwaters. Furthermore they looked at the role of competition in driving at-sea foraging distributions in Manx shearwaters, Ooean utilisation patterns and how weather influenced foraging decisions in Manx shearwaters. The group also deployed Geolocators (GLS) and immersion loggers that record immersion events every 6 seconds, to cross-validate results with actual diving behaviour measured with co-deployed TDRs (time depts. recorders). Moreover OxNav studied pair co-ordination in Manx Shearwaters and Puffins and the long-term GLS data gave insight in distribution of Manx Shearwaters and Puffins at sea. Samantha Patrick and Alice Trevail (Liverpool University) continued monitoring the Kittiwake colony at Protheroe’s Dock with a trail camera to record the laying date, hatching success, chick growth and fledging success in breeding pairs at each colony. Furthermore they combined data from automated camera systems with GPS tracking technology to examine the links between breeding success and kittiwake foraging behaviour. GPS data loggers were attached to breeding kittiwakes to calibrate camera images and to investigate kittiwake foraging behaviour and habitat preferences by linking kittiwake movements to remotely sensed environmental variables The study on the cause of puffinosis disorder in Manx Shearwaters also continued in 2015. There is developing evidence that puffinosis results from immune suppression. What is causing this suppression remains unknown but, on various grounds, seems likely to be having its initial effect around 7-10 days before birds show obvious signs of sickness. Thus the cloacas of 300 fledgling Manx Shearwaters were swabbed with cotton wool and recaught several days later to determine which of the birds swabbed had or had not developed puffinosis, and hence whether there was any difference in the bacterial/viral profiles of the swabs of the two groups. Furthermore C. Sanders set up CDC light traps to catch midges determine the species of Culicoides midge that are present on the island. Culicoides are vectors of a number of pathogens including bluetongue virus, Schmallenberg virus and African horse sickness virus. Additionally mosquito traps were set up to determine the presence or absence of mosquitoes and other biting flies on Skomer Island. The Skomer Island Project which is a joint archaeological project between RCAHMW, University of Sheffield and Cardiff University conducted another excavation in 2016. A small evaluation trench across a field lynchet associated with the North Stream Settlement, approx: SM 7229 0984 was dug and geophysical survey near to Old Farm approx: SM 7247 0948 conducted. Furthermore prehistoric lithics were collected. Emma Cole under the supervision of Emily Shepard (Swansea University) conducted a study to examine how flight performance characteristics and local airflow conditions affect nest site selection in cliff-nesting seabirds. This involved observations from guillemots, razorbills, fulmars and kittiwakes, with a particular focus on the first two species.

27
For more details see WTSWW research report 2016, pages 5-8, 9, 12 and 22

28
4 Visitors 4.1 DAY VISITORS The 2016 season started on 25th March due to an early Easter, however, the island was shut for four days from 26th – 30th March due to bad weather. Luckily this wasn’t a pattern to continue throughout the year and a generally settled year allowed for good numbers of visitors. There were 16,103 day visitors and 1,189 overnight guests bringing the grand total to 17,292 visitors in 2016. As can be seen in figure below, it was a record breaking year with combined visitor numbers surpassing 17,000 for the first time.
Figure 6 Total number of visitors including hostel guests, day visitors and private landers over a 10 year period.
Not only was it good news on the year as a whole there were also significant increases in the shoulder season as seen in figure below. August and September have traditionally been quieter times on the island but increased efforts to promote the shoulder season are working and this reflects in our busiest ever August with 1462 day visitors. This was helped by slightly less no sail days in the shoulder season with four in August compared to six in August 2015 and nine in September compared to 10 in September 2015.
Figure 7 Total number of day visitors in August and September over the past 10 years.
13884 14097
15139
14325
16859
12118
14779
16839 16122
17292
10000
11000
12000
13000
14000
15000
16000
17000
18000
2007 2008 2009 2010 2011 2012 2013 2014 2015 2016
Tota
l nu
mb
er o
f vi
sito
rs
Year
988 938
1109
774
1008
616
772
1240 1232
1462
448
325 321 289 280 249 136
449 343
450
0
200
400
600
800
1000
1200
1400
1600
2007 2008 2009 2010 2011 2012 2013 2014 2015 2016
NU
MB
ER O
F D
AY
VIS
ITO
RS
YEAR
August September
29
Day boat cancelations
2013 2014 2015 2016
Number of boat cancellations
52 27 42 38
Table 26 Number of no boat days over the previous four years. This does not include Mondays.
2016 was better than last year in terms of the number of no sailing days, however, the number is slightly higher than expected because of a slightly earlier opening date to the season which resulted in four no sail days before 1st April. Fortunately most of the no sail days didn’t impact overnight guests too badly (as can be seen in the table above) as we managed to work stays around the weather, another benefit of guests staying for two nights in May and June.
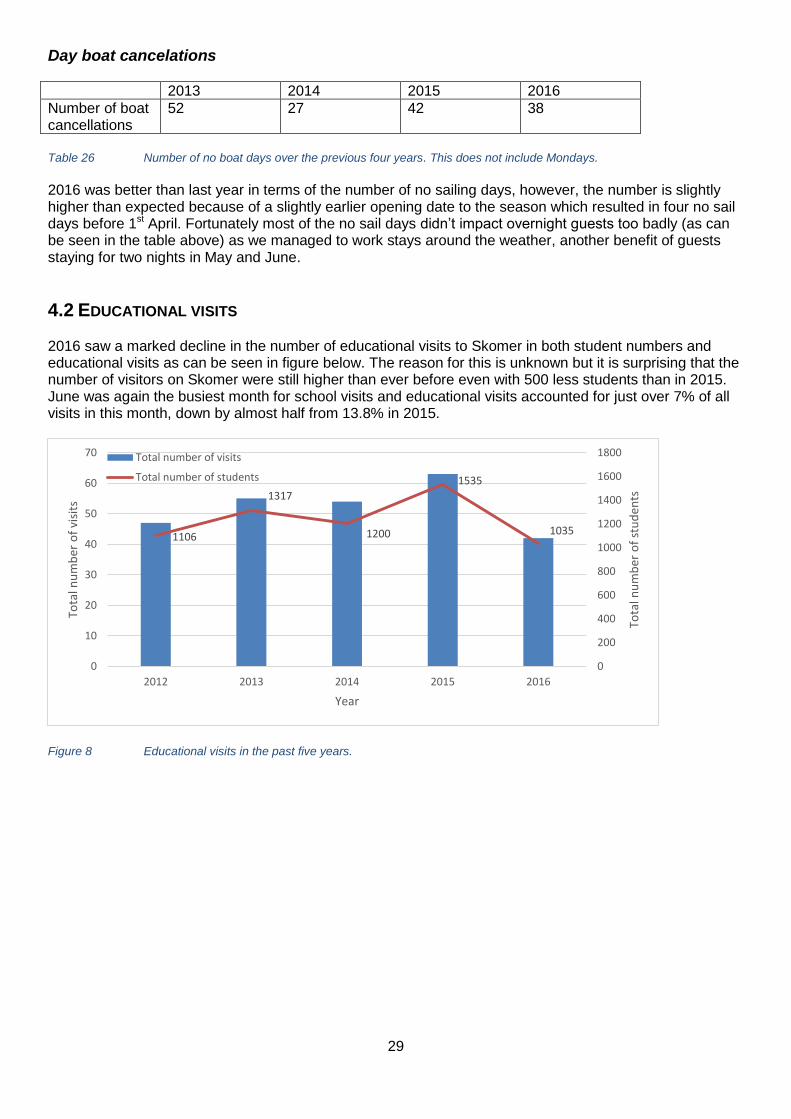
4.2 EDUCATIONAL VISITS 2016 saw a marked decline in the number of educational visits to Skomer in both student numbers and educational visits as can be seen in figure below. The reason for this is unknown but it is surprising that the number of visitors on Skomer were still higher than ever before even with 500 less students than in 2015. June was again the busiest month for school visits and educational visits accounted for just over 7% of all visits in this month, down by almost half from 13.8% in 2015.
Figure 8 Educational visits in the past five years.
1106
1317
1200
1535
1035
0
200
400
600
800
1000
1200
1400
1600
1800
0
10
20
30
40
50
60
70
2012 2013 2014 2015 2016
Tota
l nu
mb
er o
f st
ud
ents
Tota
l nu
mb
er o
f vi
sits
Year
Total number of visits
Total number of students

30
4.4 OVERNIGHT GUESTS In 2016, there were 2109 beds sold in the hostel, an amazing 209 more than in 2015. This is a really good performance indicator for how the island is being marketed as it looks purely at how many beds were sold and bad weather and no sail days have little to no effect on this figure. We also increased our two night only stays in the hostel to May and June, with no significant difference in occupancy or beds sold, but a huge reduction in workload in the peak season.
Figure 9 Number of beds sold per year.
Figure 10 Percentage occupancy of the rooms in the hostel in August and September
Traditionally a quiet time of the year in the hostel on Skomer, August and September have been the focus of marketing and advertising over the past few years and it seems to be paying off with percentage occupancy increasing year on year in the shoulder season. Compared to just three years ago, occupancy rates have increased fivefold in September and over two and a half times in August. For the first time in August and September over half of the beds available in the month were occupied.
1531 1528
1830 1900
2109
1400
1500
1600
1700
1800
1900
2000
2100
2200
2012 2013 2014 2015 2016
Bed
s so
ld
Year
67.34
54.17
49.40
33.54
45.77
29.58
25.20
10.83
0 10 20 30 40 50 60 70 80
August
September
PERCENTAGE OCCUPANCY (%)
MO
NTH
2013
2014
2015
2016

31
The hostel also received overwhelmingly positive feedback in 2016.
Figure 11 Percentage of guests who rated each category good or excellent in 2016.
The figure above shows that every category received a large majority of good or excellent ratings and even the lowest rated category, the kitchen, was still rated good or excellent by 70% of guests. Interpretation and helpfulness were both rated good or excellent by 100% of all guests as was the booking process, which was changed in April of 2016.
0
10
20
30
40
50
60
70
80
90
100
Information Booking Cleanliness Kitchen Washroom Interpretation Helpfulness
Per
cen
tage
(%
)
Categories

32
4.5 HUMAN IMPACT
Visitors The island was regularly wardened and patrolled by volunteers and staff. All visitors received an introductory talk, emphasising ‘dos and don’ts’ with regards to safety and disturbance to wildlife. All introductory talks encouraged visitors to walk the island in an anticlockwise way, which seemed to reduce visitor pressure at the Wick slightly. A code of conduct for photography groups was displayed in the hostel and mentioned in welcome talks. Furthermore the Commercial Code of Conduct was continued in 2016. The Wick was manned by staff and volunteers to prevent visitor disturbance and provide information about seabirds to visitors. The Puffin productivity study which was started in 2014 was continued in 2016 to monitor human impact at the Wick on the breeding success of the Puffins. Success is measured by the number of chicks fledged per pair. For more details see 2016 Wick Puffin productivity. Daily records of disturbance from anywhere on the island, including seaborne disturbance, were kept at evening log and are on record. Most common type of disruption was people off paths, private landing without paying and without receiving intro talk, collapsed burrows during gull and Puffin count, BBS and Shearwater census, collapsed burrows by visiting guests.
Seaborne disturbance In 2016 we observed several incidents of seaborne disturbance. Boats and kayaks quite regularly go too close to seabird cliffs and hauled-out seals in North Haven and Rye Rocks. Several times a year people land or try to land in South Haven. In autumn boats regularly enter the voluntary no entry zones in South and North Haven. This has been a source of disturbance where boats (particularly tenders and dinghies) approach pupping beaches and loud noises e.g. from anchors being raised spook seals. This is a particular problem in South Haven. Furthermore lobster potting boats regularly come too close to nesting seabirds and moreover pupping beaches causing the seals to panic and flee into the water. All seaborne disturbance data is being made available to the NRW’s Marine Conservation Zone team at Martin’s Haven.
Pollution No major pollution incidents were reported in 2015.

33
5 Staff and Volunteers
5.1 ISLAND STAFF Visitor Officer, Leighton Newman, Assistant Warden Jason Moss and the Wardens Birgitta Büche and Edward Stubbings moved out the island on 28/2/16. Field Worker Elisa Miquel-Riera joined the mid-April. Elisa’s contract ended mid-August but she returned to the island in October to take up her role as Seal Assistant. Elisa, Jason and Leighton left Skomer end of October; the wardens left on the 28/11/16.
5.2 LOCKLEY LODGE Chrissy and Gary Eade ran Lockley Lodge in 2016 and Mervyn Jones returned as recruitment officer. The Lockley Lodge team worked extremely hard throughout the season and the island could not have run so smoothly without their hard work. The Lockley Lodge team run an extremely tight ship which we think is important to keep order and give everyone the best possible experience whilst maintaining the interests of the Trust.
5.3 VOLUNTEERS
Weekly vols We had a total of 145 weekly volunteers helping in 2016. Eight of them were taking part in the Duke of Edinburgh awards scheme. We are delighted that we can give so many people the chance of hands-on experience in conservation, especially young people who are looking for a career in this field. Moreover we wouldn’t be able to run Skomer without the help of our volunteers.
Work parties A work party took place 2-9 April 2016, seven volunteers participated and they
took down old rabbit fence
erected new fence behind VC
painted hand rails and benches
finished sorting out hostel after water damage
did maintenance on paths and put new boardwalk in at Moory Mere and North Stream
A huge thanks goes to all of our work party and weekly volunteers.
LTV’s In 2016 we were joined by four Long Term Volunteers, they were Jane Taylor (April – July), Hannah Andrews (April – July), Cerridwen Richards (July – September) and Alice Brooke (July – October). Both Jane and Hannah being in the main seabird breeding season focused on seabirds, Jane being responsible for Oystercatcher productivity and Hannah for Razorbill productivity at Bull Hole, as well as renovating the History Trail. Although being in the second half of the season, Cerren also did her project on seabirds, and looked at the rafting behaviour of Manx Shearwaters (which she was able to analyse for her Bachelor’s thesis) and Alice based her project around the continuation of Tim Healings long term Vole study on the island. This year we were also joined by Tracey-Ann Hooley who was the Seabird Monitoring Volunteer. She spent a month on Skomer helping out with gull counts, cliff nesting seabird counts and she also co-ordinated the Shearwater annual census. All five of the volunteers were superb in their work ethic and became an integral part of the island for the period they were there. For more information on their personal projects see Influence of wind direction on the rafting Manx Shearwaters, Oystercatcher Productivity on Skomer Island, Skomer Voles in 2016 and Improving the History Trail on Skomer Island.

34
6 Media, Interpretation and Events
6.1 MEDIA/FILMING ON SKOMER As ever there was a lot of media interest in Skomer in 2016 and it is broken down into month by month accounts of the media highlights plus a total number of media pieces for that month.
March BBC Springwatch filmed on the 1st and 2nd March, a day after we moved out. Skomer was voted Britain’s Favourite Nature Reserve in February by Land Love magazine Skomer was voted in the top ten best places to photograph wildlife in Britain by the Guardian. There were a total of 17 pieces of media from January, February and March.
April Visit Pembrokeshire came onto Skomer on the 28th to take promotional photos for a piece profiling the island and the Wardens There were a total of 7 pieces of media for April.
May Andy Davies has been over a couple of times this month to film an upcoming promotional film for Skomer with funding from Visit Wales. There were a total of 2 pieces of media for May.
June Countryfile came to film the research that happens on Skomer including the annual shearwater census and the research carried out by Oxford University. Lonely Planet came over on the 19th June There were a total of 6 pieces of media for June.
July There were a total of 23 pieces of media for July.
August There were a total of 20 pieces of media for August.
September James McCarthy came from Wales Online and spent some time with Leighton. This resulted in a two page spread in an insert of the Western Mail on Saturday 17th September. There were a total of 36 pieces of media for September.
Winter Skomer were finalists in the Pembrokeshire Tourism Awards for Sustainable tourism. Skomer was also awarded a certificate of excellence by Trip Advisor. There were a total of 47 pieces of media for the winter period, October, November and December.

35
Figure 12 Media pieces on Skomer in 2016, broken down into categories.
As can be seen in figure above, the largest category of media on Skomer is online, closely followed by print. Television and radio are far behind with just eight and nine pieces respectively. A total of 163 pieces of media were recorded in 2016.
6.2 MARKETING, PUBLICITY AND SOCIAL MEDIA Social media was again hugely popular, allowing people from all over the world to see what happens on Skomer, from the bird sightings to the behind the scenes maintenance work. Most Skomer Island Blog posts were seen by over 1000 readers, a huge increase to the previous year. Facebook grew in popularity rising from 4,700 likes by the end of 2015, to 6,705 at the end of 2016, a gain of 2,005 followers in a year! Twitter also gained many new followers and now stands at 5,424 whilst Instagram now has 300 followers, up from 125 followers at the end of 2015. Efforts to increase Instagram followers throughout 2016 clearly worked and this will be continued on into 2017 along with a continued push on all other social media platforms. Wildlife highlights were written up at the end of each month and included in the Skomer Monthly Reports, as well as being sent to Birdwatching for inclusion in the UK Bird Sightings section of the magazine.
67
9 8
79
Media Pieces in 2016
Radio
Tv
Online

36
6.3 INTERPRETATION 2016 saw the start of rejuvenating the history trail. Having been in place for a number of years the trail is starting to look a little dilapidated and could well be included as part of the historical features of Skomer in its own right. As part of Hannah Andrews’ personal project she worked with Louise Barker and Dr Toby Driver from the Royal Commission on the Ancient and Historical Monuments of Wales (RCAHMW) to create new content for the history trail and identify four key sites around the island that should have interpretation boards. These will be designed over winter and hope to be in place in the summer of 2017.
6.4 EVENTS
West Coast Birdwatching events In 2016 Dave Astins of West Coast Birdwatching, ran two guided birdwatching weekends and five day trips in conjunction with the trust. Both the birdwatching weekends were sold out with 10 participants on each trip and all five exclusive Monday guided walks on the island were also sold out with 15 participants per walk.
Photography Workshops with Andy Davies New for 2016 were two residential photographic workshops run by Andy Davies. Run over two days these focussed on a variety of subjects but importantly were timed for the shoulder season. The event run in April, priced at £150, was sold out with 10 participants and the event in September, priced at £120 had four participants.
Wednesday activities in August In 2016 the Wednesday family activities were run by the Long Term Volunteers Alice and Cerren. Five events were planned and four went ahead, with one being cancelled due to inclement weather. Activities for this year’s events included rockpooling with Cerren and a chance to see the Skomer Vole with Alice. Although these activities were very much enjoyed by the participants, they didn’t draw the number of people we’d hoped for. This event will be changed for 2017 to rockpooling Fridays and moved to only twice in August. These activities were free to attend apart from the usual landing fee and boat fare.
Skomer’s Hidden Secrets Set up in 2015 this event hoped to draw families to visit Skomer and stay overnight and get involved in the side of Skomer they didn’t normally see. In 2016 the hostel was fully booked out for these two events, however, they weren’t booked out by people wanting to attend the family activities. As there was no extra charge there was no incentive for people to book another day and so the Hidden Secrets became a normal stay. Although it was a shame that this event didn’t go ahead, it’s still a huge positive that August was much busier than we’d anticipated and proved to be the busiest August in the hostel, on record.
Shearwater Week Shearwater Week continues to go from strength to strength and 2016 was another fantastic week, enjoyed by all visitors, researchers and staff alike. In total, there were 132 beds filled during Shearwater Week.
Pembrokeshire Coast National Park walks In 2016 we scheduled five Pembrokeshire Coast National Park Walks. We ran one in April on wildflowers and then four in September, having a more general focus than in 2015, but hoping to include seals, history and birds. Again these walks were run at no extra cost in a bid to boost visitor numbers in September. They were led by a guide from the National Parks Authority and were usually attended by a member of island staff. The walk on wildflowers in April was fully booked and we received some great feedback on the walk. The walks in September were less well attended though and only three out of the four went ahead due to weather. Due to cuts in the Pembrokeshire Coast National Park Authority these walks will not be continued in 2017

37
7 Reserve Management
7.1 MANAGEMENT PLAN Species monitoring was done according to management plan. Some project descriptions are still outstanding.
7.2 SPECIES AND HABITAT MANAGEMENT Apart from work on the footpaths no other habitat management was carried out. No species management was carried out above and beyond the normal people management to minimise disturbance to nesting birds.

38
8 External groups and liaison
ICAC The Islands Conservation Advisory Committee (ICAC) meetings were held on 16/2/16 (Cilgerran), 14/8/16 (Skokholm), 2/12/16 (Cilgerran). The seabird monitoring subcommittee met at Cilgerran on 2/12/16. Minutes were taken and are kept in the island files.
Friends of Skokholm and Skomer The Friends of Skokholm and Skomer committee meeting was held on the 13th of February which was attended by the Wardens. The Friends reunion was held the next day and was another great success. The ‘friends’ also helped organise an autumn work party to build two new public hides and helped man the shearwater week in September.
Marine Conservation Zone MCZ Especially strong links are maintained with NRW staff at the MCZ office at Martin’s Haven. The MCZ team are extremely generous and helpful to the island and we would not be able to run so smoothly without them.
Natural Resources Wales (NRW) The island has obvious and important links with NRW. Mike Alexander and Chris Lawrence provided invaluable help and advice to the island wardens with regards the management plan and permissions and licencing.
Dale Sailing Another great year working with Dale Sailing. A year which saw Gareth Reynolds take on even more responsibilities and Kenny Gainfort retire after 25 years of service.
Others Links were maintained with a wide range of external groups including NRW, the National Trust, Pembrokeshire Coast National Park Authority, the RSPB (especially Greg and Lisa Morgan on Ramsey) and H.M. Coastguards. Cooperative work was also undertaken between WTSWW and the Pembs Ringing Group.

39
9 Acknowledgements Thanks go to many parties and individuals that helped with the successful running of Skomer Island in 2016. Apologies to anyone left off this inevitably incomplete list. Many thanks go to all staff and volunteers (long-term, work party and weekly volunteers and anyone drafted in at last minute to get us out of trouble), staff at the MCZ (especially Mark Burton) and Dale Sailing (Carl, Pete, Phil, Derek, Jamie, Gareth and John Reynolds in particular), Lizzie Wilberforce (Conservation Manager for WTSWW), Gina Gavigan, all staff at Cilgerran and Tondu, Lucy and Sash Tusa, Anna and Steve Sutcliffe, The Friends of Skokholm and Skomer, all contractors and volunteers (especially Henry Lloyd who is our volunteer electrician), all members of the ICAC and other helpful wildlife consultants, Dave Astins, Andy Davies and Hester Clack who ran birdwatching, photography and yoga workshops respectively, staff and students at Oxford (especially everyone who helped with Shearwater week), Sheffield and Gloucestershire Universities and finally to all of the visitors that came and enjoyed the wonderful wildlife of our very special island.