wildlife trade cambodia
TRANSCRIPT
CAMBODIA’S LATEST KILLING FIELDS
MM OO NN II TTOO RR II NN GG TT HH EE WW II LL DD LL II FF EE TTRR AA DD EE
JJ UU LLYY 2200 00 11 –– DD EE CC EE MM BB EE RR 22 00 00 33
BB yy MM aa tt tt hh ee ww JJ ee ff ff ee rr yy 22 00 00 44
1
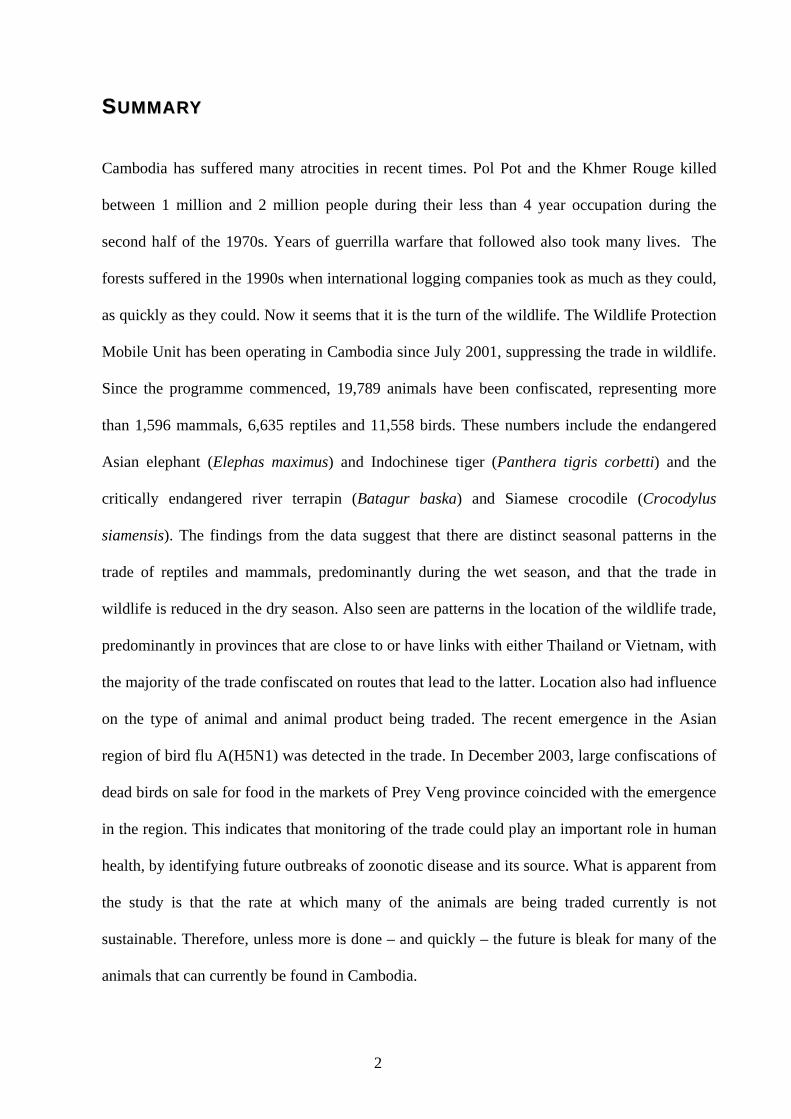
SSUUMMMMAARRYY
Cambodia has suffered many atrocities in recent times. Pol Pot and the Khmer Rouge killed
between 1 million and 2 million people during their less than 4 year occupation during the
second half of the 1970s. Years of guerrilla warfare that followed also took many lives. The
forests suffered in the 1990s when international logging companies took as much as they could,
as quickly as they could. Now it seems that it is the turn of the wildlife. The Wildlife Protection
Mobile Unit has been operating in Cambodia since July 2001, suppressing the trade in wildlife.
Since the programme commenced, 19,789 animals have been confiscated, representing more
than 1,596 mammals, 6,635 reptiles and 11,558 birds. These numbers include the endangered
Asian elephant (Elephas maximus) and Indochinese tiger (Panthera tigris corbetti) and the
critically endangered river terrapin (Batagur baska) and Siamese crocodile (Crocodylus
siamensis). The findings from the data suggest that there are distinct seasonal patterns in the
trade of reptiles and mammals, predominantly during the wet season, and that the trade in
wildlife is reduced in the dry season. Also seen are patterns in the location of the wildlife trade,
predominantly in provinces that are close to or have links with either Thailand or Vietnam, with
the majority of the trade confiscated on routes that lead to the latter. Location also had influence
on the type of animal and animal product being traded. The recent emergence in the Asian
region of bird flu A(H5N1) was detected in the trade. In December 2003, large confiscations of
dead birds on sale for food in the markets of Prey Veng province coincided with the emergence
in the region. This indicates that monitoring of the trade could play an important role in human
health, by identifying future outbreaks of zoonotic disease and its source. What is apparent from
the study is that the rate at which many of the animals are being traded currently is not
sustainable. Therefore, unless more is done – and quickly – the future is bleak for many of the
animals that can currently be found in Cambodia.
2
CC OO NN TT EE NN TT SUMMARY ....................................................................................................................................2 SUMMARYINTRODUCTION ...........................................................................................................................4 INTRODUCTION
Trade in the Global Context ......................................................................................................4 Trade in the Asian Region.........................................................................................................7 Cambodia................................................................................................................................8
AIMS ..............................................................................................................................................9 Background on Cambodia ...............................................................................................10
The Killing Fields ............................................................................................................11 The Country Today.........................................................................................................12
Road Map of Cambodia.....................................................................................................15 Environment background.................................................................................................16
Climate...............................................................................................................................16 Laws Past and Present .................................................................................................19
Aspects of the Wildlife Trade .................................................................................................20 Fashion and Decor Trade .............................................................................................20 The Pet Trade...................................................................................................................21 Consumption/Bushmeat Trade...................................................................................23 Traditional Chinese Medicine (TCM) .........................................................................24 Prayer Release Trade ....................................................................................................25
METHODOLOGY .......................................................................................................................26 METHODOLOGYData Gathering ....................................................................................................................26 Data Interpretation .............................................................................................................26 Calculations .........................................................................................................................27
RESULTS ...................................................................................................................................28 RESULTS1. Provinces and Places ................................................................................................28
Results and Discussion ................................................................................................31 2. Results on Animal Confiscations...........................................................................34
Results and Discussion ................................................................................................36 3. Building a Seasonal Picture ....................................................................................38 Reptiles .................................................................................................................................38 Freshwater Turtles .............................................................................................................39 Tortoises ...............................................................................................................................40 Snakes and Lizards............................................................................................................41
Discussion on Reptile Seasonal Trends ..................................................................41 Mammals...............................................................................................................................45
Mammal Results and Discussion...............................................................................46 Birds.......................................................................................................................................48
Discussion on Birds ......................................................................................................49 DISCUSSION AND CONCLUSION ........................................................................................51 D CISCUSSION AND ONCLUSION
ACKNOWLEDGEMENTS............................................................................................................58 ACKNOWLEDGEMENTSREFERENCE.................................................................................................................................59 REFERENCE
APPENDIX I ..............................................................................................................................63 APPENDIX II .............................................................................................................................66 A IIPPENDIXAPPENDIX III ............................................................................................................................68 A IIIPPENDIX
3
IINNTTRROODDUUCCTTIIOONN II
Trade in the Global Context Trade in the Global Context
The trade in wildlife and wildlife products is an ever-expanding
global problem. Many living in the West consider the trade in
wildlife to be an issue with developing countries. However, there
is not a country in the world that is not somehow connected or
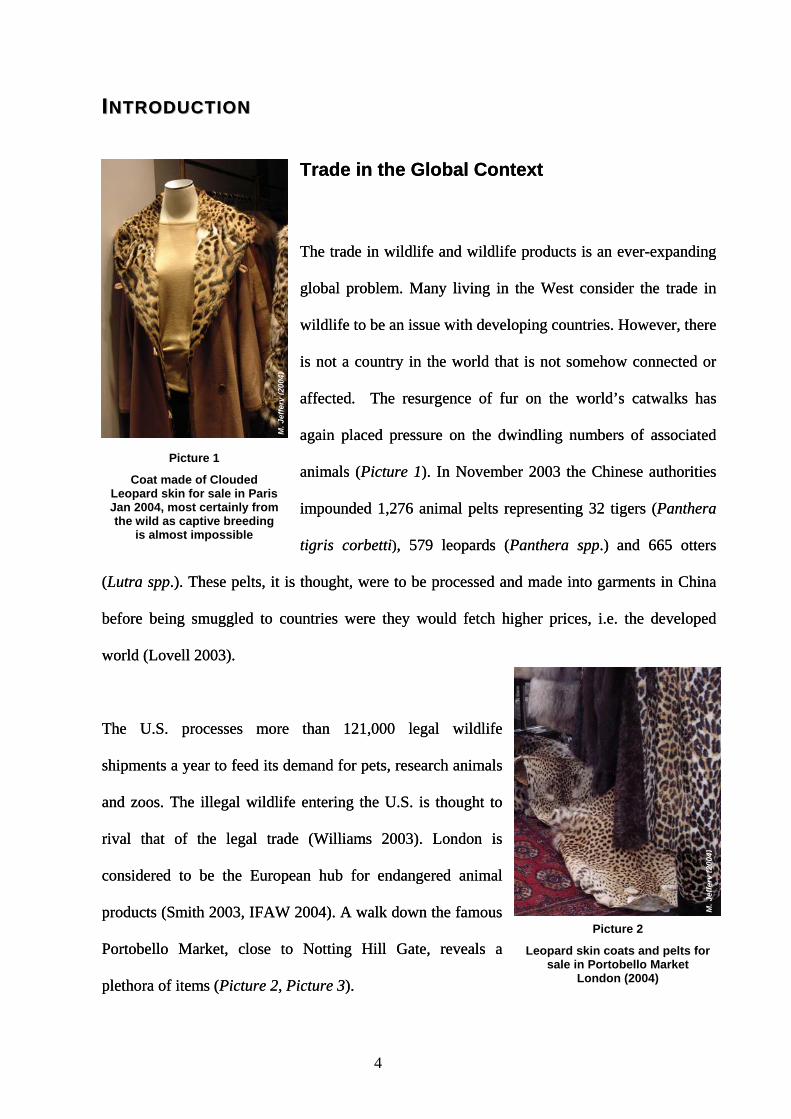
affected. The resurgence of fur on the world’s catwalks has
again placed pressure on the dwindling numbers of associated
animals (Picture 1). In November 2003 the Chinese authorities
impounded 1,276 animal pelts representing 32 tigers (Panthera
tigris corbetti), 579 leopards (Panthera spp.) and 665 otters
(Lutra spp.). These pelts, it is thought, were to be processed and made into garments in China
before being smuggled to countries were they would fetch higher prices, i.e. the developed
world (Lovell 2003).
The trade in wildlife and wildlife products is an ever-expanding
global problem. Many living in the West consider the trade in
wildlife to be an issue with developing countries. However, there
is not a country in the world that is not somehow connected or
affected. The resurgence of fur on the world’s catwalks has
again placed pressure on the dwindling numbers of associated
animals (Picture 1). In November 2003 the Chinese authorities
impounded 1,276 animal pelts representing 32 tigers (
The U.S. processes more than 121,000 legal wildlife
shipments a year to feed its demand for pets, research animals
and zoos. The illegal wildlife entering the U.S. is thought to
rival that of the legal trade (Williams 2003). London is
considered to be the European hub for endangered animal
products (Smith 2003, IFAW 2004). A walk down the famous
Portobello Market, close to Notting Hill Gate, reveals a
plethora of items (Picture 2, Picture 3).
The U.S. processes more than 121,000 legal wildlife
shipments a year to feed its demand for pets, research animals
and zoos. The illegal wildlife entering the U.S. is thought to
rival that of the legal trade (Williams 2003). London is
considered to be the European hub for endangered animal
products (Smith 2003, IFAW 2004). A walk down the famous
Portobello Market, close to Notting Hill Gate, reveals a
plethora of items (Picture 2,
) )
NNTTRROODDUUCCTTIIOONN
M. J
effe
ry (2
004)
Panthera
tigris corbetti), 579 leopards (Panthera spp.) and 665 otters
(Lutra spp.). These pelts, it is thought, were to be processed and made into garments in China
before being smuggled to countries were they would fetch higher prices, i.e. the developed
world (Lovell 2003).
Picture 1
Coat made of Clouded Leopard skin for sale in Paris Jan 2004, most certainly from the wild as captive breeding
is almost impossible
M. J
effe
ry (2
004)
Picture 2
Leopard skin coats and pelts for sale in Portobello Market
London (2004) Picture 3).
4
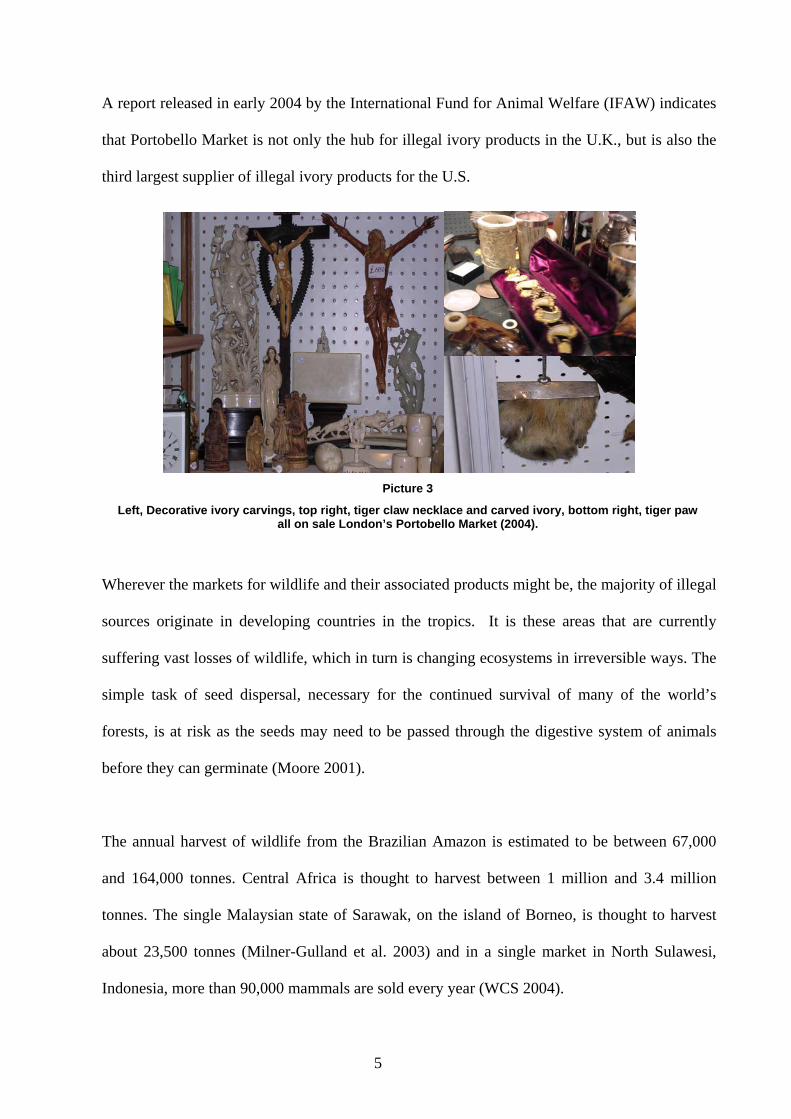
A report released in early 2004 by the International Fund for Animal Welfare (IFAW) indicates
that Portobello Market is not only the hub for illegal ivory products in the U.K., but is also the
third largest supplier of illegal ivory products for the U.S.
M. J
effe
ry (2
004)
Picture 3
Left, Decorative ivory carvings, top right, tiger claw necklace and carved ivory, bottom right, tiger paw all on sale London’s Portobello Market (2004).
Wherever the markets for wildlife and their associated products might be, the majority of illegal
sources originate in developing countries in the tropics. It is these areas that are currently
suffering vast losses of wildlife, which in turn is changing ecosystems in irreversible ways. The
simple task of seed dispersal, necessary for the continued survival of many of the world’s
forests, is at risk as the seeds may need to be passed through the digestive system of animals
before they can germinate (Moore 2001).
The annual harvest of wildlife from the Brazilian Amazon is estimated to be between 67,000
and 164,000 tonnes. Central Africa is thought to harvest between 1 million and 3.4 million
tonnes. The single Malaysian state of Sarawak, on the island of Borneo, is thought to harvest
about 23,500 tonnes (Milner-Gulland et al. 2003) and in a single market in North Sulawesi,
Indonesia, more than 90,000 mammals are sold every year (WCS 2004).
5

The economics of the global trade in illegal wildlife and wildlife products is thought to rival
that of the illegal drug trade. It is therefore not surprising that the two illegal industries are often
run by the same people (Pendry 2002, Coren 2004). The legal trade in exotic wildlife in the
U.S. alone is thought to be around US$20 billion annually (Williams 2003), and in a single
province in Laos, Southeast Asia, it is estimated that US$3.6 million of wildlife is exported
annually. This is a remarkable amount as the gross domestic product for the entire country is
US$1 billion (WCS 2004).
Other less evident aspects of the trade in wildlife have emerged recently, highlighting the shear
scale of the problems. In 2003 the importation of rodents from Western Africa to the U.S.
brought with it the zoonotic virus monkeypox, which infected more than 80 people (Giulio and
Eckburg 2004, Gross 2003). That same year also saw the emergence of SARS (Severe Acute
Respiratory Syndrome) from the wildlife markets in the Guangdong province, China. This
prompted the World Health Organisation (WHO) to issue a global health alert, the first in more
than a decade (Kuiken et al. 2003). SARS infected more than 8,400 people in over 30 countries
and killed more than 900 (www.who.int). These epidemics have forced many countries to
tighten their laws and enforcement of wildlife trade and wildlife crime. The U.S. has stopped
the importation of certain rodent species from Western Africa (Giulio and Eckburg 2004).
Vietnam has declared that it will strive to stop illegal wildlife trafficking by 2010 (Financial
Times 2004), and China culled more than 10,000 civet cats (Paguma larvata) and other species
associated with SARS on its re-emergence in 2004 (Watts 2004, Normile 2004). However,
despite the link between SARS and the consumption of wildlife, Guangdong has reopened its
wildlife markets and plans to “aggressively develop the farming of wild animals to provide
more products to meet market needs” (Reuters 2004).
6
Trade in the Asian Region
Population growth across Asia has boomed since the 1950s (Cohen 2003). As the population
grows, so does its demands for medicine and nutrition. In this part of the world this means
wildlife and wildlife products. In Hong Kong in December 2001, 9,300 live turtles were seized,
the largest in Hong Kong history, thought to have been on route from Singapore to China.
Again in China during March of the same year, a further 9,000 freshwater turtles were
confiscated (Traffic 2002). Thailand reported the seizure of 3,000 pangolins (Manis javanica)
alone in 2002, and in a six-week operation in 2003 more than 33,000 animals, including bears
(both Asiatic black bear (Ursus thibetanus) and the Malyasian sun bear (Helarctos
malayanus)), tigers (Panthera tigris corbetti) and orang-utan (Pongo pygmaeus), were
recovered (Nakashima 2003). In Vietnam during February 2003, 2.6 tonnes of monitor lizards
(Varanus spp.) were discovered aboard a flight from Malaysia. Later that same month nearly 4
tonnes of iguanas and pangolins were intercepted, and in early March, 4,889kg of turtles were
discovered (Traffic 2003). Over the last 40 years in Vietnam 12 species of large mammal have
become extinct or nearly extinct due to hunting and the wildlife trade (WCS 2004, Coren 2004).
All of the above reported cases highlight the vastness in scale that the trade in wildlife
represents in the region. It also contains limited information. Most of the seizures were made
while the animals were en route, and therefore their exact origins remain unknown. This
prevents vital information being shared between countries in the region, necessary to curb the
extraction of the animals from the wild. Cambodia, however, is one country in the region that
is striving to change this.
7
Cambodia
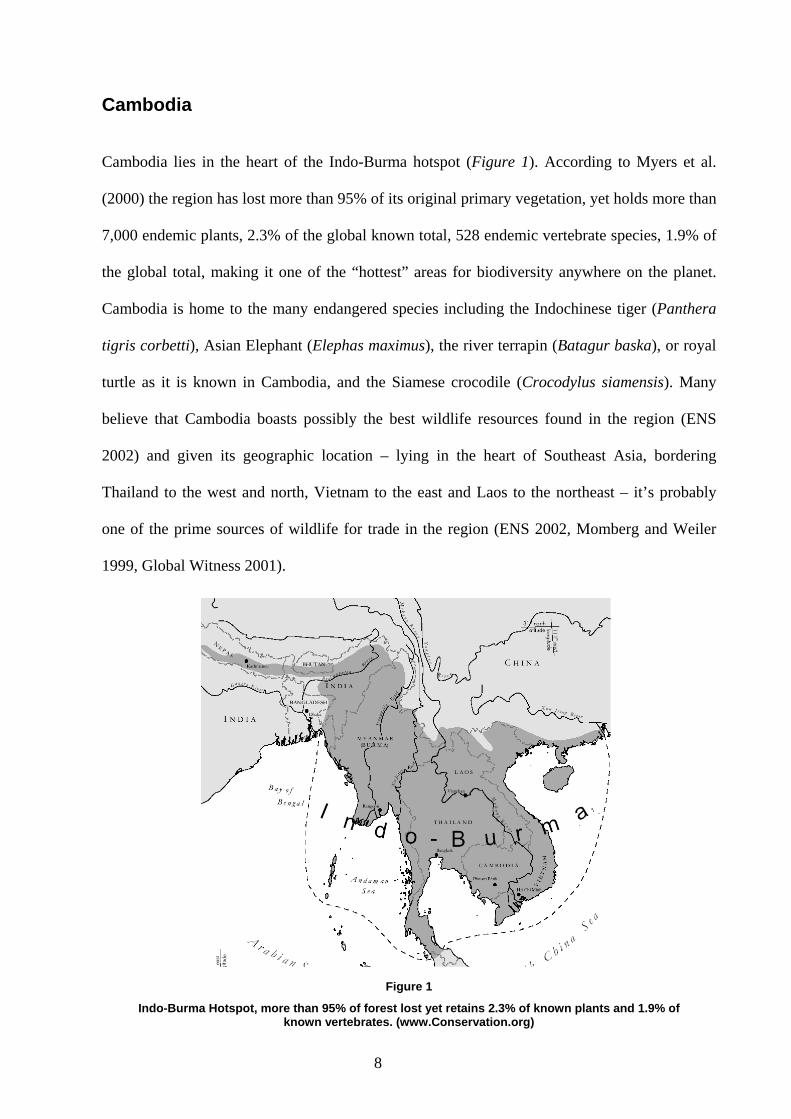
Cambodia lies in the heart of the Indo-Burma hotspot (Figure 1). According to Myers et al.
(2000) the region has lost more than 95% of its original primary vegetation, yet holds more than
7,000 endemic plants, 2.3% of the global known total, 528 endemic vertebrate species, 1.9% of
the global total, making it one of the “hottest” areas for biodiversity anywhere on the planet.
Cambodia is home to the many endangered species including the Indochinese tiger (Panthera
tigris corbetti), Asian Elephant (Elephas maximus), the river terrapin (Batagur baska), or royal
turtle as it is known in Cambodia, and the Siamese crocodile (Crocodylus siamensis). Many
believe that Cambodia boasts possibly the best wildlife resources found in the region (ENS
2002) and given its geographic location – lying in the heart of Southeast Asia, bordering
Thailand to the west and north, Vietnam to the east and Laos to the northeast – it’s probably
one of the prime sources of wildlife for trade in the region (ENS 2002, Momberg and Weiler
1999, Global Witness 2001).
Figure 1
Indo-Burma Hotspot, more than 95% of forest lost yet retains 2.3% of known plants and 1.9% of known vertebrates. (www.Conservation.org)
8
In an attempt to curb and eventually halt the wildlife trade in Cambodia the government, with
the aid of Washington-based, non-governmental organisation (NGO) WildAid, has set up a
team dedicated to halting the trade in wildlife and wildlife products. The team, known as the
Wilderness Protection Mobile Unit (WPMU), constitute both multi-discipline personnel from
various governmental departments and WildAid advisors. They have been active since July
2001, operating across the country, confiscating wildlife and upholding the wildlife laws.
This project represents the data collected on the confiscation made by the WPMU between July
2001 and December 2003.
AIMS
• It is important for both the government and NGOs to have figures on animals being
traded. It is the only way to gain a true perspective on the wildlife trade issues within the
country. By separating the animal types – bird, mammal and reptile – it should be
possible to assess the impacts for particular groups of animals and see if there is any
difference in their trade over the calendar year.
• As with all organisations, training of staff plays an important role in the running and
success of the project. Therefore, periods of the year that see a reduction in wildlife
crime activity should be favoured for training and other activities that see a reduction in
staff numbers. By looking at the trade over the calendar year it is hoped that periods of
time will be identified that would allow for these activities.
9
• It is always important to understand the trade hotspots and routes in the country. By
taking a look at the areas where the confiscations have been made and what type of
animals were confiscated, we may be able to identify those areas that pose the greater
threat, allowing the WPMU to channel resources into areas of greatest concern.
Background on Cambodia
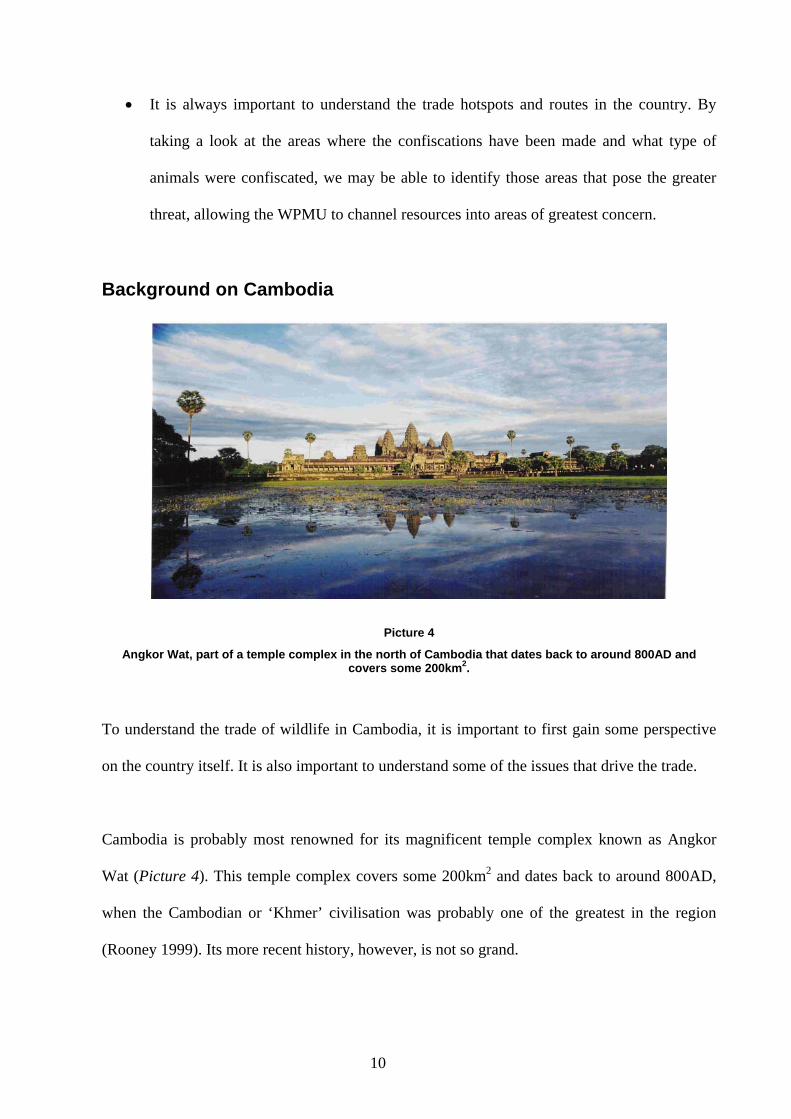
Picture 4
Angkor Wat, part of a temple complex in the north of Cambodia that dates back to around 800AD and covers some 200km2.
To understand the trade of wildlife in Cambodia, it is important to first gain some perspective
on the country itself. It is also important to understand some of the issues that drive the trade.
Cambodia is probably most renowned for its magnificent temple complex known as Angkor
Wat (Picture 4). This temple complex covers some 200km2 and dates back to around 800AD,
when the Cambodian or ‘Khmer’ civilisation was probably one of the greatest in the region
(Rooney 1999). Its more recent history, however, is not so grand.
10
The Killing Fields
Cambodia was once a French colony, rich in custom and beauty. In 1953 Cambodia gained
independence from the French and its future as a prosperous nation looked bright. However, the
Vietnam War in the 1960s changed this optimistic view. During this extremely complex period
in the region’s history, the Khmer Rouge, a Maoist rebel group, was formed. By 1975 the
Khmer Rouge had taken control of the capital Phnom Penh. The leader of the Khmer Rouge,
Pol Pot, proclaimed himself prime minister in 1976. There he remained in power until 1979
when the Vietnamese invaded Cambodia, pushing the Khmer Rouge back into the countryside
where they fought a guerrilla war until the death of Pol Pot in 1998. The Vietnamese formally
withdrew from Cambodia in 1989 which allowed the United Nations Transitional Authority in
Cambodia (UNTAC) to restore democracy and peace (Bizot 2003). Although this is an
extremely simplified version of events, it should allow for some understanding into the
extremely turbinate time the Cambodian people have been subject to over the last 35 years.
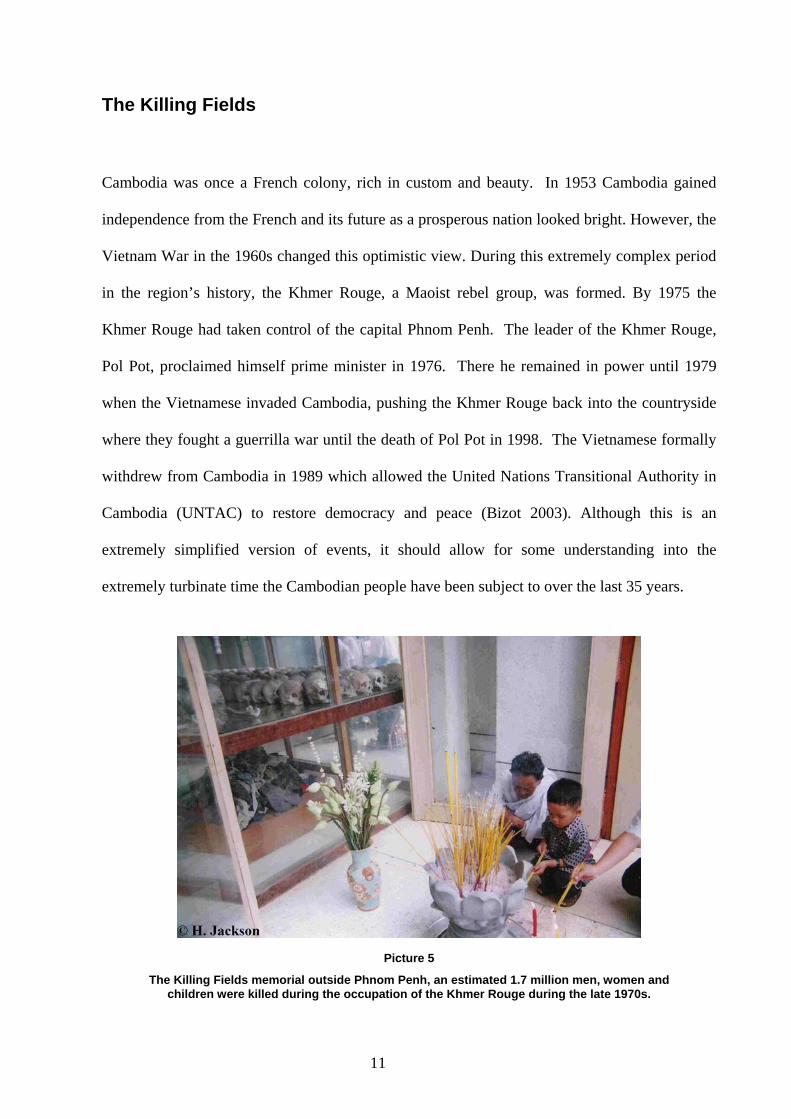
Picture 5
The Killing Fields memorial outside Phnom Penh, an estimated 1.7 million men, women and children were killed during the occupation of the Khmer Rouge during the late 1970s.
11

While the Khmer Rouge were in power they are thought to have executed, tortured and
murdered between 1 million and 2 million men, women and children while transforming the
country in to their vision of an agrarian utopia. Money was abolished, as was religion and
private property, the cities were emptied of people and anybody thought to be intelligent was
killed (BBC 2000). During this period those who were forced into the countryside or work
camps had to fend for themselves using the forests and wildlife as the only source of nutrition
and medicine. These natural resources were also used by the Khmer Rouge for funding, as they
sold wildlife and timber to Thailand (www.globalwitness.org).
The Country Today
Cambodia’s territory consists of 181,000 km2, which are divided among 24 provinces (figure
2). Phnom Penh, lies at the junction of the Mekong River and the Tonle Sap River, a major
tributary. The Mekong River runs from the Himalayas to the north through China, Laos and
Thailand before entering Cambodia and exiting through Vietnam where it discharges into the
South China Sea. Therefore it has always acted as an important trade route between countries in
the region, and in the distant past allowed Cambodia to prosper.
The Cambodian people have their own language, known as Khmer. However due to the
country’s history many also speak French, Vietnamese and increasingly English, although it is
estimated that more than 70% of the population are illiterate. The current population is
estimated at 13 million with a 1.8% annual growth rate. Life expectancy is thought to be
younger than 60 years, partly due to the high HIV/AIDS rate.
12
More than 36% live below the poverty line, of which 90% are from rural communities. The
currency for the country is the Cambodian riel (Approx. 3,900 for $1) but most businesses use
U.S. dollars especially in the cities. The gross national income per capita is around US$290 per
annum (www.cia.gov), although the average governmental worker gets only US$360 or US$30
a month (Kea 2002). Over 90% rely on fire wood and charcoal to cook with and as few as 10%
of rural populations have access to electricity. More than one in every 380 people is an amputee
– the highest in the world – and one in every 250 is disabled in some way. Due to its turbulent
past the country has to rely on economic aid of about US$548 million (2001) annually from
international donors (www.cia.gov). Cambodia is one of the poorest nations in the region, and
therefore wildlife trade and other non-timber forest products represent one of the few ways
people (especially the rural communities) can exploit a free resource to gain income in this
impoverished country.
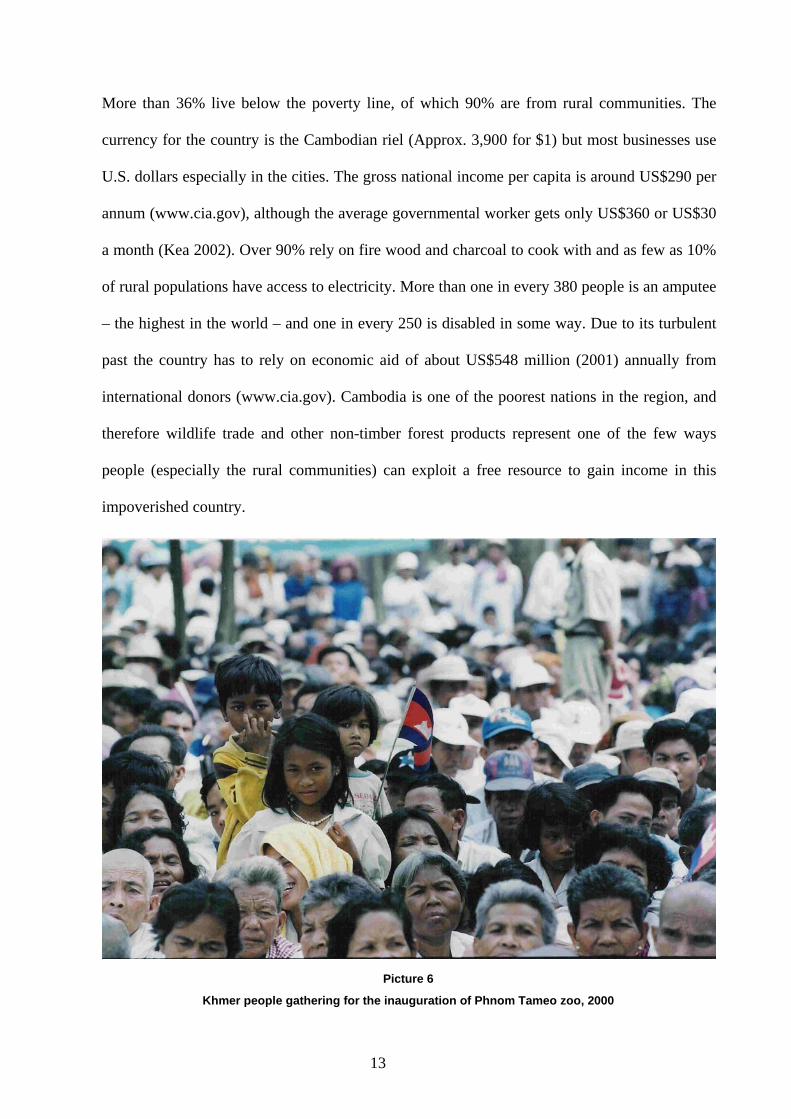
Picture 6
Khmer people gathering for the inauguration of Phnom Tameo zoo, 2000
13
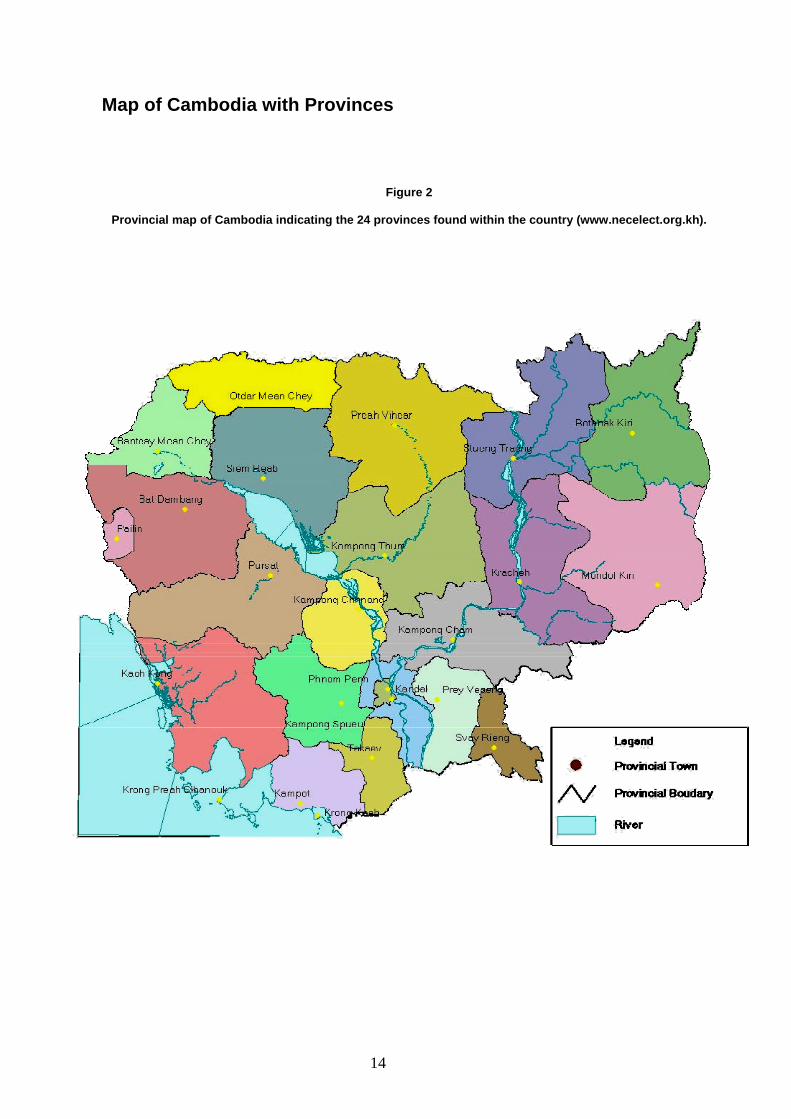
Map of Cambodia with Provinces
Figure 2 Provincial map of Cambodia indicating the 24 provinces found within the country (www.necelect.org.kh).
14
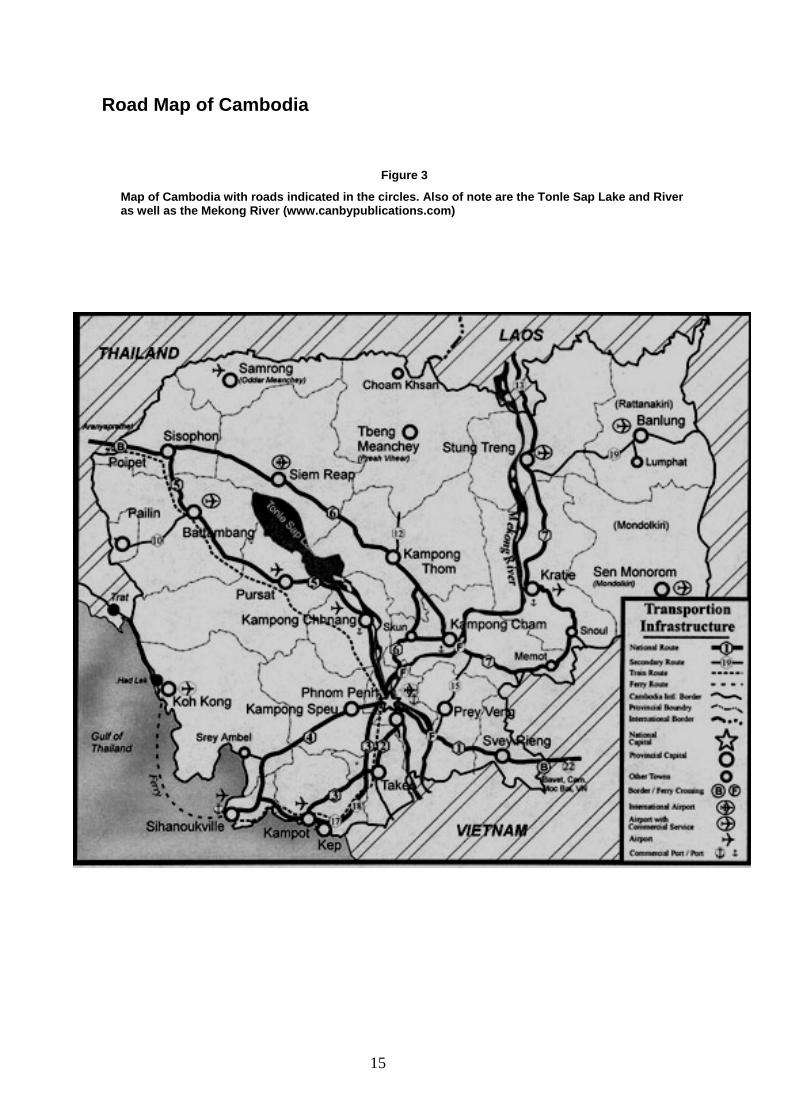
Road Map of Cambodia
Figure 3
Map of Cambodia with roads indicated in the circles. Also of note are the Tonle Sap Lake and River as well as the Mekong River (www.canbypublications.com)
15
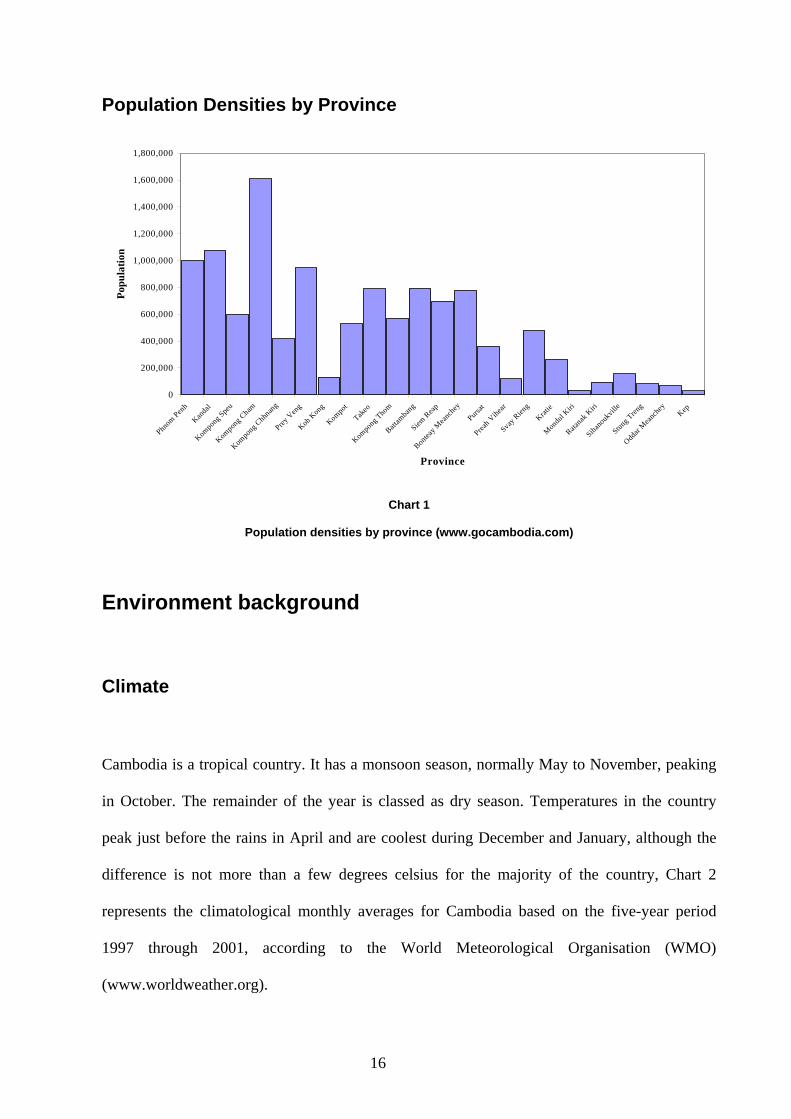
Population Densities by Province
0
200,000
400,000
600,000
800,000
1,000,000
1,200,000
1,400,000
1,600,000
1,800,000
Phnom Pen
h
Kanda
l
Kompon
g Spe
u
Kompon
g Cham
Kompo
ng Chhn
ang
Prey V
eng
Koh K
ong
Kompot
Takeo
Kompo
ng Tho
m
Battam
bang
Siem R
eap
Bontea
y Mea
nchey
Pursat
Preah V
ihear
Svay R
ieng
Kratie
Mon
dul K
iri
Ratanak
Kiri
Sihanouk
ville
Stung Tren
g
Oddar
Meanc
hey
Kep
Province
Popu
latio
n
Chart 1
Population densities by province (www.gocambodia.com)
Environment background
Climate
Cambodia is a tropical country. It has a monsoon season, normally May to November, peaking
in October. The remainder of the year is classed as dry season. Temperatures in the country
peak just before the rains in April and are coolest during December and January, although the
difference is not more than a few degrees celsius for the majority of the country, Chart 2
represents the climatological monthly averages for Cambodia based on the five-year period
1997 through 2001, according to the World Meteorological Organisation (WMO)
(www.worldweather.org).
16
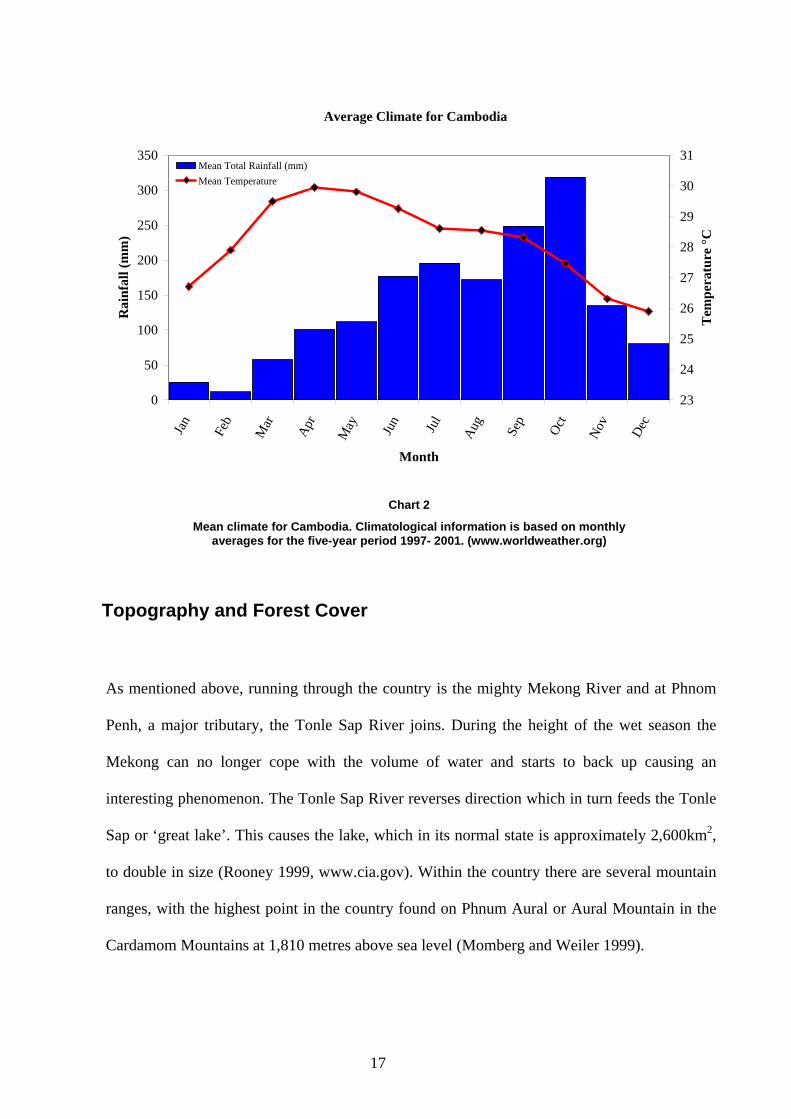
Average Climate for Cambodia
0
50
100
150
200
250
300
350Ja
n
Feb
Mar
Apr
May Jun Jul
Aug
Sep
Oct
Nov
Dec
Month
Rai
nfal
l (m
m)
23
24
25
26
27
28
29
30
31
Tem
pera
ture
°C
Mean Total Rainfall (mm)Mean Temperature
Chart 2
Mean climate for Cambodia. Climatological information is based on monthly averages for the five-year period 1997- 2001. (www.worldweather.org)
Topography and Forest Cover
As mentioned above, running through the country is the mighty Mekong River and at Phnom
Penh, a major tributary, the Tonle Sap River joins. During the height of the wet season the
Mekong can no longer cope with the volume of water and starts to back up causing an
interesting phenomenon. The Tonle Sap River reverses direction which in turn feeds the Tonle
Sap or ‘great lake’. This causes the lake, which in its normal state is approximately 2,600km2,
to double in size (Rooney 1999, www.cia.gov). Within the country there are several mountain
ranges, with the highest point in the country found on Phnum Aural or Aural Mountain in the
Cardamom Mountains at 1,810 metres above sea level (Momberg and Weiler 1999).
17
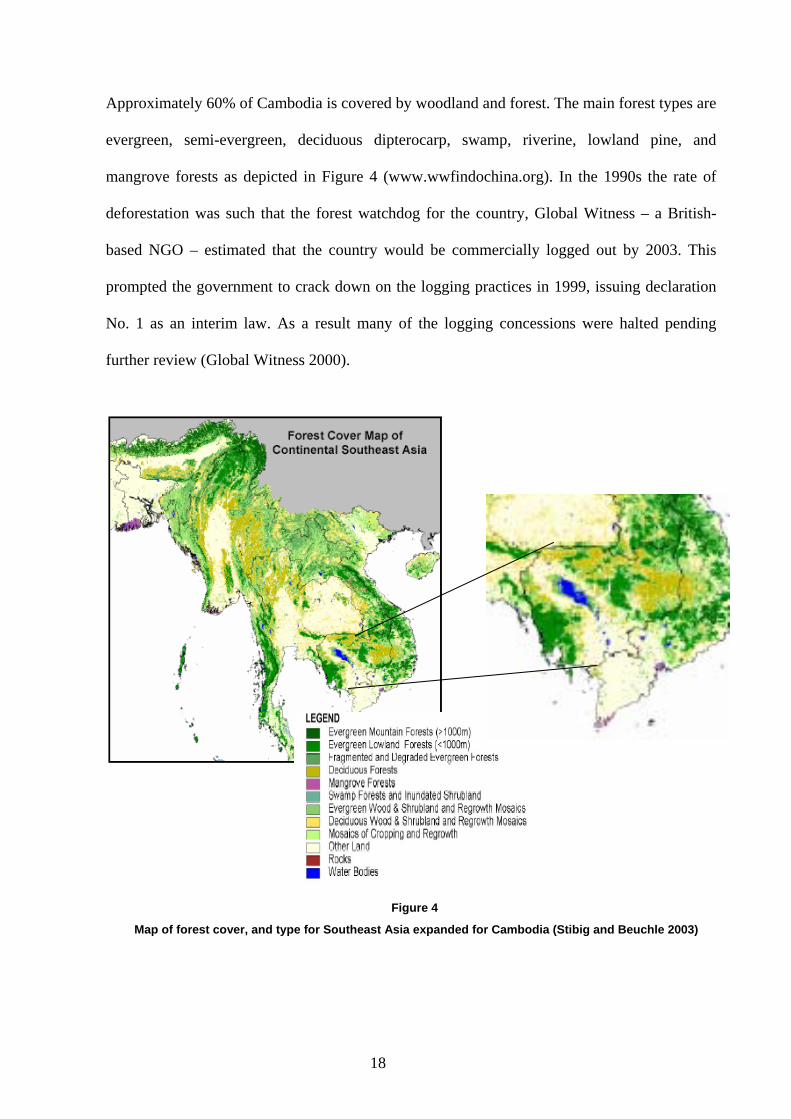
Approximately 60% of Cambodia is covered by woodland and forest. The main forest types are
evergreen, semi-evergreen, deciduous dipterocarp, swamp, riverine, lowland pine, and
mangrove forests as depicted in Figure 4 (www.wwfindochina.org). In the 1990s the rate of
deforestation was such that the forest watchdog for the country, Global Witness – a British-
based NGO – estimated that the country would be commercially logged out by 2003. This
prompted the government to crack down on the logging practices in 1999, issuing declaration
No. 1 as an interim law. As a result many of the logging concessions were halted pending
further review (Global Witness 2000).
Figure 4
Map of forest cover, and type for Southeast Asia expanded for Cambodia (Stibig and Beuchle 2003)
18
Laws Past and Present
In July 2002 the government passed its first law on forestry in the country. Within the forestry
law is a subsection on wildlife, the first significant legally binding piece of legislation
protecting the wildlife of Cambodia (Appendix II). It outlaws all hunting and trade in wildlife
unless licence is given by the Department of Forestry and Wildlife (DFW). The law also gives
the DFW policing authority and allows for fines and imprisonment for people violating these
laws. Until this point there had only been a clause in declaration No. 1 issued in 1999 to curb
the rampant illegal logging, whereby “the catching, hunting and transporting of all types of
wildlife must be completely suppressed. Markets where wildlife is brought or sold are to be
demolished”. However, this declaration was rarely upheld, other than gestures from the relevant
governmental bodies that were often also involved in the trade (Global Witness 2000). One
such gesture was the closing and destruction of the Sre Klong wildlife market along Road 4,
which connects Phnom Penh to the Sea Port of Sihanoukville. However, within days of the
crackdowns animals were on sale again (Global Witness 2001).
In the future there is to be a separate law for wildlife. It is currently under review by the
government and when implemented will bring even tighter control over the exploitation of
wildlife in the country (Global Witness 2001).
In addition to these national laws, Cambodia is also a signatory to the CITES agreement (Hean
2000). CITES – Convention on International Trade in Endangered Species of Wild Fauna and
Flora – is an international agreement between governments that aims to ensure that
international trade in specimens of wild animals and plants does not threaten their survival
(www.cites.org).
19
However, until recently this agreement did little to curb the international trade in wildlife. In
2000 the Cambodian Ministry of Agriculture Forestry and Fisheries (MAFF) allowed the export
of 360 wild-caught monkeys to breeding facilities in Vietnam. Since they were listed under the
CITES agreement, they should not have been allowed to be exported quite so easily (Global
Witness 2001).
Aspects of the Wildlife Trade
The trade in wildlife is extensive and complex. There are many different aspects to it, generated
by a demand put forward by different industries and people. Below are some of the types of
wildlife trade found within Cambodia.
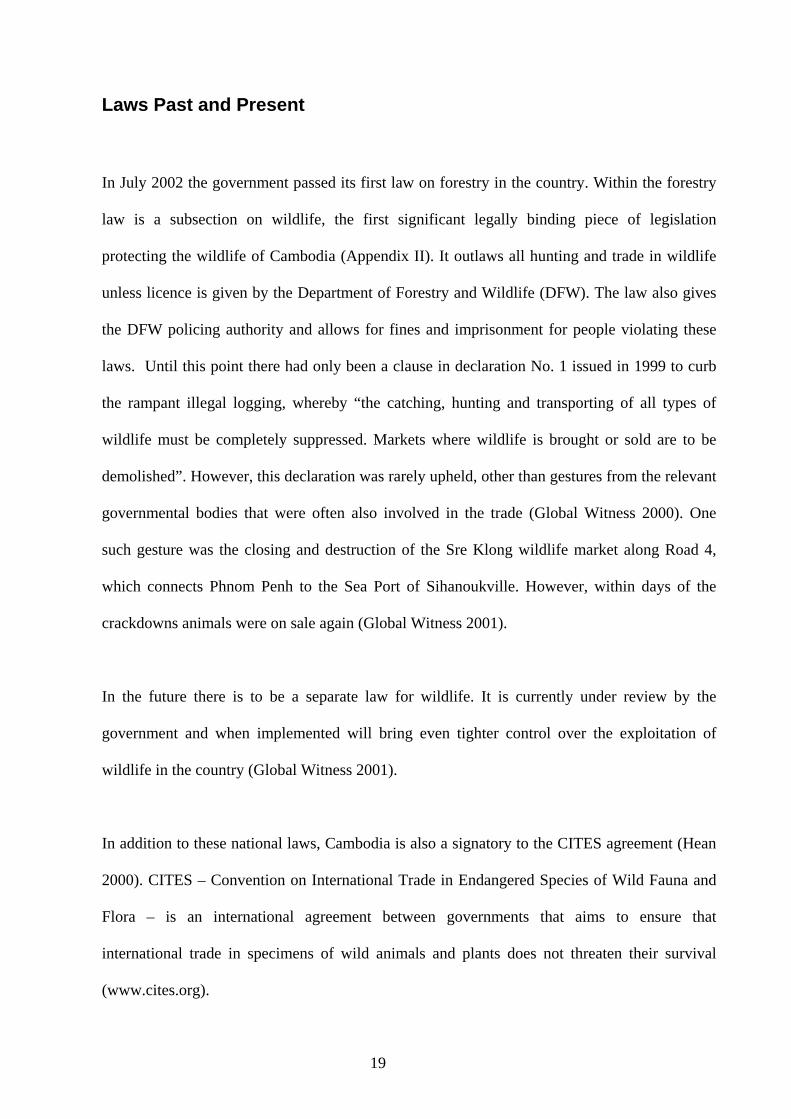
Fashion and Decor Trade
Already mentioned is the fashion industry that is threatening
the last remaining populations of tiger, clouded leopard and
other animals that are prized for their skin value. Jewellery
constitutes another large market. Many people think it macho
to wear bear claw or tiger tooth pendants. Bear and tiger
teeth, as well as ivory are often carved with the images of
Buddha, which are popular religious charms in Asia. Such
things as rings, earrings and necklaces are also carved from
ivory.
Picture 8
Tiger skins (Panthera tigris corbetti) drying in the sun in Phnom Penh
2001. Each was worth US$700-800 and was shot to order for foreign people.
20
M. J
effe
ry (2
001)
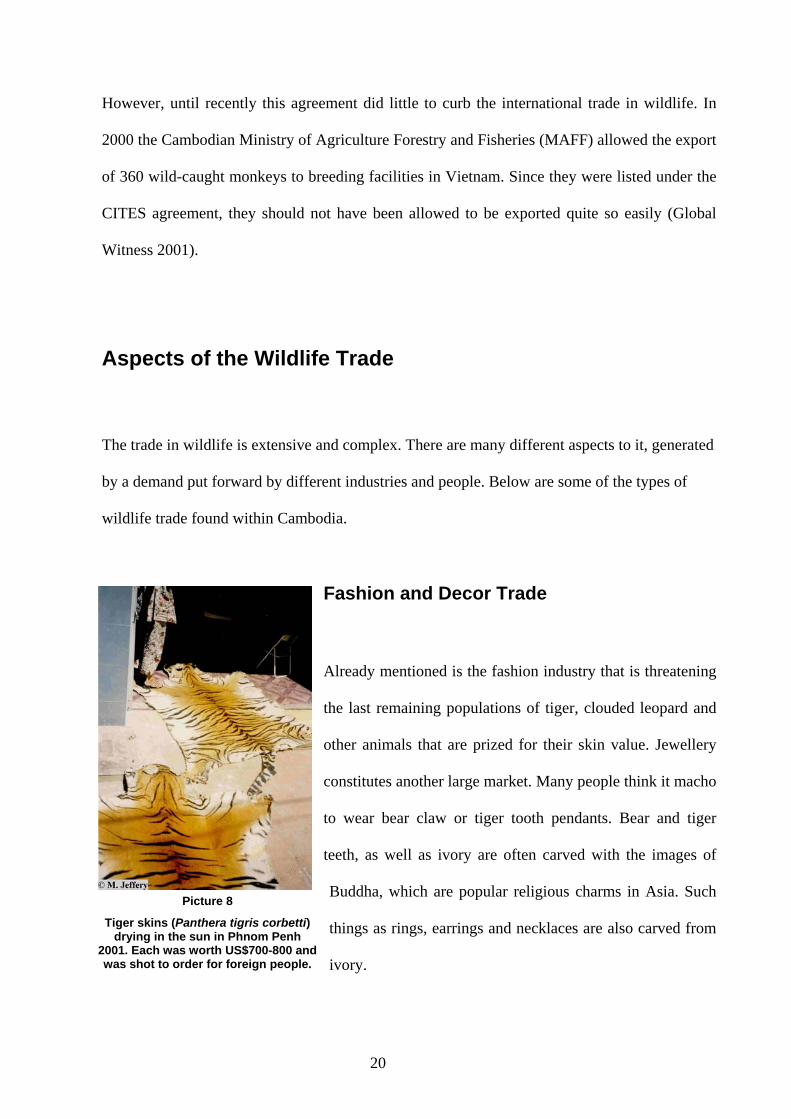
The interior decorating industry also consumes skins of
such things as tigers and leopards. Stuffed animals can
also be popular, as can wall-mounted trophies.
However, one of the most sought after ivory items for
many households is carved ivory figurines similar to
those in Picture 3. Elephant populations in Cambodia,
Laos and Vietnam between 1998 and 2000 are thought
to have declined by over 80%. This has been attributed
to the large economic returns that can be made from
their tusks, teeth and other body parts (Martin and
Stiles 2002).
M. J
effe
ry (2
000)
Picture 9
Shows a cabinet full of ivory products, part of a jewellery store in a market in
Phnom Penh 2001, carved figurines and jewellery in the top of the cabinet,
elephant bone, tooth and tusk, waiting to be carved in the base.
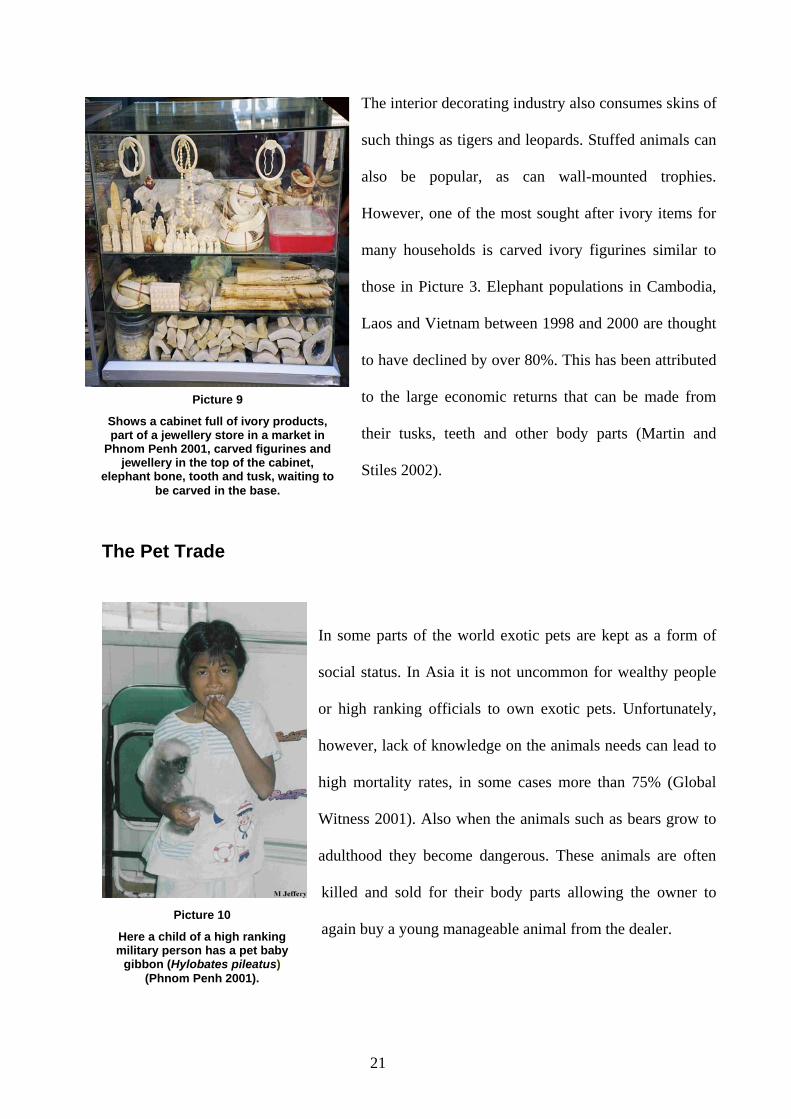
The Pet Trade
In some parts of the world exotic pets are kept as a form of
social status. In Asia it is not uncommon for wealthy people
or high ranking officials to own exotic pets. Unfortunately,
however, lack of knowledge on the animals needs can lead to
high mortality rates, in some cases more than 75% (Global
Witness 2001). Also when the animals such as bears grow to
adulthood they become dangerous. These animals are often
killed and sold for their body parts allowing the owner to
again buy a young manageable animal from the dealer. Picture 10
Here a child of a high ranking military person has a pet baby
gibbon (Hylobates pileatus) (Phnom Penh 2001).
21
However, it is often wealthy countries that drive the pet trade of rare
and endangered species, as they have the money to pay for them.
The rarer the species generally the higher the price it will fetch
(www.traffic.org).
Reptiles and birds are probably at greater risk, as the trading of these
animals across the world is relatively unregulated. Few are listed
under CITES and the more rapid means of international transport
allows for quicker ways to get animals to markets before they die
(www.traffic.org). Controversy over the recent discoveries of new
species of turtles from Asia was sparked when it emerged that they had been supplied by a
reptile dealer, who was indicted in the U.S. as a member of the world’s largest reptile
smuggling ring (Dalton 2003).
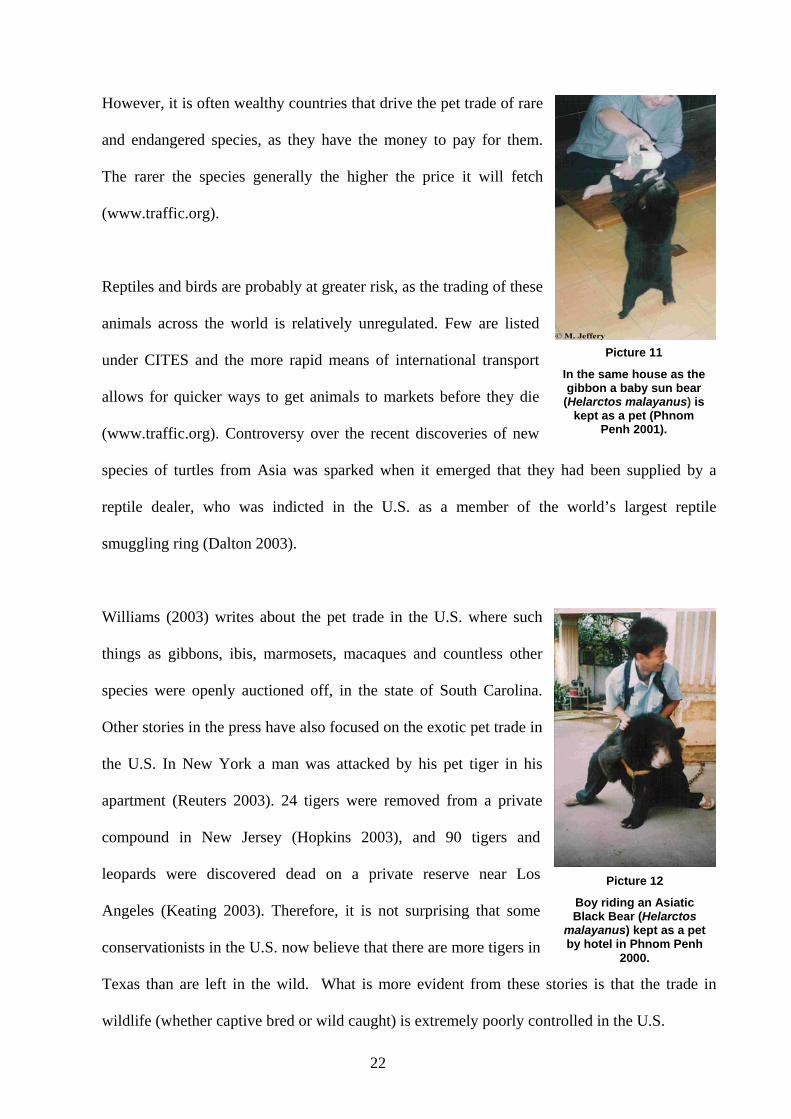
Picture 11
In the same house as the gibbon a baby sun bear
(Helarctos malayanus) is kept as a pet (Phnom
Penh 2001).
Williams (2003) writes about the pet trade in the U.S. where such
things as gibbons, ibis, marmosets, macaques and countless other
species were openly auctioned off, in the state of South Carolina.
Other stories in the press have also focused on the exotic pet trade in
the U.S. In New York a man was attacked by his pet tiger in his
apartment (Reuters 2003). 24 tigers were removed from a private
compound in New Jersey (Hopkins 2003), and 90 tigers and
leopards were discovered dead on a private reserve near Los
Angeles (Keating 2003). Therefore, it is not surprising that some
conservationists in the U.S. now believe that there are more tigers in
Texas than are left in the wild. What is more evident from these stories is that the trade in
wildlife (whether captive bred or wild caught) is extremely poorly controlled in the U.S.
Picture 12
Boy riding an Asiatic Black Bear (Helarctos
malayanus) kept as a pet by hotel in Phnom Penh
2000.
22
Entertainment also fuels the trade. It is not
uncommon to see performing macaques in
Phnom Penh. Private zoos and animal
attractions can raise funds by charging visitors.
Thailand has a thriving industry around its tiger
zoos and crocodile farms (Banks and Doherty
2001) and the stock for the majority of zoos
throughout the world at some point came from
the wild (Attenborough 2003).
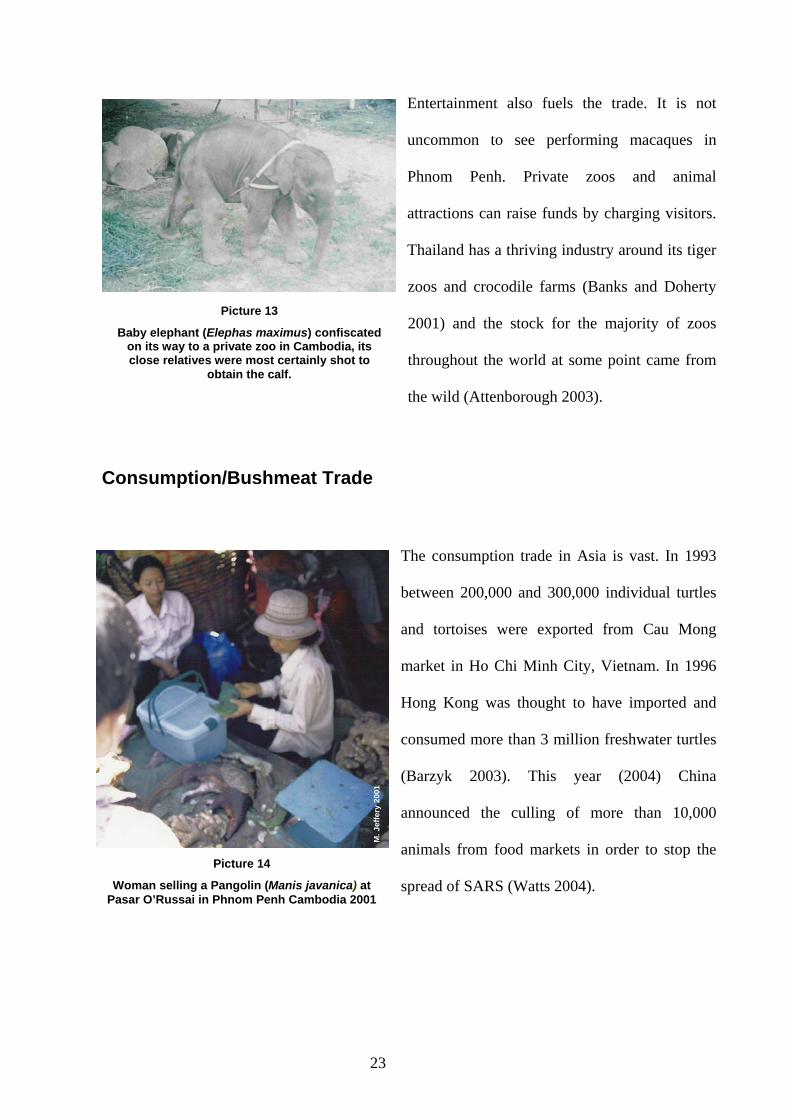
Picture 13
Baby elephant (Elephas maximus) confiscated on its way to a private zoo in Cambodia, its close relatives were most certainly shot to
obtain the calf.
Consumption/Bushmeat Trade
The consumption trade in Asia is vast. In 1993
between 200,000 and 300,000 individual turtles
and tortoises were exported from Cau Mong
market in Ho Chi Minh City, Vietnam. In 1996
Hong Kong was thought to have imported and
consumed more than 3 million freshwater turtles
(Barzyk 2003). This year (2004) China
announced the culling of more than 10,000
animals from food markets in order to stop the
spread of SARS (Watts 2004).
M. J
effe
ry 2
001
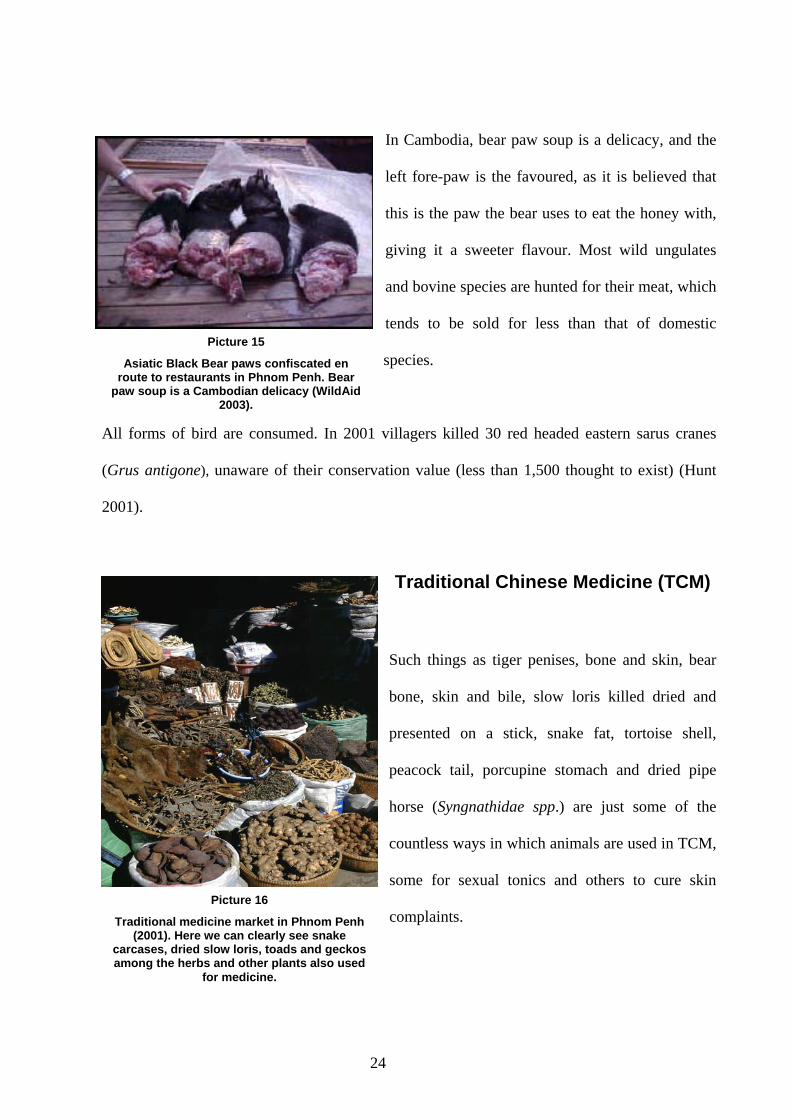
Picture 14
Woman selling a Pangolin (Manis javanica) at Pasar O’Russai in Phnom Penh Cambodia 2001
23
In Cambodia, bear paw soup is a delicacy, and the
left fore-paw is the favoured, as it is believed that
this is the paw the bear uses to eat the honey with,
giving it a sweeter flavour. Most wild ungulates
and bovine species are hunted for their meat, which
tends to be sold for less than that of domestic
species. Picture 15
Asiatic Black Bear paws confiscated en route to restaurants in Phnom Penh. Bear
paw soup is a Cambodian delicacy (WildAid 2003).
All forms of bird are consumed. In 2001 villagers killed 30 red headed eastern sarus cranes
(Grus antigone), unaware of their conservation value (less than 1,500 thought to exist) (Hunt
2001).
Traditional Chinese Medicine (TCM)
Such things as tiger penises, bone and skin, bear
bone, skin and bile, slow loris killed dried and
presented on a stick, snake fat, tortoise shell,
peacock tail, porcupine stomach and dried pipe
horse (Syngnathidae spp.) are just some of the
countless ways in which animals are used in TCM,
some for sexual tonics and others to cure skin
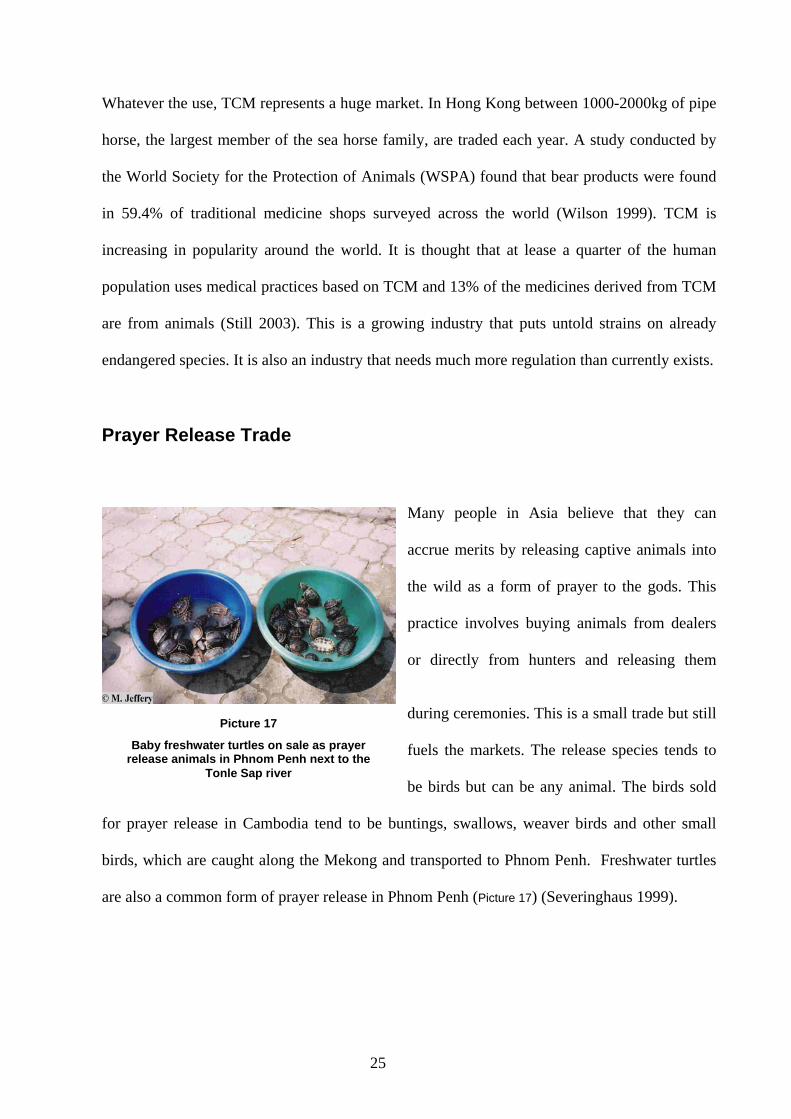
complaints. Picture 16
Traditional medicine market in Phnom Penh (2001). Here we can clearly see snake
carcases, dried slow loris, toads and geckos among the herbs and other plants also used
for medicine.
24
Whatever the use, TCM represents a huge market. In Hong Kong between 1000-2000kg of pipe
horse, the largest member of the sea horse family, are traded each year. A study conducted by
the World Society for the Protection of Animals (WSPA) found that bear products were found
in 59.4% of traditional medicine shops surveyed across the world (Wilson 1999). TCM is
increasing in popularity around the world. It is thought that at lease a quarter of the human
population uses medical practices based on TCM and 13% of the medicines derived from TCM
are from animals (Still 2003). This is a growing industry that puts untold strains on already
endangered species. It is also an industry that needs much more regulation than currently exists.
Prayer Release Trade
Many people in Asia believe that they can
accrue merits by releasing captive animals into
the wild as a form of prayer to the gods. This
practice involves buying animals from dealers
or directly from hunters and releasing them
during ceremonies. This is a small trade but still
fuels the markets. The release species tends to
be birds but can be any animal. The birds sold
for prayer release in Cambodia tend to be buntings, swallows, weaver birds and other small
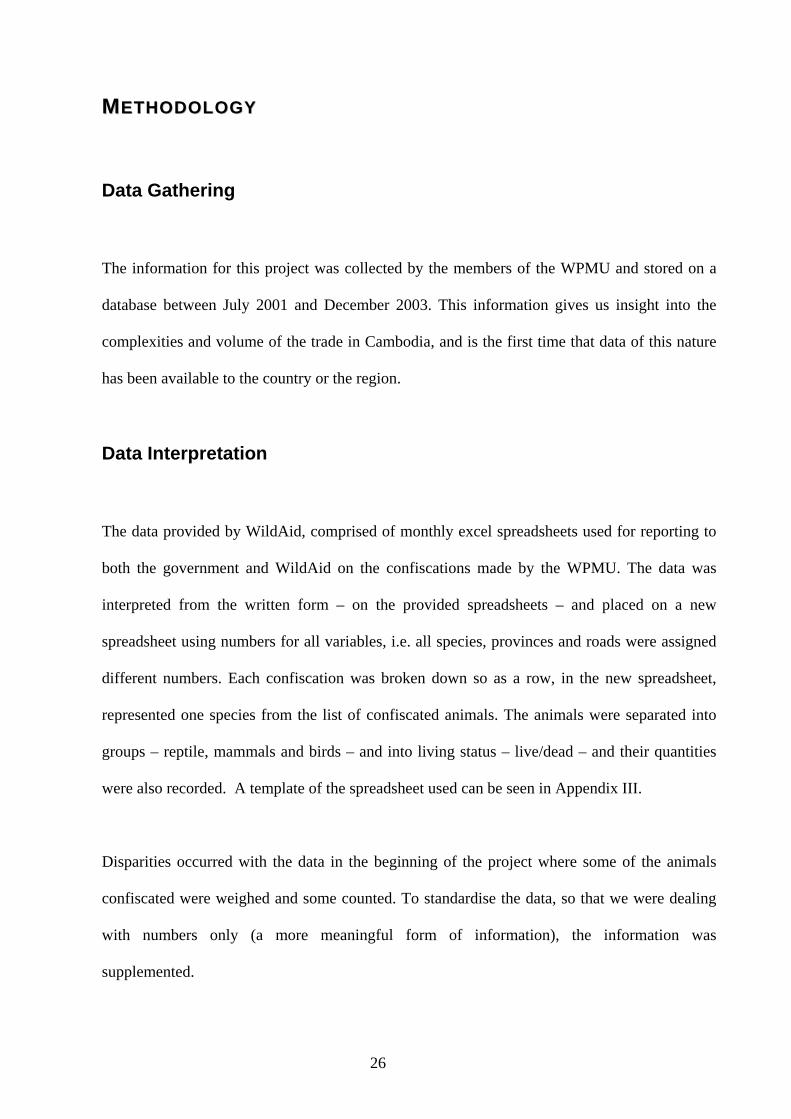
birds, which are caught along the Mekong and transported to Phnom Penh. Freshwater turtles
are also a common form of prayer release in Phnom Penh ( ) (Severinghaus 1999).
Picture 17
Baby freshwater turtles on sale as prayer release animals in Phnom Penh next to the
Tonle Sap river
Picture 17
25
MMEETTHHOODDOOLLOOGGYY
Data Gathering
The information for this project was collected by the members of the WPMU and stored on a
database between July 2001 and December 2003. This information gives us insight into the
complexities and volume of the trade in Cambodia, and is the first time that data of this nature
has been available to the country or the region.
Data Interpretation
The data provided by WildAid, comprised of monthly excel spreadsheets used for reporting to
both the government and WildAid on the confiscations made by the WPMU. The data was
interpreted from the written form – on the provided spreadsheets – and placed on a new
spreadsheet using numbers for all variables, i.e. all species, provinces and roads were assigned
different numbers. Each confiscation was broken down so as a row, in the new spreadsheet,
represented one species from the list of confiscated animals. The animals were separated into
groups – reptile, mammals and birds – and into living status – live/dead – and their quantities
were also recorded. A template of the spreadsheet used can be seen in Appendix III.
Disparities occurred with the data in the beginning of the project where some of the animals
confiscated were weighed and some counted. To standardise the data, so that we were dealing
with numbers only (a more meaningful form of information), the information was
supplemented.
26
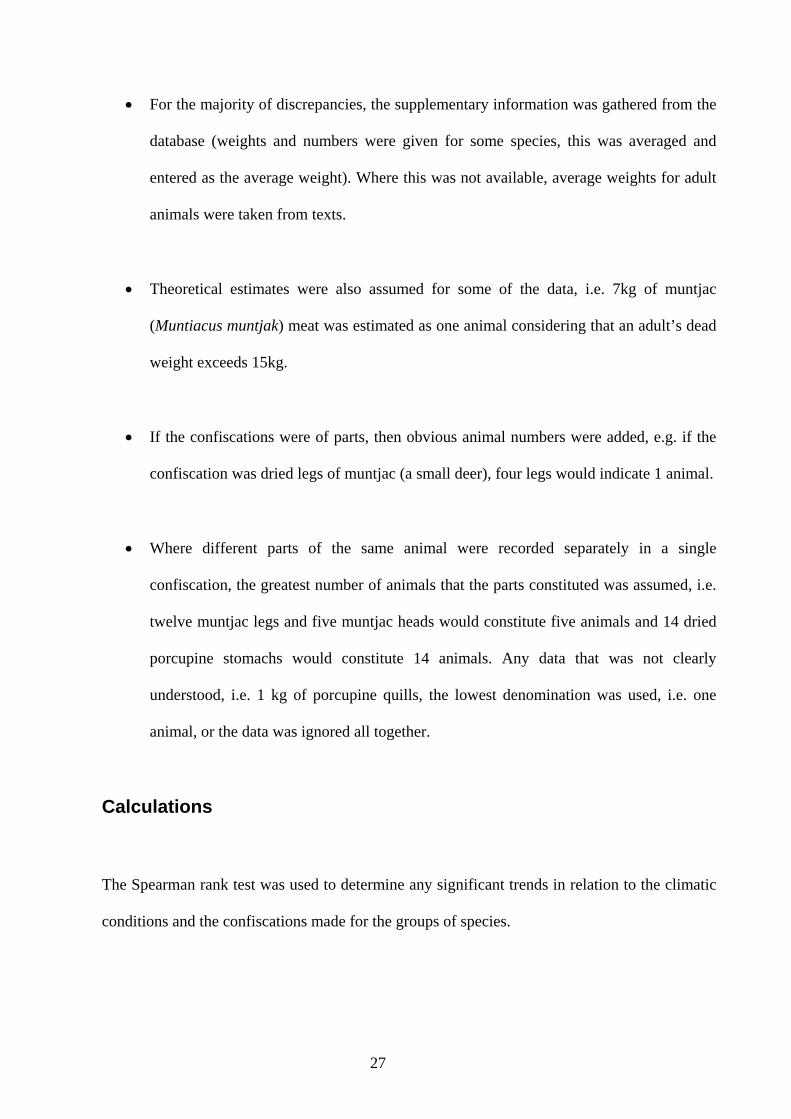
• For the majority of discrepancies, the supplementary information was gathered from the
database (weights and numbers were given for some species, this was averaged and
entered as the average weight). Where this was not available, average weights for adult
animals were taken from texts.
• Theoretical estimates were also assumed for some of the data, i.e. 7kg of muntjac
(Muntiacus muntjak) meat was estimated as one animal considering that an adult’s dead
weight exceeds 15kg.
• If the confiscations were of parts, then obvious animal numbers were added, e.g. if the
confiscation was dried legs of muntjac (a small deer), four legs would indicate 1 animal.
• Where different parts of the same animal were recorded separately in a single
confiscation, the greatest number of animals that the parts constituted was assumed, i.e.
twelve muntjac legs and five muntjac heads would constitute five animals and 14 dried
porcupine stomachs would constitute 14 animals. Any data that was not clearly
understood, i.e. 1 kg of porcupine quills, the lowest denomination was used, i.e. one
animal, or the data was ignored all together.
Calculations
The Spearman rank test was used to determine any significant trends in relation to the climatic
conditions and the confiscations made for the groups of species.
27
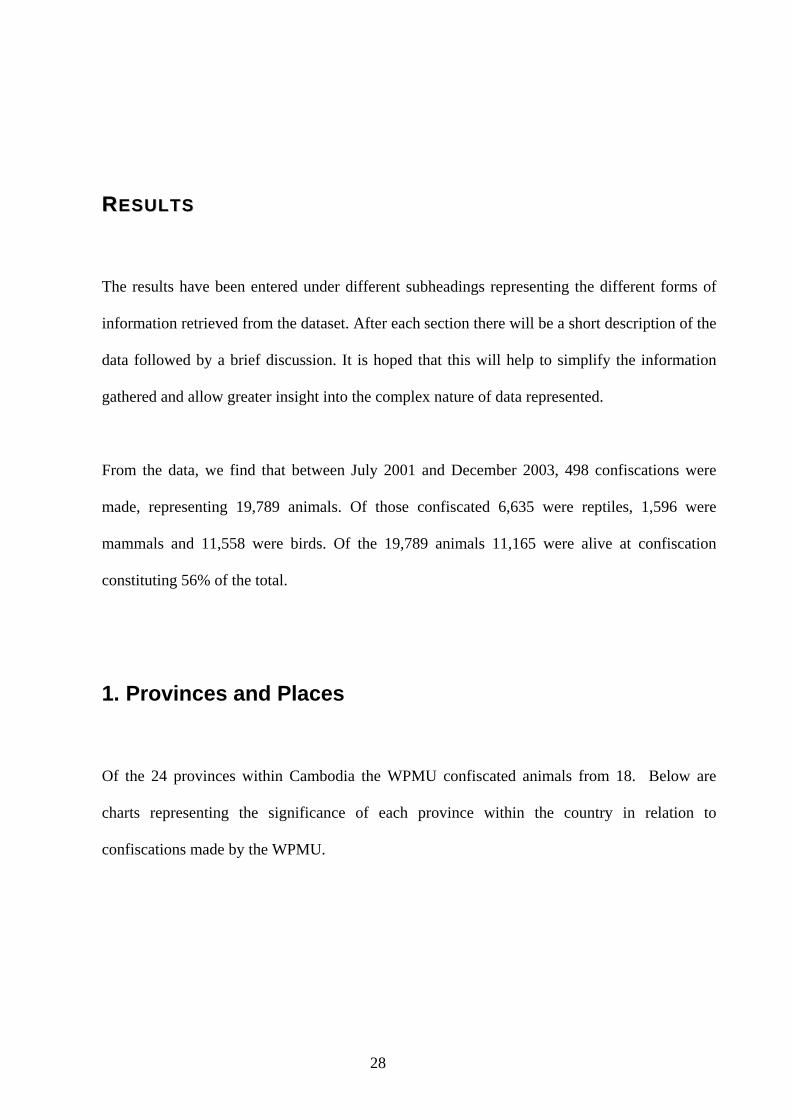
RREESSUULLTTSS
The results have been entered under different subheadings representing the different forms of
information retrieved from the dataset. After each section there will be a short description of the
data followed by a brief discussion. It is hoped that this will help to simplify the information
gathered and allow greater insight into the complex nature of data represented.
From the data, we find that between July 2001 and December 2003, 498 confiscations were
made, representing 19,789 animals. Of those confiscated 6,635 were reptiles, 1,596 were
mammals and 11,558 were birds. Of the 19,789 animals 11,165 were alive at confiscation
constituting 56% of the total.
1. Provinces and Places
Of the 24 provinces within Cambodia the WPMU confiscated animals from 18. Below are
charts representing the significance of each province within the country in relation to
confiscations made by the WPMU.
28
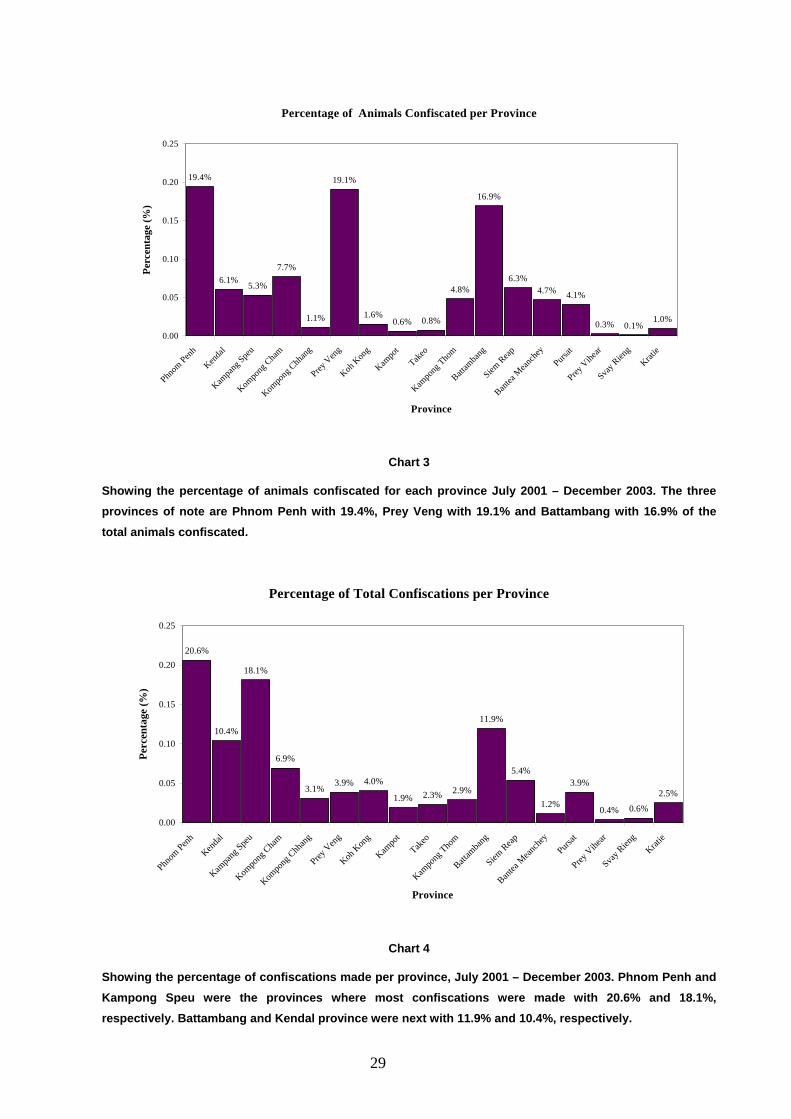
Percentage of Animals Confiscated per Province
19.4%
6.1% 5.3%
7.7%
1.1%
19.1%
1.6%0.6% 0.8%
4.8%
16.9%
6.3%4.7% 4.1%
0.3% 0.1%1.0%
0.00
0.05
0.10
0.15
0.20
0.25
Phnom
Penh
Kenda
l
Kampa
ng Spe
u
Kompo
ng C
ham
Kompo
ng C
hhan
g
Prey V
eng
Koh K
ong
Kampo
t
Takeo
Kampo
ng Tho
m
Battam
bang
Siem Reap
Bantea
Mean
chey
Pursat
Prey V
ihear
Svay R
ieng
Kratie
Province
Perc
enta
ge (%
)
Chart 3
Showing the percentage of animals confiscated for each province July 2001 – December 2003. The three provinces of note are Phnom Penh with 19.4%, Prey Veng with 19.1% and Battambang with 16.9% of the total animals confiscated.
Percentage of Total Confiscations per Province
20.6%
10.4%
18.1%
6.9%
3.1%3.9% 4.0%
1.9% 2.3% 2.9%
11.9%
5.4%
1.2%
3.9%
0.4% 0.6%
2.5%
0.00
0.05
0.10
0.15
0.20
0.25
Phnom
Penh
Kenda
l
Kampa
ng Spe
u
Kompo
ng Cha
m
Kompo
ng Chh
ang
Prey V
eng
Koh K
ong
Kampo
t
Takeo
Kampo
ng Tho
m
Battam
bang
Siem Reap
Bantea
Mean
chey
Pursat
Prey V
ihear
Svay R
ieng
Kratie
Province
Perc
enta
ge (%
)
Chart 4
Showing the percentage of confiscations made per province, July 2001 – December 2003. Phnom Penh and Kampong Speu were the provinces where most confiscations were made with 20.6% and 18.1%, respectively. Battambang and Kendal province were next with 11.9% and 10.4%, respectively.
29

Mean Number of Animals Retrieved per Confiscation
3622
11
42
14 15 13 13
6454
44
155
4128
815
189
0
20
40
60
80
100
120
140
160
180
200
Phnom
Penh
Kenda
l
Kampa
ng Spe
u
Kompo
ng Cha
m
Kompo
ng Chh
ang
Prey V
eng
Koh K
ong
Kampo
t
Takeo
Kampo
ng Tho
m
Battam
bang
Siem Reap
Bantea
Mean
chey
Pursat
Prey V
ihear
Svay R
ieng
Krachie
Province
No.
Ani
mal
s
Chart 5
Representing the mean number of animals confiscated per province. The data indicates that Prey Veng and Bantea Meanchey are the provinces that have more animals per confiscation, with 189 and 155 animals respectively.
Percentage of Total Confiscations per Place
15.6%
20.5% 20.1%
8.8% 8.8%
2.4%3.5%
4.9%
11.4%
1.7%0.4% 0.7% 1.0%
0.1%0.00
0.05
0.10
0.15
0.20
0.25
Phnom
Penh
Nation
al Roa
d 5
Nation
al Roa
d 4
Nation
al Roa
d 7
Nation
al Roa
d 1
Nation
al Roa
d 2
Nation
al Roa
d 3
Nation
al Roa
d 6a
Nation
al Roa
d 6
Nation
al Roa
d 48
Nation
al Roa
d 10
Nation
al Roa
d 17
Nation
al Roa
d 21
Ntiona
l Roa
d 13
Place Where Confiscation Were Made
Perc
enta
ge
Chart 6
Representing the location confiscations where made. The data indicates the largest amount of confiscations were made along National roads 4 and 5.
30
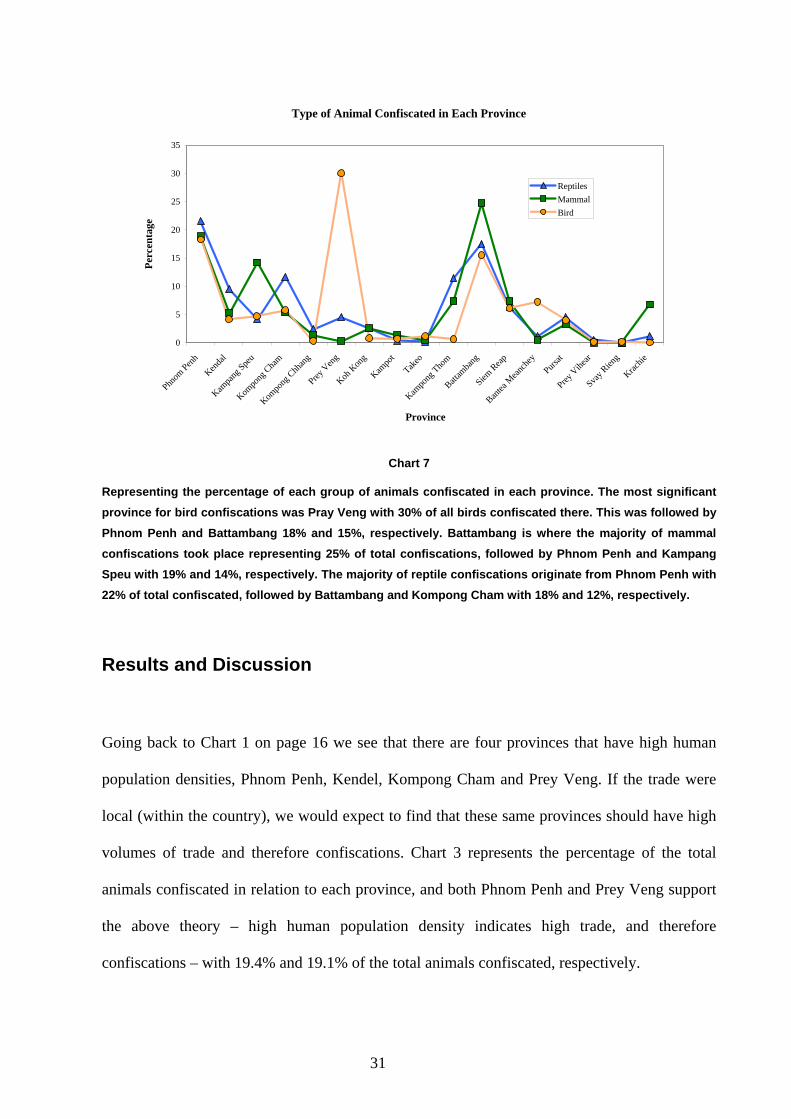
Type of Animal Confiscated in Each Province
0
5
10
15
20
25
30
35
Phnom
Penh
Kenda
l
Kampa
ng Spe
u
Kompo
ng Cha
m
Kompo
ng Chh
ang
Prey V
eng
Koh K
ong
Kampo
t
Takeo
Kampo
ng Tho
m
Battam
bang
Siem Reap
Bantea
Mean
chey
Pursat
Prey V
ihear
Svay R
ieng
Krachie
Province
Perc
enta
ge
ReptilesMammalBird
Chart 7
Representing the percentage of each group of animals confiscated in each province. The most significant province for bird confiscations was Pray Veng with 30% of all birds confiscated there. This was followed by Phnom Penh and Battambang 18% and 15%, respectively. Battambang is where the majority of mammal confiscations took place representing 25% of total confiscations, followed by Phnom Penh and Kampang Speu with 19% and 14%, respectively. The majority of reptile confiscations originate from Phnom Penh with 22% of total confiscated, followed by Battambang and Kompong Cham with 18% and 12%, respectively.
Results and Discussion
Going back to Chart 1 on page 16 we see that there are four provinces that have high human
population densities, Phnom Penh, Kendel, Kompong Cham and Prey Veng. If the trade were
local (within the country), we would expect to find that these same provinces should have high
volumes of trade and therefore confiscations. Chart 3 represents the percentage of the total
animals confiscated in relation to each province, and both Phnom Penh and Prey Veng support
the above theory – high human population density indicates high trade, and therefore
confiscations – with 19.4% and 19.1% of the total animals confiscated, respectively.
31
However, Kompang Cham, with the largest human density in the country, only represented
7.7% of the total animals confiscated and Kendal with a seemingly larger population than
Phnom Penh only represents 6.1%. Therefore other aspects of the trade may well be influencing
the location of the confiscations. The proximity of provinces to the country’s border may well
be an influence on the location. Battambang lies on the border with Thailand (see Figure 2 page
14), Prey Veng is close to the Vietnamese border and is a trading route between Cambodia and
Vietnam both by road and river, and Phnom Penh has known trade routes with Vietnam by river
(Hean 2000) and the rest of the world by plane. It is highly likely, therefore, that international
trade influences the location of confiscations, supporting the view that Cambodia has become
the source for the regional wildlife trade (Global Witness 2001).
Chart 4 and Chart 5 look at the number of confiscations made and the mean number of animals
per confiscation. Here, Phnom Penh represents the majority of the confiscations. However the
confiscations tend to be small, with an average of 36 animals. Prey Veng only represents 3.9%
of confiscations yet had the largest number of animals per confiscation with 189, while
Battambang represents 11.9% of the confiscations with an average of 54 animals per
confiscation. Bantea Meanchey, however, was highlighted as it representing only 1% of
confiscations yet averaged 155 animals per confiscation. Kampang Speu saw a high proportion
of the confiscations, but animals confiscated each time were low at 11 animals. Again, we see
the traders with the larger number of animals and animal products on sale are close to the
borders. This again supports the view that international demand is driving the wildlife trade in
Cambodia.
32
Chart 6 indicates the roads within the provinces (Figure 3) where the confiscations are being
made. The majority of the confiscations were made along Roads 4, 5, and 6, with 20.1%,
20.6%, and 11.4%, respectively. All three of these roads head towards the border with Vietnam,
via slightly different routes1. From this data, Vietnam would appear to constitute the greatest
demand for wildlife from Cambodia. Therefore we can again see that the trade is influenced by
the demand by other countries in the region.
Chart 7 takes a more in-depth look at the trade in particular groups of animals in relation to
different provinces. Reptiles appear to be most at risk in Phnom Penh and Battambang.
Kompang Cham and Kompong Thom also pose a threat, although what markets they would
supply is not obvious from the data. Mammals are most at risk in Battambang, Phnom Penh and
Kampang Speu. Battambang and Phnom Penh represent the markets for international trade
close to the borders. Kampang Speu has the seaport of Cambodia, a possible export route, and
is a popular Khmer beach resort. Kampang Speu is also is the home to the Sre Klong wildlife
market, which supplies Phnom Penh with wildlife for the restaurants. Birds are most at risk in
Prey Veng along National Road 1. The majority of the birds confiscated from there were dead
(of the 3,470 birds confiscated, only 15 were alive), thus it would be assumed that birds here
represent more domestic use as they would have a limited shelf life in the heat and humidity of
Cambodia. Other areas of concern for the birds are Phnom Penh and Kampang Speu, again
probably for the restaurant and domestic food trade.
1 Road 4 runs from Phnom Penh to the coast through Kompong Speu cutting through Kirrirom and Bokor National
Parks, and has a large wildlife market situated close to Kirrirom National Parks entrance called Sre Klong. Road
5 runs from Phnom Penh towards the Vietnamese border through Kandel, Prey Veng and Svay Rieng. It is the
main overland route between the two countries. Route 6 is an alternative road to Vietnam from Phnom Penh
through Kandel and Takeo.
33
The location of wildlife and wildlife products in Cambodia depends on the target market. Hean
(2000), during his interviews with wildlife traders, reported that a tiger skin for sale on the Thai
border town of Poipet, was worth more there, than in Phnom Penh. The reverse was true for
tiger bone, cheaper in Poipet than Phnom Penh. The reasons for the differences in price
stemmed from the demand. The skin is favoured by the Thai people for use as interior
decoration, and the bone is favoured by the Vietnamese for traditional medicine.
He also reported on popular routes for smuggling wildlife across Cambodia’s borders. Phnom
Penh was the reported collection point for smuggling wildlife to Vietnam, and from there to
China. The wildlife was mainly smuggled aboard boats transporting such things as plastic for
recycling. A boat trip from Cambodia to Vietnam via the Mekong River was reported to take
less than a day.
2. Results on Animal Confiscations
The analysis of animals confiscated between July 2001 and December 2003 are described
below. To separate the data, animals were divided into three groups, reptiles, mammals and
birds, and those positively identified are recorded in Appendix I.
A. Reptiles – 6,635 animals were confiscated of which 69% were alive. A total of 17
species were positively identified of those two were classed as critically endangered,
two were endangered, four were venerable and one was at lower risk but near
threatened, according to the ICUN Red List of threatened Species2 (Appendix I).
2 ICUN (International Union for Conservation of Nature and Natural Resources) The ICUN Red Data Book is a widely recognised method of highlighting species that are under extinction risk. For a list of the categories, refer to Appendix I.
34
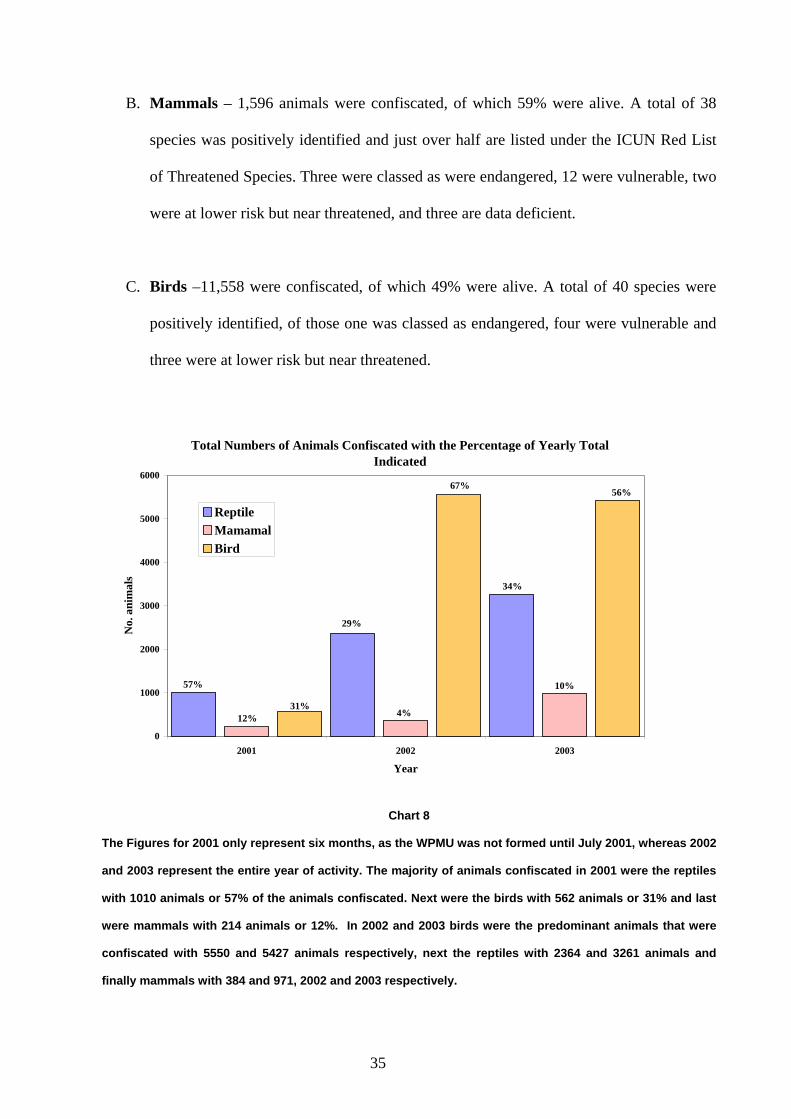
B. Mammals – 1,596 animals were confiscated, of which 59% were alive. A total of 38
species was positively identified and just over half are listed under the ICUN Red List
of Threatened Species. Three were classed as were endangered, 12 were vulnerable, two
were at lower risk but near threatened, and three are data deficient.
C. Birds –11,558 were confiscated, of which 49% were alive. A total of 40 species were
positively identified, of those one was classed as endangered, four were vulnerable and
three were at lower risk but near threatened.
Total Numbers of Animals Confiscated with the Percentage of Yearly Total Indicated
0
1000
2000
3000
4000
5000
6000
2001 2002 2003
Year
No.
ani
mal
s
ReptileMamamalBird
57%
12%31%
29%
4%
67%
34%
10%
56%
Chart 8
The Figures for 2001 only represent six months, as the WPMU was not formed until July 2001, whereas 2002
and 2003 represent the entire year of activity. The majority of animals confiscated in 2001 were the reptiles
with 1010 animals or 57% of the animals confiscated. Next were the birds with 562 animals or 31% and last
were mammals with 214 animals or 12%. In 2002 and 2003 birds were the predominant animals that were
confiscated with 5550 and 5427 animals respectively, next the reptiles with 2364 and 3261 animals and
finally mammals with 384 and 971, 2002 and 2003 respectively.
35
Results and Discussion
The number of animals confiscated above only represent the traders that were caught by one
team stretched across the country and therefore probably only represent a fraction of the actual
trade.
Mammals represent the smallest percentage of the confiscations for all three years (Chart 8).
However, between 2002 and 2003 there appears to be an increase of 6% in mammal
confiscations. The majority of the 6% rise in confiscations can be explained by a single
confiscation of 220 macaques in 2003. The figures produced in 2001 represent the beginning of
the WPMU and the first time that substantial confiscations were being made in the country.
Therefore, it is not surprising that more mammals and reptiles were confiscated in subsequent
years. Both species were also, more openly traded before the formation of the WPMU,
especially in the restaurants of Phnom Penh where turtles and pangolin were on most Khmer
menus.
The reptile trade may well be of greatest concern. All of those identified from confiscations
were listed under the ICUN Red List for threatened species. Noteworthy was the confiscation of
the river terrapin (Batagur baska), which is considered to be among the top 25 most endangered
freshwater turtles in the world (Turtle Conservation Fund 2003, Barzyk 2004) and was only
rediscovered in Cambodia in 2001, as was the Siamese Crocodile Crocodylus siamensis. Both
species are thought to be in a critical status according to the ICUN Red List. In Chart 8 during
2002 and 2003 the confiscations made on reptiles and birds only changed marginally – a 5 %
increase for the reptiles and an 11% decrease in birds.
36
This is of course a percentage of the whole. The actual numbers rise quite substantially – 900
more reptiles were confiscated in 2003 than 2002 and the number of mammals more than
doubled from 365 to 998.
Evident from the results is that mammals (which many conservationists associate with and gain
most media support) represent a small portion of the overall confiscations. However, 53% of
them are listed under ICUN and among them are the Asian Elephant Elephas maximus, Banteng
Bos javanicus and Indochinese tiger Panthera tigris corbetti, all of which are facing dramatic
decline. Birds represent the majority of the confiscations yet only 20% of those confiscated
were positively identified. From the data however, the majority of both birds and reptiles were
not positively identified. This raises the question of how many of these unidentified animals are
endangered. Also, could there be new species among them?
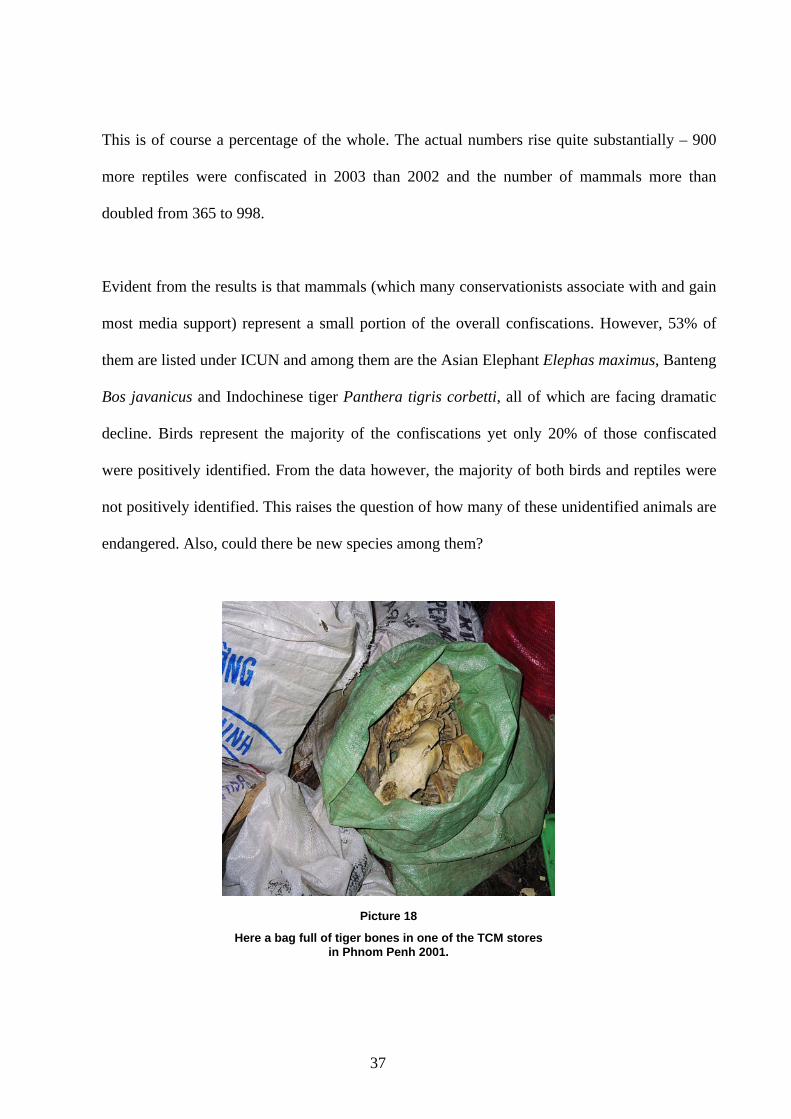
Picture 18
Here a bag full of tiger bones in one of the TCM stores in Phnom Penh 2001.
37
3. Building a Seasonal Picture
Here we examine seasonal variations in the confiscations of the different groups of animals.
The hope is to identify times of the year that represent the greatest threat to wildlife, along with
periods of the year where the threat is low.
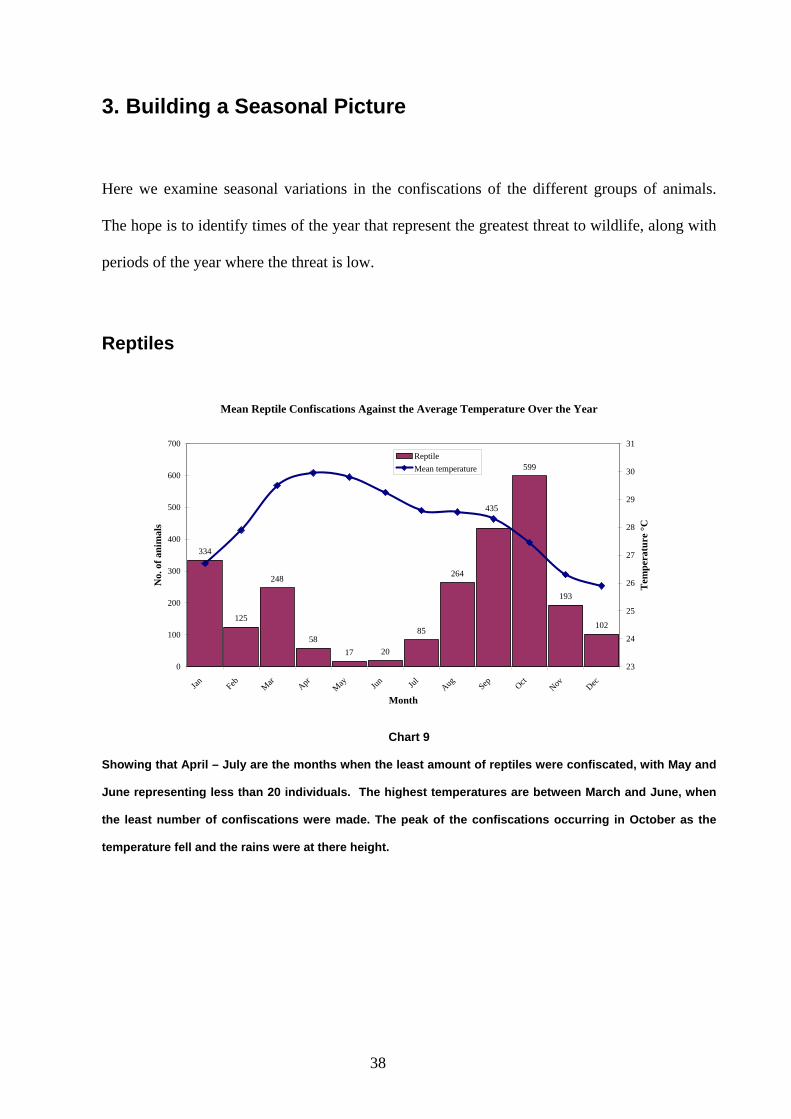
Reptiles
Mean Reptile Confiscations Against the Average Temperature Over the Year
334
125
248
5817 20
85
264
599
193
102
435
0
100
200
300
400
500
600
700
Jan Feb Mar AprMay Jun Jul Aug Sep Oct
Nov Dec
Month
No.
of a
nim
als
23
24
25
26
27
28
29
30
31
Tem
pera
ture
°C
ReptileMean temperature
Chart 9
Showing that April – July are the months when the least amount of reptiles were confiscated, with May and
June representing less than 20 individuals. The highest temperatures are between March and June, when
the least number of confiscations were made. The peak of the confiscations occurring in October as the
temperature fell and the rains were at there height.
38
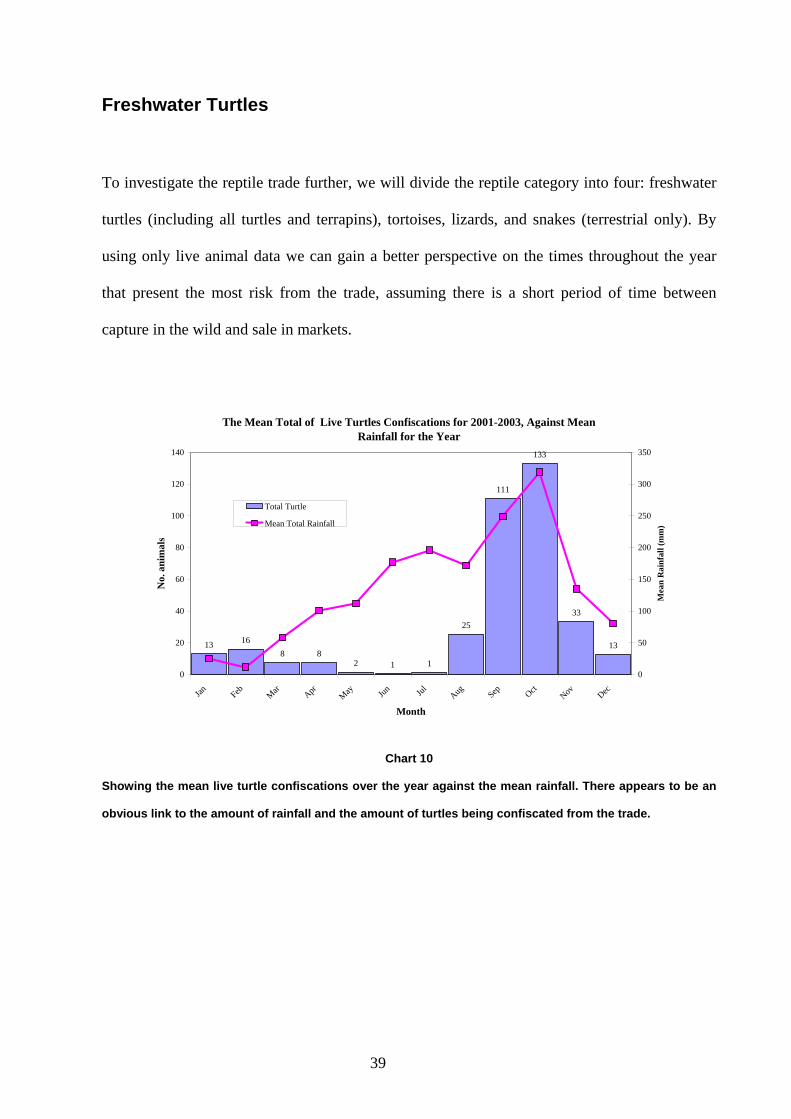
Freshwater Turtles
To investigate the reptile trade further, we will divide the reptile category into four: freshwater
turtles (including all turtles and terrapins), tortoises, lizards, and snakes (terrestrial only). By
using only live animal data we can gain a better perspective on the times throughout the year
that present the most risk from the trade, assuming there is a short period of time between
capture in the wild and sale in markets.
The Mean Total of Live Turtles Confiscations for 2001-2003, Against Mean Rainfall for the Year
13 168 8
2 1 1
25
111
133
33
13
0
20
40
60
80
100
120
140
Jan Feb Mar AprMay Jun Jul Aug Sep Oct
Nov Dec
Month
No.
ani
mal
s
0
50
100
150
200
250
300
350
Mea
n R
ainf
all (
mm
)
Total Turtle
Mean Total Rainfall
Chart 10
Showing the mean live turtle confiscations over the year against the mean rainfall. There appears to be an
obvious link to the amount of rainfall and the amount of turtles being confiscated from the trade.
39
The Mean Total of Live Turtles Confiscations for 2001-2003, Against Mean Temperature for the Year
13 168 8
2 1 1
25
111
33
13
133
0
20
40
60
80
100
120
140
Jan Feb Mar AprMay Jun Jul Aug Sep Oct
Nov Dec
Month
No.
Ani
mal
s Con
fisca
ted
23
24
25
26
27
28
29
30
31
Mea
n T
empe
ratu
re °C
Average Turtle No.
Mean Temp
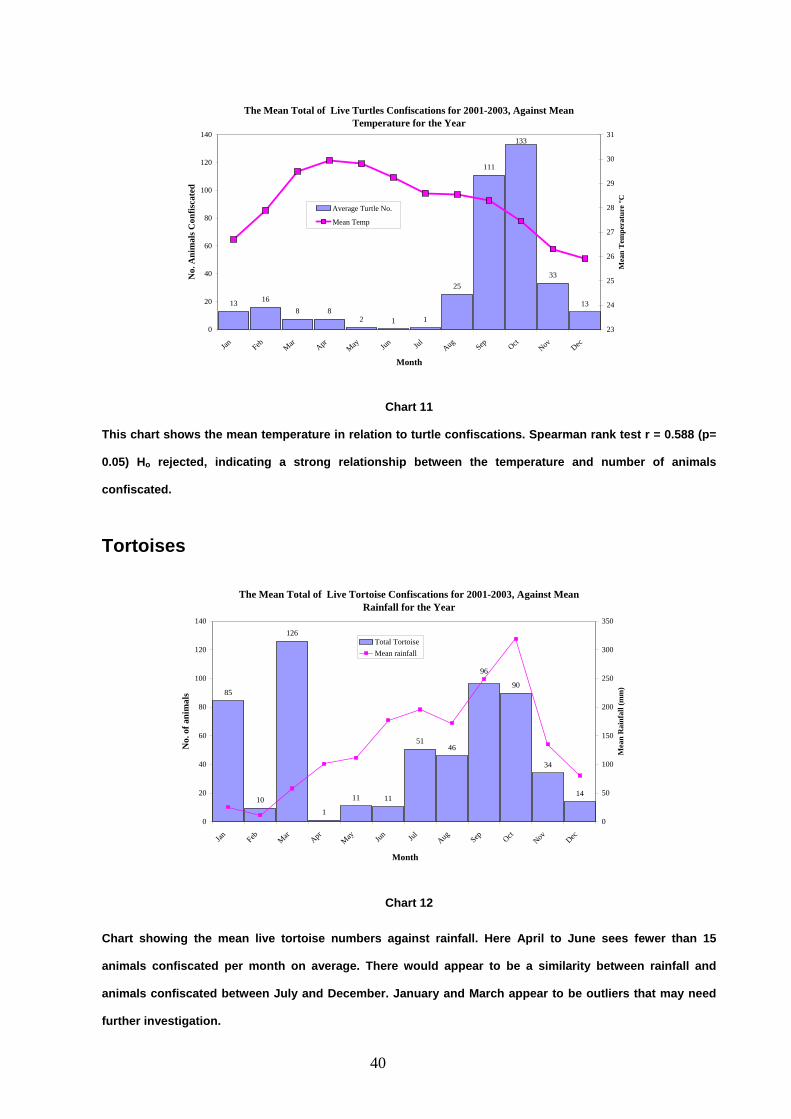
Chart 11
This chart shows the mean temperature in relation to turtle confiscations. Spearman rank test r = 0.588 (p=
0.05) Ho rejected, indicating a strong relationship between the temperature and number of animals
confiscated.
Tortoises
The Mean Total of Live Tortoise Confiscations for 2001-2003, Against Mean Rainfall for the Year
85
10
126
1
11 11
5146
90
34
14
96
0
20
40
60
80
100
120
140
Jan Feb Mar AprMay Jun Jul Aug Sep Oct
Nov Dec
Month
No.
of a
nim
als
0
50
100
150
200
250
300
350M
ean
Rai
nfal
l (m
m)
Total Tortoise Mean rainfall
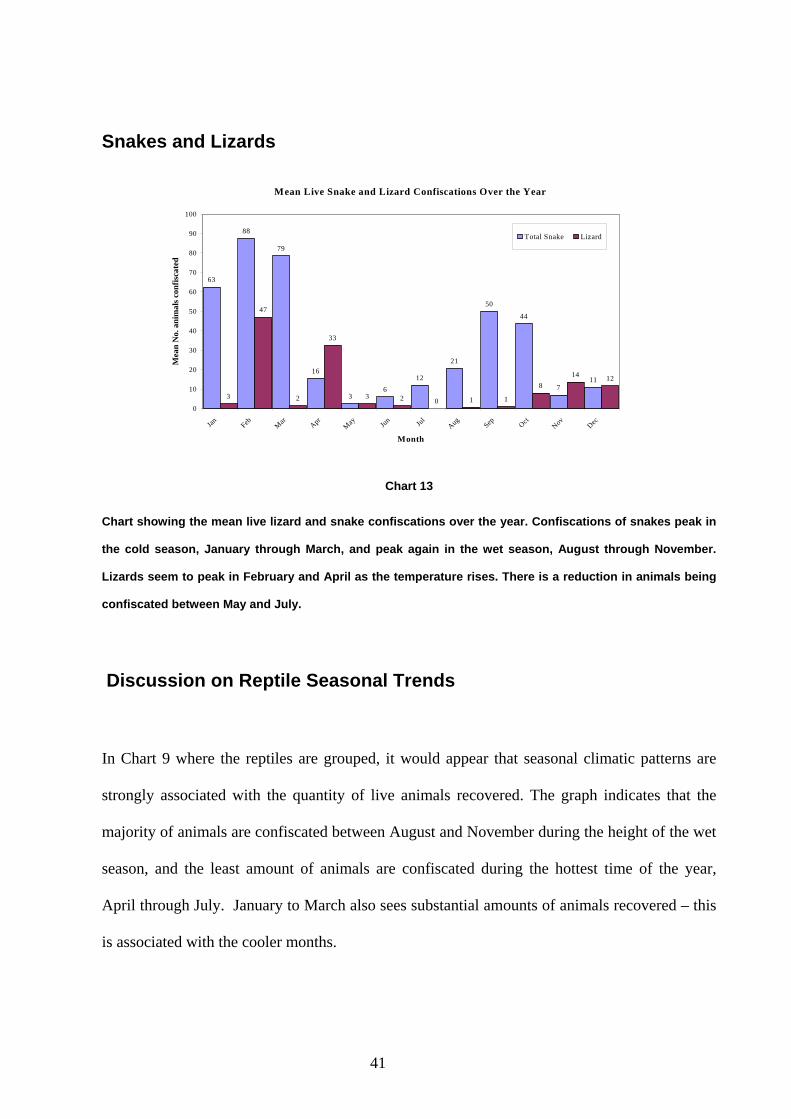
Chart 12
Chart showing the mean live tortoise numbers against rainfall. Here April to June sees fewer than 15
animals confiscated per month on average. There would appear to be a similarity between rainfall and
animals confiscated between July and December. January and March appear to be outliers that may need
further investigation.
40
Snakes and Lizards
Mean Live Snake and Lizard Confiscations Over the Year
63
88
79
16
36
12
21
50
44
711
3
47
2
33
3 2 0 1 1
814 12
0
10
20
30
40
50
60
70
80
90
100
Jan Feb Mar Apr
May Ju
n Jul
Aug Sep OctNov Dec
Month
Mea
n N
o. a
nim
als c
onfis
cate
d
Total Snake Lizard
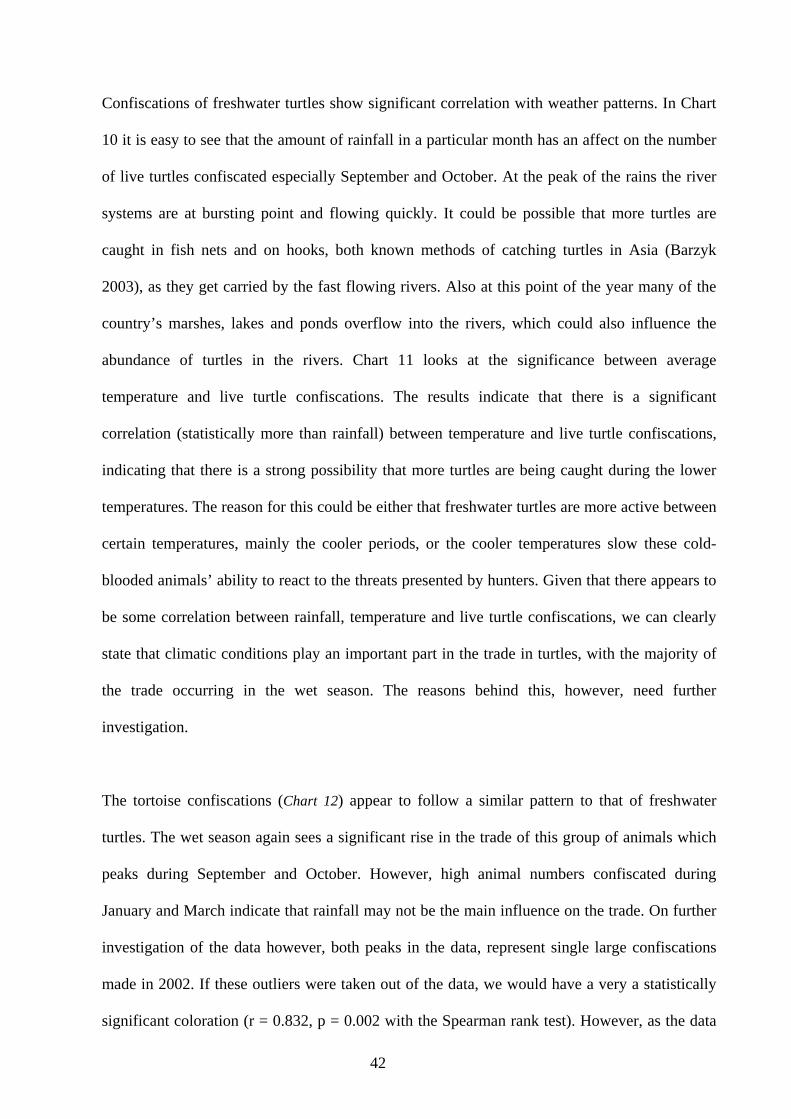
Chart 13
Chart showing the mean live lizard and snake confiscations over the year. Confiscations of snakes peak in
the cold season, January through March, and peak again in the wet season, August through November.
Lizards seem to peak in February and April as the temperature rises. There is a reduction in animals being
confiscated between May and July.
Discussion on Reptile Seasonal Trends
In Chart 9 where the reptiles are grouped, it would appear that seasonal climatic patterns are
strongly associated with the quantity of live animals recovered. The graph indicates that the
majority of animals are confiscated between August and November during the height of the wet
season, and the least amount of animals are confiscated during the hottest time of the year,
April through July. January to March also sees substantial amounts of animals recovered – this
is associated with the cooler months.
41
Confiscations of freshwater turtles show significant correlation with weather patterns. In Chart
10 it is easy to see that the amount of rainfall in a particular month has an affect on the number
of live turtles confiscated especially September and October. At the peak of the rains the river
systems are at bursting point and flowing quickly. It could be possible that more turtles are
caught in fish nets and on hooks, both known methods of catching turtles in Asia (Barzyk
2003), as they get carried by the fast flowing rivers. Also at this point of the year many of the
country’s marshes, lakes and ponds overflow into the rivers, which could also influence the
abundance of turtles in the rivers. Chart 11 looks at the significance between average
temperature and live turtle confiscations. The results indicate that there is a significant
correlation (statistically more than rainfall) between temperature and live turtle confiscations,
indicating that there is a strong possibility that more turtles are being caught during the lower
temperatures. The reason for this could be either that freshwater turtles are more active between
certain temperatures, mainly the cooler periods, or the cooler temperatures slow these cold-
blooded animals’ ability to react to the threats presented by hunters. Given that there appears to
be some correlation between rainfall, temperature and live turtle confiscations, we can clearly
state that climatic conditions play an important part in the trade in turtles, with the majority of
the trade occurring in the wet season. The reasons behind this, however, need further
investigation.
The tortoise confiscations (Chart 12) appear to follow a similar pattern to that of freshwater
turtles. The wet season again sees a significant rise in the trade of this group of animals which
peaks during September and October. However, high animal numbers confiscated during
January and March indicate that rainfall may not be the main influence on the trade. On further
investigation of the data however, both peaks in the data, represent single large confiscations
made in 2002. If these outliers were taken out of the data, we would have a very a statistically
significant coloration (r = 0.832, p = 0.002 with the Spearman rank test). However, as the data
42
is only limited to the two year during January and March, the outliers should probably stay, but
continued monitoring for significance of the trend should be seriously looked into. The wet
season is most definitely the time of the year that tortoises are at most risk from the trade.
The majority of confiscations of both lizards and snakes in Chart 13 occur between January and
May. In Cambodia this is a cooler period, indicating that again temperature plays a role in the
trade of these animals. The cooler the conditions, the more animals confiscated, and therefore
more traded. The significance of this is not as obvious as tortoise or freshwater turtle however.
Further investigations need to be conducted on these groups of animals. Could they captive
breed? Snake farms in the region are not uncommon. However, it is not known if any exist in
Cambodia.
From the data we can see that turtles and tortoises are most at risk in the wet season and that
snakes and lizards are most at risk during the cool season after the rains. Confiscations are at a
minimal during the dry season, indicating that there are less of these types of animal traded
during that period. It would appear that temperature plays a significant role in the capture and
trading of these animals. It is possible that hunting methods also play an important role. Barzyk
(2003) indicates that turtles are hunted by spear, net and with hook and line. During the peak of
the wet season, rivers are extremely swollen and the currents are strong, carrying many
freshwater animals into the awaiting nets or onto hooks just under the water’s surface or at the
edge of the river. It is also this time of the year while people are waiting for the rice to grow
and reserves of the last rice crop are low that a greater reliance on other available nutritional
resources exists. People turn to other sources such as non-timber forest products (NTFP), which
include the collection of wildlife for sale in the markets as a form of income. The combination
of these two factors is possibly the driving force behind the increase in turtle confiscations
during that season.
43
None of the turtles or tortoise species found in the region can cope with this sort of harvesting.
The river terrapin (Batagur baska), has seen decline of more than 90% in Malaysia over the last
century. Its decline in Thailand is thought to be similar, prompting the ICUN to list this species
as critical, it most sever rating before extinct. This turtle in Cambodia is of significance because
not only was it though to be extinct in the wild until 2001 when it was rediscovered (Turtle
Conservation Fund 2003), but it also holds cultural significance. The consumption of the eggs
was for centuries reserved for the royals, which ensured the survival of the species. Freshwater
turtles harvested in this amount are unsustainable. This is mainly due to the length of time it
takes them to grow to a harvestable size, which is the main reason they are not farmed
commercially (Barzyk 2003). However, many turtle species are under such intense threat from
trade in Asia that one of the only options left to ensure their survival is for captive breeding
programmes.
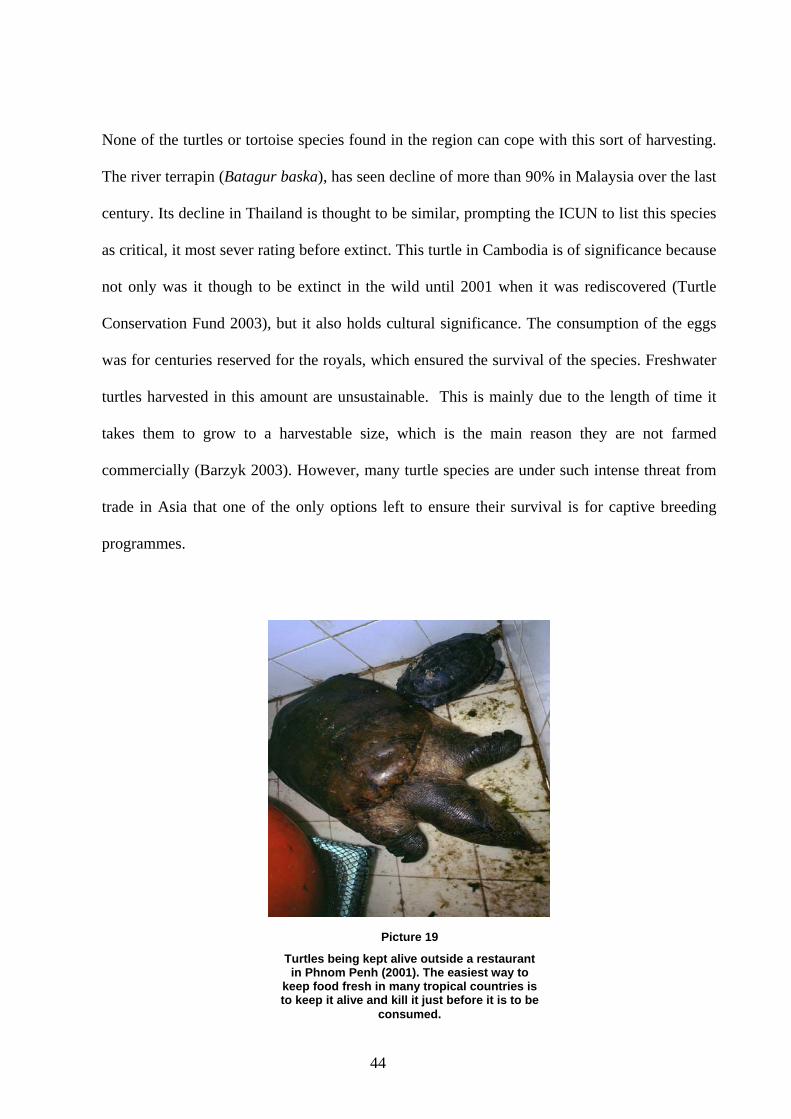
Picture 19
Turtles being kept alive outside a restaurant in Phnom Penh (2001). The easiest way to
keep food fresh in many tropical countries is to keep it alive and kill it just before it is to be
consumed.
44
Mammals
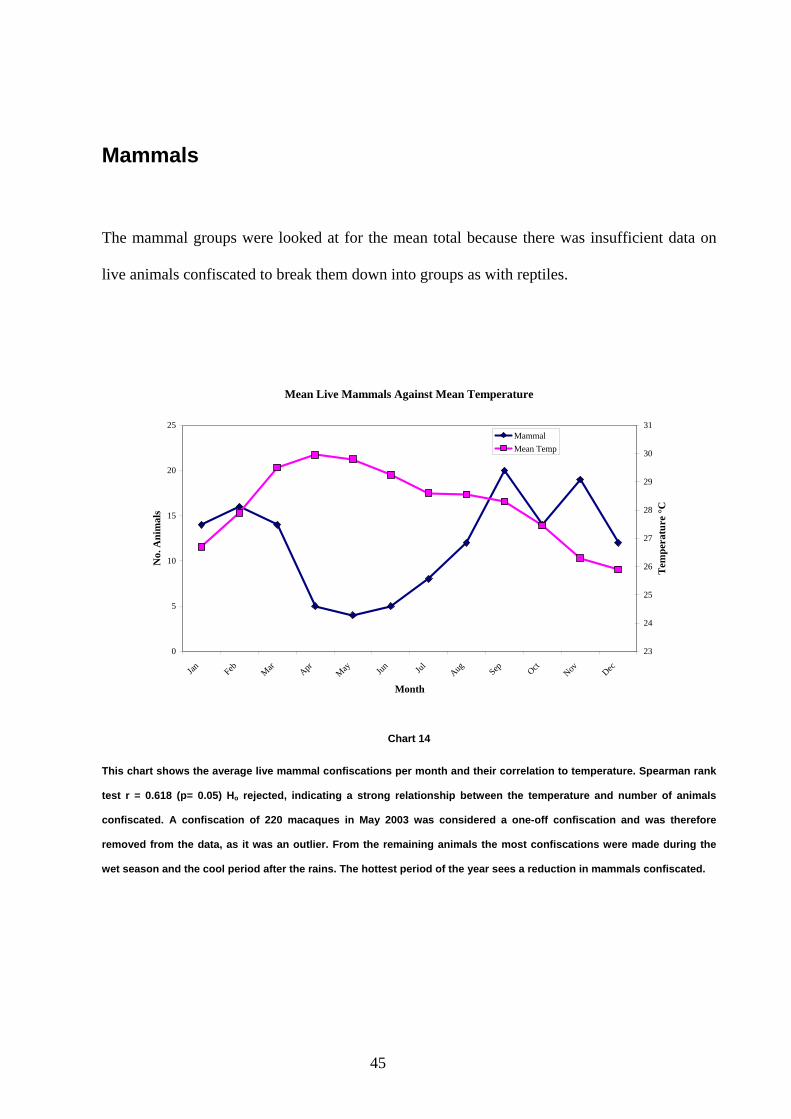
The mammal groups were looked at for the mean total because there was insufficient data on
live animals confiscated to break them down into groups as with reptiles.
Mean Live Mammals Against Mean Temperature
0
5
10
15
20
25
Jan Feb Mar AprMay Jun Jul Aug Sep Oct
Nov Dec
Month
No.
Ani
mal
s
23
24
25
26
27
28
29
30
31
Tem
pera
ture
°C
MammalMean Temp
Chart 14
This chart shows the average live mammal confiscations per month and their correlation to temperature. Spearman rank
test r = 0.618 (p= 0.05) Ho rejected, indicating a strong relationship between the temperature and number of animals
confiscated. A confiscation of 220 macaques in May 2003 was considered a one-off confiscation and was therefore
removed from the data, as it was an outlier. From the remaining animals the most confiscations were made during the
wet season and the cool period after the rains. The hottest period of the year sees a reduction in mammals confiscated.
45
Mammal Results and Discussion
Of the mammals confiscated, primates represent the greatest numbers. Of those confiscated,
449 were long tailed macaque (Macaca fascicularis), 10 were pileated gibbon (Hylobates
pileatus), seven were pigtailed macaque (Macaca nemestrina), 34 were slow loris (Nycticebus
coucang) and one was a Griffith’s silver langur (Trachypithecus villosus). The substantial
number of macaques most probably has something to do with the trade in them for scientific
research from private companies in Vietnam. Under the CITES convention the Vietnamese
government are permitted to export more than 3,000 animals of the F2 generation annually to
the United States for US$ 500 each (P.V. 2001). In order to achieve this amount of F2
generation macaques, captive breeding colonies would have to be vast. More likely is that wild-
caught macaque’s help supplement the captive bred animals being shipped to the U.S.
Although this is an unproven viewpoint, there is also no evidence of the captive colonies
necessary to breed this number of animals. Moreover in 2000, Cambodia approved the export of
360 wild-caught monkeys to Vietnam (Global Witness 2001). This may well have stimulated
illegal trade in macaques with Vietnam, considering the amount of money involved. Macaques
are also a food and medicine source in the region. Hoan (2004) explains how almost all body
parts are used for traditional medicine in Vietnam and claims that they can cure such things as
nervous breakdowns, paralysis and skin ulcers. He also implies that the entertainment from
performing macaques influences the economics of Vietnam. Although this is hard to accept
from the western standpoint, the article (which was written for the Vietnamese people) does
give us insight into the attitude of society for that part of the world.
46
Other primates of note are the slow loris. This nocturnal primate probably suffers more than
most. A market survey I conducted in 2000, more than 300 dead dried slow loris, for use in the
medicine trade, were counted in a single day. This was quite alarming, as little is known about
this particular species. The ICUN has this species as data deficient. All 10 of the gibbons
confiscated were alive, indicating that they were all confiscated from the pet trade. The trade in
young gibbon in the region is large. Obtaining a young gibbon from the wild, both parents have
to be killed and then only a small number survive long enough to get to market, then even less
make it to adulthood, when they can become dangerous.
Of the other mammals, pangolins (Manis javanica) significantly contributed to the trade; 178
were confiscated. This favoured food item, often found on Khmer menus, is considered as low
risk by the ICUN red list. However, considering that in 2001 Thailand claimed to have
confiscated more than 3000 animals (Traffic 2002), the regional status of this species may soon
have to be looked into more seriously. The facts that so many are entering the trade dose
suggest that there are still considerable numbers in the wild. How long the removal of these
quantity can be sustained, however, needs further investigation. Of greater significance were
the confiscations of tiger (3), Asian elephant (11), banteng (15) and sun bear (29). Tiger
banteng and elephant are all considered globally endangered by ICUN and the sun bear is data
deficient, indicating that not enough is known on the species and that they therefore could well
be extremely rare. However, the numbers being confiscated would indicate that sufficient
quantities still remain in the wild. Hean (2000) reported that the hunters interviewed during his
1998 survey, estimated that 85 tigers had been killed, and he estimated that around 50 tiger
skins were traded in the wildlife markets every year. Kimsan et al. (2002) reported that 25
tigers, 88 bear, 35 elephant, 42 gaur and 35 banteng had been killed by hunters between mid
2000 and November 2002. If these numbers are even close to those being hunted they are most
certainly not being picked up by the WPMU.
47
Birds
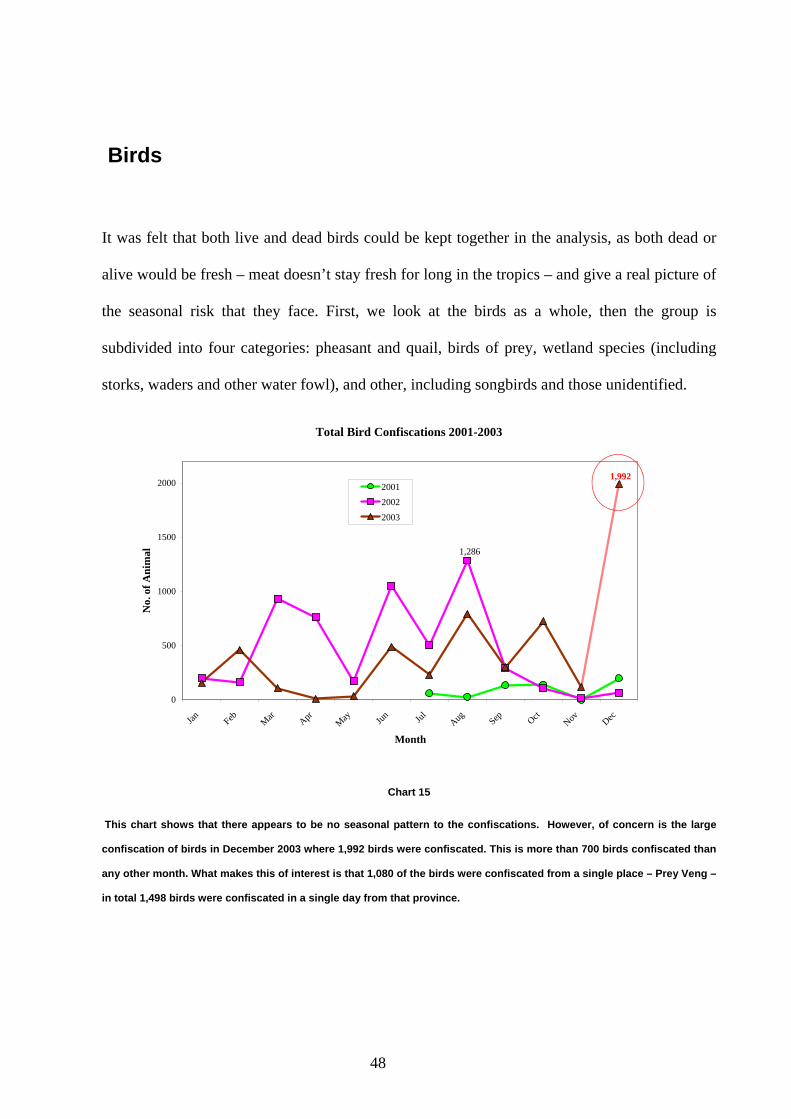
It was felt that both live and dead birds could be kept together in the analysis, as both dead or
alive would be fresh – meat doesn’t stay fresh for long in the tropics – and give a real picture of
the seasonal risk that they face. First, we look at the birds as a whole, then the group is
subdivided into four categories: pheasant and quail, birds of prey, wetland species (including
storks, waders and other water fowl), and other, including songbirds and those unidentified.
Total Bird Confiscations 2001-2003
1,286
1,992
0
500
1000
1500
2000
Jan Feb Mar AprMay Jun Jul Aug Sep Oct
Nov Dec
Month
No.
of A
nim
al
20012002
2003
Chart 15
This chart shows that there appears to be no seasonal pattern to the confiscations. However, of concern is the large
confiscation of birds in December 2003 where 1,992 birds were confiscated. This is more than 700 birds confiscated than
any other month. What makes this of interest is that 1,080 of the birds were confiscated from a single place – Prey Veng –
in total 1,498 birds were confiscated in a single day from that province.
48
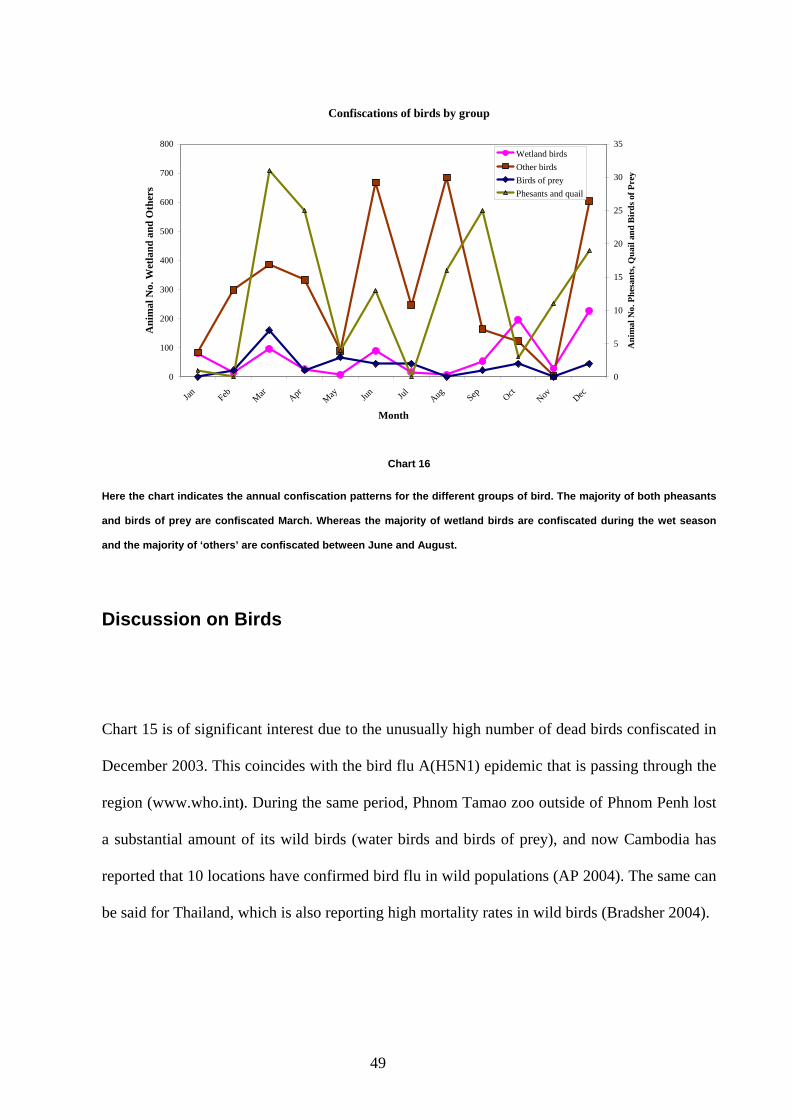
Confiscations of birds by group
0
100
200
300
400
500
600
700
800
Jan Feb Mar AprMay Jun Jul Aug Sep Oct
Nov Dec
Month
Ani
mal
No.
Wet
land
and
Oth
ers
0
5
10
15
20
25
30
35
Ani
mal
No.
Phe
sant
s, Q
uail
and
Bir
ds o
f Pre
y
Wetland birdsOther birdsBirds of preyPhesants and quail
Chart 16
Here the chart indicates the annual confiscation patterns for the different groups of bird. The majority of both pheasants
and birds of prey are confiscated March. Whereas the majority of wetland birds are confiscated during the wet season
and the majority of ‘others’ are confiscated between June and August.
Discussion on Birds
Chart 15 is of significant interest due to the unusually high number of dead birds confiscated in
December 2003. This coincides with the bird flu A(H5N1) epidemic that is passing through the
region (www.who.int). During the same period, Phnom Tamao zoo outside of Phnom Penh lost
a substantial amount of its wild birds (water birds and birds of prey), and now Cambodia has
reported that 10 locations have confirmed bird flu in wild populations (AP 2004). The same can
be said for Thailand, which is also reporting high mortality rates in wild birds (Bradsher 2004).
49
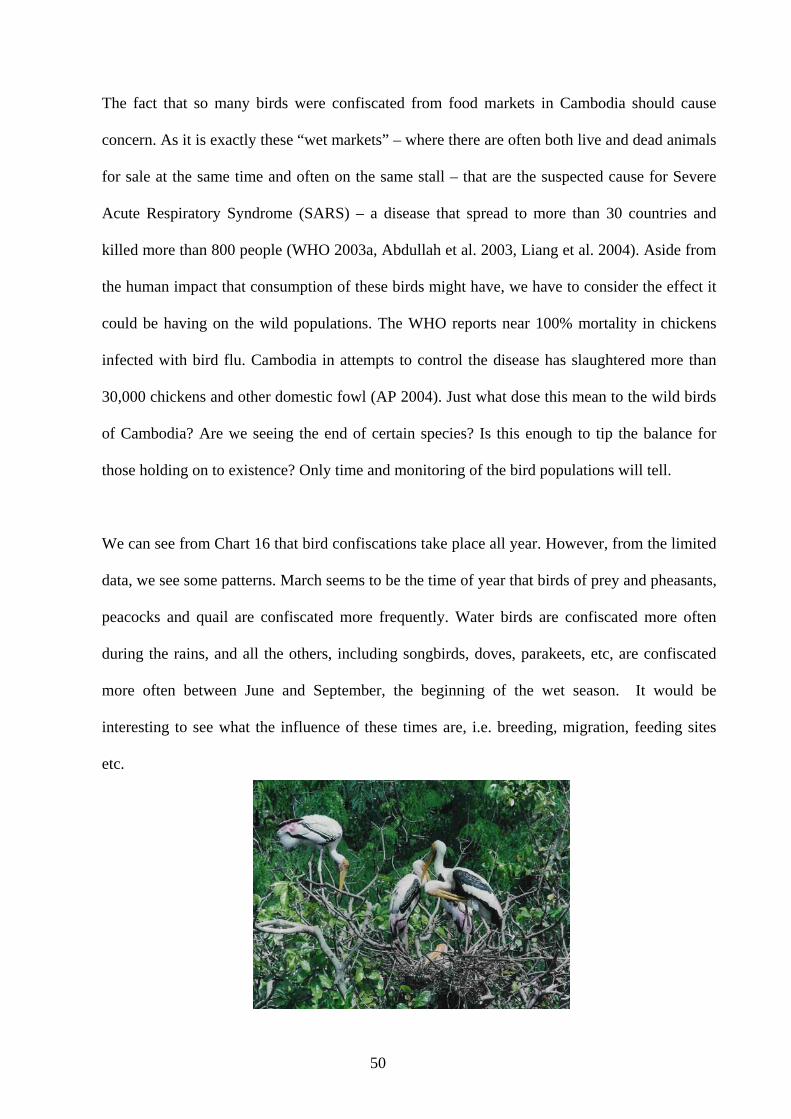
The fact that so many birds were confiscated from food markets in Cambodia should cause
concern. As it is exactly these “wet markets” – where there are often both live and dead animals
for sale at the same time and often on the same stall – that are the suspected cause for Severe
Acute Respiratory Syndrome (SARS) – a disease that spread to more than 30 countries and
killed more than 800 people (WHO 2003a, Abdullah et al. 2003, Liang et al. 2004). Aside from
the human impact that consumption of these birds might have, we have to consider the effect it
could be having on the wild populations. The WHO reports near 100% mortality in chickens
infected with bird flu. Cambodia in attempts to control the disease has slaughtered more than
30,000 chickens and other domestic fowl (AP 2004). Just what dose this mean to the wild birds
of Cambodia? Are we seeing the end of certain species? Is this enough to tip the balance for
those holding on to existence? Only time and monitoring of the bird populations will tell.
We can see from Chart 16 that bird confiscations take place all year. However, from the limited
data, we see some patterns. March seems to be the time of year that birds of prey and pheasants,
peacocks and quail are confiscated more frequently. Water birds are confiscated more often
during the rains, and all the others, including songbirds, doves, parakeets, etc, are confiscated
more often between June and September, the beginning of the wet season. It would be
interesting to see what the influence of these times are, i.e. breeding, migration, feeding sites
etc.
50
DDIISSCCUUSSSSIIOONN AANNDD CCOONNCCLLUUSSIIOONN
From the study we can see that location within the country influences not only the volume of
trade, but also the type of trade and species within the trade. It is not the areas of high human
population where we see the majority of animals being traded, but areas that are known to trade
with the surrounding countries. Many have documented the illegal wildlife trade with
surrounding countries. Global Witness (2001) reported that the killing of six elephants in the
Cardamom Mountains, Koh Kong province, in 2000 was to supply trunks and other products to
Thailand. That same year they also reported that a temple in Preh Vihear, on the
Thai/Cambodia border, was the location of a thriving wildlife market. Tusks of 10-15 elephants,
skins from leopards other cat species along with bear gall bladders, paws etc, were all reported
to be for sale to rich Thai tourists. These markets on the Thai border attract wildlife trade from
across the country. However, the data indicates that the majority of the confiscations were made
along the roads to Vietnam, indicating that the greatest risk to wildlife in Cambodia appears to
be the demand for wildlife by Vietnam. However, whether Vietnam is the end market or an
intermediate market for China is not certain, although research by Hean (2000) indicates that
this is the case. The decision by Vietnam to stop wildlife trafficking by 2010 (Financial Times
2003) will, if it becomes a reality, should go a long way in reducing the trade in wildlife in
Cambodia.
Further work needs to be done on locating the exact location of the wildlife markets in
Cambodia. All border crossings need to be surveyed and a picture of which types of trade can
be associated with particular areas would assist in the knowledge of the trade in the region and
allow for greater focus on aspects of the trade including education and apprehension.
51
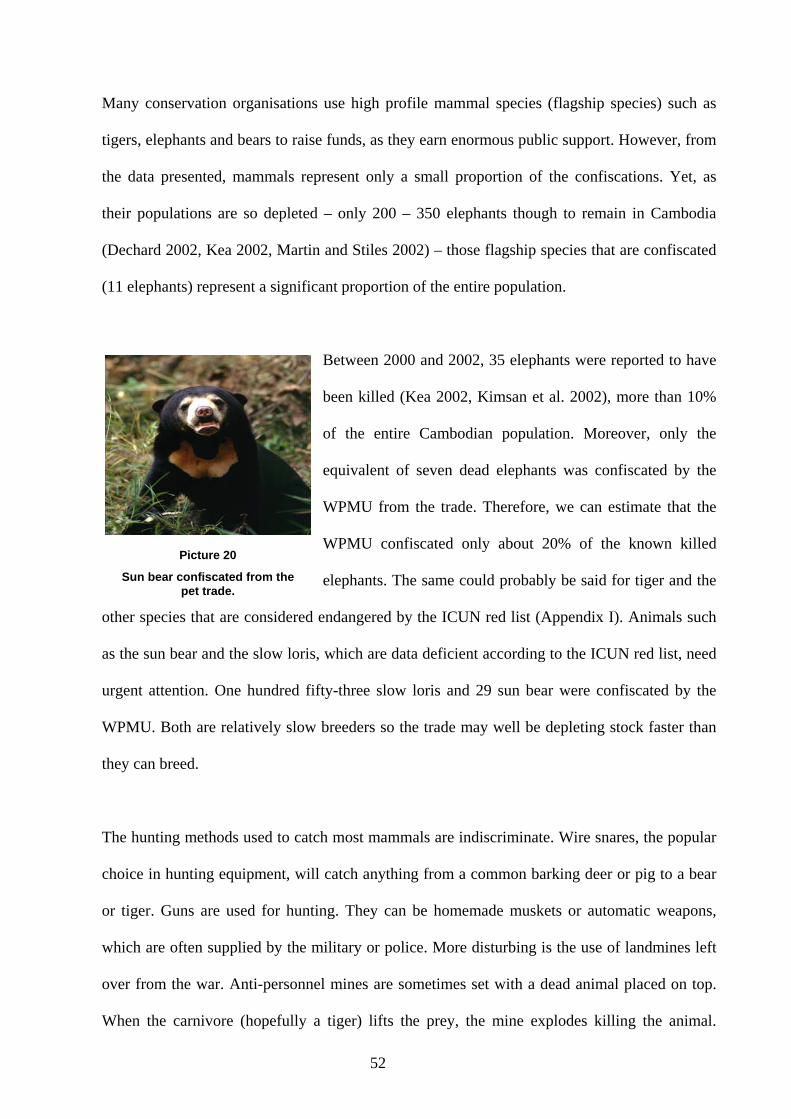
Many conservation organisations use high profile mammal species (flagship species) such as
tigers, elephants and bears to raise funds, as they earn enormous public support. However, from
the data presented, mammals represent only a small proportion of the confiscations. Yet, as
their populations are so depleted – only 200 – 350 elephants though to remain in Cambodia
(Dechard 2002, Kea 2002, Martin and Stiles 2002) – those flagship species that are confiscated
(11 elephants) represent a significant proportion of the entire population.
Between 2000 and 2002, 35 elephants were reported to have
been killed (Kea 2002, Kimsan et al. 2002), more than 10%
of the entire Cambodian population. Moreover, only the
equivalent of seven dead elephants was confiscated by the
WPMU from the trade. Therefore, we can estimate that the
WPMU confiscated only about 20% of the known killed
elephants. The same could probably be said for tiger and the
other species that are considered endangered by the ICUN red list (Appendix I). Animals such
as the sun bear and the slow loris, which are data deficient according to the ICUN red list, need
urgent attention. One hundred fifty-three slow loris and 29 sun bear were confiscated by the
WPMU. Both are relatively slow breeders so the trade may well be depleting stock faster than
they can breed.
Picture 20
Sun bear confiscated from the pet trade.
The hunting methods used to catch most mammals are indiscriminate. Wire snares, the popular
choice in hunting equipment, will catch anything from a common barking deer or pig to a bear
or tiger. Guns are used for hunting. They can be homemade muskets or automatic weapons,
which are often supplied by the military or police. More disturbing is the use of landmines left
over from the war. Anti-personnel mines are sometimes set with a dead animal placed on top.
When the carnivore (hopefully a tiger) lifts the prey, the mine explodes killing the animal.
52
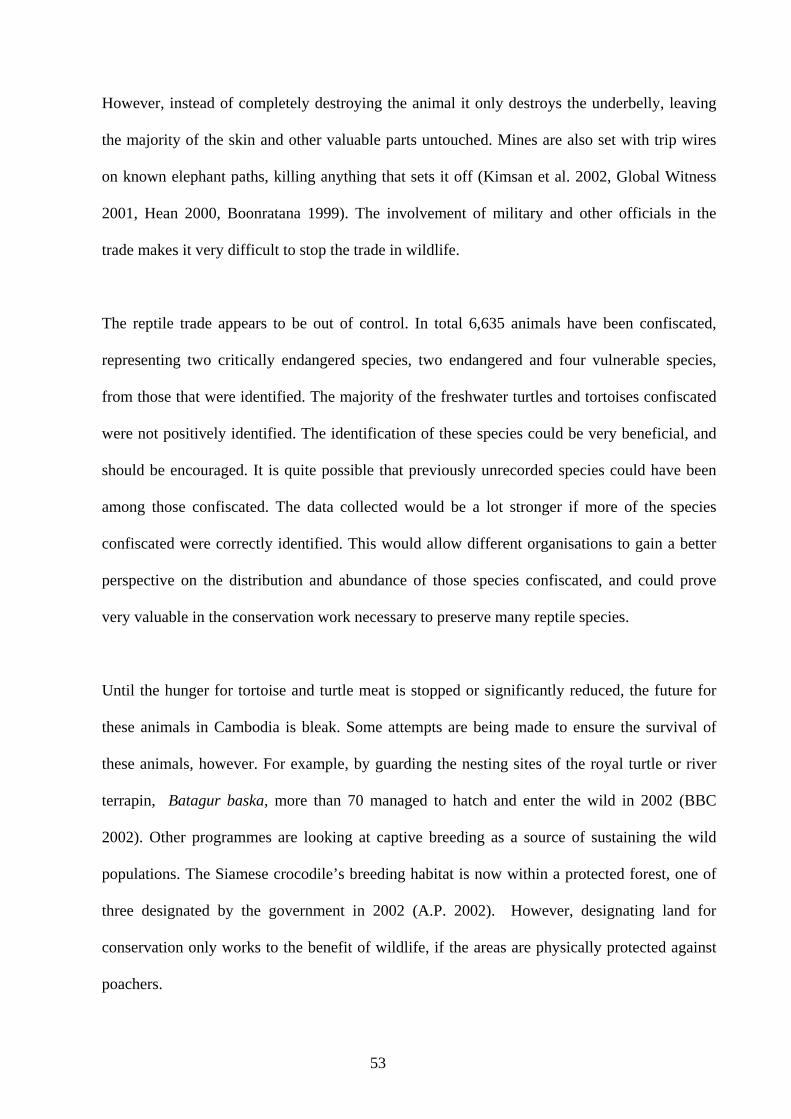
However, instead of completely destroying the animal it only destroys the underbelly, leaving
the majority of the skin and other valuable parts untouched. Mines are also set with trip wires
on known elephant paths, killing anything that sets it off (Kimsan et al. 2002, Global Witness
2001, Hean 2000, Boonratana 1999). The involvement of military and other officials in the
trade makes it very difficult to stop the trade in wildlife.
The reptile trade appears to be out of control. In total 6,635 animals have been confiscated,
representing two critically endangered species, two endangered and four vulnerable species,
from those that were identified. The majority of the freshwater turtles and tortoises confiscated
were not positively identified. The identification of these species could be very beneficial, and
should be encouraged. It is quite possible that previously unrecorded species could have been
among those confiscated. The data collected would be a lot stronger if more of the species
confiscated were correctly identified. This would allow different organisations to gain a better
perspective on the distribution and abundance of those species confiscated, and could prove
very valuable in the conservation work necessary to preserve many reptile species.
Until the hunger for tortoise and turtle meat is stopped or significantly reduced, the future for
these animals in Cambodia is bleak. Some attempts are being made to ensure the survival of
these animals, however. For example, by guarding the nesting sites of the royal turtle or river
terrapin, Batagur baska, more than 70 managed to hatch and enter the wild in 2002 (BBC
2002). Other programmes are looking at captive breeding as a source of sustaining the wild
populations. The Siamese crocodile’s breeding habitat is now within a protected forest, one of
three designated by the government in 2002 (A.P. 2002). However, designating land for
conservation only works to the benefit of wildlife, if the areas are physically protected against
poachers.
53
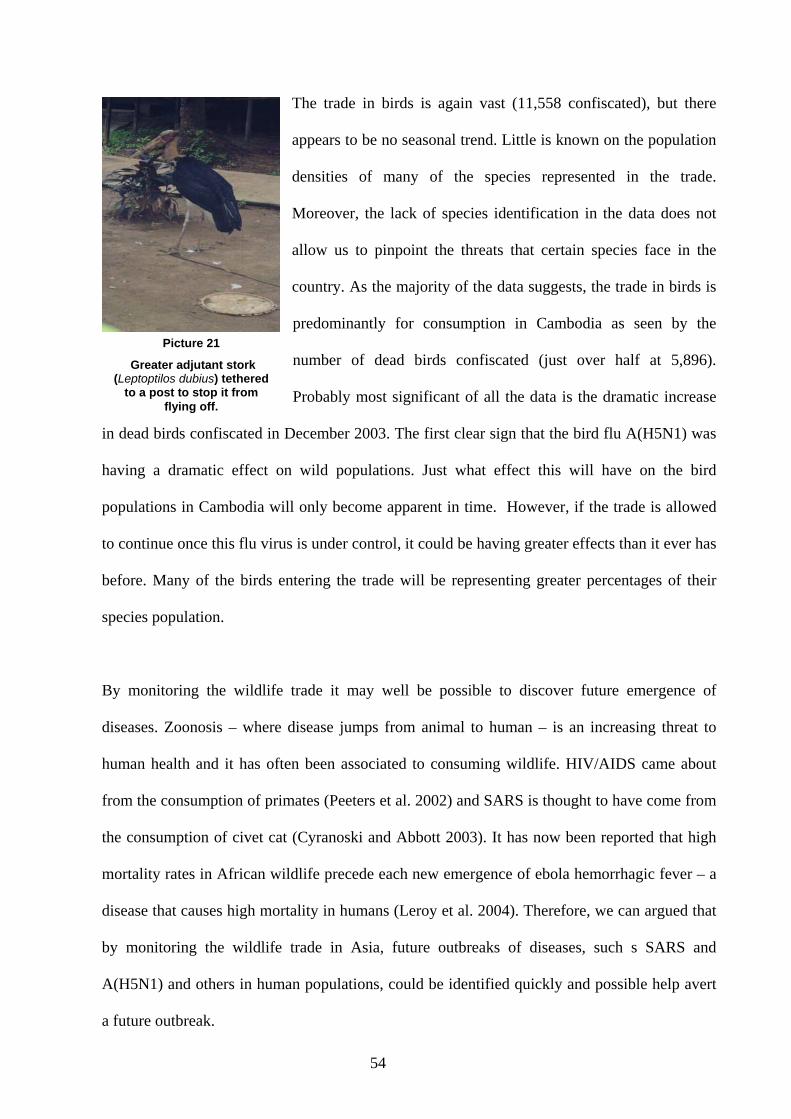
The trade in birds is again vast (11,558 confiscated), but there
appears to be no seasonal trend. Little is known on the population
densities of many of the species represented in the trade.
Moreover, the lack of species identification in the data does not
allow us to pinpoint the threats that certain species face in the
country. As the majority of the data suggests, the trade in birds is
predominantly for consumption in Cambodia as seen by the
number of dead birds confiscated (just over half at 5,896).
Probably most significant of all the data is the dramatic increase
in dead birds confiscated in December 2003. The first clear sign that the bird flu A(H5N1) was
having a dramatic effect on wild populations. Just what effect this will have on the bird
populations in Cambodia will only become apparent in time. However, if the trade is allowed
to continue once this flu virus is under control, it could be having greater effects than it ever has
before. Many of the birds entering the trade will be representing greater percentages of their
species population.
Picture 21
Greater adjutant stork (Leptoptilos dubius) tethered
to a post to stop it from flying off.
By monitoring the wildlife trade it may well be possible to discover future emergence of
diseases. Zoonosis – where disease jumps from animal to human – is an increasing threat to
human health and it has often been associated to consuming wildlife. HIV/AIDS came about
from the consumption of primates (Peeters et al. 2002) and SARS is thought to have come from
the consumption of civet cat (Cyranoski and Abbott 2003). It has now been reported that high
mortality rates in African wildlife precede each new emergence of ebola hemorrhagic fever – a
disease that causes high mortality in humans (Leroy et al. 2004). Therefore, we can argued that
by monitoring the wildlife trade in Asia, future outbreaks of diseases, such s SARS and
A(H5N1) and others in human populations, could be identified quickly and possible help avert
a future outbreak.
54
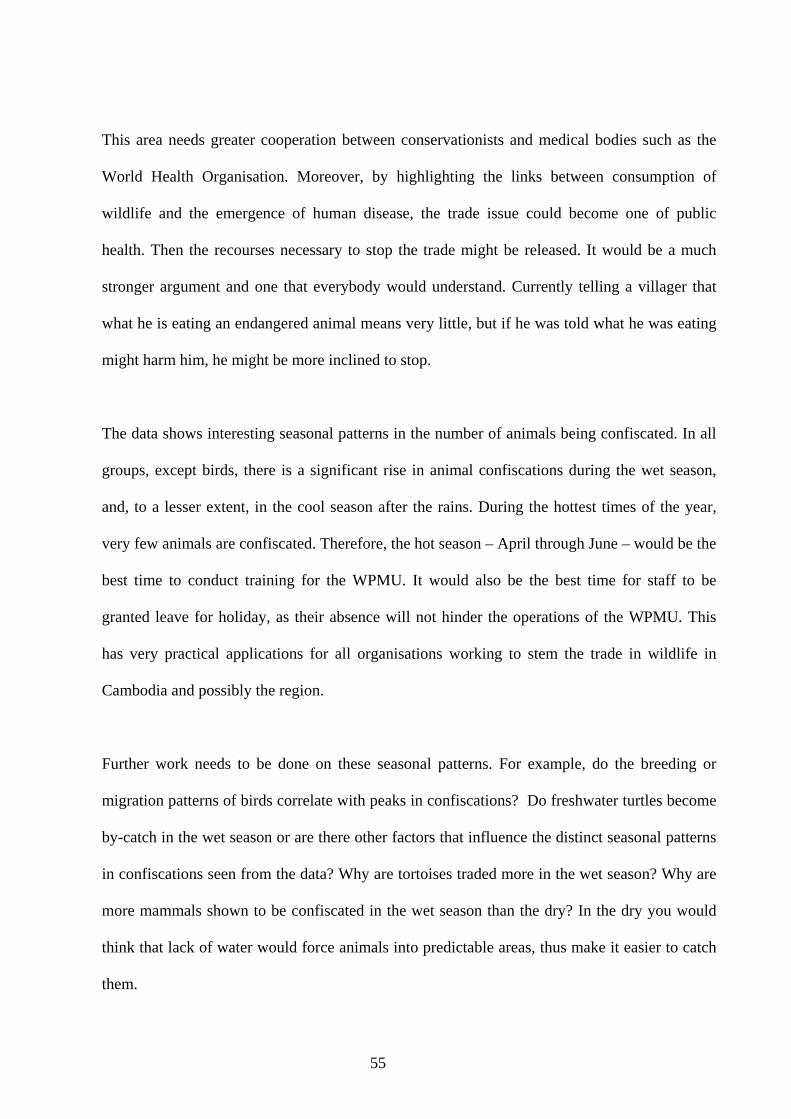
This area needs greater cooperation between conservationists and medical bodies such as the
World Health Organisation. Moreover, by highlighting the links between consumption of
wildlife and the emergence of human disease, the trade issue could become one of public
health. Then the recourses necessary to stop the trade might be released. It would be a much
stronger argument and one that everybody would understand. Currently telling a villager that
what he is eating an endangered animal means very little, but if he was told what he was eating
might harm him, he might be more inclined to stop.
The data shows interesting seasonal patterns in the number of animals being confiscated. In all
groups, except birds, there is a significant rise in animal confiscations during the wet season,
and, to a lesser extent, in the cool season after the rains. During the hottest times of the year,
very few animals are confiscated. Therefore, the hot season – April through June – would be the
best time to conduct training for the WPMU. It would also be the best time for staff to be
granted leave for holiday, as their absence will not hinder the operations of the WPMU. This
has very practical applications for all organisations working to stem the trade in wildlife in
Cambodia and possibly the region.
Further work needs to be done on these seasonal patterns. For example, do the breeding or
migration patterns of birds correlate with peaks in confiscations? Do freshwater turtles become
by-catch in the wet season or are there other factors that influence the distinct seasonal patterns
in confiscations seen from the data? Why are tortoises traded more in the wet season? Why are
more mammals shown to be confiscated in the wet season than the dry? In the dry you would
think that lack of water would force animals into predictable areas, thus make it easier to catch
them.
55
In conclusion, this small glimpse of the trade of wildlife in Cambodia between July 2001 and
December 2003 has yielded some interesting data. Over 19,789 animals have been confiscated,
representing 1,596 mammals, 6,635 reptiles, and a staggering 11,558 birds. It appears that the
majority of animals confiscated are in markets on roads to Vietnam and Thailand, indicating
that the demand for wildlife is from outside the country. Therefore, until demand from those
countries is curbed the rate of wildlife being traded in Cambodia will probably continue. The
work that the WPMU is currently doing is much needed, not just in Cambodia but also in the
region. They are specialised in wildlife crime, allowing them to turn all resources towards
fighting the trade, something that few countries in the region are able to do.
By maintaining the database over the coming years the trends that are seen in this project will
become more evident. By using the information that this project has provided, the WPMU
should be able to channel resources and time to particular areas highlighted, making larger
differences in the trade in wildlife currently seen in Cambodia. It may also be possible in the
future to further specialise people within the WPMU to the particular groups of animals,
helping to improve the identification of animals that are confiscated. The data collected is of
biological significance and should be treated as such.
The trade in wildlife in Cambodia is unsustainable at the rate the data implies. Therefore, unless
it is stopped soon the richly biodiverse country will become void of animals, which will have
knock-on effects that will substantially reduce the beauty of this war-torn land. However, other
sources of income need to be found for the people who are currently reliant on the wildlife trade
for their existence.
56
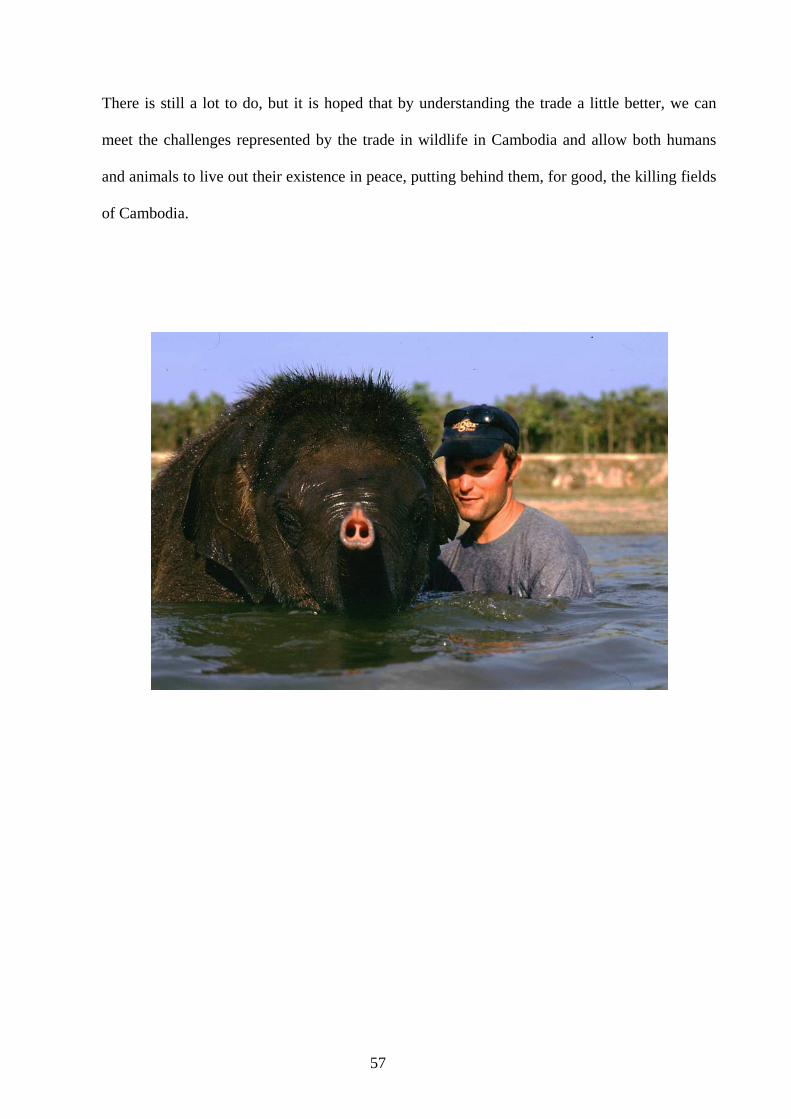
There is still a lot to do, but it is hoped that by understanding the trade a little better, we can
meet the challenges represented by the trade in wildlife in Cambodia and allow both humans
and animals to live out their existence in peace, putting behind them, for good, the killing fields
of Cambodia.
57
AACCKKNNOOWWLLEEDDGGEEMMEENNTTSS I would like to thank WildAid especially Suawana Gauntlett, president of WildAid, for giving me permission to analyse the data collected by the WPMU, Nick Marks for helping in the communication and Kethya for putting together the information for me. I would also like to thank the entire team of the WPMU for working hard to combat the trade in wildlife in Cambodia, without which this data would not be available. I would also like to thank Dr Peter Moore for encouragement and guidance throughout the project and Dr Allen Pentacost for guidance in the calculations. Last but by no means least I would like to thank my wife Hillary Jackson for constant support throughout.
58
RREEFFEERREENNCCEE A.P. 2002. Cambodia Declares Pristine Mountain Forest Protected Area. Associated Press News Service A.P. 2004. Cambodia Reports Two New Bird Flu Cases. Associated Press News Service. Attenborough. D. 2003. Life on Air: Memoirs of a Broadcaster. BBC Books. Banks. D. and Doherty. F. 2001. Thailand’s Tiger Economy. (Edit) Currey. D. EIA Report. www.eia-international.org Barzyk. J.E. 2003. Turtles in Crisis: The Asian Food Markets. www.tortoisetrust.org BBC. 2000. Pol Pot; Life of a Tyrant. www.bbc.co.uk Bizot. F. 2003. The Gate. The Harvill Press London Boonratana. R. 1999. A Preliminary Wildlife Survey in the Cardamom Mountains Region of Southwestern Cambodia. (edit) Momberg. F. and Weiler. H. Conservation Status of the Cardamom Mountains in Southwestern Cambodia. Flora and Fauna International Report. 11-27 Bradsher K. 2004. Spread of Flu Across Asia Laid to Birds That Migrate. The New York Times Coren. M. 2004. Wildlife Trade Dimming the Hopes for Endangered Species. Phnom Penh Post 13, 2: 16-29. Cyranoski. D. and Abbott. A. 2003. Virus Detectives Seek Source of SARS in China’s Wild Animals. Nature, 423: 467 Dalton. R. 2003. Mock Turtles. Nature. 423: 219-220 Dechard. C. 2002. Poachers Still Targeting Endangered Elephants in Cambodia. Associated Press News Service. ENS 2002. Camera Traps Capture Rare Cambodian Wildlife. Environment News Service. www.ens.lycos.com Financial Times. 2003.. Ealth & Environment: Vietnam To Further Tighten Wild Animal Trafficking In The 2004-10 Period. The Financial Times Global News Wire. Giulio. D.B.D. and Eckburg P.B., 2004. Human Monkeypox: an Emerging Zoonosis. The Lancet Infectious Disease. 4: 15-25 Global Whitness. 2000. Chainsaws Speak Louder Than Words. www.globalwitness.org
59
Global Witness. 2001. The Credibility Gap – And The Need To Bridge It. www.globalwitness.org Gross. E. 2003. Update on Emerging Infections: News From the Centers for Disease Control and Prevention. Annals of Emergency Medicine. 42, 5: 660-664 Hean. S. 2000. The Status of the Tiger and its Conservation in Cambiodia. (unpublished thesis for the University of Minnesota) Hoan. B. 2004. Economic Value of Macaques. The people’s army newspaper. 15349 Hopkins. K. 2003. Judge Clears the Way for Relocation to Texas. Asbury Park Press. Hunt. L. 2001. Fatal Trade, Cambodia’s Disappearing Wildlife on Sale – At the Local Market. Agence France-Presse. IFAW 2004. Elephants on the High street, an Investigation Into Ivory Trade in the U.K. www.ifaw.org. Kea. P., 2002. Conservationists Decry Hunting of Elephants in Cambodia. Kyodo News Service. Kuiken. T., Fouchier. R., Rimmelzwaan. G. and Osterhaus. A. 2003. Emerging Viral Infections In A Rapidly Changing World. Current Opinion in Biotechnology, 14: 641-646 Keating. G. 2003. Ninety Dead Tigers Found at California Cat Rescue Home. Reuters news service Kimsan. O., Masphal. K., Nowell. K., Omalliss. K., Sandrine. P., Polin. S., Seiha, Uch. and Weiler. H. 2002. Cambodia Tiger Conservation Project Community Wildlife Ranger Program Report 2001-2002. Cat Action Treasury. www.felidae.org Liang. W., Zhu. Z.,Guo. J., Liu. Z., He. X., Zhou. W., Chin. D.P. and Schuchat. A. Severe Acute Respiratory Syndrome, Beijing, 2003. Emerging infectious Diseases. 10, 1: 25-31 Leroy. E.M., Rouquet. P., Formenty. P., Souquiere. S., Kilbourne. A., Froment. J.M., Bermejo. M., Smit. S., Karesh. W., Swanepoel. .R., Zaki. S.R., and Rollin. P.E. 2004. Multiple Ebola Virus Transmission Events And Rapid Decline Of Central African Wildlife. Science, 16: 303(5656): 387-90 Lovell. J. 2003. Wild Animals Slaughter Surges for Fashion’s Sake. Reuters News Agency Nakashima. E. 2003. Thai’s Crack Down on Wildlife Trafficking: Search for Endangered Species Nets More Than 33,000 Animals in Six Weeks. The Washington Post
Mackenzie J.S., Chua K.B., Daniels P.W., Eaton B.T., Field H.E., Hall R.A., Halpin K., Johansen C.A., Kirkland P.D., Lam S.K., McMinn P., Nisbet D.J., Paru R., Pyke A.T., Ritchie S.A., Siba P., Smith D.W., Smith G.A., van den Hurk A.F., Wang L.F. and Williams D.T. 2001. Emerging Viral Diseases of Southeast Asia and the Western Pacific. Emerging Infectious Diseases, 7, 3: 497 - 504
Martin. E., Stiles. D. 2002. The South and Southeast Asian Ivory Markets. Save the elephants.
60
Milner-Gulland. E.J., Bennett. E.L. and the SCB 2002 Annual Meeting Wild Meat Group. 2003. Wild Meat the Bigger Picture. Trends in Ecology and Evolution. 97: 1-7 Momberg. F. , Weiler. H. and Hardke. M. 1999. Conservation Status of the Cardamom Mountains in Southwestern Cambodia. Flora and Fauna International Report. 6-10. Moore. P.D. 2001. The Rising Cost of Bushmeat. Nature. 409: 775-777 Normile. D. 2004. Viral DNA Match Spurs China’s Civet Roundup. Science. 303: 292 Olson. J., Rupprecht. C., Rollin. P., Sam An. U., Niezgoda. M., Clemins. T., Walston. J, and Ksiazek. T, 2002. Antibodies to Nipah-like Virus in Bats (Pteropus lyeli), Cambodia. Emerging Infectious Diseases 8(9) Pearson. H. 2003. SARS May be Mammal-Bird Merger. Nature. www.nature.com Peeters. M., Courgnaud. V., Abela. B., Auzel. P., Pourrut. X., Bibollet-Ruche. F., Loul. S., Liegeois. F., Butel. C., Koulagna. D., Mpoudi-Ngole. E., Shaw. G. M., Hahn. B. H and Delaporte. E., 2002. Risk to Human Health from a Plethora of Simian Immunodeficiency Viruses in Primate Bushmeat. Emerging Infectious Diseases, 8: 5, 451-457 Pendry. S. 2002. Launch of UK National Wildlife Crime Intelligence Unit. Traffic Bulletin. 19, 2: 53 P.V. 2001. Exporting Long Tailed Macaques. Sai Gon Liberation. 8786 (translated from Vietnamese) Reuters. 2003. Tiger and Alligator Shared Apartment. Reuters News Service. www.planetark.org Reuters. 2004. China to Reopen Game Markets Despite Health Fears. Reuters News Service. www.planetark.org Rooney. D. 1999. Angkor, an Introduction to the Temples. Odyssey. Severinghaus. L.L. and Chi. L. 1999. Prayer Release in Taiwan. Biological Conservation. 89: 301-304 Smith. C. 2003. Illegal Wildlife Trade Growing in London, Police Warn. www.thisislondon.com Stibig. H.J. and Beuchle. R. 2003. Forest Cover Map of Continental Southeast Asia at 1:4 000 000. www.gvm.jrc.it Still. J. 2003. Use of Animal Products in Traditional Chinese Medicine: Environmental Impact and Health Hazards. Complementary Therapies in Medicine. 11: 118-122 Traffic. 2002. Seizures and Prosecutions. Traffic Bulletin. 19, 2: 76-79 Traffic. 2003. Seizures and Prosecutions. Traffic Bulletin. 19, 3: 149-152
61
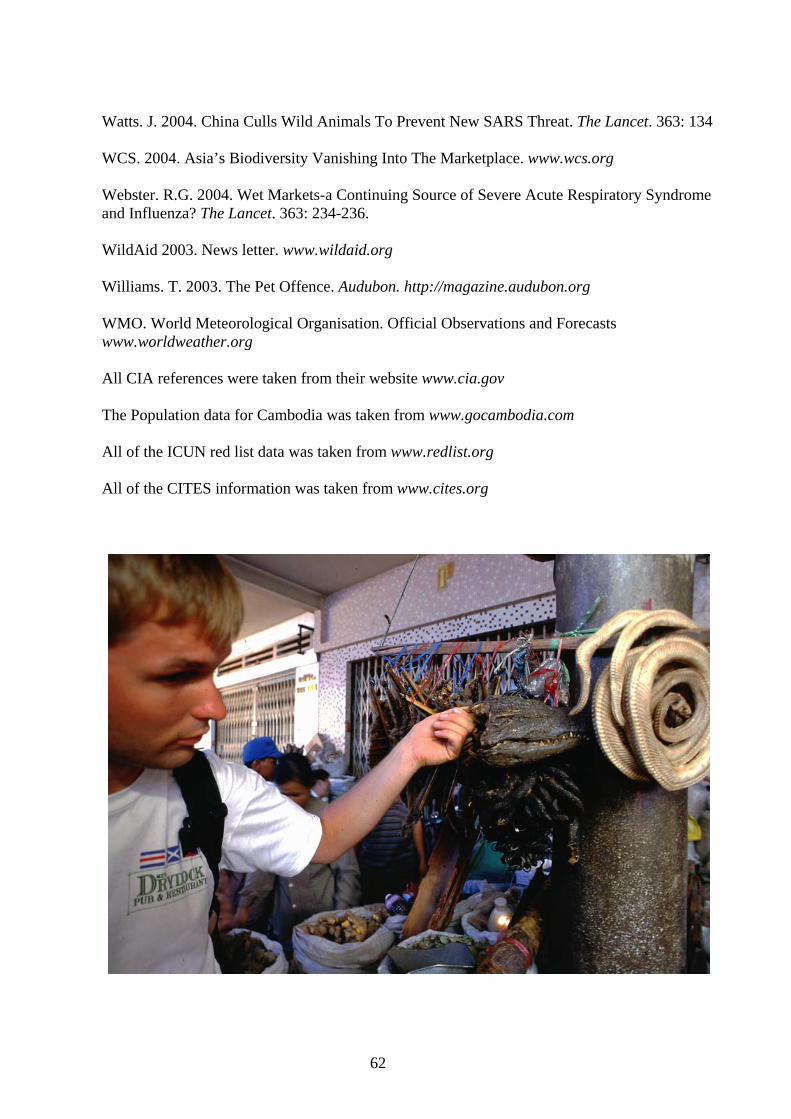
Watts. J. 2004. China Culls Wild Animals To Prevent New SARS Threat. The Lancet. 363: 134 WCS. 2004. Asia’s Biodiversity Vanishing Into The Marketplace. www.wcs.org Webster. R.G. 2004. Wet Markets-a Continuing Source of Severe Acute Respiratory Syndrome and Influenza? The Lancet. 363: 234-236. WildAid 2003. News letter. www.wildaid.org Williams. T. 2003. The Pet Offence. Audubon. http://magazine.audubon.org WMO. World Meteorological Organisation. Official Observations and Forecasts www.worldweather.org All CIA references were taken from their website www.cia.gov The Population data for Cambodia was taken from www.gocambodia.com All of the ICUN red list data was taken from www.redlist.org All of the CITES information was taken from www.cites.org
62
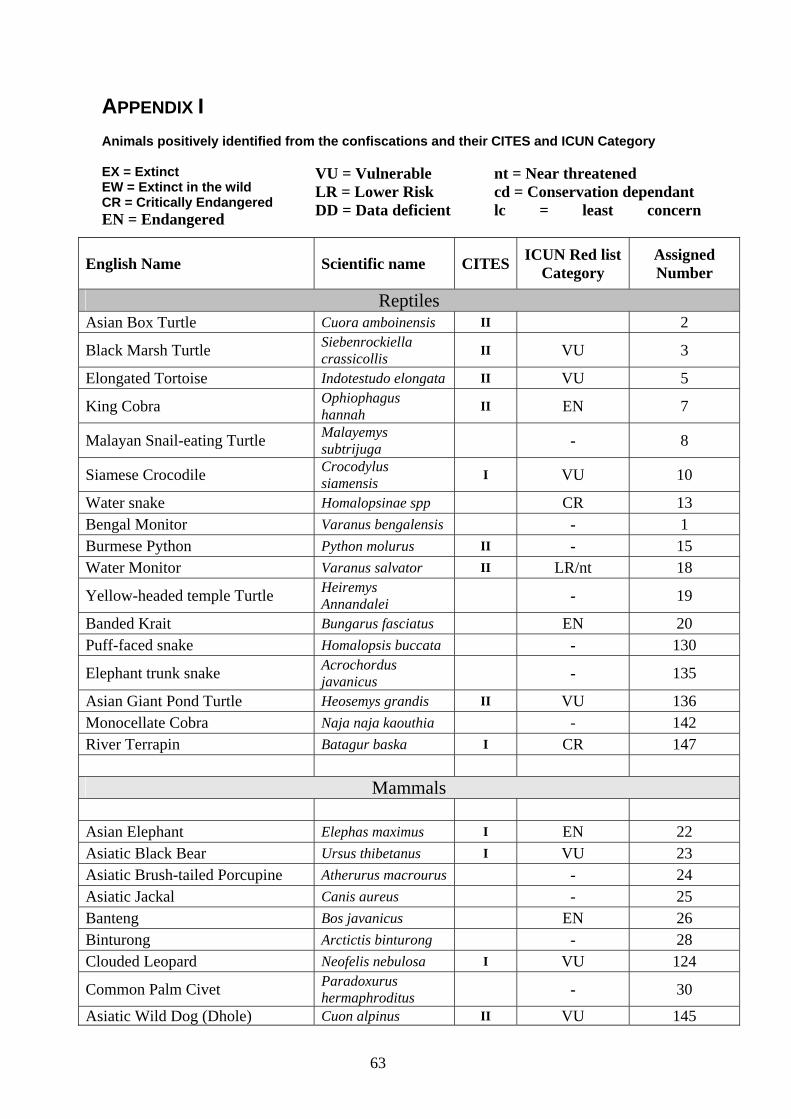
63
APPENDIX I Animals positively identified from the confiscations and their CITES and ICUN Category EX = Extinct EW = Extinct in the wild CR = Critically Endangered EN = Endangered
VU = Vulnerable LR = Lower Risk DD = Data deficient
nt = Near threatened cd = Conservation dependant lc = least concern
English Name Scientific name CITES ICUN Red list Category
Assigned Number
Reptiles Asian Box Turtle Cuora amboinensis II 2
Black Marsh Turtle Siebenrockiella crassicollis II VU 3
Elongated Tortoise Indotestudo elongata II VU 5
King Cobra Ophiophagus hannah II EN 7
Malayan Snail-eating Turtle Malayemys subtrijuga - 8
Siamese Crocodile Crocodylus siamensis I VU 10
Water snake Homalopsinae spp CR 13 Bengal Monitor Varanus bengalensis - 1 Burmese Python Python molurus II - 15 Water Monitor Varanus salvator II LR/nt 18
Yellow-headed temple Turtle Heiremys Annandalei - 19
Banded Krait Bungarus fasciatus EN 20 Puff-faced snake Homalopsis buccata - 130
Elephant trunk snake Acrochordus javanicus - 135
Asian Giant Pond Turtle Heosemys grandis II VU 136 Monocellate Cobra Naja naja kaouthia - 142 River Terrapin Batagur baska I CR 147
Mammals Asian Elephant Elephas maximus I EN 22 Asiatic Black Bear Ursus thibetanus I VU 23 Asiatic Brush-tailed Porcupine Atherurus macrourus - 24 Asiatic Jackal Canis aureus - 25 Banteng Bos javanicus EN 26 Binturong Arctictis binturong - 28 Clouded Leopard Neofelis nebulosa I VU 124
Common Palm Civet Paradoxurus hermaphroditus - 30
Asiatic Wild Dog (Dhole) Cuon alpinus II VU 145
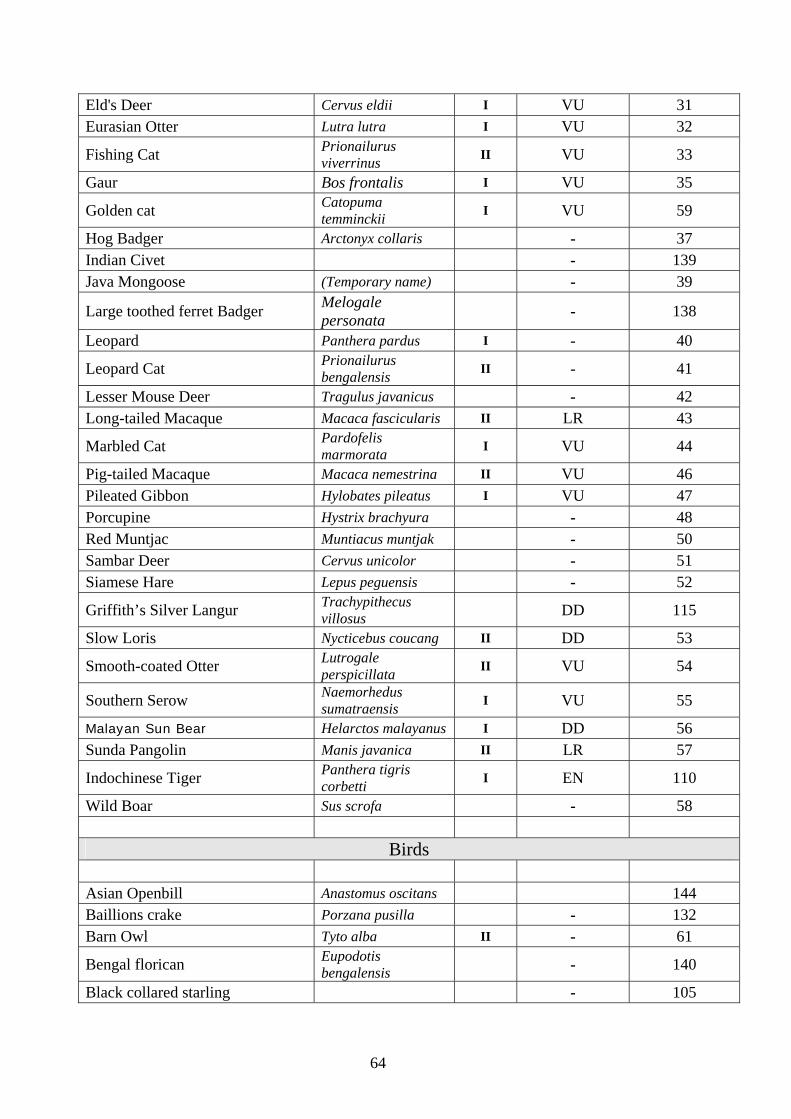
Eld's Deer Cervus eldii I VU 31 Eurasian Otter Lutra lutra I VU 32
Fishing Cat Prionailurus viverrinus II VU 33
Gaur Bos frontalis I VU 35
Golden cat Catopuma temminckii I VU 59
Hog Badger Arctonyx collaris - 37 Indian Civet - 139 Java Mongoose (Temporary name) - 39
Large toothed ferret Badger Melogale personata - 138
Leopard Panthera pardus I - 40
Leopard Cat Prionailurus bengalensis II - 41
Lesser Mouse Deer Tragulus javanicus - 42 Long-tailed Macaque Macaca fascicularis II LR 43
Marbled Cat Pardofelis marmorata I VU 44
Pig-tailed Macaque Macaca nemestrina II VU 46 Pileated Gibbon Hylobates pileatus I VU 47 Porcupine Hystrix brachyura - 48 Red Muntjac Muntiacus muntjak - 50 Sambar Deer Cervus unicolor - 51 Siamese Hare Lepus peguensis - 52
Griffith’s Silver Langur Trachypithecus villosus DD 115
Slow Loris Nycticebus coucang II DD 53
Smooth-coated Otter Lutrogale perspicillata II VU 54
Southern Serow Naemorhedus sumatraensis I VU 55
Malayan Sun Bear Helarctos malayanus I DD 56 Sunda Pangolin Manis javanica II LR 57
Indochinese Tiger Panthera tigris corbetti I EN 110
Wild Boar Sus scrofa - 58
Birds Asian Openbill Anastomus oscitans 144 Baillions crake Porzana pusilla - 132 Barn Owl Tyto alba II - 61
Bengal florican Eupodotis bengalensis - 140
Black collared starling - 105
64
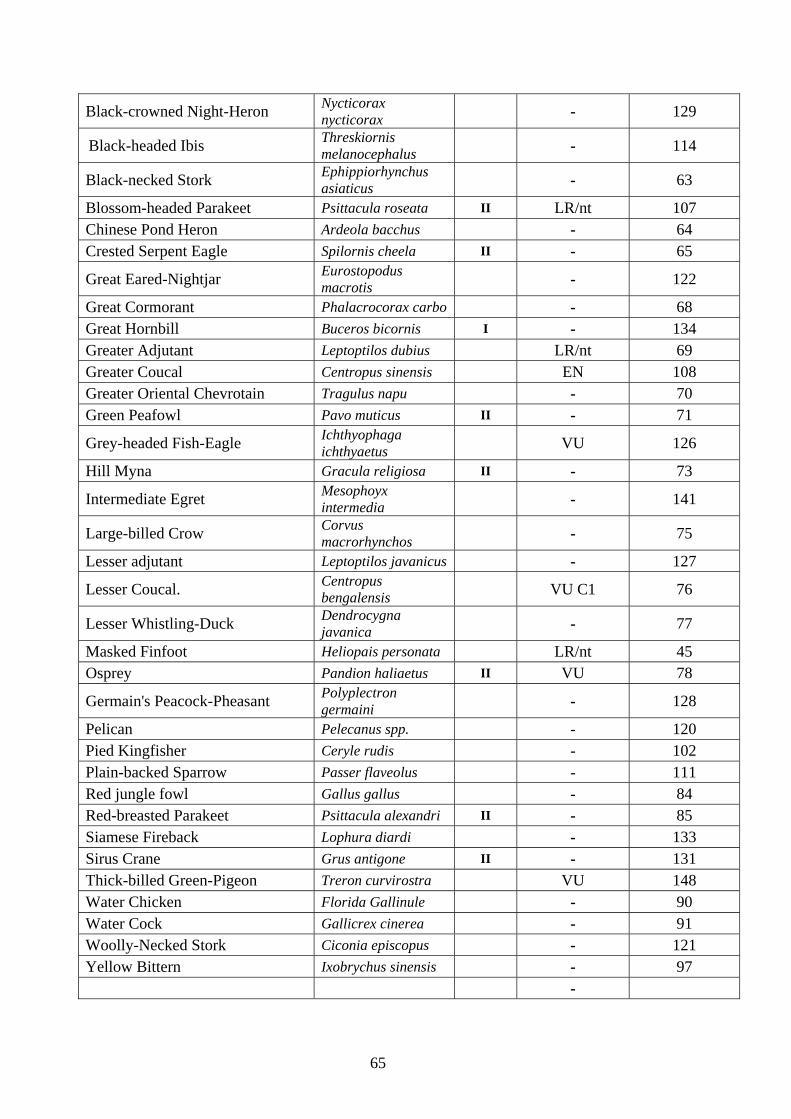
Black-crowned Night-Heron Nycticorax nycticorax - 129
Black-headed Ibis Threskiornis melanocephalus - 114
Black-necked Stork Ephippiorhynchus asiaticus - 63
Blossom-headed Parakeet Psittacula roseata II LR/nt 107 Chinese Pond Heron Ardeola bacchus - 64 Crested Serpent Eagle Spilornis cheela II - 65
Great Eared-Nightjar Eurostopodus macrotis - 122
Great Cormorant Phalacrocorax carbo - 68 Great Hornbill Buceros bicornis I - 134 Greater Adjutant Leptoptilos dubius LR/nt 69 Greater Coucal Centropus sinensis EN 108 Greater Oriental Chevrotain Tragulus napu - 70 Green Peafowl Pavo muticus II - 71
Grey-headed Fish-Eagle Ichthyophaga ichthyaetus VU 126
Hill Myna Gracula religiosa II - 73
Intermediate Egret Mesophoyx intermedia - 141
Large-billed Crow Corvus macrorhynchos - 75
Lesser adjutant Leptoptilos javanicus - 127
Lesser Coucal. Centropus bengalensis VU C1 76
Lesser Whistling-Duck Dendrocygna javanica - 77
Masked Finfoot Heliopais personata LR/nt 45 Osprey Pandion haliaetus II VU 78
Germain's Peacock-Pheasant Polyplectron germaini - 128
Pelican Pelecanus spp. - 120 Pied Kingfisher Ceryle rudis - 102 Plain-backed Sparrow Passer flaveolus - 111 Red jungle fowl Gallus gallus - 84 Red-breasted Parakeet Psittacula alexandri II - 85 Siamese Fireback Lophura diardi - 133 Sirus Crane Grus antigone II - 131 Thick-billed Green-Pigeon Treron curvirostra VU 148 Water Chicken Florida Gallinule - 90 Water Cock Gallicrex cinerea - 91 Woolly-Necked Stork Ciconia episcopus - 121 Yellow Bittern Ixobrychus sinensis - 97 -
65
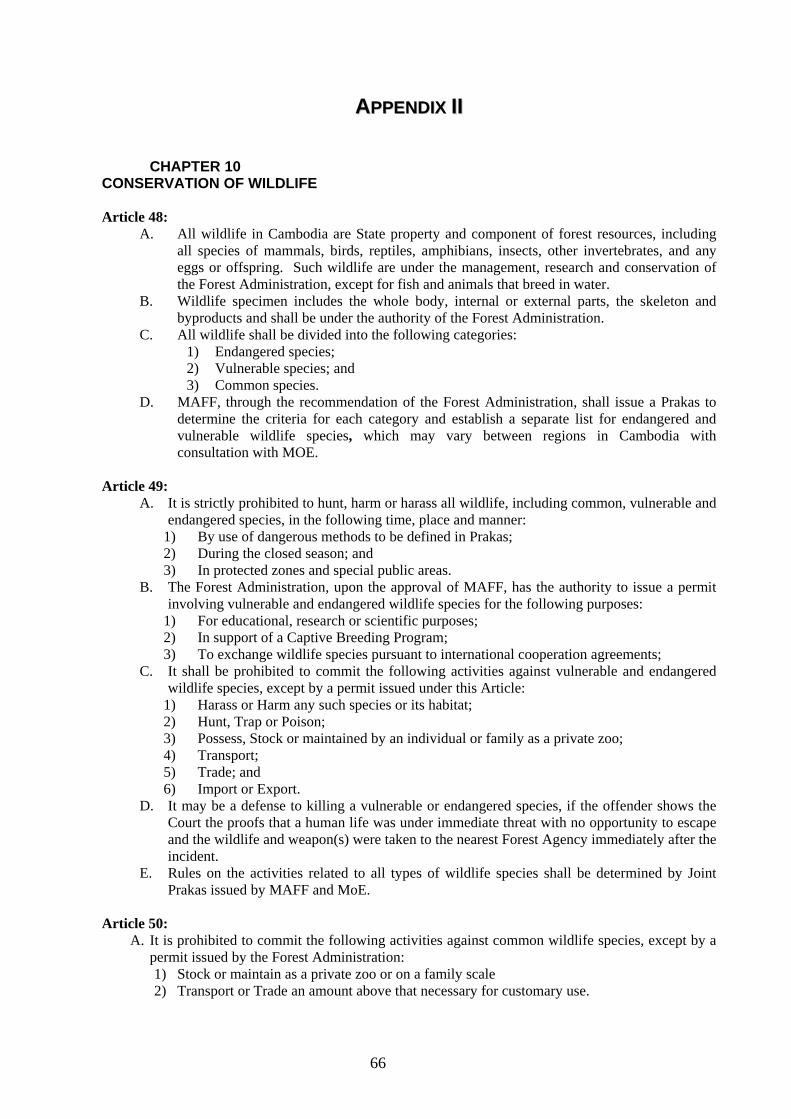
AAPPPPEENNDDIIXX IIII
CHAPTER 10
CONSERVATION OF WILDLIFE Article 48:
A. All wildlife in Cambodia are State property and component of forest resources, including all species of mammals, birds, reptiles, amphibians, insects, other invertebrates, and any eggs or offspring. Such wildlife are under the management, research and conservation of the Forest Administration, except for fish and animals that breed in water.
B. Wildlife specimen includes the whole body, internal or external parts, the skeleton and byproducts and shall be under the authority of the Forest Administration.
C. All wildlife shall be divided into the following categories: 1) Endangered species; 2) Vulnerable species; and 3) Common species.
D. MAFF, through the recommendation of the Forest Administration, shall issue a Prakas to determine the criteria for each category and establish a separate list for endangered and vulnerable wildlife species, which may vary between regions in Cambodia with consultation with MOE.
Article 49:
A. It is strictly prohibited to hunt, harm or harass all wildlife, including common, vulnerable and endangered species, in the following time, place and manner:
1) By use of dangerous methods to be defined in Prakas; 2) During the closed season; and 3) In protected zones and special public areas.
B. The Forest Administration, upon the approval of MAFF, has the authority to issue a permit involving vulnerable and endangered wildlife species for the following purposes:
1) For educational, research or scientific purposes; 2) In support of a Captive Breeding Program; 3) To exchange wildlife species pursuant to international cooperation agreements;
C. It shall be prohibited to commit the following activities against vulnerable and endangered wildlife species, except by a permit issued under this Article:
1) Harass or Harm any such species or its habitat; 2) Hunt, Trap or Poison; 3) Possess, Stock or maintained by an individual or family as a private zoo; 4) Transport; 5) Trade; and 6) Import or Export.
D. It may be a defense to killing a vulnerable or endangered species, if the offender shows the Court the proofs that a human life was under immediate threat with no opportunity to escape and the wildlife and weapon(s) were taken to the nearest Forest Agency immediately after the incident.
E. Rules on the activities related to all types of wildlife species shall be determined by Joint Prakas issued by MAFF and MoE.
Article 50:
A. It is prohibited to commit the following activities against common wildlife species, except by a permit issued by the Forest Administration: 1) Stock or maintain as a private zoo or on a family scale 2) Transport or Trade an amount above that necessary for customary use.
66
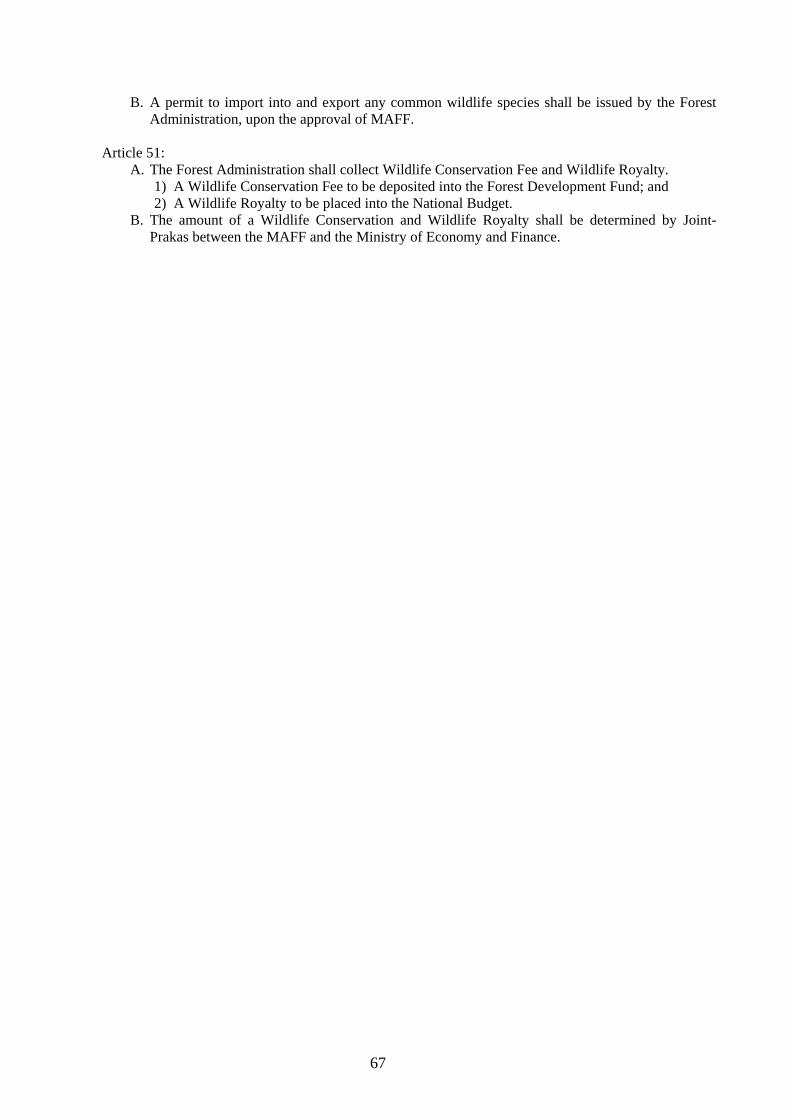
67
B. A permit to import into and export any common wildlife species shall be issued by the Forest Administration, upon the approval of MAFF.
Article 51:
A. The Forest Administration shall collect Wildlife Conservation Fee and Wildlife Royalty. 1) A Wildlife Conservation Fee to be deposited into the Forest Development Fund; and 2) A Wildlife Royalty to be placed into the National Budget.
B. The amount of a Wildlife Conservation and Wildlife Royalty shall be determined by Joint-Prakas between the MAFF and the Ministry of Economy and Finance.
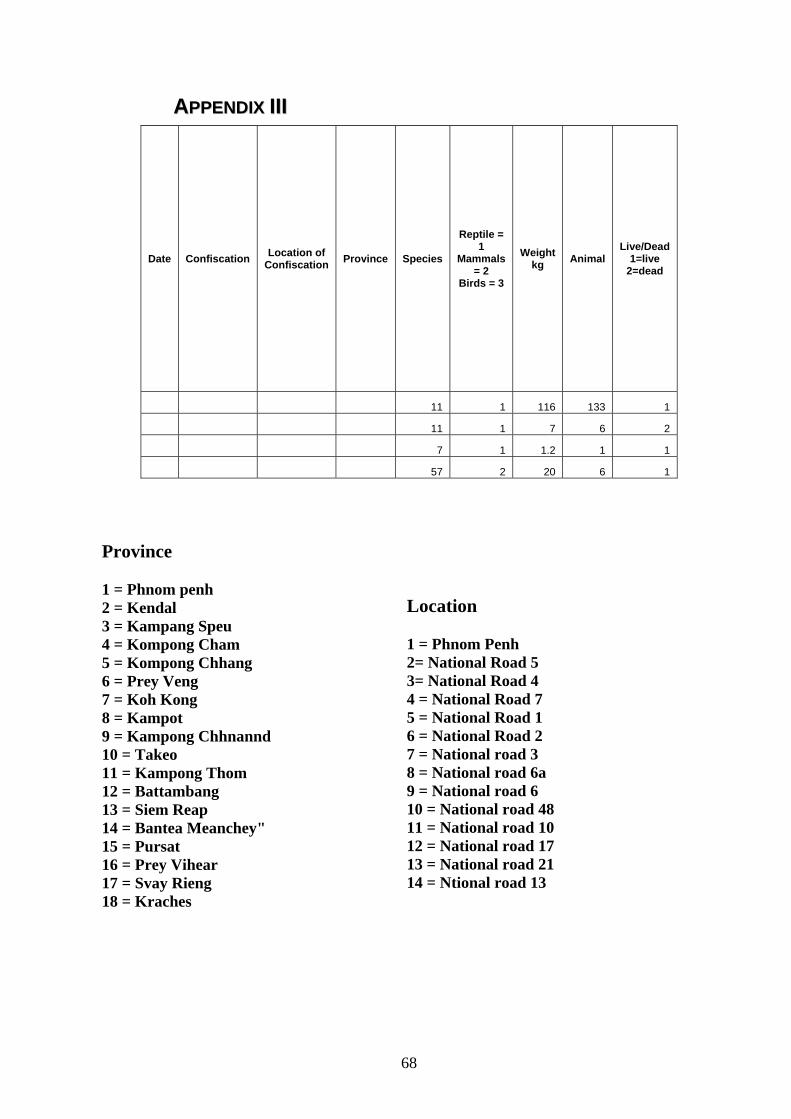
AAPPPPEENNDDIIXX IIIIII
Province 1 = Phnom penh 2 = Kendal 3 = Kampang Speu 4 = Kompong Cham 5 = Kompong Chhang 6 = Prey Veng 7 = Koh Kong 8 = Kampot 9 = Kampong Chhnannd 10 = Takeo 11 = Kampong Thom 12 = Battambang 13 = Siem Reap 14 = Bantea Meanchey" 15 = Pursat 16 = Prey Vihear 17 = Svay Rieng 18 = Kraches
Location 1 = Phnom Penh 2= National Road 5 3= National Road 4 4 = National Road 7 5 = National Road 1 6 = National Road 2 7 = National road 3 8 = National road 6a 9 = National road 6 10 = National road 48 11 = National road 10 12 = National road 17 13 = National road 21 14 = Ntional road 13
Date Confiscation Location of Confiscation Province Species
Reptile = 1
Mammals = 2
Birds = 3
Weight kg Animal
Live/Dead 1=live
2=dead
11 1 116 133 1
11 1 7 6 2
7 1 1.2 1 1
57 2 20 6 1
68