wildland fire emissions information system for ... · fuelbed map •fuelbeds are mapped via...
TRANSCRIPT

www.mtri.org
Nancy HF French*, Don McKenzie, Tyler Erickson
*Presented at the 2012 ACCENT-IGAC-GEIA Conference, 11-13 June Toulouse, France
Wildland Fire Emissions Information System for retrospective fire emissions mapping for North America
Fire & Carbon
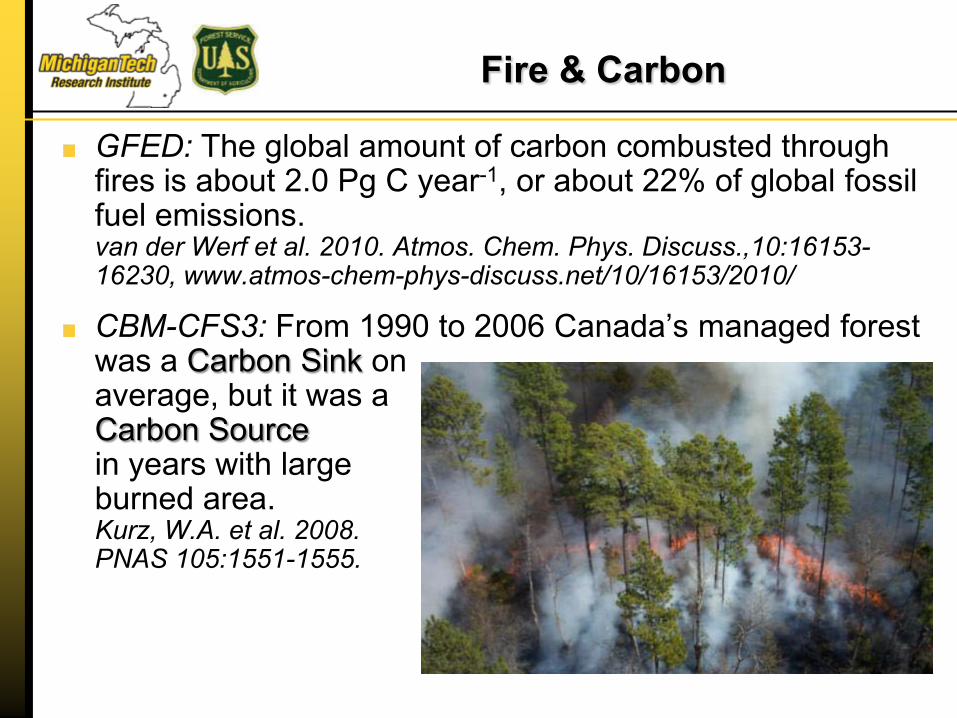
GFED: The global amount of carbon combusted through fires is about 2.0 Pg C year-1, or about 22% of global fossil fuel emissions. van der Werf et al. 2010. Atmos. Chem. Phys. Discuss.,10:16153-16230, www.atmos-chem-phys-discuss.net/10/16153/2010/
CBM-CFS3: From 1990 to 2006 Canada’s managed forest was a Carbon Sink on average, but it was a Carbon Source in years with large burned area. Kurz, W.A. et al. 2008. PNAS 105:1551-1555.
Fire Emissions Project
Purpose: Improve access to fire emissions model inputs and results for targeted users Provide best estimates of total carbon emissions and some emission components for retrospective fire emissions mapping – Geospatially at 1km resolution – At daily to annual temporal resolution
Progress: Improved data & model for retrospective fire emissions estimation Development of a prototype web-based system (WFEIS) for US Regional-scale retrospective estimates of US fire emissions based on two burn area data sets
- Supported by a 3-year grant from NASA Carbon Cycle Science Program & Applied Sciences Program
- Additional funding under another NASA Applied Sciences - Actively seeking additional funding to continue development
4
WFEIS Project Team
Nancy French, Ben Koziol, Tyler Erickson, Mike Billmire, Jessica McCarty
Don McKenzie Roger Ottmar Ernesto Alvarado
Bill de Groot
Eric Kasischke
Research Associates & Interns: Liza Jenkins, Eric Keefauver, Arthur Endsley, Reid Sawtell, Susan Pritchard, Ron Kempker, Jef Cieslinski, Marlene Tyner, Christina Nolte, Peter Gamberg, Naomi Hamermesh
Pacific Northwest Research Station, USDA Forest Service
Department of Geography, University of Maryland
Great Lakes Forestry Centre, Canadian Forest Service

Fire Emissions Modeling
Non-spatial, plot-level (Consume 3.0, FOFEM 5.7) Semi- or Pseudo-spatial (Canadian FBP, CanFIRE) Global, coarse-scale (GFED) Active fire estimates of burn area (FINN) Many other efforts in place for emissions inventory/air quality applications (e.g. US-EPA)
WFEIS uses moderate resolution data of burn area and biomass to make regional-scale fire emissions estimates
-- CONSUME 3.0 (USFS)
-- FOFEM 5.7 (USFS)
-- CanFIRE -- Canadian FBP -- GFED (NASA) -- FINN (NOAA)
Other fire emissions models:
Combustion Factors - ß
Area Burned - A
Fuel Consumption
Emission Factors - EF
Emissions
Fuel Loading - B

WFEIS Estimation of Fire Emissions
Daily weather ĺ�)XHO�PRLVWXUH
Location and day of fire
Fuel (vegetation) type (FCCS)
Fuel load (biomass) and fire behavior
Consumption & Emissions model
(Consume)
Output: Spatial representation of emissions

Burn Area Datasets
Perimeters from Monitoring Trends in Burn Severity (MTBS) http://mtbs.gov
MODIS-derived Direct Broadcast Burn Area Product (MCD64A1) see Giglio et. al 2009 – 500 m spatial resolution – Burn cells tagged by
approximate burn date – North America-wide
for 2001 to present
7
8
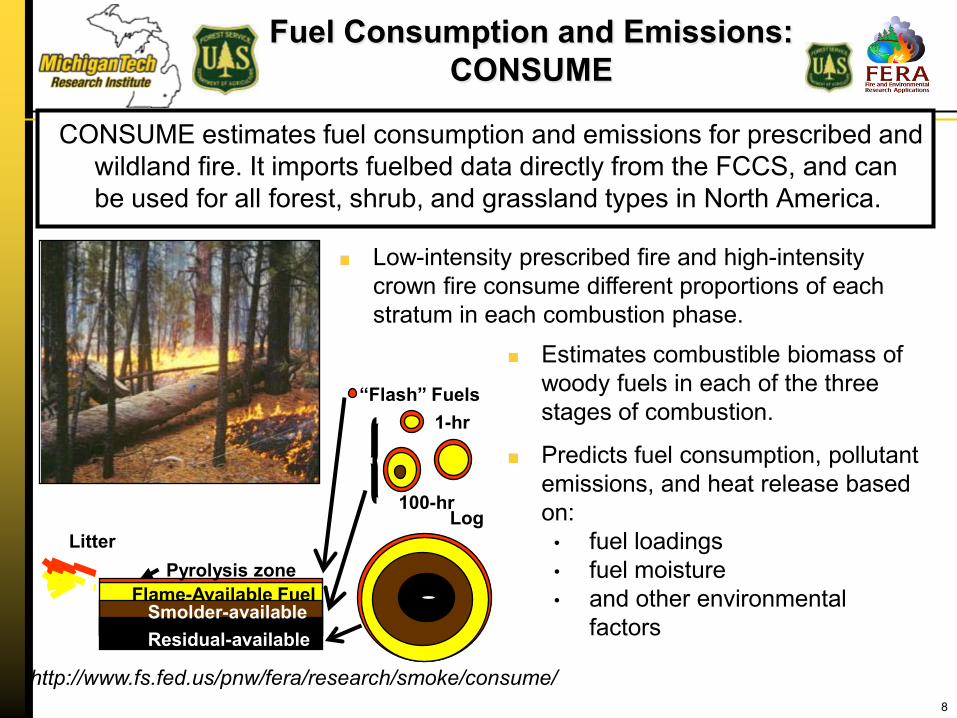
Fuel Consumption and Emissions: CONSUME
CONSUME estimates fuel consumption and emissions for prescribed and wildland fire. It imports fuelbed data directly from the FCCS, and can be used for all forest, shrub, and grassland types in North America.
Litter
“Flash” Fuels 1-hr
Log 100-hr
Pyrolysis zone Flame-Available Fuel
Smolder-available Residual-available
Estimates combustible biomass of woody fuels in each of the three stages of combustion.
Predicts fuel consumption, pollutant emissions, and heat release based on:
• fuel loadings • fuel moisture • and other environmental
factors
http://www.fs.fed.us/pnw/fera/research/smoke/consume/
Low-intensity prescribed fire and high-intensity crown fire consume different proportions of each stratum in each combustion phase.
9
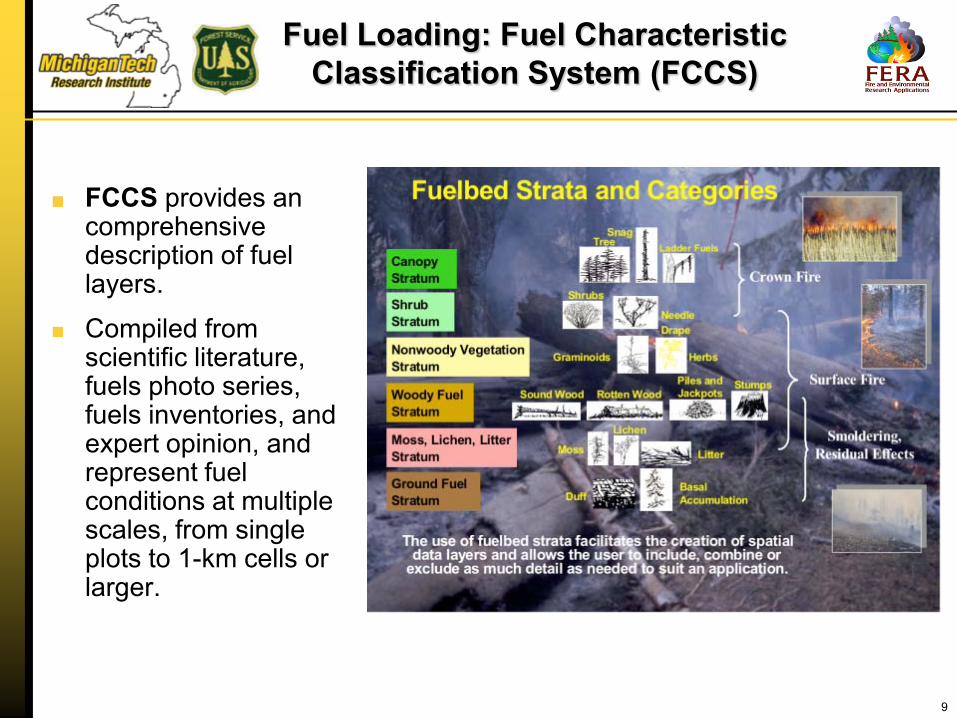
Fuel Loading: Fuel Characteristic Classification System (FCCS)
FCCS provides an comprehensive description of fuel layers.
Compiled from scientific literature, fuels photo series, fuels inventories, and expert opinion, and represent fuel conditions at multiple scales, from single plots to 1-km cells or larger.
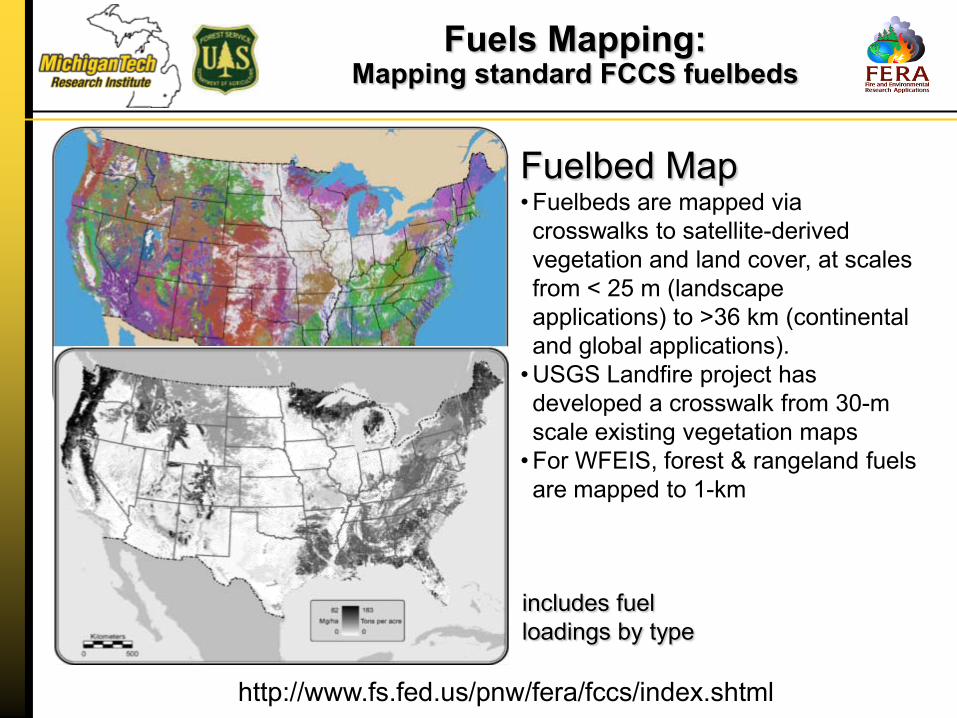
Fuelbed Map • Fuelbeds are mapped via crosswalks to satellite-derived vegetation and land cover, at scales from < 25 m (landscape applications) to >36 km (continental and global applications).
• USGS Landfire project has developed a crosswalk from 30-m scale existing vegetation maps
• For WFEIS, forest & rangeland fuels are mapped to 1-km
http://www.fs.fed.us/pnw/fera/fccs/index.shtml
includes fuel loadings by type
Fuels Mapping: Mapping standard FCCS fuelbeds

30-m resolution
1-km resolution
234 fuelbeds 5 lost in aggregation

Problem: – Original FCCS map does not include all land types with vegetation fuels; – Missing types primarily are areas that are urban, bare, or agricultural; – When fires occur in these area, CONSUME calculates their emissions as 0. – Fires do often occur in agricultural areas.
Solution: – The Cropland Data Layer (CDL) contains
detailed information about agricultural fuelbeds in many areas within the FCCS gaps.
– Using ERDAS Imagine Model Maker, we merge the CDL with the FCCS to create an integrated fuelbed map.
• Create new agricultural fuelbeds, reclassify CDL merge giving priority to FCCS in areas where the CDL is vague (e.g. Deciduous Forest) and giving priority to the CDL in all other locations.
Fuels Mapping: Filling in the Gaps with the Cropland Data Layer

FCCS (30m resolution)
Agricultural areas missing data
CDL (30m resolution) Merged FCCS/CDL Layer
(30m resolution)
Fuels Mapping: Filling in the Gaps with the Cropland Data Layer

Merged FCCS/CDL layer (30m resolution)
• 242 Total fuelbeds • 212 original FCCS fuelbeds • 15% of total CONUS area ‘filled in’ with croplands • New fuelbeds from CDL publically available; fuel loadings
vary by crop type
15
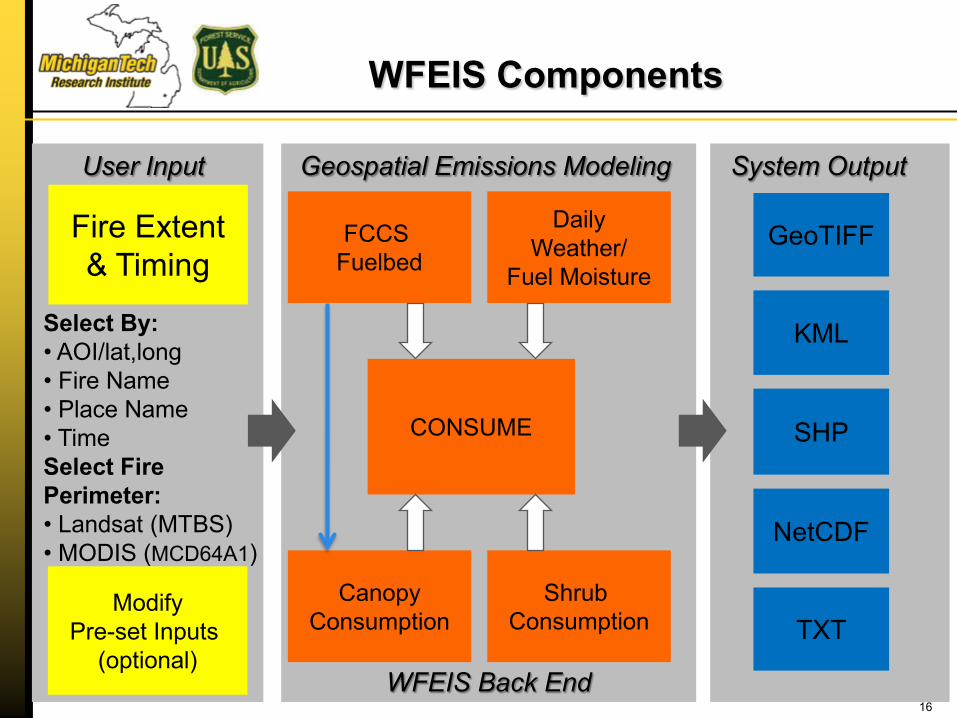
WFEIS Components
16
CONSUME
FCCS Fuelbed
Fire Extent & Timing
Daily Weather/
Fuel Moisture
KML
SHP
TXT Shrub
Consumption Canopy
Consumption
User Input System Output
NetCDF
Select By: • AOI/lat,long • Fire Name • Place Name • Time Select Fire Perimeter: • Landsat (MTBS) • MODIS (MCD64A1)
GeoTIFF
Modify Pre-set Inputs
(optional) WFEIS Back End
Geospatial Emissions Modeling

WFEIS Web-accessible Framework
The WFEIS website allows for two approaches for making fuel consumption and emissions estimates
Method #1: WFEIS Emissions Calculator: http://wfeis.mtri.org/ Method #2: WFEIS responds to queries submitted via properly encoded URL requests: it implements a RESTful Web API.

Django Web Framework
Spatial Database
Backend
RESTful Interface
User Interface
Python Scripts
HTTP Access
Web Browser Access
CONSUME
WFEIS Framework
URL-formatted QUERY
http://wfeis.mtri.org/api/emissions/fuelbed=fccs1km/burnedarea=mtbs/ecoregion=western/1000hr_FM=None/Duff_FM=None/CanopyPerConsume=None/PercentBlack=50/combustion_stage=total/stratum=total/output_units=tonnes/emistype=carbon/map.kml?DRNG=2002-07-01,2002-07-31&ROI=StateProvince,usa-OR

WFEIS Output
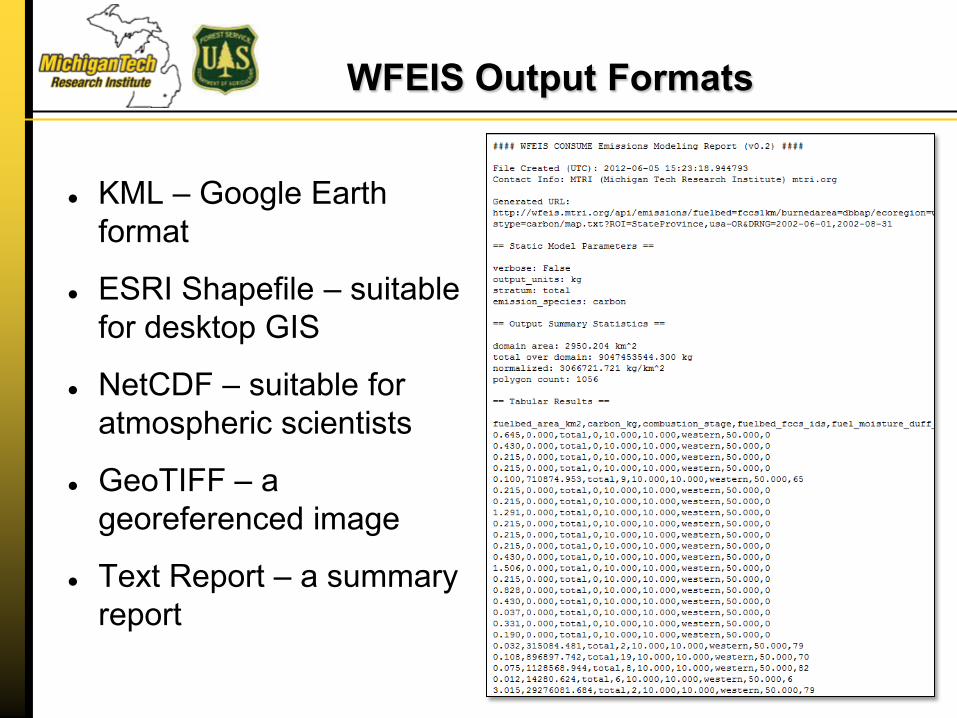
WFEIS Output Formats
z KML – Google Earth format
z ESRI Shapefile – suitable for desktop GIS
z NetCDF – suitable for atmospheric scientists
z GeoTIFF – a georeferenced image
z Text Report – a summary report

Aggregating Output
WFEIS can be used to consider annual fire emissions across the Contiguous US
• “batch” API queries allow for computing a variety of scenarios • This example shows results using the MODIS MCD64A1 burned
area product CONUS total area is approx 8,000,000 km2
Year Burned area (km2)
Total consumption (Tg)
Consumption normalized (kg/m2)
Total CO2 (Tg)
2001 5462 9.18 1.68 14.49 2002 12885 45.49 3.53 71.84 2003 11886 43.20 3.63 68.70 2004 5566 11.32 2.03 18.38 2005 13428 16.51 1.23 26.73 2006 23779 43.64 1.84 69.25 2007 25964 68.68 2.65 109.30 2008 7749 37.32 4.82 58.48 2009 14371 19.91 1.39 32.27

Aggregating Output
Consumption & emissions for ecoregions of the Contiguous US • example is for 2003
CONUS Ecoregion
Burned area (km2)
Total fuel consumption
(Tg)
Fuel consumption normalized
(kg/m2)
Total CO2 (Tg)
Northwestern Forested Mountains 3853 26.74 6.94 41.98
Mediterranean California 3085 8.29 2.69 13.58 Great Plains 1451 3.54 0.26-10.19 5.73
North American Deserts 976 0.44 0.43-0.45 0.71 Tropical Wet Forests 920 0.05 0.05 0.08
Temperate Sierras 696 1.50 2.15 2.40 Eastern Temperate
Forests 418 0.80 0.22-2.21 1.33
Southern Semi-Arid Highlands 367 0.54 1.46 0.88
Northern Forests 71 1.06 15.01 1.63 Marine West Coast
Forest 50 0.25 4.91 0.40
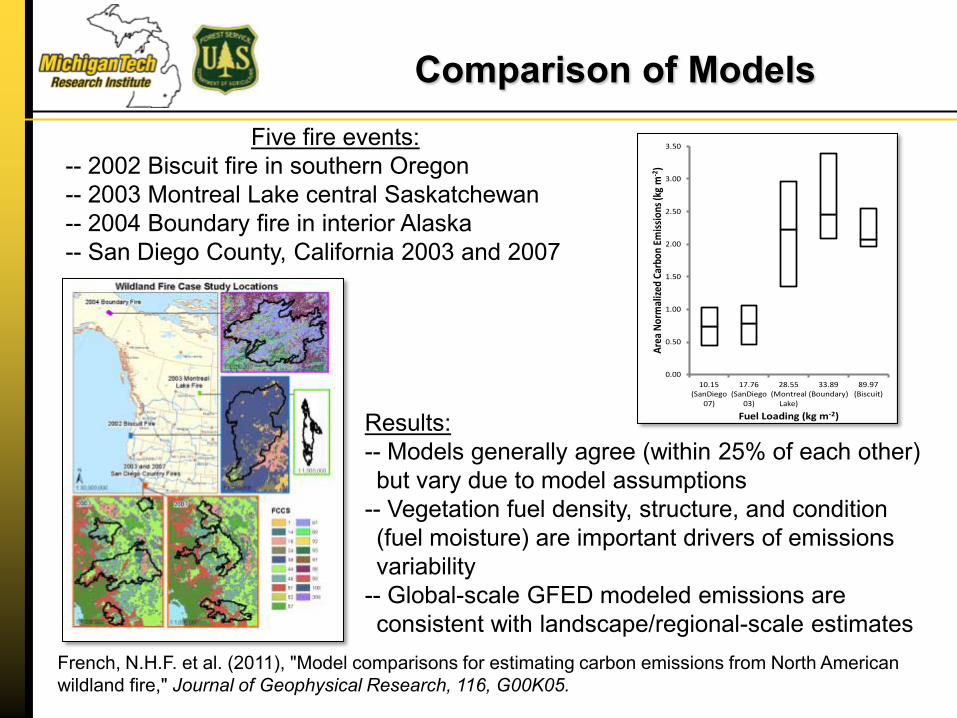
Comparison of Models Five fire events:
-- 2002 Biscuit fire in southern Oregon -- 2003 Montreal Lake central Saskatchewan -- 2004 Boundary fire in interior Alaska -- San Diego County, California 2003 and 2007
Results: -- Models generally agree (within 25% of each other) but vary due to model assumptions
-- Vegetation fuel density, structure, and condition (fuel moisture) are important drivers of emissions variability
-- Global-scale GFED modeled emissions are consistent with landscape/regional-scale estimates
0.00
0.50
1.00
1.50
2.00
2.50
3.00
3.50
10.15 (SanDiego
07)
17.76 (SanDiego
03)
28.55 (Montreal
Lake)
33.89 (Boundary)
89.97 (Biscuit)
Area
Nor
mal
ized
Carb
on E
miss
ions
(kg
m-2
)
Fuel Loading (kg m-2)
French, N.H.F. et al. (2011), "Model comparisons for estimating carbon emissions from North American wildland fire," Journal of Geophysical Research, 116, G00K05.

Effect of Burned Area on Carbon Emissions
For the Biscuit fire case, the WFEIS model was run with two burn area maps. The burn area and total carbon emitted is higher with the Landsat-derived map by about 16% Area normalized emissions were very similar, but vary due to use of daily weather information and the type of vegetation in the burn
Landsat: 200,400 ha 3.10 kgC/m2 6.20 TgC MODIS: 170,000 ha 3.07 kgC/m2 5.22 TgC

Data Access
http://wfeis.mtri.org
Fuels maps available from USFS FERA lab http://www.fs.fed.us/pnw/fera/fccs/index.shtml
Accessible soon from the NASA-DAAC at ORNL:
http://daac.ornl.gov/
Questions?