widespread distribution of the major polypeptide...
TRANSCRIPT
Widespread Distribution of the Major PolypeptideComponent of MAP 1 (Microtubule-associated Protein 1)in the Nervous System
320
GEORGE S. BLOOM, THOMAS A. SCHOENFELD,* and RICHARD B. VALLEECell Biology Group and *Neurobiology Group, Worcester Foundation for Experimental Biology,Shrewsbury, Massachusetts 01545
ABSTRACT We prepared a monoclonal antibody to microtubule-associated protein 1 (MAP1), one of the two major high molecular weight MAP found in microtubules isolated frombrain tissue . We found that MAP 1 can be resolved by SDS PAGE into three electrophoreticbands, which we have designated MAP ]A, MAP 113, and MAP 1 C in order of increasingelectrophoretic mobility . Our antibody recognized exclusively MAP 1A, the most abundantand largest MAP 1 polypeptide . To determine the distribution of MAP 1A in nervous systemtissues and cells, we examined tissue sections from rat brain and spinal cord, as well as primarycultures of newborn rat brain by immunofluorescence microscopy . Anti-MAP 1 A stained whitematter and gray matter regions, while a polyclonal anti-MAP 2 antibody previously preparedin this laboratory stained only gray matter . This confirmed our earlier biochemical results,which indicated that MAP 1 is more uniformly distributed in brain tissue than MAP 2 (Vallee,R . B ., 1982, / . Cell Biol ., 92 :435-442) . To determine the identity of cells and cellular processesimmunoreactive with anti-MAP 1A, we examined a variety of brain and spinal cord regions .Fibrous staining of white matter by anti-MAP 1A was generally observed . This was due in partto immunoreactivity of axons, as judged by examination of axonal fiber tracts in the cerebralcortex and of large myelinated axons in the spinal cord and in spinal nerve roots . Cells withthe morphology of oligodendrocytes were brightly labeled in white matter . Intense staining ofPurkinje cell dendrites in the cerebellar cortex and of the apical dendrites of pyramidal cellsin the cerebral cortex was observed . By double-labeling with antibodies to MAP 1A and MAP2, the presence of both MAP in identical dendrites and neuronal perikarya was found. Inprimary brain cell cultures anti-MAP 2 stained predominantly cells of neuronal morphology.In contrast, anti-MAP 1A stained nearly all cells . Included among these were neurons,oligodendrocytes and astrocytes as determined by double-labeling with anti-MAP 1A incombination with antibody to MAP 2, myelin basic protein or glial fibrillary acidic protein,respectively . These results indicate that in contrast to MAP 2, which is specifically enriched indendrites and perikarya of neurons, MAP lA is widely distributed in the nervous sytem .
Microtubules purified from a variety of sources have beenshown to consist of both tubulin, the principal structuralprotein, and a diverse group of microtubule-associated pro-teins, or MAP (5, 6, 27, 34, 45, 46) . The MAP have beenimplicated in the regulation ofmicrotubule assembly (26, 46),and. i n mediating the interaction of microtubules with otherstructural elements ofthe cytoplasm (1, 3, 12, 13, 15, 22, 32,33, 35) .
In brain, the most prominent MAP are high molecularweight proteins . These proteins have been divided into twoclasses, MAP 1 and MAP 2, on the basis oftheir electropho-retic mobility (34) . MAP 2 (M, 270,000) remains solublewhen microtubules are exposed to elevated temperature, aproperty that allows this protein to be readily separated fromMAP 1 (14, 17) . MAP 2 purified in this way is seen as a finefilamentous arm on the surface ofmicrotubules and promotes
THE JOURNAL OF CELL BIOLOGY - VOLUME 98 JANUARY 1984 320-330
® The Rockefeller University Press - 0021-9525/84/01/0320/11 $1 .00
on August 3, 2006
ww
w.jcb.org
Dow
nloaded from

microtubule assembly in vitro . MAP 2 purified under lesssevere conditions contains low molecular weight subunits ofMr 70,000, 54,000, and 39,000 (42) . The latter two of theseproteins represent the regulatory and catalytic subunits of atype II cAMP dependent protein kinase, which is associatedwith the MAP 2 arm (36, 42) and which extensively phospho-rylates MAP 2 itself (34, 37, 39) . MAP 2 is unusually sensitiveto digestion by chymotrypsin and trypsin, which results in therapid release of the arm portion of the protein from themicrotubule (39, 41) . The protein binds to actin in vitro (13,32) and to intermediate filaments in cultured cells (3) .
Like MAP 2, MAP 1 (M, -350,000) appears as a filamen-tous arm of similar dimension on the microtubule surface(43), and promotes microtubule assembly (20, 43). MAP 1 isas sensitive to proteases as MAP 2 (41) and much of the massof MAP 1, as well as MAP 2, is rapidly released from themicrotubules during protease treatment . MAP 1 is as stableas MAP 2 to some denaturants (43), but is insoluble atelevated temperatures (14, 17). Like MAP 2, MAP 1 containslow molecular weight subunits, but these are distinct in mo-lecular weight (Mr 28,000 and 30,000) and stoichiometryfromthose associated with MAP 2 (43) . MAP 1 is only slightlyphosphorylated in vitro compared with MAP 2 (34, 39) . Inaddition to these distinctions, antibodies, to MAP 2, thesmaller of the two proteins, have not been observed to reactwith MAP 1 (3, 16, 29) .
Thus, it appears that while MAP 1 and MAP 2 are twomembers of a class of structural proteins associated withmicrotubules, they have several distinctive features . Presum-ably, these features indicate that the proteins are functionallydistinct as well . In support ofthis contention we have recentlyobtained biochemical evidence that MAP 1 and MAP 2 aredifferentially distributed in microtubules isolated from calfcerebral cortex and corpus callosum (40) . These two brainregions contain distinct cellular and subcellular elements.Neuronal cell bodies, dendrites and axons, as well as glialcells, are present in cerebral cortex gray matter, while onlyaxons and glial cells are present in white matter . MAP 2 ismost abundant in microtubules isolated from calf cerebralcortex, but is greatly diminished in microtubules isolated fromcalf corpus callosum . MAP 1, in contrast to MAP 2, is presentin identical amounts in microtubules from the two brainregions . Consistent with the nonuniform distribution ofMAP2 is the observation that antibody prepared against MAP 2intensely stains neuronal cell bodies and dendrites in rat braingray matter, but fails to stain glial cells and axonal processesappreciably in white matter tracts (8, 24; see Figs . 3 and 8 inthis paper) . These observations indicate that MAP 2 has arelatively restricted cellular and subcellular distribution, con-sistent with observations on cultured cells (3, 16, 29), radioim-mune assays oftissue extracts (38), and an immunocytochem-ical study using an antibody to unfractionated high molecularweight brain MAP (23) . In the latter study immunoreactivitywas not detected in white matter tracts, suggesting that neitherMAP 1 nor 2 is present in axonal processes or nonneuronalcells of central nervous system tissue . This contrasts our ownbiochemical work described above (40), which indicates thatMAP 1 is abundant in white matter .
In the present study, we sought to define the cellular andsubcellular distribution of MAP 1 and to compare the distri-bution of this protein with MAP 2 . To this end we haveprepared a monoclonal antibody to MAP 1 . We found thatMAP 1 is a complex of electrophoretic bands that can be
divided into three biochemically distinguishable species . Ourantibody recognizes the most abundant of these species, towhich we now refer as MAP 1A. Consistent with our earlierbiochemical results (40), we find that the immunoreactiveMAP 1 species is widespread in brain and spinal cord com-pared to MAP 2. In the accompanying paper (4) we survey abroad variety of cells derived from diverse tissues and showthat MAP IA is commonly found outside of the nervoussystem as well .
MATERIALS AND METHODS
Monoclonal Antibody Production :
A BALB/c mouse was in-jected subcutaneously with MAP 1 on two occasions spaced 6 wk apart. Theimmunogen was isolated from microtubules prepared from calf brain cerebralcortex by three temperature-dependent assembly cycles (42). The microtubuleproteins were separated by SDS PAGE on a 9% polyacrylamide slab gel, whichwas stained with Coomassie Brilliant Blue R250 . A strip of the gel containingthe three MAP I bands (see Results) was excised, homogenized in 20 mMsodium phosphate, pH 7.4/150 mM NaCl, and emulsified by sonication withan equal volume of Freund's complete adjuvant. 10 d after the second injection,the mouse was given a final intraperitoneal boost of native MAP 1 preparedfrom calf brain white matter (43).
4 d after the final injection, immune splenic lymphocytes were collected andfused (18) with P3-NSI/1-Ag4-l (NS1) mouse myeloma cells in a solutioncontaining RPMI 1640 (Gibco Laboratories, Grand Island Biological Co.,Grand Island, NY), 37% polyethylene glycol 1000 (Koch-Life Laboratories,Ltd . ; Colnbrook, Buckinghamshire, England) and 5% DMSO (Sigma ChemicalCo., St. Louis, MO). Cells were plated in 24-well tissue culture dishes (Falcon;Becton Dickinson Labware, Oxnard, CA), where theywere maintained in HATselective medium for 24 h to 2 wk postfusion. Cells were cloned by limitingdilution in 96-well dishes (Falcon) in a medium containing RPMI 1640, 20%fetal calfserum (Hy-Clone ; Sterile Systems, Logan, UT) and pen/strip (GibcoLaboratories). Stable clones were maintained in medium containing 10% fetalcalf serum .
Hybridomas, both uncloned and cloned, were screened for antibody pro-duction by immunofluorescence microscopy of primary brain cell cultures (seebelow) using conditioned hybridoma medium . Immunoreactive proteins weresubsequently identified by immunoblot analysis (see below), also using condi-tioned medium . Antibody isotypes were determined by double immunodiffu-sion (28) with rabbit antibodies specific for mouse antibody isotypes (BioneticsLaboratory Products, Kensington, MD).immunocytochemistry and Immunochemistry : Brain and
spinal cord tissues were obtained from young adult (3-4-mo old) female rats .The animals were anesthetized with Nembutal and perfused transcardially with2% paraformaldehyde, 1 .5% picric acid in 0 .15 M phosphate buffer at pH 7 .3before dissection of the tissue . Fixation was continued overnight in the samesolution at room temperature. Vibratome sections (20 Am) were collected inPBS and processed in suspension for single or double immunofluorescencemicroscopy as we have described for cultured brain cells (3), with the followingexceptions: the 10% normal serum(sheep or goat) stepwasperformed overnightat 4°C in the presence of 0.25% Triton X-100 ; all subsequent solutionscontained 0.025% Triton X-100 ; antibody incubations were at 4°C for 24-48hr . Stained sections were mounted on gelatin-coated glass slides, coated with athin film of elvanol mounting medium (10) and overlaid with glass coverslips .Primary cultures of newborn rat brain were prepared and processed for singleor double immunofluorescence microscopy after methanol fixation as we havedescribed (3) .
Antibodies used for these studies were as follows: First antibodies: anti-MAP2, IA, monoclonal mouse IgGl, described above ; anti-MAP 2, polyclonalrabbit antibody (3, 8, 24, 36) ; anti-glial fibrillary acidic protein, rabbit polyclonalantibody supplied by Dr. R . Liem (New York University School of Medicine) ;antimyelin basic protein, polyclonal rabbit antibody, supplied by Sheryl L .Preston and Dr. Arthur McMorris (Wistar Institute) . Second antibodies: Fluo-rescein conjugated IgG fraction of goat anti-rabbit IgG was from CappelLaboratories (Cochranville, PA) . Rhodamine conjugated IgG fraction of sheepanti-mouse IgG was prepared in our laboratory by the procedure of Forni (9)from sheep antiserum to mouse IgG (Cappel Laboratories).
Nitrocellulose replicas of SDS gels were prepared and stained with eitherconditioned hybridoma medium or ascites fluid antibody using conditionsdesigned to obtain efficient transfer of high molecular weight polypeptides (3) .The second antibody was peroxidase-conjugated IgG fraction of sheep anti-mouse IgG (Cappel Laboratories), which was reacted with 4-chloro-I-naphthol(Sigma Chemical Co.) to reveal the immunoreactive proteins .
BLOOM ET AL .
Distribution ofMAP 1A in the Nervous System
32
on August 3, 2006
ww
w.jcb.org
Dow
nloaded from
RESULTSElectrophoretic and Immunochemical Analysis ofMAP 1An immunoblot ofunfractionated rat brain proteins stained
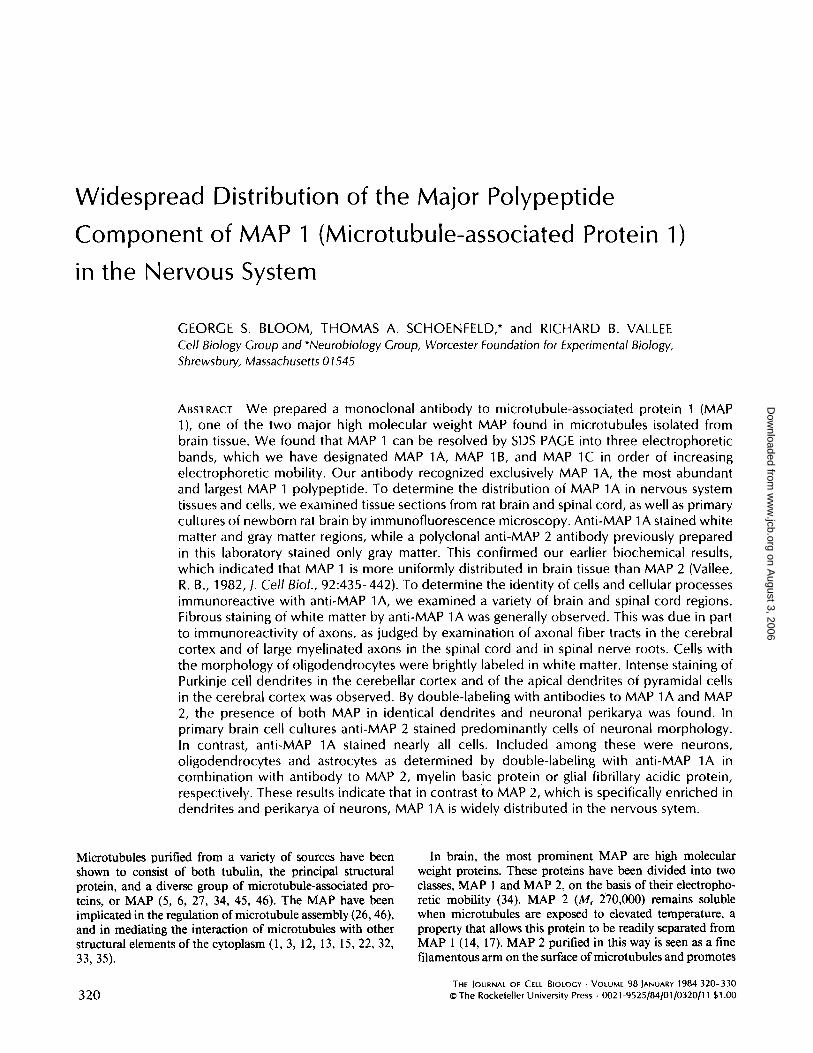
with the monoclonal IgGI antibody used throughout thispaper is shown in Fig. 1 A . Note the specific staining of aprotein at the position of MAP 1 . MAP 1 was originallydefined as a single electrophoretic component on high percentpolyacrylamide gels (34), but multiple bands have been seenin the MAP 1 region on low percent gels (11). Fig . 1 B showshigh molecular weight brain MAP obtained from calf whitematter (40) . MAP 1 is more prominent than MAP 2 in thesepreparations, and we find that the electrophoretic composi-tion of the MAP 1 region can be more readily analyzed thanin microtubules purified from whole brain or cerebral cortex .Five polypeptides were readily distinguished in the MAP 1 /MAP 2 region of the gel (Fig. 1 B) . The two most rapidlymigrating polypeptides were soluble at elevated temperatures,and reacted with both polyclonal and monoclonal anti-MAP2 antibodies prepared in our laboratory (44) . These twopolypeptides are therefore considered to be components ofMAP 2 (14, 17), and we refer to them as MAP 2A and MAP2B . We refer to the three remaining peptides ofhigher molec-ular weight as MAP 1A, MAP 1 B, and MAP 1 C in order ofincreasing electrophoretic mobility. MAP IA was the mostprominent of the three polypeptides in both gray matter (notshown) and white matter microtubules. The band was broadand was occasionally observed to split into two distinct bands,
FIGURE 1 Electrophoretic and immunochemical properties ofMAP 1 . (A) A newborn rat brain was dissolved in sample buffer andan aliquot was subjected to SDS PAGE on a 7% polyacrylamide gel .Left, Coomassie Brilliant Blue R250; right, nitrocellulose replicastained with anti-MAP 1A (B) 4% gel of microtubules purified bythe taxol procedure (40) from calf corpus callosum . Left, CoomassieBlue ; right nitrocellulose replica stained with anti-MAP 1A. Thepositions of MAP IA, 1B, 1C, 2A, and 2B are indicated . Note thespecificity of the antibody for MAP IA . (C) 4% gel of microtubulesfrom calf corpus callosum (see B) treated for 10 min with 0.33 Irglml chymotrypsin . (Lanes in B and C were adjacent in original geland nitrocellulose replica .) Among the high molecular weight MAP,MAP 1C alone was resistant to proteolysis, indicating that this is aprotein species distinct from MAP 1A and MAP 1 B . Left, CoomassieBlue ; right, nitrocellulose replica stained with anti-MAP 1A .
32 2
THE JOURNAL OF CELL BIOLOGY " VOLUME 98, 1984
which suggests that even this species may be heterogeneous .MAP 1B was the second most prominent band and it split onoccasion . MAP 1B was more prominent in microtubulespurified from white matter than from gray matter (notshown). The MAP 1C band was the least prominent of thethree bands. This protein could be readily distinguished fromMAP 1A, MAP 1B, and the MAP 2 bands by exposure of themicrotubules to low levels of chymotrypsin . Under theseconditions (Fig. 1 C), all bands except MAP 1C were readilydestroyed (39, 41).
Immunoblot analysis was performed on brain MAP todetermine the specificity of the monoclonal anti-MAP 1antibody prepared for this study. It may be seen (Fig . 1 B andC) that the antibody recognized only MAP IA, the majorMAP 1 polypeptide. To indicate the specificity of the anti-body, we refer to it in this and the following paper (4) as anti-MAP IA. To determine whether the antibody recognizedankyrin, a major erythrocyte cytoskeletal protein reported tobe immunologically related to MAP 1 (2), we used anti-MAPIA to stain immunoblots of sheep erythrocyte ghosts and raterythrocytes (not shown). The antibody did not react with theankyrin present in either sample .
Localization of MAP 1A in Axonsand Oligodendrocytes
In a previous biochemical study we found that MAP 1 andMAP 2 were present at different relative concentrations inmicrotubules purified from calf brain gray and white matter(40) . MAP 2 was considerably more abundant in gray matterthan in white. When sections of brain tissue were examinedby immunofluorescence microscopy, MAP 2 was observed tobe highly concentrated in the dendritic processes of neurons,and was undetectable in axonal tracts and glial cells (8, 24),consistent with the biochemical result. On the other hand, theratio of MAP 1 to tubulin was identical in microtubulesisolated from gray and white matter (40), suggesting a morenearly uniform distribution for this protein than for MAP 2 .To evaluate the distribution ofMAP 1 in tissues ofthe nervoussystem, we stained sections oftissue from rat brain and spinalcord with our anti-MAP 1 A monoclonal antibody .
Fig . 2 a shows a low magnification view of rat corpuscallosum white matter and surrounding gray matter of thecerebral cortex stained with anti-MAP IA . Immunoreactivitywas almost uniformly distributed across the field . This resultis consistent with our biochemical evidence that MAP 1 isfound at equal concentrations in microtubules isolated fromcerebral gray and white matter (40), and suggests that signifi-cant levels of MAP 1A may be found in axons or glial cells,as well as in dendrites . No staining was observed when un-conditioned medium was used (Fig. 2b) in place of condi-tioned hybridoma medium containing monoclonal anti-MAPIA . We found that major cerebral white matter tracts otherthan corpus callosum generally stained brightly with anti-MAP 1 A, but extremely weakly with anti-MAP 2 . An exampleof these staining patterns in the anterior commissure is illus-trated in Fig. 3 . Here, anti-MAP-IA reactivity (Fig . 3a) wassubstantial, and was similar to that observed in the adjacentgray matter (bed nucleus of stria terminalis) . Anti-MAP 2(Fig. 3 b), in sharp contrast, hardly stained the anterior com-missure, although apparent dendrites in the adjacent graymatter were brightly stained .The immunoreactivity of white matter with anti-MAP 1 A
on August 3, 2006
ww
w.jcb.org
Dow
nloaded from

FIGURE 2
Localization of MAP 1A in rat cerebral white matter. (a) Sagittal section of corpus callosum white matter (cc) andadjacent gray matter of the cortex stained with anti-MAP 1A (conditioned hybridoma culture medium) . A portion of thehippocampus (H) is visible in the lower right corner . (b) Control section processed for immunofluorescence microscopy andphotographed identically to the section in a, except that unconditioned medium was used in place of conditioned hybridomamedium containing anti-MAP 1A . Bar, 50 Am . x 200 .
FIGURE 3
Comparison of MAP 1A and MAP 2 distributions in rat brain . A sagittal section of rat cerebrum was double-labeledwith monoclonal anti-MAP 1A (a) and rabbit anti-MAP 2 (b) followed by rhodamine sheep anti-mouse IgG plus fluorescein goatanti-rabbit IgG . Visible in the section are a caudal portion of the anterior commissure (AC in b) plus adjacent gray matter (G in b ;this region corresponds to the bed nucleus of the stria terminalis) . Bar, 50 Am . x 240.
indicated that MAP 1A might be localized there in axons,glial cells, or both . Fine processes were generally labeled bythe antibody in white matter regions, which could have re-flected the presence of MAP lA in either axonal processes orglial cell processes . The immunoreactivity of axons in partic-ular was evident in certain regions. Fig . 4 shows a sagittalsection ofrat cerebrum stained with anti-MAP IA . Numerouslongitudinally cut bundles of axons in the immediate vicinityof the anterior commissure were observed to be intensely
stained by the antibody. These fiber tracts ran from a ventral-caudal to a dorsal-rostral position and probably correspondto the striohypothalamic tract (19). In this region, the axonalstaining was as prominent as the staining of dendrites andneuronal cell bodies in the surrounding tissue . Fig. 5 showslarge myelinated axons in the dorsal root of a spinal nerve .Staining was observed in the axoplasm ofthese processes, andwas absent in the myelin sheaths . The outer rim of somemyelin sheaths was lightly stained and this may have repre-
BLOOM ET AL .
Distribution ofMAP 1A in the Nervous System
323
on August 3, 2006
ww
w.jcb.org
Dow
nloaded from

FIGURE 4
Localization of MAP 1A in axons . A sagittal section ofthe cerebrum was stained with anti-MAP 1A . The region shown isimmediately rostral to the anterior commissure, which lies to theright of the field . The broad fiber bundles indicated by the stars arelongitudinally cut axons, corresponding to the striohypothalamictract, which is coursing through the nucleus accumbens . Bar, 20Am . x 400 .
sented thin regions of Schwann cell cytoplasm surroundingthe sheath . Similar staining by anti-MAP IA was observed inventral roots of spinal nerves (not shown) . Thus, in theperipheral nervous system MAP lA was judged to be presentin axons of identifiable sensory (dorsal root) and motor (ven-tral root) neurons .
In the spinal cord staining ofmyelinated processes was alsoobserved (Figs. 5 and 6) . In addition to axonal staining, anti-MAP 1 A stained a class ofcells that were scattered throughoutwhite matter. At high magnification (Fig. 6, c and d) it couldbe seen that both broad and fine processes belonging to thesecells were stained . These processes appeared to contact theouter layer of unstained myelin sheaths, and did not seem tocontact axons directly . These histological properties are con-sistent with the identification of these cells as oligodendro-cytes . Thus, it seemed that MAP 1 A is present in both axonsand oligodendrocytes, and may be especially concentrated inthe latter .
Similarities in Anti-MAP 1A and Anti-MAP2 ImmunoreactivityWhile MAP lA was always detectable in white matter, the
intensity of staining varied in different regions, as did theintensity relative to gray matter. In the cerebellum, for ex-ample (Fig. 7A), white matter staining was relatively weakcompared to that observed in Purkinje cells . Thus, the overallstaining pattern with anti-MAP 1A gave an impression similarto that observed with anti-MAP 2 (8), though distinct labelingof fibers in white matter was definitely detectable with anti-bodies to MAP 1 A, but not to MAP 2. The somata anddendrites of the Purkinje cells were among the most promi-nently stained structures in the central nervous system (Fig .7, A and B) . Staining of Purkinje cell axons was also seen(Fig. 7B) . In favorable sections weaker staining could beobserved in granule cell and Golgi neurons in the granule
324
THE JOURNAL OF CELL BIOLOGY " VOLUME 98, 1984
layer, and in basket cells in the molecular layer . Fine immu-noreactive fibers (Fig. 7A) in the molecular layer may repre-sent both dendrites and axons emanating from basket cell,Golgi, and granule cell neurons. Some of these processes wereobserved to cross the Purkinje cell body layer from the granulelayer to the molecular layer . The fine caliber ofthese processesindicates they may be climbing fiber or parallel fiber axons .
Since both MAP lA (Fig. 7) and MAP 2 (8, 24) wereprominent in dendrites and neuronal cell bodies, this raisedthe question of whether the two proteins coexist in the sameneuron . To resolve this point we double-labeled sections ofbrain and spinal cord with anti-MAP 1 A and anti-MAP 2 .Prominent, coincident labeling of large processes and neu-ronal perikarya in gray matter by both antibodies was gener-ally observed. Fig. 8 shows examples of this from the spinal
FIGURE 5
Axonal localization of MAP 1A in spinal nerve . A cross-section of the dorsal root of a spinal nerve in the cervical region isshown . (a) Anti-MAP 1A stained axoplasm (solid arrow), but not thesurrounding myelin sheaths. Thin halos of immunoreactivity (openarrow) were occasionally observed surrounding the sheaths, andthese may represent Schwann cell cytoplasm . The brightly stainedarea below the spinal nerve is spinal cord white matter, where bothaxons and oligodendrocytes are immunoreactive with anti-MAP lA(see Fig . 6) . (b) Phase-contrast image of the same field . Axons (solid,long-stemmed arrow) are visible as phase-lucent cores surroundedby phase-dense myelin sheaths . Phase-contrast image was printeddarkly to optimize contrast between myelin sheaths and axonalcytoplasm . Bar, 20 ,m . x 650 .
on August 3, 2006
ww
w.jcb.org
Dow
nloaded from
FIGURE 6
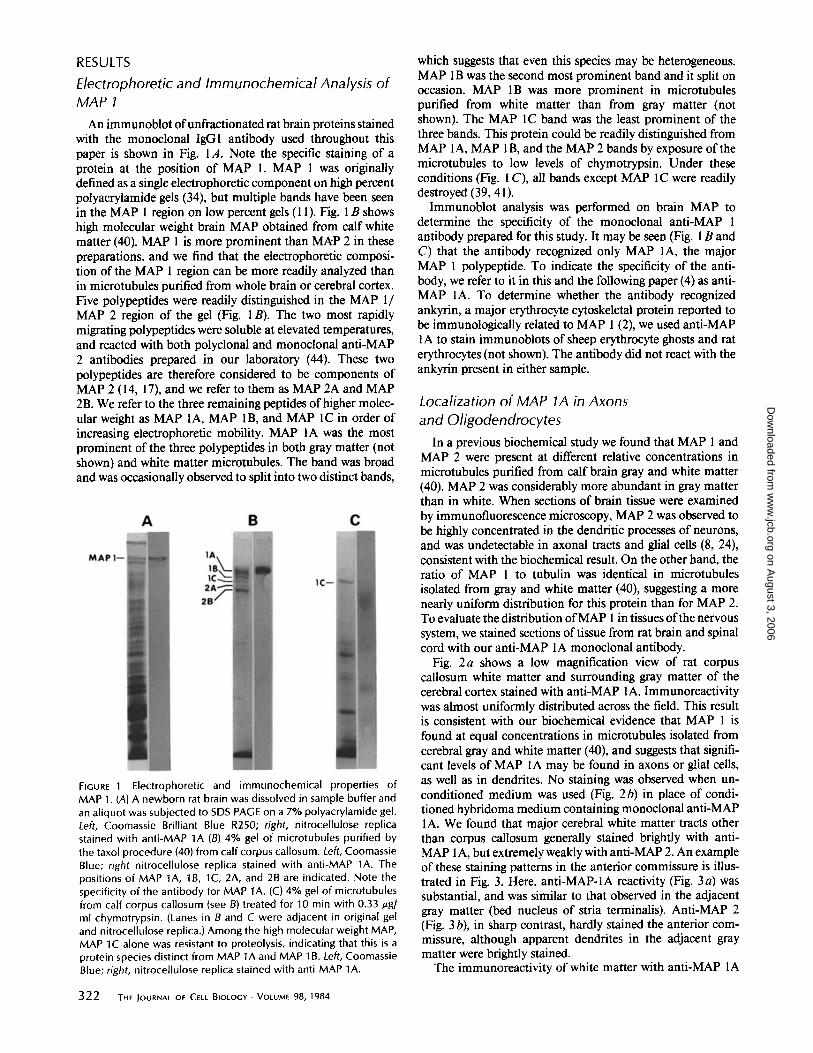
Localization of MAP 1A in spinal cord white matter . Cross-sections were cut at the cervical region of the spinal cord .(a) Low magnification view labeled with anti-MAP 1A, illustrating punctate staining of moderate intensity throughout the field,and occasional brightly stained cells . (b) Low magnification view of a control section processed for immunofluorescencemicroscopy and photographed identically to the section shown in a, except that unconditioned hybridoma medium was used inplace of anti-MAP 1A. (c) High magnification view, illustrating cell bodies (solid arrow) and processes (open arrow) of brightlylabeled cells identified as oligodendrocytes. Less intense patches of fluorescence throughout the field represent primarily axonscut in approximate cross-sections. (d) High magnification view, in which the cytoplasm of an oligodendrocyte (open arrow) isobserved to encircle a myelinated axon . The lightly stained axoplasm (solid arrow) is separated from the oligodendrocytecytoplasm by the unstained myelin sheath . Bars : (b, for a and b) 50 jm and (d, for c and d) 10 um . (a and b) x 230. (c and d) x1,150 .
FIGURE 7 Localization of MAP1A in cerebellum . Sagittal sec-tions are shown at low and highmagnification . (A) Low magnifica-tion view illustrating the histolog-ical layers of the cerebellum : m,molecular layer ; g, granule celllayer ; wm, white matter; open ar-row, Purkinje cell body ; closedarrow, Purkinje cell dendrite . Bar,20 um . (8) High magnificationview of Purkinje cells. Both den-drites (solid arrow) and axons(open arrows) of Purkinje cellscontain MAP 1A . (C) High mag-nification view of white matter .Cellular processes, presumablyconsisting mostly of axons, weremoderately stained throughoutthis region . Bar, 10 um . Magnifi-cation for B and C was the same .(A) x 250 . (B and C) x 750 .
BLOOM ET AL .
Distribution of MAP 1A in the Nervous System
325
on August 3, 2006
ww
w.jcb.org
Dow
nloaded from

FIGURE 8
Coexistence of MAP 1A and MAP 2 in neurons . Tissue sections were double-labeled with monoclonal anti-MAP 1Aand rabbit anti-MAP 2 . Second antibodies were rhodamine sheep anti-mouse IgG and fluorescein goat anti-rabbit IgG . (a) Sagittalsection of cerebral cortex showing distribution of MAP 1A . Apical dendrites (solid arrow) and perikarya (open arrow) of pyramidalneurons were prominently labeled . (b) Distribution of MAP 2 in the same section . (c) Cross-section of spinal cord gray matter (inmid-cervical region) showing presence of MAP 1A in perikarya of large (solid arrow) and small (open arrow) motor neurons, aswell as in numerous processes cut in cross and longitudinal sections . (d) Distribution of MAP 2 in the same section . Bar, 10 um .x 700 .
cord, where motor neurons and numerous processes werestained by anti-MAP IA and anti-MAP 2, and from thecerebral cortex, where perikarya and apical dendrites of py-ramidal neurons were heavily labeled by both antibodies .Other readily identifiable dendritic processes, such as those inthe cerebellar cortex, were also stained by both antibodies(not shown) . Thus, while MAP lA alone was detectable inaxons and glial cells, both MAP IA and MAP 2 appeared tobe abundant in dendrites and neuronal cell bodies .
Immunofluorescent Detection of MAP 1A inCultured Brain CellsTo obtain further information on the identity of cells
containing MAP IA, we examined primary cultures of new-born rat brain . Fig . 9 shows cells double-stained with anti-MAP 1 A (Fig . 9 a) and anti-MAP 2 (Fig . 9 b) . The latterantibody stained only a limited number of cells in these
326
THE JOURNAL OF CELL BIOLOGY - VOLUME 98, 1984
cultures, as reported previously (3, 16, 29) . Most ofthese cellswere of neuronal morphology and contained receptors fortetanus toxin (3), consistent with the neuronal localization ofMAP 2 found in brain and spinal cord (8, 24) . In contrast toMAP 2, anti-MAP lA stained most cells in the culture, albeitwith varying intensity . The MAP 2-positive cells of neuronalmorphology were consistently stained by anti-MAP IA, al-though with only moderate intensity. An additional class ofcells, which were MAP 2-negative and were characterized bysmall cell bodies and long processes, also stained with anti-MAP IA . These cells appeared to contain the highest concen-trations of MAP IA found in the cultures.To determine the identity of these cells, we stained the
cultures with antibodies specific for glial cells . Fig. 10 showsthe result of double immunofluorescence microscopy per-formed with anti-MAP IA and antimyelin basic protein, amarker for oligodendrocytes (25) . Anti-MBP (Fig. 10b) in-tensely stained a fraction of the cells in the culture . These
on August 3, 2006
ww
w.jcb.org
Dow
nloaded from

FIGURE 9
Distinct cellular expression of MAP 1A and MAP 2 inprimary cultures of newborn rat brain . A coverslip was labeled withmonoclonal anti-MAP 1 A (a) and rabbit anti-MAP 2 (b, followed byrhodamine sheep anti-mouse IgG and fluorescein goat anti-rabbitIgG . (c) Phase-contrast image of the same field . Bar, 10 jcm . x 650 .
cells were the same as those most intensely stained with anti-MAP 1 A (Fig. 10 a) . Since the morphology of these cells ischaracteristic not only of neurons but of oligodendrocytes aswell (25), we conclude that MAP lA is abundant in oligoden-
drocytes, consistent with our observations of sections of cen-tral nervous system tissue (Fig. 6) .
Fig . 11 shows cells double-stained with antibody to glialfibrillary acidic protein, a specific marker for astrocytes, andanti-MAP IA . Most ofthe cells in the culture with flat, well-spread morphology stained with anti-GFAP and were judgedon this basis to be astrocytes . Those cells also stained positivelywith anti-MAP IA, but the intensity of fluorescence wasconsiderably lower than for oligodendrocytes (for a directcomparison see Figs . 9 a and 10a) . Dividing astrocytes werealso observed occasionally, and the mitotic spindles in thosecells were brightly stained with anti-MAP IA . Staining ofthespindle was generally observed in dividing cells in these andother cultures, as will be discussed in the accompanying paper(4).
DISCUSSIONPrevious work from this laboratory revealed that MAP 1 wasas abundant in microtubules purified from bovine whitematter as in microtubules purified from cerebral cortex (40) .This led us to predict that, in contrast to MAP 2, MAP 1
FIGURE 10
Localization of MAP 1A in cultured oligodendrocytes.A coverslip containing primary new born rat brain cells was doublelabeled with monoclonal anti-MAP 1A (a) and rabbit anti-myelinbasic protein (b) followed by rhodamine sheep anti-mouse IgG andfluorescein goat anti-rabbit IgG . Anti-MAP 1A stained two cells inthis field very brightly, and produced light staining of numerousother cells. The brightly staining cells also reacted with antimyelinbasic protein, identifying them as oligodendrocytes . Bar, 10 wm . x650 .
BLOOM ET AL .
Distribution ofMAP 1A in the Nervous System
327
on August 3, 2006
ww
w.jcb.org
Dow
nloaded from

FIGURE 11
Localization of MAP 1A in cultured astrocytes . A cov-erslip containing primary new born rat brain cells was doublelabeled with monoclonal anti-MAP 1A (a and c) and rabbit anti-glialfibrillary acidic protein (b and d), a marker for astrocytes . Secondantibodies were rhodamine sheep anti-mouse IgG and fluoresceingoat anti-rabbit IgG. The large cell shown in a and b is in interphase,while the cell in c and d is undergoing mitosis . Bar, 10 ym . x 650.
would be found in axons, glial cells, or both . In the presentstudy, we examined the distribution of the major polypeptidecomponent ofMAP 1 by immunofluorescence microscopy oftissue sections and primary cultures of brain cells using amonoclonal antibody . We have found that MAP 1 consistsof at least three electrophoretic species, the principal one ofwhich, designated MAP IA, is recognized exclusively by ourantibody. We found that MAP IA, like MAP 2, is prominentin neurons . In contrast to MAP 2, MAP 1A was easily detectedin rat brain white matter, while both proteins were abundantingray matter, confirming theearlier biochemical results fromour laboratory . We have shown that MAP IA is present inidentifiable axons as well as in identifiable dendrites . Inaddition, we have found that MAP IA, unlike MAP 2, isprominent in oligodendrocytes and is detectable in astrocytes,as well. Thus, our work stands in contradiction to that ofMatus et al. (23), who concluded on the basis of studies usingan antibody preparation directed against unfractionated highmolecular weight MAP, that these MAP were absent fromaxons and glial cells .
Heterogeneity of Map 1While MAP 1 has been treated as a single biochemical
entity, we noted several electrophoretic bands in the MAP Iregion of SDS gels. These bands were more striking in micro-tubules prepared from white matter than from gray matter(Bloom and Vafee, unpublished observations) . We do notknow whether this represents a real concentration difference
328
THE JOURNAL OF CELL BIOLOGY " VOLUME 98, 1984
in MAP 1B and MAP 1C in white matter vs . gray matter, aresult that is potentially of considerable interest, or whetherMAP 1B and MAP 1C are obscured by the heavy MAP 2bands in gray matter preparations . Both MAP IA and MAP1 B ran as relatively broad electrophoretic bands . This wasobserved both on 4% polyacrylamide gels prepared accordingto Laemmli (21), as in Fig. 1, and on 3-5% polyacrylamidegradient, SDS-urea gels (not shown) prepared according toPfister et al . (31) . The basis for this behavior is not understood,though it may indicate that MAP 1A and MAP 1B arethemselves composed of numerous polypeptides differingslightly in electrophoretic mobility .The monoclonal antibody we described here reacted with
the entire MAP 1A band, indicating that if MAP 1A werecomplex, the components ofthis electrophoretic species mustbe closely related . It is possible that MAP 1 B and MAP 1 Crepresent proteolytic fragments of MAP IA lacking the anti-genic site recognized by our antibody . This possibility can bevirtually eliminated for MAP IC because of the resistance ofthis band to digestion by chymotrypsin (Fig. I C). If MAP ICwere derived from the larger polypeptides, they should showevidence ofa protease resistant region at least as large as MAP1C . Instead, MAP 1A and MAP 1B were totally digested toproducts oflower molecular weight than MAP 1C. The ques-tion of whether MAP 1 B is also a distinct protein or merelya fragment of MAP IA cannot be answered with certainty atthis time . However, in view of the reproducible ratio of thetwo bands that we have observed in our preparations, and, asnoted above, evidence of a specific enrichment of MAP 1 Bin white matter, we are inclined to consider MAP IA andMAP 1B distinct proteins . In the following paper (4) wedemonstrate by immunofluorescence microscopy that MAPIA is localized on microtubules in cultured cells, and istherefore a true MAP. At this time we do not know whetherMAP 1B and MAP 1C behave as MAP by immunocytochem-ical criteria. We are currently raising antibodies to MAP I Band MAP 1 C to characterize these species further.
Distribution of MAP 1A in the Nervous System
Several points regarding the distribution of MAP IA de-serve comment. Staining of processes clearly identifiable asaxons was observed throughout the brain and spinal cord .However, the staining intensity ofaxons by anti-MAP 1 A wasquite variable . In major cerebral white matter tracts (see Figs.2-4) bright staining was observed, while white matter tractsin the cerebellum and spinal cord (see Fig . 6) tended to beless intensely stained. Climbing fiber and parallel fiber axonsof the cerebellar cortex were also weakly stained (see Fig. 7).Thus, we cannot state as a general rule that all axons containhigh concentrations of MAP IA . Perhaps the concentrationof MAP IA varies with axon type, or the antigenic siterecognized by our particular antibody is differentially blockedby interaction with other proteins . Alternatively, there maybe real differences in the cytoskeletal composition of differentaxons for reasons that are not yet clear.The detectability of MAP 1 A in axons distinguishes this
protein from MAP 2 in terms ofsubcellular distribution . Thediscovery of MAP IA in two types of glial cells furtherdistinguishes this protein from MAP 2 . Oligodendrocytes werebrightly stained in culture, and cells with the characteristicsof oligodendrocytes were prominently labeled in spinal cordwhite matter (Fig. 6) and other white matter regions . Astro-cytes were also positive for MAP 1 A in primary brain cell
on August 3, 2006
ww
w.jcb.org
Dow
nloaded from

cultures, though we were unable to detect MAP IA in thesecells in vivo . Several factors may explain why astrocytes werestained by anti-MAP IA in culture, but not in vivo . First,immunofluorescence microscopy is more sensitive for cul-tured cell monolayers than for the tissue sections, due in partto differences in specimen thickness (no more than a few jmfor cultures vs . 20 um for tissue sections). Next, the stainingintensity with anti-MAP 1A was substantially greater fordividing than nondividing astrocytes in culture. Since maturebrain and spinal cord contain few, if any, dividing astrocytes,it is not surprising that no such cells were stained by anti-MAP lA in tissue sections. Finally, immature astrocytes, suchas those present in the primary newborn rat brain cultures,have been reported to be far richer in microtubules than moremature astrocytes, such as those found in the 3-4-mo-old ratsfrom which we obtained brain sections (30) . Collectively, theseconsiderations may explain why astrocytes were stained byanti-MAP 1A in primary brain cell cultures, but not in tissuesections .The distributions of MAP lA and MAP 2 in the nervous
system are clearly distinct . However, similarities in their dis-tributions are noteworthy. Throughout brain and spinal cordgray matter, both MAP lA and MAP 2 are heavily concen-trated in neuronal dendrites and cell bodies . Double immu-nofluorescence with antibodies to the two MAP have enabledus to demonstrate that individual cell bodies and dendritesmay contain high levels of both MAP IA and MAP 2 .Examples of this in the cerebral cortex and spinal cord areshown in Fig . 8 . Thus, while axons, oligodendrocytes andastrocytes express detectable levels of MAP IA only, thisprotein may be found in combination with high levels ofMAP 2 in neuronal perikarya and dendrites.
Functional ConsiderationsTwo observations regarding the distribution of MAP IA
and MAP 2 are relevant to the question of how these MAPfunction in cells. First, the distribution of the two proteins isnot identical. This conclusion was suggested by our earlierbiochemical results (40), but can now be made more emphat-ically on the basis of immunofluorescence microscopy. Withregard to this point, we note that differences between MAP 1and MAP 2, such as those observed in axons and in glial cells,may be relative rather than absolute . This is suggested by ourearlier observation that MAP 2 was not entirely absent inwhite matter, but was present at low levels (40), despite theabsence of significant immunoreactivity in white matter (8,24 ; Fig . 3 b in this paper) . Nevertheless, whether the absenceofMAP 2 in cells containing MAP lA is absolute or relative,it seems reasonable to conclude now that the two proteinscannot function cooperatively in cells in a simple stoichio-metric fashion . Though MAP 1 and MAP 2 are immunolog-ically cross-reactive, respectively, to the erythrocyte mem-brane proteins ankyrin and spectrin (2, 7), which interact withone another in a defined stoichiometry, our studies indicatethat MAP 1 A and MAP 2 are likely to act independently inthe cell . The second observation relevant to the question ofMAP function is the coincident presence of MAP IA andMAP 2 within individual neuronal perikarya and dendriticprocesses (Fig . 8) . Here, the two proteins may serve differentfunctions within the same cytoplasm .
Existing evidence from this laboratory indicates that MAP2 is involved at least in mediating the interaction of micro-tubules with intermediate filaments (3) . In the accompanying
paper (4) we report that no evidence supporting such a func-tion for MAP 1 A was obtained . Rather, this protein occurs inthe mitotic spindle of a wide variety of cells, as well as oncytoplasmic microtubules in nondividing cells . The functionalimplications of these findings and further observations arediscussed in the next paper (4).
We thank Sheryl L. Preston, Dr. Arthur McMorris, and Dr . RonLiem for supplying antibodies, Dr. Foteos Macrides for his valuableadviceand suggestions, and FrancisC. Luca for his excellent technicalassistance . In addition, we are grateful to Jacqueline Foss and JodyTubert for typing the manuscript .
This work was supported by National Institutes of Health grantGM26701 and March of Dimes Grant 5-388 to Richard B . Vallee,and by the Mimi Aaron Greenberg Fund .
Received -for publication 28 June 1983, and in revised form 28September 1983.
REFERENCES
1 . Aamodt, E., and R. C. Williams, Jr. 1983 . MAPS mediate association of microtubulesand neurofilaments in vitro . Biophys. J 41 :86a. (Abstr.)
2 . Bennett, V., and J. Davis. 1981 . Erythrocyte ankyrin : immunoreactive analogues areassociated with mitotic structures in cultured cellsand with microtubules in brain .Pew.Nall. Acad. Sci. USA. 78:7550-7554.
3 . Bloom, G. S., and R. B. Vallce. 1983 . Association of microtubule-associated protein 2(MAP 2) with microtubules and intermediate filaments in cultured brain cells. J CellBiol. 96:1523-1531 .
4. Bloom, G. S., F. C. Luca, and R. B. Vallee . 1984. Widespread cellular distribution ofMAP IA in the mitotic spindle and on interphase microtubules. J Cell Biol. 98 :331-340.
5 . Borisy, G. G., J . M. Marcum, J . B. Olmsted, D. B. Murphy, and K. A. Johnson. 1975 .Purification oftubulin andassociated high molecularweight proteins from porcinebrainand characterization of microtubule assembly in vitro . Ann. N.Y Acad. Sci. 253:107-132.
6. Bulinski, J. C., and G. G. Borisy . 1979 . Self-assembly of microtubules in extracts ofcultured HeLa cells and the identification of HeLa microtubule-associated proteins .Proc. Natl. Acad. Sci. USA. 76 :293-297 .
7. Davis, J., and V. Bennett . 1982. Microtubule-associated protein 2, a microtubule-associated protein from brain, is immunologically related to the a subunit of erythrocytespectrin . J Biol. Chem . 257:5816-5820 .
8. De Camilli, P., P. Miller, F. Navone, W. Theurkauf, and R. B. Vallee . 1984 . Patterns ofMAP 2 distribution in the nervous system studied by immunofluorescence. Neurosci-ence. In press .
9. Forni, L. 1979 . Reagents for immunofluorescence and their use for studying lymphoidcell products. In Immunological Methods . 1 . Lefkovits and B. Pernis, editors. AcademicPress, Inc., New York. 151-166.
10 . Goldman, M. 1968. Fluorescent Antibody Methods. Academic Press, Inc., New York .150 .
11 . Greene, L. A., R.K. H. Liem, andM. L. Shelanski. 1983 . Regulation ofahigh molecularweight microtubule-associated protein in PC 12 cellsby nerve growth factor. J. Cell Biol.96:76-83 .
12 . Griffith, L., andT. D. Pollard. 1978. Evidence for actin filament-microtubule interactionmediated by microtubule-associated proteins. J Cell Biol. 78 :958-965 .
13 . Griffith, L., andT. D. Pollard . 1982 .Theinteraction of actinfilamentswith microtubulesand microtubule-associated proteins . J. Biol. Chem. 257:9143-9151 .
14 . Herzog, W., and K. Weber. 1978 . Fractionation of brain microtubule-associated pro-teins. Eur . J Biochem. 92 :1-8.
15 . Hirokawa, N. 1982 . Cross-linker system between neurofilaments, microtubules, andmembranous organelles in frog axonsrevealed by quick-freeze, deep-etching method . J.Cell Biol. 94 :129-142.
16 . Izant, J . G., and J . R. McIntosh. 1980 . Microtubule-associated proteins: a monoclonalantibody to MAP 2 bindsto differentiated neurons . Proc. Nall. Acad. Sci. USA. 77 :4741-4745 .
17 . Kim, H., L. I . Binder, and J . L. Rosenbaum. 1979. The periodic association ofMAP 2with brain microtubules in vitro. J Cell Biol. 80 :266-276.
18 . Kohler, G., and C. Milstein . 1976. Derivation of specific antibody-producing tissueculture andtumor linesby cell fusion . Eur. J. Immunot. 6:511-519 .
19 . Konig, J. F. R., and R. A. Klippel. 1970. The Rat Brain : A Stereotoxic Atlas of theForebrain and Lower Parts of the Brain Stem. Robert E . Krieger Publishing Co.,Huntington, NY.
20 . Kuznetsov, S. A., V. I . Rodionov,V. I. Gelfand, and V. A. Rosenblat. 1982. Microtubule-associated protein MAP 1 promotes microtubule assembly in vitro. FEBS (Fed. Eur.Biochem. Soc.) Left. 135:241-244 .
21 . Laemmli, U. K. 1970. Cleavage of structural proteins during assembly of the head ofbacteriophage T4. Nature (Loud.). 227:680-685.
22 . Le Terrier, J . F., R. Liem, and M. L. Shelanski. 1982 . Interactions between neurofila-ments and microtubule-associated proteins: a possible mechanism for interorganellarbinding. J. Cell Biol. 95 :982-986 .
23 . Matus, A., R. Bernhardt, and T. Hugh-Jones. 1980 . High molecularweight microtubule-associated proteins are preferentially associated with dendritic microtubules in brain.Proc. Nad. Acad. Sri . USA. 78:3010-3014.
24 . Miller, P., U. Walter, W. E. Theurkauf, R. B. Vallee, and P. De Camilli . 1982. Frozentissue sections as an experimental system to reveal specific binding sites for theregulatorysubunit of type II cAMP-dependent protein kinase in neurons. Proc. Natl. Acad. Sci.USA. 79:5562-5566.
25 . Mirsky, R., J. Winter, E. R. Abney, R. M. Pros, J . Gavrilovic,andM. C. Raft Myelin-specific proteins and glycolipids in ratSchwann cellsand ofgodendrocytes in culture. J.Cell Biol. 84 :483-494 .
BLOOM ET AL .
Distribution of MAP 1A in the Nervous System
329
on August 3, 2006
ww
w.jcb.org
Dow
nloaded from

26 . Murphy, D. B., and G. G. Borisy. 1975. Association of high-molecular-weight proteinswith MT's and their role in MTassembly in vitro. Proc. Nad. Acad. Sci. USA. 72 :2696-2700.
27 . Olmsted, J. B., and H. D. Lyon. 1981 . A microtubule-associated protein specific todifferentiated neuroblastoma cells . J. Biol. Chem . 256:3507-3511 .
28 . Ouchterlony, O. 1948 . Ark. Minerol. Geol. B26:No. 14, I .29 . Peloquin, J . G., and G. G. Borisy. 1979 . Cell and tissue distribution of the major high
molecular weight microtubule-associated protein from brain . J. Cell Biol. 83(2, Pt .2):338a . (Abstr.)
30. Peters, A., S. L. Palay, and H. DeF. Webster. 1976 . The Fine Structure of the NervousSystem. W. B. Saunders Co ., Phiadelphia.
31 . Pfister, K. K., R. B. Fay, and G. B. Witman. 1982 . Purification and polypeptidecomposition of dynein ATPases from Chlamydomonas flagella. Cell Motility. 2:525-547.
32. Sattilaro, R. F., W. L. Dentler, and E. L. L&Cluyse. 1981 . Microtubule-associatedproteins (MAPS) and the organization of actin filaments in vitro. J Cell Biol. 90 :467-473.
33. Sherline, P., Y. C. Lee, and L. S . Jacobs . 1977 . Binding of microtubules to pituitarysecretorygranules and secretory granule membranes. J. Cell Biol. 72:380-389.
34. Sloboda, R. D., S. A. Rudolph, J . L. Rosenbaum, and P. Greengard. 1975. Cyclic AMP-dependentendogenous phosphorylation of a microtubule-associated protein. Proc. Natl.Acad. Sci. USA. 72 :177-181 .
35 . Suprenant, K. A., andW. L. Dentler . 1982 . Association between endocrine pancreaticsecretoryvesicles and in vitro assembled microtubules is dependent upon microtubule-associated proteins . J. Cell Biol. 93:164-174.
36. Theurkauf, W. E., and R. B. Vallee . 1982. Molecular characterization of the cAMP-dependent protein kinase bound to microtubule-associated protein 2 . J. Biol. Chem.
330
THE JOURNAL OF CELL BIOLOGY " VOLUME 98, 1984
257:3284-3290.37 . Theurkauf, W. E., and R. B. Vallee . 1983 . Extensive cAMPdependent and cAMP-
independent phosphorylation of microtubule-associated protein 2. J. Biol. Chem.258:7883-7886.
38 . Valdivia, M. M., J . Avila, J. Coll, C. Colaco, and I . V. Sandoval. 1982 . Quantitatio nand characterization of the microtubule-associated MAP 2 in porcine tissues and itsisolation from porcine (PK15) and human (HeLa) cell lines. Biochem . Biophys . Res.Commun . 105:1241-1249.
39 . Vallee, R. B. 1980 . Structure and phosphorylation of microtubule-associated protein 2(MAP 2). Proc. Nail. Acad. Sci . USA. 77:3206-3210 .
40. Vallee, R. B. 1982 . A taxoldependent procedure forthe isolation of microtubules andmicrotubule-associated proteins. J Cell Biol. 92:435-442 .
41 . Vallee, R. B., and G. G. Borisy. 1977 . Removal of the projections from cytoplasmicmicrotubules in vitro by digestion with trypsin. J. Biol. Chem. 252:377-382 .
42 . Vallee, R. B., M. J. Dibartolomeis, andW. E. Theurkauf. 1981 . A protein kinase boundto the projection portion of MAP 2 (microtubule-associated protein 2) . J Cell Biol.90 :568-576 .
43. Vallee,R. B., and S. Davis. 1983 . Low molecularweight microtubule-associated proteinsare light chains of microtubule-associated protein 1 (MAP 1). Proc. Natl. Acad. Sci.USA. 80:1342-1346 .
44. Vallee, R. B., and G. S. Bloom. 1984. High molecular weight microtubule-associatedproteins. In Modern Cell Biology. B. H. Satir, Series Editor. Alan R. Liss, Inc., NewYork. Vol. 3 . In press .
45. Weatherbee,J . A., R. B. Luftig,andR. R. Weihing . 1980. Purificationandreconstitutionof HeLa cell microtubules. Biochemistry. 19:4116-4123 .
46. Weingarten, M., A. Lockwood, S. Hwo, and M. Kirschner. 1975 . A protein factoressential formicrotubule assembly. Proc. Nail. Acad. Sci. USA. 72 :1858-1862 .
on August 3, 2006
ww
w.jcb.org
Dow
nloaded from