wider working paper 2015/115 · wider working paper 2015/115 tax ... as its first research and...
TRANSCRIPT

WIDER Working Paper 2015/115
Tax–benefit microsimulation
Feasibility study in Ethiopia
Andualem T. Mengistu,1 Kiflu G. Molla,1,2 and Firew B. Woldeyes1
November 2015
1Ethiopian Development Research Institute (EDRI), Addis Ababa, Ethiopia; 2Stockholm University, Sweden; corresponding author Andualem T. Mengistu: [email protected].
This study has been prepared within the UNU-WIDER project ‘The Economics and Politics of Taxation and Social Protection’.
Copyright © UNU-WIDER 2015
ISSN 1798-7237 ISBN 978-92-9256-004-1
Typescript prepared by Ayesha Chari for UNU-WIDER.
UNU-WIDER gratefully acknowledges the financial contributions to the research programme from the governments of Denmark, Finland, Sweden, and the United Kingdom.
The World Institute for Development Economics Research (WIDER) was established by the United Nations University (UNU) as its first research and training centre and started work in Helsinki, Finland in 1985. The Institute undertakes applied research and policy analysis on structural changes affecting the developing and transitional economies, provides a forum for the advocacy of policies leading to robust, equitable and environmentally sustainable growth, and promotes capacity strengthening and training in the field of economic and social policy-making. Work is carried out by staff researchers and visiting scholars in Helsinki and through networks of collaborating scholars and institutions around the world.
UNU-WIDER, Katajanokanlaituri 6 B, 00160 Helsinki, Finland, wider.unu.edu
The views expressed in this publication are those of the author(s). Publication does not imply endorsement by the Institute or the United Nations University, nor by the programme/project sponsors, of any of the views expressed.
Abstract: The purpose of this study is to assess the feasibility of building a microsimulation model of the Ethiopian tax and benefits system. We first provide a detailed description of the tax and benefits system of the country. This includes qualifying criteria, tax brackets, and exemptions. We then describe household survey datasets available in the country and examine the nature of these datasets in terms of representativeness, completeness, and panel data structure. Finally, we provide assessments for whether each tax and benefits system can be microsimulated given the rules and the nature of the data available. Keywords: tax, benefits, microsimulations, revenue JEL classification: E620, H240
Acknowledgements: We are thankful for various comments from Jukka Pirttilä that helped shape the document, and for UNU-WIDER for support.

1
1 Introduction
The main objective of this feasibility study is to assess the possibility of developing a tax–benefit microsimulation model for Ethiopia, given the currently available microdata in the country. To this end, we present a detailed description of the tax and benefit system in Ethiopia as well as assessment of the potential data sources.
Since the Ethiopian tax and customs laws are characterized by frequent repeals and amendments, we do not dwell on covering the reforms that took place over a period of time. Since the main purpose at hand is to provide a description of the current tax system of the country, we focus on the latest versions of each of the tax proclamations, regulations, and directives. Besides, in order to give a full picture of the Ethiopian tax system, we describe all types of taxes in the country regardless of whether these taxes can be simulated or not.
We also provide a detailed description of the limited benefit system in Ethiopia including old age pension benefits, medical benefits, maternal, sick, and injury leave benefits, as well as transfer benefits. In relation to transfer benefits, we describe the Productive Safety Net Programme (PSNP) in Ethiopia, one of the largest social protection programmes in Sub-Saharan Africa.
We also describe the possible data sources that can be used as inputs to the microsimulation model. After evaluating the advantages and disadvantages of these datasets, we conclude that the Ethiopia Socioeconomic Survey (ESS) is better suited for the task at hand. We also use the Household Consumption and Expenditure (HCE) Survey data to impute information expenditures into the ESS data. Finally, given the information available from this dataset, we assess the possibility of simulating the different tax and benefit instruments described in the study.
2 Ethiopia’s tax–benefit system
2.1 Description of taxes
In this section, we present a detailed description of the Ethiopian tax system focusing on the latest proclamations and regulations. In Ethiopia, currently, the Ethiopian Revenues and Customs Authority (ERCA) is the main institution responsible for administering taxes, collecting revenues from customs duties and domestic taxes. The government established the ERCA by merging the Ministry of Revenues, the Ethiopian Customs Authority, and the Federal Inland Revenues under Proclamation No. 587/2008. Although the ERCA has sole authority for collecting international trade taxes, it is not the only institution when it comes to domestic taxes. This is because tax revenues and tax revenue collecting arrangements in Ethiopia are divided between the federal (central) and state (regional) governments.
The constitution of the Federal Democratic Republic of Ethiopia (FDRE) gives power of taxation independently to the federal and state governments and concurrently to both tiers of government depending on the sources of income under consideration.
According to Article 96 of the constitution, the federal government is given the power to levy and collect import- and export-related taxes; income tax on employees of the federal government and international organizations; profit, sales, and excise taxes on enterprises owned by the federal government; income tax on winnings of national lotteries and other games of chance; tax on the

2
income of air, rail, and sea transport services; tax on income of houses and properties owned by the federal government; taxes on monopolies; as well as federal stamp duties.
On the other hand, Article 97 of the constitution gives states the power to levy and collect taxes on incomes of farmers, employees of the state, as well as employees of private enterprises and enterprises owned by the states; taxes on land usufractuary rights; taxes on profit of individual traders and enterprises owned by the states; sales and excise taxes on enterprises owned by the states; sales taxes on individual traders carrying out a business within their territory; taxes on income from transport services rendered on waters within their territory; and taxes on income derived from mining operations, as well as royalties and land rentals on such operations.
Regarding the concurrent power of taxation given to the federal and state governments, Article 98 of the constitution stipulates that the federal government and the states shall jointly levy and collect profit, sales, excise, and personal income taxes on enterprises they jointly establish; taxes on the profits of companies and on dividends due to shareholders; and taxes on incomes derived from large-scale mining and all petroleum and gas operations, as well as royalties on such operations.
Although Ethiopia is reducing its dependence on international trade taxes, by increasing its domestic taxation, import duties and taxes still contribute a significant share to the country’s total tax revenue. The share of import duties and taxes in total tax revenue, although declining from around 47 per cent in fiscal year 2005/06 to about 36 per cent in fiscal year 2012/13, is still the highest compared to domestic indirect taxes and direct taxes. In the fiscal year 2012/13, while direct taxes contributed some 34 percent to the government’s total tax revenue, domestic indirect taxes contributed around 30 percent (see Table 1).
Table 1: Percentage contribution of the different taxes to total tax revenue in fiscal years 2005/06 to 2012/13
2005/06
2006/07
2007/08
2008/09
2009/10
2010/11
2011/12
2012/13
Direct taxes 31.51 29.78 29.48 34.02 34.41 33.15 33.66 34.01 Income and profits tax 26.98 28.05 27.85 32.05 32.39 31.89 32.51 33.04
Personal income tax 9.98 10.53 11.21 12.17 10.14 9.72 10.38 10.81 Rental income tax 0.22 0.15 0.23 0.29 0.33 0.47 0.46 0.58 Business profit tax 12.30 13.28 12.77 14.92 17.06 17.05 18.12 18.16 Withholding income tax on imports 2.88 2.50 2.09 2.63 2.80 2.52 1.79 1.66 Agricultural income tax 0.58 0.57 0.57 0.85 0.90 0.53 0.38 0.34 Other income tax 0.60 0.63 0.62 0.86 0.88 1.27 1.04 1.16 Interest income tax 0.21 0.30 0.23 0.27 0.20 0.26 0.24 0.24 Capital gains tax 0.21 0.09 0.12 0.07 0.09 0.07 0.10 0.10
Rural land use fee 0.87 0.75 0.63 0.82 0.62 0.54 0.37 0.32 Urban land lease fee 3.65 0.98 1.00 1.14 1.40 0.72 0.77 0.65
Domestic indirect taxes 21.97 23.03 21.40 25.25 24.76 26.63 27.21 30.32 VAT/TOT/excise taxes 20.47 21.43 20.03 24.47 24.04 25.9 26.53 29.62 Stamp duties 1.50 1.60 1.37 0.78 0.72 0.73 0.68 0.69
Import duties and taxes 46.52 47.19 49.13 40.73 40.83 40.23 39.14 35.68 Customs duties 20.86 19.01 16.35 13.59 13.51 13.08 12.94 11.93 VAT/excise taxes 25.66 25.34 21.42 19.30 19.28 19.56 18.59 16.80 Surtax on imports 0.00 2.84 11.36 7.84 8.04 7.58 7.61 6.96
Export taxes 0.00 0.00 0.00 0.00 0.00 0.00 0.00 0.00 Total tax revenue 100 100 100 100 100 100 100 100
Notes: VAT, value-added tax; TOT, turnover tax.
Source: Authors’ computation based on data from the Ministry of Finance and Economic Development (2005–14).
Among direct taxes, employment income tax and business profit tax are the major contributors to total tax revenue, with respective shares of 11 and 18 per cent. With regard to the contributions of domestic indirect taxes, the share of sales (value-added tax, or VAT, and

3
turnover tax, or TOT) and excise taxes in total tax revenue increased by more than 10 percentage points between the fiscal years 2005/06 and 2012/13, contributing about 30 per cent to total tax revenue in 2012/13. On the other hand, during the same period, the share of VAT and excise tax on imports fell by about 10 percentage points. In 2012/13, VAT and excise tax on imports contributed 16.8 per cent, whereas customs duties contributed about 12 per cent to the country’s total tax revenue (see Table 1).
2.1.1 Direct taxes1
Ethiopia has been using income taxes as one of the principal sources of domestic government revenue since the beginning of modern taxation in the 1940s. The latest documents governing income tax laws in Ethiopia are the Income Tax Proclamation No. 286/2002 and the Council of Ministers Income Tax Regulation No. 78/2002.2 According to Proclamation No. 286/2002, the income tax laws apply to residents of Ethiopia with respect to their worldwide income and to non-residents of Ethiopia with respect to their Ethiopian source of income. The proclamation defines clearly who counts as a resident for tax purposes.
Proclamation No. 286/2002 divides income into four categories according to their sources as follows: (1) Schedule ‘A’ covers income from employment; (2) Schedule ‘B’ covers income from rental of buildings; (3) Schedule ‘C’ deals with income from business as defined in Article 2(6) of the proclamation, but does not include activities covered by the rural land use fee and agricultural activities income tax proclamations issued by regional states; and (4) Schedule ‘D’ covers other income including specified non-business capital gains, interest income, dividend income, income from royalties, income from games of chance, income from casual rental of property, and income paid for technical services rendered outside of Ethiopia.
2.1.1.1 Employment income tax (Schedule ‘A’)
Employment income tax is a tax on the earnings of an employee and is one of the major sources of revenue for the government.
The tax base under this tax category includes any payments or gains in cash or in kind received by an individual from employment, from former employment or otherwise, or from prospective employment. In the fiscal year 2012/13, tax revenue from personal income tax accounted for 10.81 per cent of the total tax revenue (see Table 1).
Exempted taxable employment income as specified by Proclamation No. 286/2002 (pp. 1873–4) include income from casual employment, pension contribution, and gratitude payments. Other exemptions specified in Regulation No. 78/2002 include medical treatment of the employee paid by the employer, transportation allowances, reimbursement of travelling expenses, and hardship allowance.
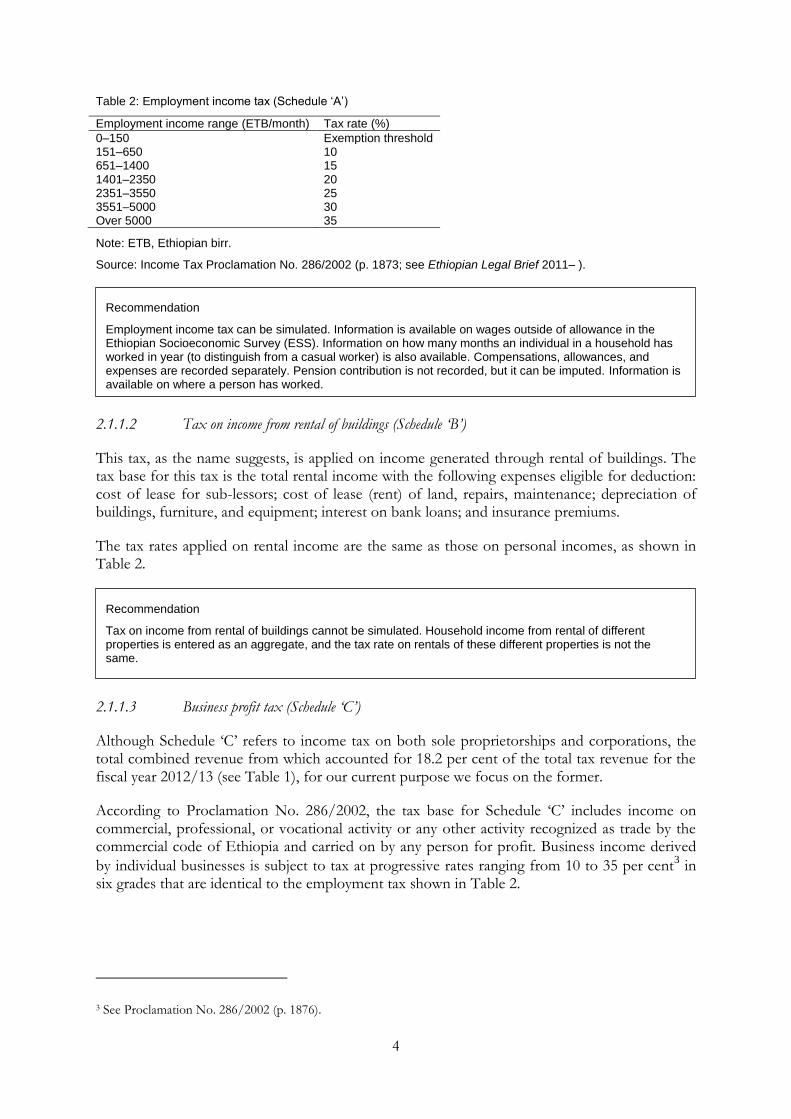
Different rates are applied to different levels of income. Specifically, there are seven bands of rates for specified ranges of income. Table 2 describes the ranges of income and the tax rate applicable.
1 Jebessa et al. (2005) contains detailed descriptions of these taxes.
2 See Ethiopian Legal Brief: A Blog About Ethiopian Law (2011– ) for open access to all proclamations, regulations and
directives, originally published in the Federal Negarit Gazeta, referred to in this study.
4
Table 2: Employment income tax (Schedule ‘A’)
Employment income range (ETB/month) Tax rate (%)
0–150 Exemption threshold 151–650 10 651–1400 15 1401–2350 20 2351–3550 25 3551–5000 30 Over 5000 35
Note: ETB, Ethiopian birr.
Source: Income Tax Proclamation No. 286/2002 (p. 1873; see Ethiopian Legal Brief 2011– ).
2.1.1.2 Tax on income from rental of buildings (Schedule ‘B’)
This tax, as the name suggests, is applied on income generated through rental of buildings. The tax base for this tax is the total rental income with the following expenses eligible for deduction: cost of lease for sub-lessors; cost of lease (rent) of land, repairs, maintenance; depreciation of buildings, furniture, and equipment; interest on bank loans; and insurance premiums.
The tax rates applied on rental income are the same as those on personal incomes, as shown in Table 2.
2.1.1.3 Business profit tax (Schedule ‘C’)
Although Schedule ‘C’ refers to income tax on both sole proprietorships and corporations, the total combined revenue from which accounted for 18.2 per cent of the total tax revenue for the fiscal year 2012/13 (see Table 1), for our current purpose we focus on the former.
According to Proclamation No. 286/2002, the tax base for Schedule ‘C’ includes income on commercial, professional, or vocational activity or any other activity recognized as trade by the commercial code of Ethiopia and carried on by any person for profit. Business income derived
by individual businesses is subject to tax at progressive rates ranging from 10 to 35 per cent3 in
six grades that are identical to the employment tax shown in Table 2.
3 See Proclamation No. 286/2002 (p. 1876).
Recommendation
Employment income tax can be simulated. Information is available on wages outside of allowance in the Ethiopian Socioeconomic Survey (ESS). Information on how many months an individual in a household has worked in year (to distinguish from a casual worker) is also available. Compensations, allowances, and expenses are recorded separately. Pension contribution is not recorded, but it can be imputed. Information is available on where a person has worked.
Recommendation
Tax on income from rental of buildings cannot be simulated. Household income from rental of different properties is entered as an aggregate, and the tax rate on rentals of these different properties is not the same.

5
(i) Deductible expenses
Expenses incurred by the individual for the purpose of earning, securing, and maintaining that business, subject to proof that these expenses are related to the business, are allowed to be deducted from income for business profit tax purposes.
(ii) Non-deductible expenses
Expenses incurred wholly and exclusively in the production of gross business income may be deducted from income derived from the same source. However, certain items may not be deducted. The list of these items can be found in Proclamation No. 286/2002 (p. 1876).
2.1.1.4 Non-business capital gains tax (Schedule ‘D’)
Capital gains tax is payable on gains on transfer (sale or gift) of certain investment properties such as buildings held for business, factory, and/or office and on transfer of shares of companies.
The base used to calculate capital gains tax, as specified in Regulation No. 78/2002, is the gain over the inflation-adjusted historical cost of the capital asset or the par value of the share.
Exemptions, as specified in Regulation No. 78/2002, are aggregate annual gains of less than 10,000 ETB realized upon sale of a capital asset. For individuals, gains obtained from the transfer of residential buildings are exempted.
The rates applied for capital gains tax are specified in Proclamation No. 286/2002 as follows: 15 per cent for buildings held for business, factory, and/or office and 30 per cent on capital gains from shares of companies.
2.1.1.5 Tax on interest income on deposits (Schedule ‘D’)
As specified in Proclamation No. 286/2002, every person deriving income from interest on deposits has to pay tax at the rate of 5 per cent.
Recommendation
Business profit tax can be simulated partially for individual business as the ESS survey data contains information on total sales and operational expenses. Although there is information on the assets for a household, there is no information on business assets. Some calculation can be done to estimate the business assets that are needed to determine depreciation which forms the basis for deductions.
Recommendation
It cannot be simulated as there is no information regarding income from capital gains in the ESS data.
Recommendation
It cannot be simulated. Interest income is aggregated with other investment income.

6
2.1.1.6 Dividend income tax (Schedule ‘D’)
As specified in Proclamation No. 286/2002, income derived from dividends from a share company or withdrawals of profits from a private limited company is subject to tax at the rate of 10 per cent. The withholding agent is required to withhold or collect the tax and account to the tax authority. This tax is a final tax in lieu of income tax.
2.1.1.7 Tax on income from royalties (Schedule ‘D’)
Proclamation No. 286/2002 (p. 1880) defines royalty as follows:
The term ‘royalty’ means a payment of any kind received as a consideration for the use of, or the right to use, any copyright of literary, artistic or scientific work, including cinematography films, and films or tapes for radio or television broadcasting, any patent, trade work, design or model, plan, secret formula or process, or for the use or for the right to use of any industrial, commercial or scientific equipment, or for information concerning industrial, commercial or scientific experience.
Tax on royalties is at a flat rate of 5 per cent.
2.1.1.8 Tax on income from games of chance (Schedule ‘D’)
As specified in Proclamation No. 286/2002, any income derived from winnings of games of chance (e.g. lotteries, tombola) is subject to tax at the rate of 15 per cent, except for winnings of less than 100 ETB.
2.1.1.9 Tax on income from rental of property (Schedule ‘D’)
As specified in Proclamation No. 286/2002, taxable income under this category refers to income derived from casual rental of property (including any land, building, or moveable asset) not related to a business activity. This type of income is subject to tax at a flat rate of 15 per cent of the annual gross income.
Recommendation
Tax on income from dividend cannot be simulated as income from dividends is aggregated with other investment income.
Recommendation
It cannot be simulated as there is no separate information on income from royalties.
Recommendation
It cannot be simulated. Information from lottery winnings is recorded together with gambling income and inheritance.

7
2.1.1.10 Tax on income from rendering of technical services outside Ethiopia (Schedule ‘D’)
Proclamation No. 286/2002 stipulates that all payments made in consideration of any kind of technical services rendered outside Ethiopia to resident persons in any form are liable to tax at a flat rate of 10 per cent, which shall be withheld and paid to the tax authority by the payer. According to Proclamation No. 286/2002 (p. 1880), the term ‘technical service’ refers to ‘any kind of expert advice or technological service rendered’.
2.1.1.11 Land use and agricultural income tax
As mentioned in Section 2.1, Article 97 of the constitution stipulates that regions shall levy taxes on incomes of private farmers and farmers incorporated in co-operative associations. Accordingly, agricultural income tax is administered by the regional governments and the proceeds are owed to the respective regional governments administering the tax.
Although regional governments are in the process of harmonizing the rates for agricultural income tax, currently the rates levied by the regions vary.
Similarly, according to Article 97, regional states are given the power to determine and collect fees for land usufructuary rights. Accordingly, each region levies the land use tax based on the size of holdings, and some regions also take into account fertility of land holdings.
Given the lack of information and the amount of time required to collect the relevant proclamations and regulations of each region, it is difficult, for now, to provide adequate description of these taxes. We have therefore decided to defer the discussion regarding these taxes to the next phase of this feasibility study.
2.1.1.12 Pension contributions
Currently, rules governing pension arrangements for public servants (persons permanently employed in any public office, including government appointees, members of parliament, members of the defence force, and the police) are specified in Proclamation No. 714/2011. Recently, however, the government of Ethiopia has introduced a Public Servants’ Pension (Amendment) Proclamation No. 907/2015 so as to include temporary government employees, employed for not less than 45 days, under the same pension scheme. Also, the Private Organization Employees Pension Fund was established under Proclamation No. 715/2011 in 2011 as private sector employees were not covered under the national pension scheme until then.
Recommendation
It cannot be simulated. Household income from rental of different properties is entered as an aggregate, and the tax rate on rental of these different properties is not the same.
Recommendation
It cannot be simulated.
Recommendation
It can be potentially simulated since information on land size is available. However, the rate has to be collected from each region.

8
According to this proclamation, private sector employees are covered under the same contribution and benefit scheme as public sector employees.
According to Proclamation No. 714/2011, while a public servant pays 7 per cent of his/her salary as contribution to the Public Sector Employees Pension Fund, the employing public office makes a contribution of 11 per cent towards the same fund. Similarly, a private sector employee and his/her employer, respectively, contribute 7 and 11 per cent of their salary towards the Private Organization Employees Pension Fund. On the other hand, the respective contributions by the public office and the public servant to the Military and Police Service Pension Fund are 25 and 7 per cent of their salary.
2.1.3 Indirect taxes
There are various indirect taxes in the country; however, we only include those that may affect the prices consumers face. These include customs duty (export tax and import tax), import surtax, VAT, TOT, and excise tax. Other taxes such as withholding tax on imports are applicable but they are just temporary taxes that do not affect the incentive of producers or consumers.
2.1.3.1 Customs duty
As shown in Table 1, trade tax is a major component of the revenue of the Ethiopian government. Customs duty is major component of trade taxes. For example, in the fiscal year 2012/13, revenue from customs duty accounted for 33.7 per cent of the total revenue from foreign trade taxes. During the same period, the share of customs duty in the total tax revenue was 11.9 per cent (see Table 1).
The latest applicable proclamation in Ethiopia on customs duties is Proclamation No. 622/2009.
(i) Export tax
There is no export tax in Ethiopia except on semi-prepared hides and skins of animals such as wet blue skin of oxen, wet blue hides of sheep and goat, and pickled hides of sheep. The tax is 150 per cent of the selling price of the hides and skins to be exported. This tax was introduced on 1 January 2010 by Directive No. 25/2009 issued by the Ministry of Finance and Economic Development (MoFED; see also ERCA, no date).
(ii) Import tax
The customs tariff applies to all imports, which are grouped into 97 categories based on the Harmonized System of Tariffs Classification Code. Customs duty for imported goods in Ethiopia is applied on the actual cost of goods up to the first entry point to the customs territory of Ethiopia. In other words the CIF (cost + insurance + freight) value of the good is the base
for import duty.4
4 Customs Proclamation No. 622/2009, p. 4624.
Recommendation
It can be simulated as information on the salary and place (sector) of work for each household member of working age is available.

9
Regarding rates, the customs duty has six bands: 0, 5, 10, 20, 30, and 35 per cent. However, as Ethiopia is a member of the Common Market for Eastern and Southern Africa (COMESA), tariffs applied on imports from other member states are reduced by 10 per cent from the normal levels (see also ERCA, no date).
These rates are applied according to two categories of items: on category 1 items (i.e. items used for productive purpose) a rate that ranges from 0 to 20 per cent is applied. On category 2 items (i.e. non-productive imports, luxury products) a rate that ranges from 30 to 35 per cent is applied.
With regard to the application of this tax, there are items eligible for customs duty waiver and there are rules regarding temporary import and export of goods. Such details can be found in the Customs Proclamation No. 622/2009.
2.1.3.2 Import surtax
A surtax on imported goods was introduced in Ethiopia in 2007. The revenue from surtax is meant to provide subsidies for curtailing the damaging effects of price hikes. In the fiscal year 2012/13, surtax on imported goods accounted for 7 per cent of the total tax revenue (see Table 1).
Under Regulation No. 133/2007, the council of ministers levied a 10 per cent surtax on all goods imported into Ethiopia except those exempt under Article 5 of the regulation. The list of exempted goods includes investment goods, fertilizers, petroleum and lubricants, aircraft, spacecraft and parts thereof, motor vehicles for freight and passengers, and special-purpose motor vehicles. Some medicines and raw materials are also exempt from surtax. The exemption also applies to imports by persons or organizations exempt from paying customs duty.
The basis of computation for surtax payable under these regulations is the sum of CIF value, customs duty, excise tax, and VAT payable on the goods.
Recommendation
Customs duty on import cannot be simulated. This is because there is no information about the origins of the goods consumed by a household. One could assume that price of all potentially imported goods is inclusive of customs duty. However, since the customs duty rate is different for different items, it is difficult to simulate this tax given the level of disaggregation in the expenditure data.
Recommendation
Import surtax can be partially simulated under the strong assumption that the price of all potentially imported goods include a surtax. The fact that surtax involves a uniform 10 per cent rate on all but few exempted goods makes it possible to simulate this tax with a rough approximation.

10
2.1.3.3 VAT
VAT was introduced in Ethiopia in 2002 via Proclamation No. 285/2002. It has been an important source of revenue since its introduction. For instance, in the fiscal year 2013/14, revenue collected from VAT on imported items accounted for about 16.8 per cent of the total tax revenue.
In terms of implementing the proclamation, with the aim of reducing compliance burden, the application of VAT is limited to businesses with an annual volume of trade exceeding 500,000 ETB. For businesses whose annual volume of trade does not reach this threshold, a TOT is introduced along with VAT. VAT is imposed on both imports and domestic transactions.
The tax base for VAT is (i) every taxable transaction by a registered person; (ii) every import of goods, other than an exempt import; and (iii) an import of services as provided in Article 23 of Proclamation No. 285/2002.
To reduce the disincentive to consume some important goods and services deemed to have social benefits, the proclamation has also introduced zero rating and exemptions.
The list of items that are zero-rated and exempt can be found in the Value-Added Tax Proclamation No. 285/2002 (pp. 1838–41).
2.1.3.4 TOT
TOT is charged under the Turnover Tax Proclamation No. 308/2002 introduced from 1 January 2003. TOT is imposed on persons not registered for VAT with the aim of equalization. It is applicable to transactions involving businesses with annual taxable transaction values below 500,000 ETB that have not registered for VAT voluntarily.
The tax base for the purpose of TOT is the gross value of goods supplied and services rendered. A 2 per cent rate is applicable on the gross receipts of goods sold locally. Regarding services, a 10 per cent rate is imposed on all except on contractors, grain mills, tractors, and combine-harvesters, which face a 2 per cent TOT rate.
The proclamation also includes a list of exempt items similar to those exempt from VAT. This list is available from the Turnover Tax Proclamation No. 308/2002 (p. 2026).
Recommendation
VAT can be partially simulated. This can be done with the assumption that the price of all goods, with the exception of VAT-exempt items, implicitly include VAT. Although not very unrealistic, this assumption is important because VAT is paid only if the seller’s turnover is 500,000 ETB or above; and we do not have information about where households make their purchases. Since some VAT-charged and VAT-exempt expenditure items can be aggregated together, it is not possible to fully simulate this tax.
Recommendation
Turnover tax (TOT) can be partially simulated. Although it is not possible to tell where households make their purchase from, as TOT is paid only if the seller’s turnover is below 500,000 ETB, we can partially simulate this tax by assuming that VAT and TOT are in principle the same.

11
2.1.3.5 Excise tax
Excise tax in Ethiopia is imposed on selected imported as well as domestically produced goods. The latest proclamation applicable with regard to excise tax in Ethiopia is Proclamation No. 307/2002. According to the federal government budget report, in the fiscal year 2014/15, excise tax on imported goods and locally produced goods accounted for 5.4 and 3.7 per cent of the total tax revenue of the central government, respectively (see Ministry of Finance and Economic Development 2014).
The base for computation of excise tax depends on whether the good is locally produced or imported. For locally produced goods, the base of calculation is the cost of production. The cost of production in this case includes direct labour and raw material costs incurred in the production process as well as the cost of indirect inputs and overhead costs; it does not include costs related to depreciation of machineries. For imported goods, the base for calculation of
excise tax is the sum of CIF value and customs duty.5
Excise tax has ten bands or groups of rates ranging from 10 per cent (on textile products) to 100 per cent (on perfumes and certain alcoholic drinks and passenger cars). These ten bands of rates, applied depending on the nature of products, are 10, 20, 30, 33, 40, 50, 60, 75, 80, and 100 per cent (see ERCA, no date).
2.2 Social benefits
In this section, we describe the social benefit schemes currently implemented in Ethiopia. Although the contributory social security scheme in Ethiopia started in the early 1960s, there are still no comprehensive non-contributory social benefit schemes such as child benefits, old age benefits, and disability welfare benefits. An exception to this is the PSNP in Ethiopia which started in 2005 and covers rural parts of the major regions of the country.
2.2.1 Old age pension, gratuity, and survivors’ pension
A contributory social security system in Ethiopia started in the early 1960s. The current proclamation governing this security system is the Public Servants’ Pension Proclamation No. 714/2011, which establishes the public servants’ pension funds (Civil Service Pension Fund and Military and Police Service Pension Fund). Although there was no coverage for private sector employees until 2011, these employees are currently covered under the Private Sector Employees’ Pension Fund established under the Private Organization Employees’ Pension Proclamation No. 715/2011. This proclamation provides private sector employees with the same benefit structure as civil servants.
Quite recently, the Ethiopian government introduced the Public Servants’ Pension (Amendment) Proclamation No. 907/2015. The amendment is mainly to include temporary government
5 For the calculation of the base, refer to ERCA (no date).
Recommendation
Excise tax cannot be simulated. This is because there is no information about the source of the goods consumed by a household. Different rates apply to different products and even to items in one category. For example, there is no single excise tax rate on alcohol, and the level of disaggregation of the expenditure data is not enough to take this into account.

12
employees, employed for not fewer than 45 days, under the public employees’ pension scheme. Unlike Proclamation No. 714/2011, which defines a public servant as a permanent public employee, the amendment to this proclamation defines a public servant as a ‘monthly salaried person employed permanently or for definite period or piece of work in a public office, public enterprise or project or program carried out by government’ (Proclamation No. 907/2015, p. 8287).
Next, we present descriptions of the pension benefit systems that apply to civil servants and the military and police. To avoid repetition, description of the pension benefit system that applies to private sector employees will not be presented here as, since July 2011, it has been reformed to be the same as the pension benefit system that governs civil servants.
2.2.1.1 Retirement pension and gratuity
According to Proclamation No. 714/2011, the normal retirement age of a public servant, regardless of gender, is 60 years. For members of the defence and police forces, however, the proclamation leaves the retirement age to be determined by the legislations regulating these forces.
The proclamation sets the minimum number of years of service/contribution required to qualify for retirement pension at ten years. Accordingly, a public servant who has ten years of service and retires upon attaining the retirement age of 60 years will be entitled to lifetime retirement pension benefits. On the other hand, public servants who leave service after 20 years of service will be granted pension benefits for life upon attaining the retirement age, while those who leave service after 25 years will be entitled to retirement pension for life upon reaching 55 years of age. If a public servant reaches the retirement age before completing the ten years of service required for entitlement of pension benefit, s/he shall be entitled to receive a lump sum retirement
gratuity.6
In accordance with Proclamation No. 714/2011, the amount of retirement pension for a public servant is set at 30 per cent of the average salary for the last three years before retirement. For each additional year of service above the required ten years of service, the retirement pension is increased by 1.25 per cent for a public servant and 1.65 per cent for members of defence or police forces.7
2.2.1.2 Invalidity and incapacity pension and gratuity
Proclamation No. 714/2011 grants a public servant an invalidity pension payment (of similar amount to normal pension) for life if s/he leaves service after ten years of service but before the retirement age owing to health problems that prevents him/her from any other gainful employment. On the other hand, if a public servant leaves service before completing ten years of service owing to health-related problems that prevents him/her from any other gainful employment, s/he is entitled to a lump sum invalidity gratuity payment.
6 Pension benefits received, contributions collected, and profits earned from investment of pension funds are all
exempt from taxes.
7 For details of retirement pension payments for government officials and members of parliament as well as
payments for retirement gratuity, see Proclamation No. 714/2011 (pp. 5952–3).

13
Similarly, public servants who leave service following employment injury (i.e. injury at the workplace) of not less than 10 per cent are entitled to incapacity pension and gratuity payments according to Proclamation No. 714/2011 (pp. 5954–5).
2.2.1.3 Survivors’ pension
If a public servant dies because of employment injury or while receiving pension payments or upon completing ten years of service, his/her survivors are entitled to pension payments. Specifically, while a widow or widower is entitled to 50 per cent of the pension the deceased was or would have been entitled to, a surviving child under the age of 18 years is entitled to 20 per cent of the pension. Similarly, each parent of the deceased public servant is entitled to 15 per cent of the pension (Proclamation No. 714/2011, pp. 5959–61).
2.2.1.4 Private sector employees
As indicated earlier, the Private Organization Employees’ Pension Proclamation No. 715/2011 provides the same detailed arrangement regarding pension benefits and gratuity as the public pension scheme that applies to civil servants.
2.2.2 Sickness and maternity benefits
2.2.2.1 Sick leave
According to the Labour Proclamation No. 377/2003, in any 12-month period, civil servants are entitled to a maximum sick leave period of six months, conditional on presenting a medical certificate. Regarding payments during periods of sick leave, the proclamation further stipulates that a civil servant is entitled to 100 per cent of his/her salary for the first month and 50 per cent of his/her wage in the next two months of the sick leave period. Out of the total six-month period, the civil servant is entitled to take the remaining three months of sick leave without pay.
2.2.2.2 Maternity leave
The Proclamation No. 377/2003 also grants civil servants a maternity leave with full pay. Specifically, Article 88 of this proclamation states that a female worker is entitled to a paid leave period of 30 consecutive days before the due date of birth and a period of 60 consecutive days of paid leave after the birth of the child.
Recommendation
Pension benefits cannot be simulated. Although the ESS dataset contains information on an individual’s pension income, the work (contribution) history of the individual is not known.
Recommendation
Benefits related to sick leave cannot be simulated as there is no information on leave in the data.
Recommendation
It can be partially simulated. There is information on new additions to family and how old they are and this can be used as a basis for maternity leave. However, assumptions have to be made about the kind of leave the mother took. This is because there is no information on maternity leave so to speak.

14
2.2.3 Medical and injury leave benefits
Proclamation No. 377/2003 further grants civil servants medical benefits and paid leave periods if they happen to sustain workplace-related injury. If a civil servant happens to sustain an employment injury, the government institution (as employer) is required to cover medical expenses incurred in relation to the employment injury. Besides, the civil servant is entitled to paid injury leave until s/he recovers and is able to resume work.
2.2.4 Transfer payments and PSNP
Although Ethiopia has several non-contributory benefit schemes provided by non-governmental organizations (NGOs), most are of a smaller scale than the microsimulation model and therefore not particularly fitting. A social protection transfer payments programme of interest to the microsimulation model at hand is the PSNP, a government safety net programme established in 2005 through multi-donor financing. The main objective of the programme is to help chronically food-insecure rural households develop the capacity to resist shocks, create assets, and become food self-sufficient. To this end, the programme offers predictable transfers in the form of food, cash, or a combination of both to chronically food-insecure rural households through its public works or direct support components. Households with able-bodied members participate under the public works component and receive cash (food) transfers conditional on supply of labour to public works aimed at building community assets. On the other hand, households without able-bodied members are covered under the direct support component and receive unconditional cash (food) transfers (i.e. without the need to supply any labour).
The PSNP in Ethiopia is also the second-largest safety net programme in sub-Saharan Africa, next only to the one in South Africa. The programme started with the coverage of 4.84 million food-insecure rural households in Ethiopia, and since December 2006 it has been scaled up significantly to cover 7.57 million households (see Ministry of Agriculture and Rural Development 2010).
The programme covers rural households in the eight major regions of the country: Tigray, Amhara, Oromiya, Southern Nations, Nationalities and Peoples’ Region (SNNPR), Afar, Somali region rural Harari, and Dire Dawa. Beneficiaries of the PSNP are households that live in chronically food-insecure kebeles of woredas that are defined by the government as chronically food insecure. The PSNP ‘Programme Implementation Manual’ lists criteria used to classify woredas and households as chronically food insecure as well as the eligibility criteria used for participation in the programme (see Ministry of Agriculture and Rural Development 2006, 2010).
According to the 2010 ‘Programme Implementation Manual’, the PSNP cash wage rate determined for the fiscal year 2010/11 is 10 ETB (or its equivalent amount in cereals) per day per household member. The manual also states that the wage rate will be amended annually based on a wage-rate study. Each able-bodied household member is required to work five days per month. Able-bodied members can, however, work up to a maximum of 15 days per month to secure payments for members who are unable to supply labour. Based on this, the total (annual) PSNP entitlement for each household (based on 2010/11 wage rates) can be calculated
as: 10 ETB 5 days of work 6 months number of household members.
Recommendation
It cannot be simulated as there is no information on medical benefits received from employers or injury-related paid sick leaves.

15
Beneficiaries with direct support (i.e. beneficiaries of unconditional transfers) also get the same amount of transfer, except that they are not expected to supply labour.
3 Description of possible data sources
To decide which data sources will be more suited for the microsimulation study we considered all available and related household level surveys undertaken by the Central Statistical Agency (CSA) of Ethiopia. After assessing the merits and demerits of the potential data sources, we reached the tentative conclusion that the ESS is most appropriate for the task at hand.
Our assessment consisted of the following steps. First, we listed all the variables needed for the microsimulation. These included information about incomes, expenditures, household demographics, labour market participation of household members, and other household and individual characteristics. The second step was to evaluate the two most relevant datasets identified. We evaluated these two datasets mainly in terms of completeness of the variables/information and representativeness.
3.1 Data requirements for microsimulation
In this section we list, in some detail, the variables required for microsimulation. The necessary variables can in general be classified into four groups: information on incomes, expenditures, household demographics, and labour market participation.
Regarding incomes, information on incomes of household members and the household in general is needed from:
Wages and salaries
Self-employment
Agriculture
Rent, interest on deposits, dividends etc.
Sale of property
Other private sources
Pension benefits, public benefits, and any other income relevant for taxes and benefits in Ethiopia.
Regarding data on expenditures, information is required on household expenditures on, but not limited to, the following items:
Health care, education
Rent, housing
Taxes
Pension contributions
Other expenditures.
Recommendation
Transfer payments under the PSNP can be simulated as data are available on the amount of income each household received from this programme.
16
Regarding data on household demographics, for microsimulation information is needed on the following variables:
Age and/or date of birth
Gender and marital status
Level of education attained
Relationship to the household head.
Data on these demographic variables was gathered for the household head and other household members. In general, information on household structure is necessary in order to identify relationships within a family. This information is necessary for building different fiscal units for a model (spouse, children, and parents).
Finally, regarding the information on labour market particiation, member level data on the following variables needs to be gathered:
Employment status, working hours
Industry, sector
Occupation, civil servant status
Degree of disability.
3.2 Input datasets
The CSA undertakes various household surveys periodically. Among these surveys, we have chosen to assess the Household Income, Consumption and Expenditure (HICE) Survey, the National Labour Force Survey, the Agricultural Sample Survey (AgSS), and the Ethiopia Socioeconomic Survey (ESS). Although these surveys (interviews) are conducted in the local languages of the respondents, the questionnaires and datasets are available in English.
In the following subsections, focusing on HICE and ESS, the two most promising surveys, we describe the sampling design, representativeness, non-response rates, variables included in the surveys, quality and accessibility of data, as well as lists of publications that use the aforementioned data sources.. Finally, based on this discussion and in light of the data needed for the microsimulations, we provide a tentative recommendation regarding the best data source.
3.2.1 HICE Survey
The CSA has so far conducted four rounds of HICE surveys, in 1995/96, 1999/2000, 2004/05, and 2010/11. The overarching objective of these surveys is to provide a picture of the income dimension of poverty in the country.
As the name signifies, each of the first three surveys contained information on income as well as consumption expenditures. However, the collected income data of households was found to be consistently much lower than their expenditures, suggesting that income data is not reliable. As a result, for the 2010/11 survey, the decision was made to exclude data collection on income. The name of the survey conducted in 2010/11 was, therefore, changed to the Household Consumption Expenditure (HCE) Survey (see International Household Survey Network 2013).
3.2.1.1 Sampling frame and sample design of the HCE Survey
The 2010/11 HCE Survey covered all urban and rural parts of the country except the non-sedentary populations of three zones of Afar and six zones of the Somali region.

17
The samples for the survey were drawn in the following way. First the country was divided into three broad categories: rural, major urban centres, and other urban centres. Then, for each category, households were randomly selected following a two-stage (in some cases three-stage) stratified cluster sampling.
(i) Category I (rural)
This category consisted of rural areas in 68 zones and special woredas (considered as zones) in the eight regions as well as rural parts of the Harari region and Dire Dawa City Administration. The rural parts of each region including the Harari region and Dire Dawa City Administration were considered as survey domains (i.e. reporting level) for which the major findings of the survey were reported. Category I had a total of ten reporting levels.
To arrive at the sample of rural households, a stratified two-stage cluster sampling strategy was followed. Specifically, in the first stage cluster sampling strategy was used to select primary sampling units (PSUs, or enumeration areas, EAs) from each stratum (rural areas of each zone of the ten survey domains). This was done using systematic sampling techniques (i.e. probability proportional to size, PPS). In the second stage, after selecting the EAs, 12 households per sample EA were systematically selected as second-stage sampling units (SSUs). Accordingly, a total of 864 EAs and 10,368 households were selected from Category I.
(ii) Category II (major urban centres)
In this classification, all regional capitals (ten cities) and five other major urban centres with relatively larger population sizes were included. Each of the 14 urban centres and 10 sub-cities of Addis Ababa administration (i.e. a total of 24 urban domains) were taken as a reporting level.
As in Category I, households from each of these 24 urban centres were selected after picking EAs from each urban centre using cluster sampling strategy. Specifically, after systematically selecting EAs from each stratum (urban centre), 16 households were then selected from each EA. This resulted in a total of 576 EAs and 9216 households from Category II.
(iii) Category III (other urban centres)
Urban centres in the country other than those under Category II were grouped under this category. A domain of other urban centres was formed for the eight regions (excluding Harari, Addis Ababa, and Dire Dawa City Administration).
Unlike Categories I and II, a stratified three-stage cluster sample design was adopted to select samples from these categories. In the first stage, PSUs (other urban centres) were selected, from each stratum (region), systematically using PPS. In the second stage, SSUs (EAs) were systematically selected from the selected other urban centres (PSUs). Finally, 16 households from each of the selected EAs were selected as a third-stage sampling unit. This resulted in 112 urban centres, 528 EAs, and 8448 households in Category III.
The list of all households obtained from the 2007 Population and Housing Census was used as a sampling frame to select the sample EAs in both rural and urban areas of the country. Sample EAs of each reporting level were selected using PPS with systematic sampling techniques, size being the number of households obtained from the 2007 Population and Housing Census.
18
3.2.1.2 Coverage, representativeness, and non-response rate of the HCE Survey
The 2010/11 HCE Survey covered all rural and urban areas of the country except the non-sedentary populations in Afar (three zones) and the Somali region (six zones). The sample households are selected anew every five years and therefore the HICE/HCE Survey data is repeated cross-sectionally. In addition, the sampling design implies that the data is representative at both national and sub-national levels. In terms of sub-national representativeness, for both rural households and other urban centres the data is representative at a regional level. For urban households, the representativeness is at the level of major urban centres.
The initial sample selection included 864 rural EAs and 1104 urban EAs, with 10,368 and 17,664 households, respectively. For various reasons, 2 rural EAs and 48 rural households were not surveyed, resulting in a rural household response rate of 99.5 per cent. All selected urban EAs were successfully covered, with an urban household response rate of 99.2 per cent.
3.2.1.3 Survey administration, data management and data use of the HCE Survey
Unlike the previous surveys, data collection for the HCE Survey took place for one full year, from 8 July 2010 to 7 July 2011. The census enumerators were trained to relay the questions written in English in the local language of the respondents for ease of understanding. Once survey data was collected and cleaned, it was labelled in English and distributed to stakeholders with metadata.8
3.2.1.4 Information content of the HCE Survey
The HCE Survey contains information on household demographics, occupations of household members, as well as expenditures and sources of incomes.
(i) Demographic information: The survey collected the following information on the demographic characteristics of households in general and each of its members in particular:
List of the names of all individuals in the household: An individual is considered a member of the household if s/he has common cooking arrangements and a household head in common with the rest of the household members.
Age of each individual in the household: Age in years refers to completed years according to an individual’s last birthday. However, for infants below 1 year and for respondents above 97 years of age codes 00 and 97 are used, respectively.
Sex of each individual in the household.
Marital status of each individual in the household who is above ten years of age.
Whether an individual contributes to household income.
The relationship of each individual relative to the household head and spouse (i.e. whether a member of the household is a household head or a spouse, if not what the relationship of that individual is to the household head and to the spouse (son, daughter, mother, brother, grandchild, adopted child, employed domestic servant, other relatives). In terms of spouses, the data clearly distinguishes between those who are spouses (with either a civil or customary marriage) and those who live as spouses (with no formal
8 The CSA makes this data readily available for interested researchers. Several authors have used the data for
academic publications and a representative list of these publications is available at: http://catalog.ihsn.org/index.php/catalog/3123/related_citations (accessed 13 November 2015).

19
marriage arrangement but living together). In terms of adoption, it is not very clear whether informal fostering is included. This is an area that will be explored further.
(ii) Education, labour market information, and employment status: The survey collected the following information on the education of each member of a household above five years of age:
Whether the individual can read and write
Whether the individual has attended schooling
The highest education level the individual has reached.
It also collected the following information on the labour market:
Whether an individual has worked most of the time in the last 12 months.
If the individual has not worked, s/he is asked to specify the reason for not working, from among the following choices:
a) Unemployed b) Student c) Home-maker d) Retired e) Dependent on remittances f) Old age g) Disability h) Sickness/Injury (including mental health conditions) i) Too young (10–14 years old).
If the individual has worked, s/he is asked about the following details: a) Employment status9 b) Main employment occupation category
i) Legislators, senior officials, and managers ii) Professionals, technicians, and associate professionals iii) Clerks, service, and shop and market sales workers iv) Skilled agricultural and fishery workers v) Craft and related trade workers vi) Plant and machine operators and assemblers vii) Elementary occupations viii) Member of defence forces
c) Business (industry) type i) Agriculture, hunting, and forestry ii) Fishing iii) Mining and quarrying iv) Manufacturing v) Electricity, gas, and water supply vi) Construction vii) Wholesale and maintenance of vehicles, motorcycles, and personal
household goods viii) Hotel and restaurants ix) Transport, storage, and communication x) Financial intermediation
9 If an individual is a housemaid or a guard who lives and eats with the household, s/he is not considered as
employed.

20
xi) Real estate, renting, and business activities xii) Public administration, defence and social security xiii) Education xiv) Health and social work xv) Other community, social, and personal service activities xvi) Private households with employed persons
d) Employer (working employer) e) Employing organization (private enterprise, public/government enterprise,
NGO, religious organization, etc.) f) Unpaid work (family work, apprenticeship, etc.).
(iii) Consumption expenditure and source of income information: Regarding consumption expenditures, the survey collected the following information for each pre-specified commodity: how much a household has spent on each good (value in local currency), the unit and quantity of the good, and the associated price. In addition, information was collected on whether payment was made in cash or in kind for the purchase of the good. Furthermore, information on the source of money for each of the expenditures was assessed. Specifically, a question was asked as to where (source) the household gets the money they spend on each item. The survey questionnaire provided an exhaustive list of sources for households to choose from. Tables 3–5 are presented in support of the information from the HCE Survey.
Table 3: Variables regarding expenditures in the HCE dataset
Expenditure category Reference period
Consumption of food, beverages, and tobacco 2 (past 3 days and past 4 days) Household expenditure on non-durable goods and more frequent services such as public transport, communication, entertainment
3 (past 3 days, past 4 days, and past 1 month)
Household expenditure on clothing and footwear 2 (past 3 months and past 12 months) Dwelling rent (including imputed rent), maintenance,
household equipment and operation 2 (past 3 months and past 12 months)
Medical expenses, purchase of transport and communication tools
2 (past 3 months and past 12 months)
Household expenditure on education, recreation and entertainment, cultural and sports goods and services
2 (past 3 months and past 12 months)
Household expenditure on personal goods, financial services, household non-consumption expenditure and other payments
2 (past 3 months and past 12 months)
Source: Based on the HCE Questionnaire (International Household Survey Network 2013) and authors’ summary.
21
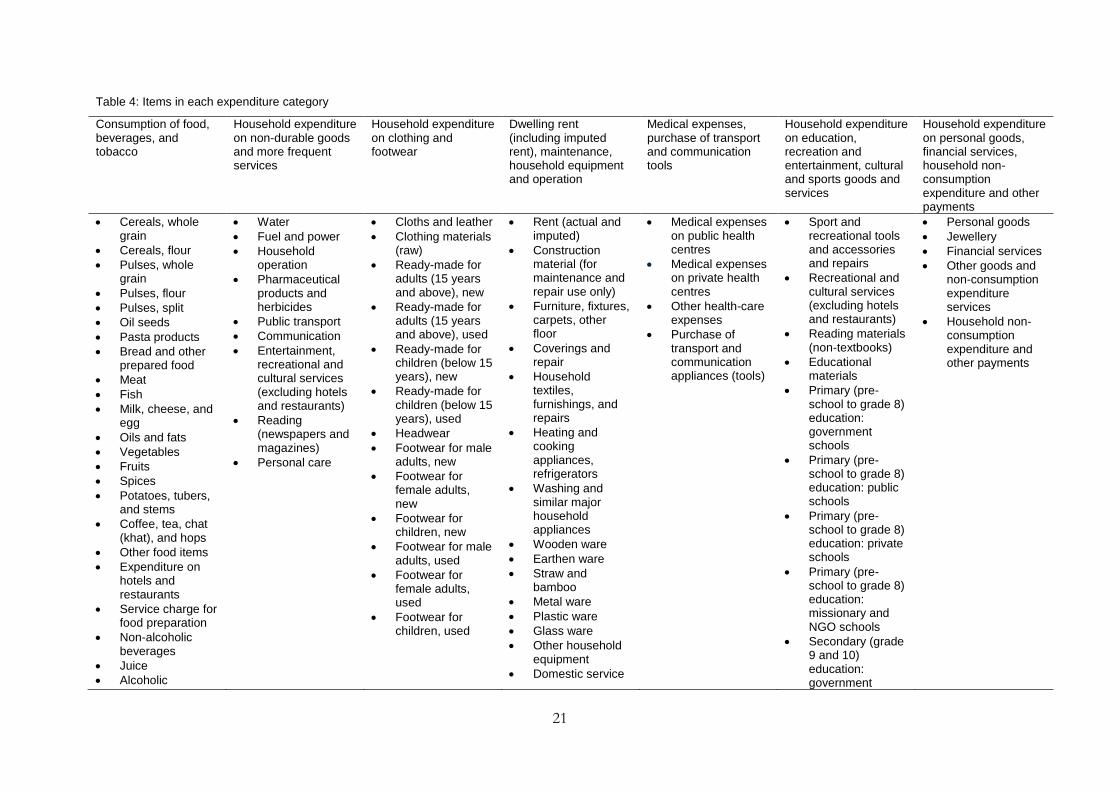
Table 4: Items in each expenditure category
Consumption of food, beverages, and tobacco
Household expenditure on non-durable goods and more frequent services
Household expenditure on clothing and footwear
Dwelling rent (including imputed rent), maintenance, household equipment and operation
Medical expenses, purchase of transport and communication tools
Household expenditure on education, recreation and entertainment, cultural and sports goods and services
Household expenditure on personal goods, financial services, household non-consumption expenditure and other payments
Cereals, whole grain
Cereals, flour
Pulses, whole grain
Pulses, flour
Pulses, split
Oil seeds
Pasta products
Bread and other prepared food
Meat
Fish
Milk, cheese, and egg
Oils and fats
Vegetables
Fruits
Spices
Potatoes, tubers, and stems
Coffee, tea, chat (khat), and hops
Other food items
Expenditure on hotels and restaurants
Service charge for food preparation
Non-alcoholic beverages
Juice
Alcoholic
Water
Fuel and power
Household operation
Pharmaceutical products and herbicides
Public transport
Communication
Entertainment, recreational and cultural services (excluding hotels and restaurants)
Reading (newspapers and magazines)
Personal care
Cloths and leather
Clothing materials (raw)
Ready-made for adults (15 years and above), new
Ready-made for adults (15 years and above), used
Ready-made for children (below 15 years), new
Ready-made for children (below 15 years), used
Headwear
Footwear for male adults, new
Footwear for female adults, new
Footwear for children, new
Footwear for male adults, used
Footwear for female adults, used
Footwear for children, used
Rent (actual and imputed)
Construction material (for maintenance and repair use only)
Furniture, fixtures, carpets, other floor
Coverings and repair
Household textiles, furnishings, and repairs
Heating and cooking appliances, refrigerators
Washing and similar major household appliances
Wooden ware
Earthen ware
Straw and bamboo
Metal ware
Plastic ware
Glass ware
Other household equipment
Domestic service
Medical expenses on public health centres
Medical expenses on private health centres
Other health-care expenses
Purchase of transport and communication appliances (tools)
Sport and recreational tools and accessories and repairs
Recreational and cultural services (excluding hotels and restaurants)
Reading materials (non-textbooks)
Educational materials
Primary (pre-school to grade 8) education: government schools
Primary (pre-school to grade 8) education: public schools
Primary (pre-school to grade 8) education: private schools
Primary (pre-school to grade 8) education: missionary and NGO schools
Secondary (grade 9 and 10) education: government
Personal goods
Jewellery
Financial services
Other goods and non-consumption expenditure services
Household non-consumption expenditure and other payments

22
beverages
Cigarettes
Tobacco
schools
Secondary (grade 9 and 10) education: public schools
Secondary (grade 9 and 10) education: private schools
Secondary (grade 9 and 10) education: missionary and NGO schools
Preparatory (grade 11 and 12) education: government schools
Preparatory (grade 11 and 12) education: public schools
Preparatory (grade 11 and 12) education: private schools
Preparatory (grade 11 and 12) education: missionary and NGO schools
Technical and vocational education (TVET) and higher education: government institutes
TVET and higher education: public institutes

23
TVET and higher education: private institutes
TVET and higher education: missionary and NGO institutes
Correspondence: local
Correspondence: foreign/abroad
Boarding school
Other educational expenses
Source: Based on the HCE Questionnaire (International Household Survey Network 2013) and authors’ summary.

24
Table 5: List of potential sources of household income
Code Source of income
11 Consumption of own agricultural production 12 Sale of own agricultural product 21 Consumption/use of own household non-agricultural enterprise, goods, and services 22 Sale of goods and services of household non-agricultural enterprise 31 Salary/wage, bonus, overtime, allowance 41 Interest and royalties 42 Dividends (profit share) 43 House rent 44 Imputed value of dwelling units (own, subdized) 45 Rent of machinery, storage, capital goods, animals, etc. 46 Land/plot rent 51 Saving (bank, saving, and credit co-operative; cash in hand 52 Loans for household consumption and repayments of loans made 53 Insurance (life and injury) 54 Fines and other legal damages 55 Convenance/inheritance 56 Sale of household fixed assets and personal goods 57 Lottery prizes, gambling and other prizes 58 Equbs (Ethiopian rotating saving and credit associations, RoSCAs) 61 Social security 62 Consumption of use of donation items from government /NGOs 63 Sale of donation items from government/NGOs 64 Donation in cash from government/NGOs 65 Remittances from local households and persons 66 Remittances from abroad 71 Alms, begging 72 Prostitution activities 73 Edir (traditional Ethiopian community organization)
74 Dowry 75 Gifts (wedding and other sources) 81 Free collection (firewood, water, from forest and other sources) 91 Other sources of non-consumption expenditure
Source: Based on the HCE Questionnaire (International Household Survey Network 2013) and authors’ summary.
3.2.1.5 Assessment of the HCE Survey
The HCE Survey has the following two advantages. First, it is both nationally and sub-nationally representative. Second, it has relatively detailed information on expenditures, which can be used to simulate some indirect taxes. It also has the following two limitations. First, it does not directly measure income and therefore may not be suitable to a simulation exercise on direct taxes. Second, it does not measure land size and therefore is not suitable for simulating changes in agricultural land use taxes. This is problematic because, in the Ethiopian context, land use tax is the main agricultural tax and it is charged based on the size of land holdings.
3.2.2 ESS
The CSA has conducted the ESS in collaboration with the World Bank Living Standards Measurement Study—Integrated Surveys on Agriculture (LSMS-ISA) team. The objective of the ESS is set out as collecting multi-topic panel structured household level data, with special focus on improving agricultural statistics and the link between agriculture and other household income activities. ESS is intended to be a long-term project and it is the first panel survey to be carried out by the CSA that links a multi-topic household questionnaire with detailed data on agriculture.
The first wave of the ESS was conducted in 2011/12 and the second wave was carried out in 2013/14. In the first wave, the ESS began as the Ethiopia Rural Socioeconomic Survey (ERSS) and covered only rural areas and small towns in Ethiopia. In the second round, the sample was

25
expanded to include all urban areas in addition to the rural areas and small towns covered in the first wave, and thus the name of the survey was changed. However, as the data was designed to have a panel structure, the rural and small-town households in the second wave were the same as those in the first wave. As a result, so far, panel data is available on rural and small-town households only. When the next (third) wave of the ESS is completed (undertaken in 2015/16), panel data will be available on urban households as well.
3.2.2.1 Sample design of the ESS
We focus our discussion on the second wave of the ESS (2013/14) as it is the recent, more complete, and more relevant for the task at hand. As indicated above, for the rural and small-town sample, the second wave used the same sample design and households as the first wave.
Selection of rural and small-town households was based on a stratified two-stage sampling design. In the first stage, EAs were drawn from each stratum (region). Specifically, a certain quota of EAs was assigned to each region, and then these EAs were drawn from the sample frame using PPS. The sample frame used in this case was the AgSS. In the second stage, households were selected from each EA. Specifically, in rural areas a total of 12 households were selected from each EA. While 10 of the 12 were randomly selected from the pool of 30 households included in the AgSS, the remaining 2 households were randomly selected from those rural households in the EA that were not engaged in agriculture. In the small-town EAs, 12 households were selected randomly from the listing of each EA, with no stratification as to whether the household is engaged in agriculture/livestock.
Similarly, the urban sample was selected following a multi-stage clustered design. In the second stage of selection, 15 households were randomly selected from each of the mid- and large-size town EAs. In Table 6 we present the distribution of EAs across the different regions of Ethiopia.
Table 6: Ethiopia Socioeconomic Survey (ESS) sample enumeration areas (EAs, in 2013/14)
All EAs Rural EAs Small-town EAs
Urban EAs
National 433 290 43 100 Regions
Tigray 49 30 4 15 Afar 13 10 2 1 Amhara 86 61 10 15 Oromiya 85 55 10 20 Somali region 26 20 3 3 Benishangul-Gumuz 11 10 1 0 SNNPR 99 74 10 15 Gambela 12 10 1 1 Harari 14 10 1 3 Dire Dawa 18 10 1 7 Addis Ababa 20 NA NA 20
Source: Based on the ESS Wave Two Basic Information Document (CSA and LSMS-ISA 2015a) and authors’ summary.
3.2.2.2 Coverage, representativeness, and non-response rate of the ESS
Expanding the first wave of the ESS, the second wave conducted in 2013/14 covered rural areas, small towns, as well as urban areas. Specifically, the survey covered all areas of Ethiopia except three zones of Afar and six zones of the Somalia region. So far the data has been collected twice and the intention is to conduct the survey every two years, keeping its panel structure intact.

26
Regarding the representativeness of the survey, the inclusion of the urban population in the sample makes the ESS nationally representative. Its sub-national representativeness, on the other hand, depends on the size of the region in question. The reason for this heterogeneity in representativeness across regions is due to imposition of a quota. The number of EAs in each region is set in such a way that it is possible to draw a certain minimum number of households from each EA. Thus, imposition of the quota makes it difficult to include enough number of EAs from the smaller regions. As a result, the data is only representative for the four most populous regions (Amhara, Oromiya, SNNPR, and Tigray). For the smaller regions the data is representative only for the combination of all of them, as ‘other regions’.
In small towns, a total of 3969 households were interviewed in the first wave with a response rate of 99 per cent. Of these, the second wave of the survey successfully re-interviewed 3776 households. This implies a panel attrition rate of 5 per cent, or successful follow-up rate of 95 per cent. In urban areas, a total of 1486 households were interviewed (in the second wave) with a 99 per cent response rate.
3.2.2.3 Survey administration, data management and data use of the ESS
In terms of conducting the survey, the census enumerators were trained to relay the questions written in English to the local language of the respondents for ease of understanding. Once survey data was collected and cleaned, it was labelled in English and distributed to stakeholders with metadata.10
The survey consisted of five questionnaires: one household questionnaire, three agriculture questionnaires, and one community questionnaire. The same five questionnaires were used in both the first and the second waves of the survey, except for some minor revisions made based on the results of the first round. The household questionnaire was administered to all households in the sample. The community questionnaire was administered to a group of community members to collect information on the socioeconomic indicators of the EAs where the sample households reside. The three agriculture questionnaires, post-planting, post-harvest, and livestock, were administered to all households engaged in agricultural activities.
These questionnaires were filled over three rounds of visits to households. The first round, carried out during September–October 2013, was used to collect information on post-planting agricultural activities. The second round, conducted during November–December 2013, was used to collect information on ownership, production, and utilization of livestock and on livestock by-products. The third round, which took place during February–April 2014, was used to collect information on post-harvest agriculture and fill in the household and community questionnaires.
3.2.2.4 Information content of the ESS
In this section, we discuss the information gathered through all five ESS questionnaires, and assess the usefulness of the data for microsimulation. The three categories of ESS questionnaires aimed to collect the following information:
10 The CSA makes this data readily available for interested researchers. Our search for academic publications using
this data has revealed that it is not yet used by many studies, especially the second wave of the ESS. This may be because it has been made available only recently (in 2015) and it may reflect the fact that researchers are waiting for the panel data structure to form. Studies referring to the first round of the survey are available at: http://catalog.ihsn.org/index.php/catalog/5229/related_citations (accessed 13 November 2015).

27
The household questionnaire: This collected information on basic demographics, education, health (including anthropometric measurement for children), labour and time use, partial food and non-food expenditures, household non-farm income-generating activities, food security and shocks, safety nets, housing conditions, assets, credit, and other sources of household income.
The three agriculture questionnaires: The post-planting and post-harvest questionnaires focused on farming activities and collected information on land ownership and use, farm labour, inputs use, land area measurements and coordinates of household fields using the Global Positioning System; agricultural capital, irrigation, and crop harvest and utilization. The livestock questionnaire collected information on animal holdings, costs, and production, and the costs and sales of livestock by-products.
The community questionnaire: The community questionnaire gathered information on infrastructure, community organizations, resource management, changes in the community, key events, community needs, actions, and achievements, and local retail price information.
(i) Demographic characteristics: The ESS collected the following information on all individual members of households:
Name of the individual
Sex of the individual
Age of the individual
Marital status of the individual (if ten years and older)
Whether the spouse lives in the household
Name of the father and the mother of each individual and their respective educational attainments, and the occupation of the mother and/or the father
Whether the mother and/or the father lives in the household
Residence status of each household member; specifically, information is collected on whether any member of the household has emigrated away, to where and why, whether the emigrant has found work, what kind of work (industry), and who facilitated the emigration (in terms of information and material support).
(ii) Education: For each household member, the survey collected the following information about the status of education as well as costs incurred and benefits received in relation to each household’s schooling decisions for its members:
Whether the individual can read and write in any language
Whether the individual has ever attended school and the highest grade s/he has completed
Whether the individual is currently attending school; if so, what grade; if not, the reason for not attending (had enough schooling, awaiting admission, no school/lack of teachers, no time/no interest, lack of money, marital obligation, sickness, disability, separation of parents, death of parents, too old to attend, domestic obligation, others)
Whether the individual has missed school for more than a week last semester; if so, the reason for missing school
Means of transport used to got to school and the time it takes for him/her to travel
Whether the individual has received any scholarship or assistance to attend school from any organization or the government or any individual other than a household; for the current school year, the value of this assistance, including the value of assistance in kind

28
Household expenditure on the individual’s school fees for the current school year
Household expenditure on books, uniforms, stationery, etc. for the last 12 months
Whether the individual intends to attend school next year.
(iii) Health: The survey gathered information on prevalence of illness, disability, and health-care facility utilization (consultation for health and type of facility visited given individual’s constraints). In addition, detailed child anthropometric measures were taken to understand the malnutrition status of children below five years of age. Health-related information was collected by asking the following questions:
Has the individual faced any health problem during the last two months?
What was the sickness/injury the individual faced (malaria, diarrhoea, or injury; dental, ophthalmic, or skin disease; ear/nose/throat, tuberculosis)?
For how many days was the individual absent from usual activity owing to the health problem during the last two months?
Has the individual received medical assistance or consulted health institutions or traditional healers during the last 2 months/last 12 months? If so, how many times?
Where did the individual receive or consult medical assistance primarily (hospital, health centre, health post, clinics, pharmacy, traditional healer, religious/spiritual, other)?
What was the main reason for the individual not to consult health institutions/traditional healers during the last two months (lack of money, expensive, too far, no belief in medicine, lack of health professional, poor-quality service, did not require medical assistance, other)?
Has the individual or the household received any assistance free of charge for the long-term illness? If so, from which of the following sources (government, NGO, HIV/AIDS-related, social (community) association, traditional/religious providers, other)?
(iv) Labour market information, time use, and earnings: The survey obtained data on these aspects through extensive questions, as detailed in this section.
(a) Time use: Information was collected on how each member of the household allocates his/her labour. Specifically, the survey gathered information on how much time (in minutes or hours) each member of a household spends on different types of activities (see Table 7 for details).

29
Table 7: ERSS/ESS time use data
Activity type Activity detail Reference period Time unit
Fetching water and fuel wood
Time spent on fetching water or collecting fuel wood
One day to the day before the interview date
Minutes
Agriculture work Time spent on all agricultural activities (farming, livestock, fishing, etc.) for household consumption or sale
7 days preceding the survey date
Hours
Non-farm enterprise work Non-agricultural, non-fishing household business for the individual member or for the household
7 days preceding the survey date
Hours
Casual part-time/temporary work
Time spent on any casual, part-time, or temporary work
7 days preceding the survey date
Hours
Work for a wage, salary, or commission
Any work for a wage, salary, or commission, or any payment in kind, excluding temporary work
7 days preceding the survey date
Hours
Apprenticeship/unpaid work Unpaid or apprenticeship type of work 7 days preceding the survey date
Hours
Source: Based on the ESS Questionnaire (CSA and LSMS-ISA 2015b) and authors’ summary.
(b) Employment status and earnings: Information was gathered about an individual’s primary and secondary jobs. The following questions were explored to collect data on job market participation of each member of the household.
At any time over the last 12 months has the individual been employed in any kind of job, including part-time labour, for a wage, salary, or commission or any payment in kind, for anyone who is not a member of the household? If so, what has been the main job of the individual over the last 12 months? What type of business (trade) is the main job connected with?
Who is the employer for the individual’s main occupation (private company, private individual, government, state-owned enterprise (parasternal), public works programme, church/religious organization, political party, other)?
During these months, on average approximately how many weeks per month has the individual worked at this job? During these weeks, on average approximately how many hours per week has the individual worked at this job? How much was the individual’s last payment for wages/salary? What period of time did this last payment cover (hour, day, week, fortnight, month, quarter of a year, half a year, a year)?
How much does the individual usually receive in allowances or gratuities, including payments in kind such as uniform (clothes/shoes), housing, food, and transport that were not included in the salary just reported?
Over what period of time has the individual been reporting allowances and gratuity payments (hour, day, week, fortnight, month, quarter of a year, half a year, a year)?
Additional information regarding participation in the PSNP, part-time work, and unpaid work were also collected in the survey.
(c) Self-employment and earnings: The survey also collected information on job market characteristics of self-employed individuals (non-farm enterprise) in two steps. In the first step, households were asked whether anybody in the household participates in non-farm enterprises (i.e. self-employment in non-agricultural activities). In relation to this, households were asked the following detailed questions:

30
Has anyone in the household owned a non-agricultural business or provided a non-agricultural service from home or a household-owned shop, as a carwash owner, metal worker, mechanic, carpenter, tailor, barber, etc.?
Has anyone in the household processed and sold any agricultural by-products, including flour, local beer (tella), areke, enjera, seed, etc., but excluding livestock by-products, fresh/processed fish?
Has anyone in the household owned a trading business on a street or in a market?
Has anyone in the household offered any service or sold anything on a street or in a market, including firewood, home-made charcoal, construction timber, wood poles, traditional medicine, mats, bricks, cane furniture, weave baskets, thatch grass, etc.?
Has anyone in the household driven a household-owned taxi or pick-up truck to provide transportation or moving services?
Has anyone in the household owned a hotel, bar, or restaurant?
Has anyone in the household owned any other non-agricultural business, even if it is a small business run from home or on a street?
In the second step, once it was ascertained that someone in the household was engaged in self-employment activity/activities, the following questions were asked to get information on the income generated through these activities:
List all income-generating enterprises individuals in this household have operated in/over the last 12 months.
Operation centre: Where does this enterprise operate primarily (home: inside/outside residence, traditional market, shop in commercial area, roadside, mobile: river/lakes/ponds, construction sites, other)?
Ownership: Who owns/owned this enterprise in the household and who in the household makes decisions regarding the earnings from this enterprise?
Startup capital: What were the two main sources of start-up capital for this enterprise (agricultural income, non-farm self-employment income, wage or salary income, remittances, sale of assets, bank or co-operative loan, family or friends located in this community, private moneylenders, micro credit and savings institutions, other)?
Credit: In the last 12 months, did you try to get credit for the enterprise? Did you eventually get the credit from these institutions? If so, which sources did you get it from (loan from bank: commercial/micro finance/credit union, moneylender, other loans, co-operative/trade associations, relatives/friends)?
Borrowing from the enterprise: In the last 12 months, how much have you borrowed for this enterprise?
Debt servicing: In the last 12 months, did the enterprise have any loans that it was repaying (in cash or kind)? In the last 12 months, what is the amount repaid on loans for the enterprise?
Customers: To whom does/did this enterprise mostly sell its products?
Seasonality: Are the activities of this enterprise seasonal? If so, during the last 12 months of operation, how many months was this enterprise active? In which months was enterprise activity highest? In the months of operation, what is the average number of days per month in which the enterprise operates? How many hired workers did the enterprise employ in the months of operation?
Household participation: Which household members have worked in this enterprise in the last 12 months?

31
Earnings and contribution to the pool of household income: During the months the enterprise was operating in the last 12 months, what were the average monthly sales? In the same period, what were average monthly operating costs (including stocks and hired labour)? Over the last 12 months, what share of total household cash income has come from this enterprise (almost none, about 25 per cent, about half, about 75 per cent, almost all)?
Constraints for growth or operation: What are the constraints preventing the household from establishing an enterprise or growing already existing ones? (Households could choose constraints from a list that included access, quality, and cost of the following items: electricity, telecommunication, water, postal services, transportation, financial services, markets, government, safety, technology, registration and permits, taxation, other.)
(v) Agricultural income and production: Whereas information on incomes from non-farm activities (employment and enterprise) for both rural and urban households was obtained through questions in the household questionnaire, the three agriculture questionnaires, on the other hand, focused on gathering information about farming activities and income from agricultural and related activities. Specifically, the following questions were asked:
What type of crop has been planted (list of crops)?
How much of the household’s land is planted with each crop?
How much harvest is cultivated of each crop from each land (gross and net)?
When (months) did harvest begin and end?
How much of each of the harvested crop is sold in the market? What is the total value of all crop sales?
When were the crops sold?
How much of each of the harvested crops during the current agriculture season is used for household consumption?
How much of each of the harvested crops during the current agriculture season is given out as gifts or reimbursements for land, labour?
How much of each of the harvested crops during the current agriculture season is given out as reimbursements for inputs borrowed or acquired on credit?
How much of each of the harvested crops during the current agriculture season was used, or will be used, for animal feed?
How much of each of the harvested crops during the current agriculture season was saved for seed?
How much of each of the harvested crops during the current agriculture season was lost to rotting, insects, rodents, theft, etc. in the post-harvest period?
How much of each of the harvested crops is saved in storage?
(vi) Other income, including assistance from government and NGOs: In addition to information on employment activity and earnings from non-farm employment, non-farm enterprises, and agriculture, the survey also accumulated information about other sources of income (see Table 8). Specifically, it asked for details of the following:
Whether any member of the household has received income from the list of other sources in the last 12 months
How much total income from each source has been received by the household during the last 12 months

32
Who in the household keeps/decides what to do with the money from other income
How much of the money from each source has come from rural/urban/international locations.
Table 8: List of potential other sources of income
Transfers in:
Cash
Food
Non-food (in kind) Rental income from:
Land
Shop, store, house, car, truck, other vehicle
Transport animals
Agricultural tools Pension and investment income from:
Interest or other investment income
Pension income Revenue from sales of:
Real estate
Household non-agricultural assets
Household agricultural/fishing assets Other income from:
Inheritance, lottery, gambling winnings
Source: Based on the ESS Questionnaire (CSA and LSMS-ISA 2015b) and authors’ summary.
In addition to the income sources listed in Table 8, the survey also collected information on the amount of income each household receives in the form of assistance from government and non-government agencies. Table 9 lists types of assistances, potential sources, and types of information collected in relation to each source.
Table 9: Assistance sources and associated information
Assistance source Information about each source
PSNP (excluding PSNP labour activities) Did you or members of your household receive any assistance in the last 12 months from the government or a non-governmental institution (such as church, mosque)?
Free food What is the name of the organization/programme that provided this assistance (government, international NGO, local NGO, other)?
Food-for-work programme or cash-for-work programme
How much cash did your household receive from this organization in the last 12 months?
Inputs for agricultural work programme What was the value of food the household received from this organization in the last 12 months?
Any other assistance (not listed) What was the value of any other assistance received in kind in the last 12 months? Was this aid given to the entire household or given to specific persons in the household? Which members of the household participated in this programme?
Source: Based on the ESS Questionnaire (CSA and LSMS-ISA 2015b) and authors’ summary.
(vii) Housing and other assets: The survey collected data on the ownership of housing and related assets. In addition, information on structure and facilities of the asset owned by the household was collected, including information about access to water, electricity, and fuel/energy for cooking.

33
(viii) Consumption expenditures, food security, and shocks: The survey gathered information on the following three categories of expenditures: food, food aggregates, and non-food items. Tables 10 and 11 present details of information collected for these categories.
Table 10: Main components of household consumption expenditures
Expenditure category Reference period Questions about each expenditure category
Food 1 (past 7 days) Did the household consume any of the items? If so, how much quantity?
Food aggregates 1 (past 7 days) How much is from purchase? Non-food expenditure 2 (past 12 days and past 1 month) How much is from own
production? From gifts and other sources?
Source: Based on the ESS Questionnaire (CSA and LSMS-ISA 2015b) and authors’ summary.
Table 11: Items included in household consumption expenditure categories
Food Food aggregate Non-food items
Cereals (teff, wheat, barley, sorghum, millet)
Pulses (horse beans, chick pea, lentils, haricot beans)
Oil seeds (niger seed, linseed)
Vegetables and fruits (onion, banana, relish, and leaves)
Tubers and stems (potato, kocho, bula)
Others (meat, milk, cheese, eggs, sugar, salt)
Stimulants (coffee, chat/khat)
Beans, lentils, nuts
Enjera (teff)
Other cereal (rice, sorghum, millet, wheat bread, etc.)
Pasta, macaroni, and biscuits
Sugar or sugar products (honey, jam)
Beef, sheep, goat, or other red meat and pork
Poultry
Eggs
Fish
Oils/fats/butter
Milk/yoghurt/cheese/other dairy (excluding butter)
Personal care (laundry soap, body soap, other)
Matches, batteries, candles (tua’af), incense
Energy (charcoal, firewood, kerosene)
Cigarettes, tobacco, suret, gaya
Transport, house rent
Clothing and shoes (for men, women, boys, and girls)
Kitchen equipment (cooking pots, etc.)
Linens (sheets, towels, blankets)
Household items (furniture, lamp/torch)
Taxes and levies
Donations to the churches and mosques
Ceremonial expenses
Contributions to iddir
Source: Based on the ESS Questionnaire (CSA and LSMS-ISA 2015b) and authors’ summary.
3.2.2.5 Comparitive assessment of the ESS and the HCE Survey
The ESS has the following advantages in light of the data needs of the microsimulation task at hand. First, it integrates farm and non-farm-related incomes. In particular, the survey provides information on land holdings and production separately, which is important as agricultural land use taxes are based on land holdings. This is a clear advantage over the HCE Survey, which does not include information on land holdings. Second, the ESS provides detailed data on the different income sources. In general, by providing such clear and detailed information on the total incomes of surveyed households the ESS enables the simulation of most types of direct taxes.
The ESS also has its own limitations. First, the sample size is much smaller than that of the HCE Survey and is not as representative, especially at a sub-national level. Second, although the ESS contains data on both incomes and expenditures of households, the expenditure data is collected only for selected major items. On the other hand, the HCE Survey provides expenditure data on

34
all items a household used in the survey period, which is important in simulating some consumption taxes. Hence, it can be concluded that ESS focuses more on income than on expenditure when compared to the HCE Survey. However, previous HICE surveys show that income data in developing countries like Ethiopia is usually underreported by survey respondents.
Table 12 provides a comparison of the major features of the two surveys.
Table 12: Comparison of selected parameters in ESS and the HICE/HCE Survey
Parameter ESS HICE/HCE
Survey period Every two years (two years’ data available) Every five years (four rounds of data available)
Survey type Panel Repeated cross-section Number of EAs and households
In 2013/14, 433 EAs and 5262 households covered by the survey
In 2010/11, 1968 EAs and 28,032 households covered (864 rural EAs and 1104 urban EAs, with 10,368 and 17,664 households respectively)
Representativeness National and regional (only for four regions) National and regional (for all regions) Expenditure Expenditure data collected for selected
items Expenditure data collected for all items used by the household in the period under study
Other income data Income data other than income from agriculture; agriculture income data available separately from agriculture questionnaire
No direct income data; indirect income information available from household expenditure data
Income data Income data collected No income data collected in 2010/11 as previous surveys revealed that households underreport their income
Objective To improve agricultural statistics and the link between agriculture and other household income activities
To collect household consumption and expenditure data of the nation
Source: Authors’ summary.
Based on the above discussion, we can conclude that the ESS is better suited for the microsimulation study. As the expenditure data in the ESS is not as detailed as in the HCE Survey, we propose using the HCE data to impute information on expenditures into the ESS data. In this way, we will be able to simulate some of the indirect taxes.
3.2.3 Other supplementary surveys: the AgSS
3.2.3.1 Sample design
The CSA has been collecting annual agriculture-related data for the last 15 years. The main objective of the AgSS is to collect basic quantitative information on the country’s agricultural activities. The AgSS is composed of four components: Crop Production Forecast Survey, Meher (Main) Season Post-Harvest Survey, Livestock Survey, and Belg Season Survey.
3.2.3.2 Representativeness and coverage
In order to select the sample, a stratified two-stage cluster sample design was implemented. EAs were taken to be the PSUs and the agricultural households were taken to be the SSUs. The report was compiled at national, regional, and zonal levels.
The report of the AgSS is based on private peasant holdings in rural sedentary areas of the country and part of companion reports on the performance of agriculture in the country. In addition to production and farm practice data, the AgSS also collected data on crop and livestock product utilization. Utilization was defined as the amount of agriculture produced and used for

35
own consumption, sale, seed, wages in kind, animal feed and other purposes. The data was collected by interviewing the holders. They were asked to quantify their yearly crop and livestock product utilization experience in percentage based on common practice.
4 Assessment of tax–benefit simulation feasibility
We present in Table 13 a summary of our assessment on the feasibility of simulating each tax–benefit instrument, with a brief explanation when it is the case as to why it is not feasible to fully simulate the instrument. To this end, we have taken into account the tax–benefit rules described in Section 2 and the survey microdata we have at hand as discussed in Section 3. Regarding the microdata, we intend to use the HCE Survey data to impute information on expenditures into the ESS data.
Recommendation
The advantages of this data are that it contains a large sample of households and therefore its measurements are more precise. It is representative at a sub-national level, and contains a great deal of information about agriculture such as annual production, number of livestock, input cost, as well as utilization of the produced good (consumed, sold, or used for other purposes). The disadvantages, in light of the needs of microsimulation studies, are that the data is entirely based on rural (farm) households, it does not contain information on non-farm income, and not much demographic information is included.

36
Table 13: Summary of recommendations regarding the feasibility of simulation
Instrument Simulation feasibility
Why it is not feasible to fully simulate?
Direct taxes
Employment income tax
S
Business profit tax S
Tax on income from rental of buildings
IA Not included separately; rental incomes from different sources are entered together, and the tax rate on income from these sources is different
Capital gains tax (tax on gain of transfer of certain investment property)
IA No data on capital gains
Tax on interest income on deposits
IA Not included separately; it is aggregated with other investment income
Dividend income tax IA Not included separately; it is aggregated with other investment income Tax on income from
rental of property IA Not included separately; rental incomes from different sources are
entered together, and the tax rate on income from these sources is different
Agricultural land use tax
S It can be potentially simulated as information is available on land size; however, the rate has to be collected from each region
Pension contributions S
Indirect Taxes
Customs duty E No information on the origin of expenditure items; it is not known whether the consumption items are imported or locally produced
Import surtax PS A 10 per cent surtax is imposed on all but few exempted imported goods, with the strong assumption that prices of all (potentially) imported goods include a surtax
Value-added tax (VAT)
PS It can be roughly simulated using detailed household expenditure data, with the assumption that all purchases (even from non-VAT-registered sellers) are implicitly VAT inclusive; however, given the level of disaggregation in the HCE Survey data, it is not possible to fully simulate this tax
Turnover tax (TOT) PS With the assumption that TOT is in principle equivalent to VAT, even non-VAT-registered sellers have to pay a non-deductible VAT for their inputs
Excise tax PS Possible to simulate for some items, but difficult for items that are chargeable at different rates even within a narrow category (e.g. no single excise tax rate on alcoholic beverages)
Social benefits
Pension I Although income from pension is separately recorded, no information is available on work (contribution) history of individuals
Sick leave E No information on leave in the data Maternity leave PS No specific information on the number of paid maternity leave days
taken by the mother; however, information available on the age of each member, relationship to the head, as well as whether the mother works and where. The maximum allowed paid maternity leave (90 days) is assumed to be taken, although in some cases the mother may take fewer than 90 days for some reason
Injury leave E No information on leave in the data
Transfer payments S
Notes: ‘E’: should be excluded from the model as it is not included in the microdata nor can it be simulated; ‘I’: included in the microdata but cannot be simulated; ‘IA’: included in the microdata in an aggregated variable but not simulated; ‘PS’: can be partially simulated as some of its relevant rules are not simulated; ‘S’: can be simulated although some minor or very specific rules may not be simulated.
Source: Authors’ summary.

37
5 Potential partners
To the best of our knowledge, so far, there has not been any effort to build tax–benefit microsimulation models for Ethiopia. As a result, most tax reform efforts are devoid of vital information about the distributional and revenue impacts of changes to the tax code. Therefore, in our opinion, the current effort is a welcome development from the perspective of policy-makers and academics in the country.
The dearth of attempts to build microsimulations models is a reflection of the general neglect of the tax system by academics in the country. Recently, however, several high-quality studies on taxation in general are emerging, mostly conducted by researchers based at the Ethiopian Development Research Institute (EDRI) or affiliated to the institution. As such, researchers and affiliates of EDRI are well-suited for potential partnerships.
MoFED is tasked with designing and monitoring the fiscal system of the country. Given the relevance of the microsimulation exercise in forecasting the revenue and distributional impacts of tax and benefit legislations, MoFED is a natural partner for representing policy-makers. Partnering with ERCA will also be helpful.
6 Long-term future
The microsimulation model in Ethiopia can be used for formulating informed tax and social benefit systems, including safety net programmes, and evaluating impacts of such reforms and programmes on government revenue, income inequality, and poverty reduction. In our view, EDRI, as a semi-autonomous government research institute established with the main objective of conducting economic policy research, will be interested in taking responsibility in the long term. Researchers at EDRI can take responsibility for updating the policies and input datasets as deemed necessary, and use the model to study impacts of actual or hypothetical policy changes. Also, EDRI should work in close contact, with constant feedback, with the fiscal department of MoFED and/or the research department of ERCA. As policy-makers in the tax–benefit system of the country, these two institutions should also have a stake in the model’s long-term future.
Once the microsimulation model is built, any of these three institutions, jointly or independently, should be able to secure the necessary funding from the country’s development partners. In view of the emphasis given to domestic resource mobilization, in the upcoming financing-for-development component of the post-2015 agenda, it is easy to imagine that resources needed to update the model will be readily available.
References
CSA and LSMS-ISA (Central Statistical Agency and Living Standards Measurement Study— Integrated Surveys on Agriculture) (2015a). ‘Ethiopia Socioeconomic Survey (ESS) Wave Two (2013/2014): Basic Information Document’. Addis Ababa and Washington, DC: CSA and World Bank. Available at: http://siteresources.worldbank.org/INTLSMS/Resources/3358986-1233781970982/5800988-1367841456879/9170025-1427144247562/Basic_Information_Document_Wave_2.pdf (accessed 13 November 2015).
CSA and LSMS-ISA (Central Statistical Agency and Living Standards Measurement Study— Integrated Surveys on Agriculture) (2015b). ‘Ethiopia Socioeconomic Survey (ESS) (2013–

38
2014)’ [ESS Questionnaires]. Addis Ababa and Washington, DC: CSA and World Bank. Available at: http://microdata.worldbank.org/index.php/catalog/2247 (accessed 13 November 2015).
Ethiopian Legal Brief: A Blog about Ethiopian Law (2011– ). ‘Federal Laws’ [Federal Laws Year Index, Council of Minsiter Regulations, Codes, Directives, Constitutions, and Revised Constitutions of Regional States]. Federal Negarit Gazeta (several issues). Available at: http://chilot.me/federal-laws/ (accessed 10 November 2015).
Ethiopian Revenue and Customs Authority (ERCA) (No date). ‘Imports and Taxes in Ethiopia’. Available at: http://www.erca.gov.et/images/Documents/Customs/Import_Export_Procedure/452.pdf (accessed 13 November 2015).
International Household Survey Network (2013). ‘Ethiopia: Household Consumption Expenditure Survey 2010–11’ [Documentation: Questionnaires, Reports, and Other Materials]. Ethiopia: Central Statistical Agency. Available at: http://catalog.ihsn.org/index.php/catalog/3123 (accessed 13 November 2015).
Jebessa, Jira, Fantahun Melles, Dieter Gagel, and Gerhard Quincke (eds) (2005). Taxation in Ethiopia: Direct and Indirect Taxes, Categories of Tax Payers, Declaration of Income and Assessment of Taxes and Tax Incentives. Addis Ababa, Ethiopia: Ethiopian Chamber of Commerce, Ethiopian Business Development Services Network (EBDSN), Chamber of Crafts HWK Rhein-Main, and German Technical Cooperation.
Ministry of Agriculture and Rural Development (2006). ‘Productive Safety Net Programme: Programme Implementation Manual’. Addis Ababa, Ethiopia: Ministry of Agriculture and Rural Development. Available at: http://www.cangoethiopia.org/assets/docs/Revised_Ethiopia_Safety_Net_PIM_July_2006.pdf (accessed 13 November 2015).
Ministry of Agriculture and Rural Development (2010), ‘Productive Safety Net Programme: Programme Implementation Manual (Revised)’. Addis Ababa, Ethiopia: Ministry of Agriculture and Rural Development. Available at: http://www.slmethiopia.info.et/attachments/article/4/PIM%20revised%20June%202010.pdf (accessed 13 November 2015).
Ministry of Finance and Economic Development (2005–14). ‘Ethiopia Fiscal Guide’ (several issues). Available at: http://www.mofed.gov.et/English/Pages/Home.aspx (accessed 13 November 2015).
Ministry of Finance and Economic Development (2014). ‘Ethiopia Fiscal Guide, 2013/2014’. East Africa: KPMG. Available at: https://www.kpmg.com/Africa/en/KPMG-in-Africa/Documents/2014%20Fiscal%20Guides/Fiscal%20Guide%20Ethiopia.pdf (accessed 13 November 2015).