wide field instrument detector technology – milestone … · wide field instrument detector...
TRANSCRIPT

Wide Field Instrument Detector Technology – Milestone #4 Review
September 22, 2016
1
2
√
√
√
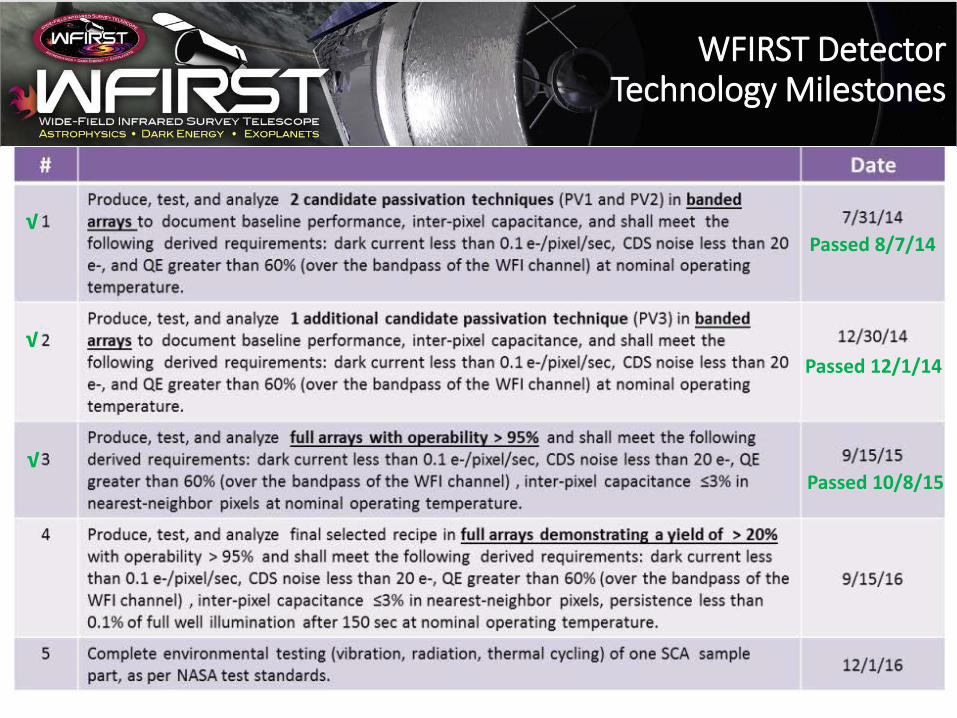
Passed 8/7/14
Passed 12/1/14
Passed 10/8/15
WFIRST Detector Technology Milestones

Previous Milestones
• For DTAC Milestones 1 & 2, the WFIRST project developed a 10µm pixel design with satisfactory performance for each of two passivation techniques (PV2A and PV3).
• The same pixel design was found to be the best performer for both passivations.
• Milestone 3 demonstrated that the selected WFIRST pixel design can be scaled up to produce high performance 4k x 4k arrays, again for both passivation types.
• Both passivation types have been carried forward• YDL1 = PV2A• YDL2 = PV3
3
Use of PV3 Full-Array Lot for Milestone #4
• When the WFIRST detector development effort was initiated in 2012-13 timeframe, the PV2A passivation technique was more mature and hence the PV2A full-array and Yield Demonstration Lots (YDLs) were produced first.
• However, since then, TIS has made excellent progress on the PV3 design and the full-array PV3 persistence results are significantly better than for PV2A, while other aspects of performance are similar.
• The design of the PV3 full-array lot is thus expected to be much closer to the final flight design than the PV2A YDL.
• We have therefore decided that demonstrating Milestone 4 with the PV3 full-array lot is more appropriate than waiting for the completion of the PV2A YDL.
4

Deciding on a Final Design for Flight
• We currently plan to initiate the contract for the WFIRST flight detectors with Teledyne in Oct. 2017.
• The YDLs for both the PV2A and PV3 designs will be complete by that date.
• The final decision on the design to be carried forward for flight will be made by the Project, with input from the WFIRST Formulation Science Working Group
• While we are presenting Milestone #4 detector data for only the PV3 design here, if the PV2A design is ultimately selected, a necessary condition will be a demonstration of satisfactory performance from the PV2A YDL.
5

Testing Approach for Milestone #4
• Testing and analysis approaches for Milestone #4 match closely with the previous Milestones and results are presented in the same manner; plots, figures and images are directly comparable
• Disconnected pixels measured using shifted DSUB voltage at room temperature
• Dark Current measured with 2-hour sample-up-the-ramp exposures• CDS noise measured using 100 kHz effective readout speed• Crosstalk measured using 55Fe and hot pixels• Quantum efficiency measured in the same test setup (or linked to
the test setup using a reference detector)• Persistence is formally included for the first time in Milestone
#4 (detailed persistence acquisition and analysis information in later slides)
• The presentation of results will begin with persistence and then follow the same order as previous Milestones: disconnected pixels, dark current, CDS noise, QE, crosstalk
6

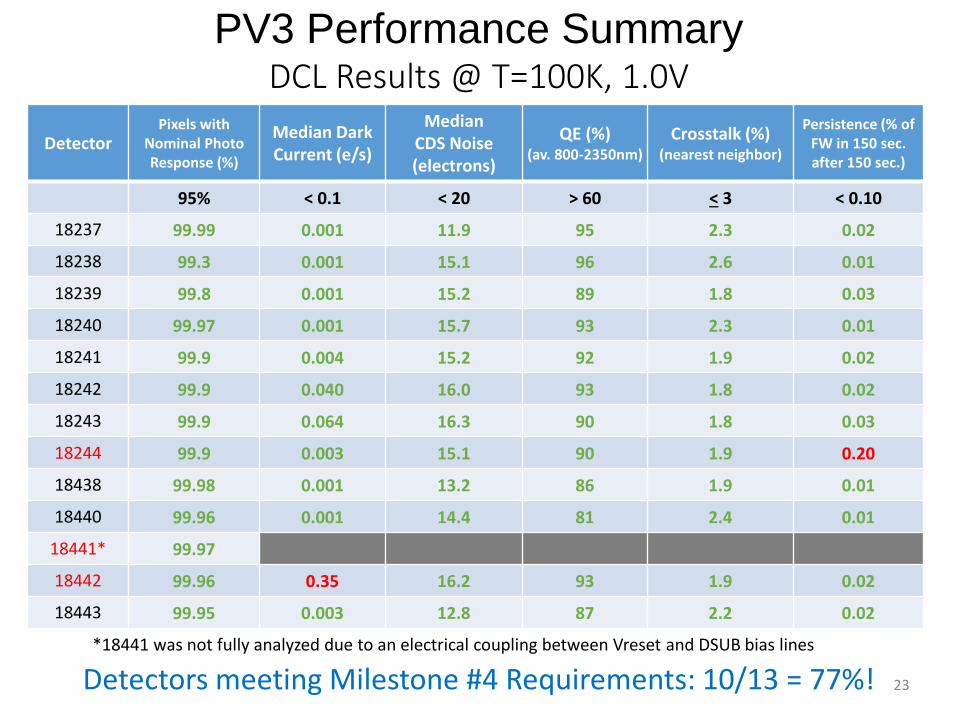
Detectors meeting Milestone #4 Requirements: 10/13 = 77%! 7
PV3 Performance SummaryDCL Results @ T=100K, 1.0V
DetectorPixels with
Nominal Photo Response (%)
Median Dark Current (e/s)
MedianCDS Noise(electrons)
QE (%)(av. 800-2350nm)
Crosstalk (%) (nearest neighbor)
Persistence (% of FW in 150 sec. after 150 sec.)
95% < 0.1 < 20 > 60 < 3 < 0.10
18237 99.99 0.001 11.9 95 2.3 0.02
18238 99.3 0.001 15.1 96 2.6 0.01
18239 99.8 0.001 15.2 89 1.8 0.03
18240 99.97 0.001 15.7 93 2.3 0.01
18241 99.9 0.004 15.2 92 1.9 0.02
18242 99.9 0.040 16.0 93 1.8 0.02
18243 99.9 0.064 16.3 90 1.8 0.03
18244 99.9 0.003 15.1 90 1.9 0.20
18438 99.98 0.001 13.2 86 1.9 0.01
18440 99.96 0.001 14.4 81 2.4 0.01
18441* 99.97
18442 99.96 0.35 16.2 93 1.9 0.02
18443 99.95 0.003 12.8 87 2.2 0.02
*18441 was not fully analyzed due to an electrical coupling between Vreset and DSUB bias lines

8
Persistence Requirement in DetailRequirement: “...persistence less than 0.1% of full well illumination after 150 sec at nominal operating temperature.”
We interpret the requirement as follows• Expose the detector to an illumination level > full well• Wait 150 seconds after the detector has been reset following the
exposure to full well• Measure persistence in the next 150 seconds (from 150 to 300 seconds
after detector reset)• Integrate the detector dark current during this 150 second interval• Subtract baseline dark current per pixel and calculate persistence using
median value per array• Compare the excess dark current to 0.1% of detector full well
• > 0.1% = FAIL, < 0.1% = PASS

Persistence Acquisition Summary
• Measured at 100K, 1.0V, 1400nm illumination• Persistence measurements were made at an illumination
level of 800,000e- for each detector (~8 x FW)• 10-minute sample-up-the-ramp exposures with 11 total
frames were used to measure persistence (1 frame per minute)
0 600 602 1202 1204 1804 CLOCK TIME (s)
RESE
T
RESE
T
11 x READ (600s) 11 x READ (600s)
440 540800,000 e-
illumination
11 x READ (600s)
0 150 300 TIME AFTER ILLUMINATION (s)
9

10
Persistence Analysis Summary
• Full well (FW) has been measured for multiple detectors and has been found to be ~100,000e-. For simplicity, the analysis has been performed using a full well of 100,000e- for all detectors.
• MS4 requirement = 0.1% of FW 100 e-• Even though persistence measurements were made at 8 x FW for each
detector, the limit was held to an integrated signal of 100 e- (0.1% of 1 x FW)• A power law fit was integrated to determine total charge accumulation in 150
seconds (sample plot shown on next slide) • Image scale: linear [0,0.1%] of FW

Persistence Analysis
11
In the sample plot below (log-log scale), the integrated signal (green area) under a power law fit (red line) results in accumulation of 100 e- between 150 and 300 seconds after detector reset.

Persistence Summary at 100K, 1.0V18237
18238
18239
18240 18241 18242 18243
18438
18440
18443
12
Note: HST WFC3 would be at ~0.4% on this scale

Connected Pixel Summary(orange pixel = disconnected)
Detector Connected
18237 99.99%18238 99.3%18239 99.8%18240 99.97%18241 99.9%18242 99.9%18243 99.9%18438 99.98%18440 99.96%18443 99.95%
18238
18237
18239
18240 18241 18242 18243
18438
18440
18443
13

Dark Current Summary
• Uncertainty: 0.003 e-/s• Results obtained by averaging dark per pixel from multiple 2-hour dark files• All plotted dark current numbers are median values.• Images are in log scale [black = 0.001 e-/s, white = 0.1 e-/s]
14
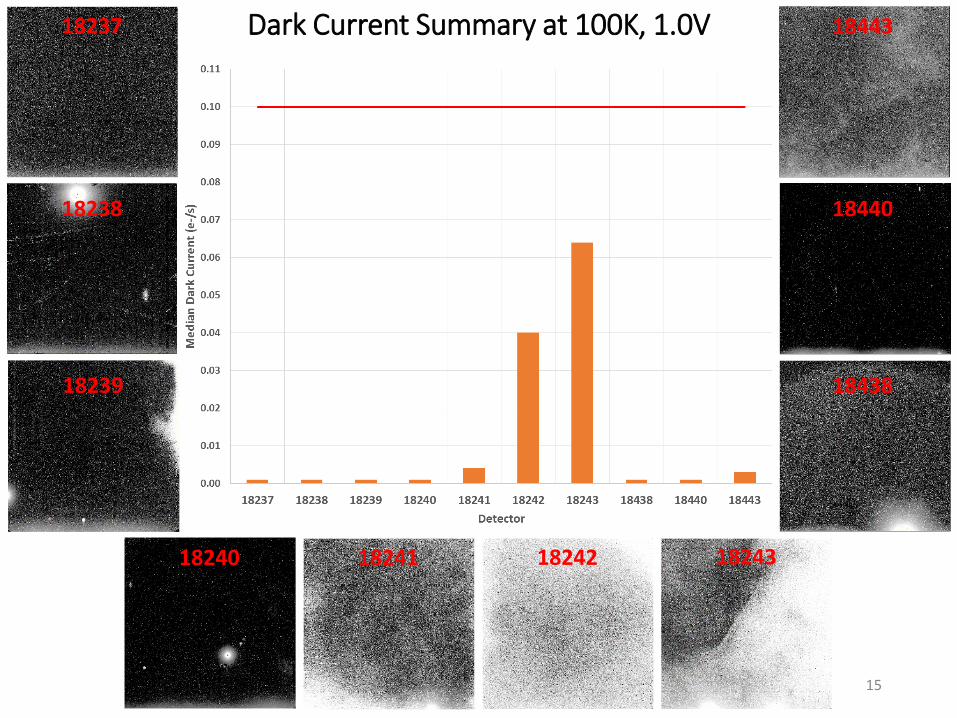
Dark Current Summary at 100K, 1.0V
15
18237
18238
18239
18240 18241 18242 18243
18438
18440
18443

CDS Noise Summary
• All plotted CDS noise numbers are median values• Images are in linear scale: Black=5, White=35 e-
16

CDS Noise Summary at 100K, 1.0V18237
18238
18239
18240 18241 18242 18243
18438
18440
18443
17
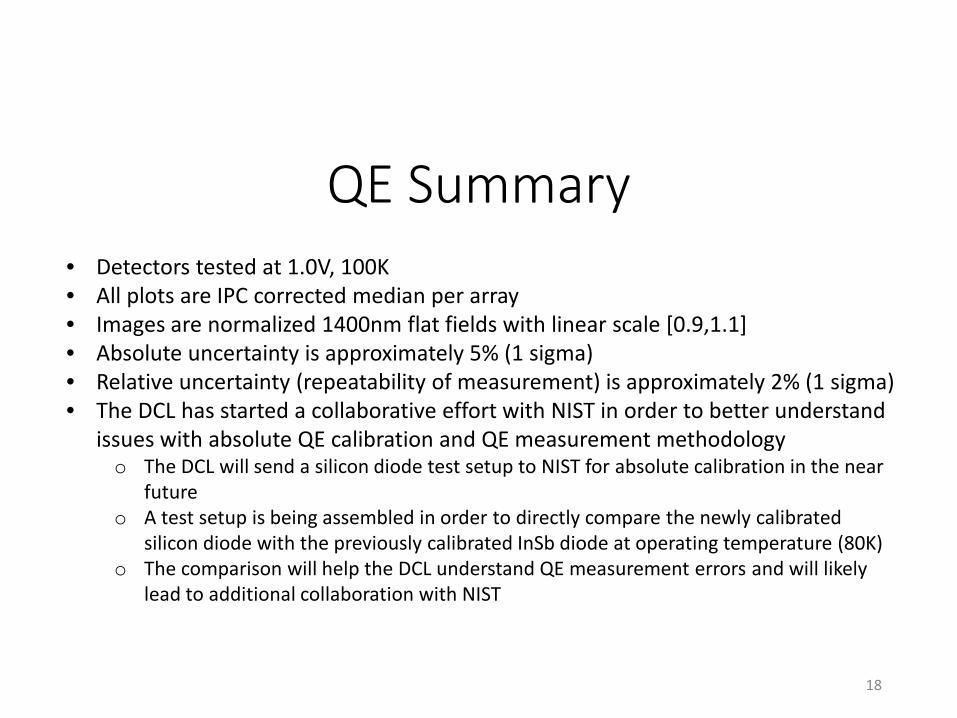
QE Summary• Detectors tested at 1.0V, 100K• All plots are IPC corrected median per array• Images are normalized 1400nm flat fields with linear scale [0.9,1.1]• Absolute uncertainty is approximately 5% (1 sigma) • Relative uncertainty (repeatability of measurement) is approximately 2% (1 sigma)• The DCL has started a collaborative effort with NIST in order to better understand
issues with absolute QE calibration and QE measurement methodologyo The DCL will send a silicon diode test setup to NIST for absolute calibration in the near
futureo A test setup is being assembled in order to directly compare the newly calibrated
silicon diode with the previously calibrated InSb diode at operating temperature (80K)o The comparison will help the DCL understand QE measurement errors and will likely
lead to additional collaboration with NIST
18

19
QE Summary at 100K, 1.0V18237
18238
18239
18240 18241 18242 18243
18438
18440
18443

Crosstalk Summary
• From Fe55 X-ray data and dark current data (hot pixels)• Measured at 100K, 1.0V• Uncertainty: +/- 0.25% in nearest neighbor
20

0.0% 0.0% 0.0% 0.0% 0.0%0.0% 0.2% 2.4% 0.2% 0.0%0.0% 2.2% 90.1% 2.2% 0.0%0.0% 0.2% 2.2% 0.2% 0.0%0.0% 0.0% 0.0% 0.0% 0.0%
0.0% 0.0% 0.0% 0.0% 0.0%0.0% 0.3% 2.4% 0.3% 0.0%0.0% 2.8% 88.3% 2.8% 0.0%0.0% 0.4% 2.4% 0.3% 0.0%0.0% 0.0% 0.0% 0.0% 0.0%
0.0% 0.0% 0.0% 0.0% 0.0%0.0% 0.2% 1.7% 0.2% 0.0%0.0% 1.9% 92.0% 1.9% 0.0%0.0% 0.2% 1.7% 0.2% 0.0%0.0% 0.0% 0.0% 0.0% 0.0%
0.0% 0.0% 0.0% 0.0% 0.0%0.0% 0.2% 2.1% 0.3% 0.0%0.0% 2.4% 90.1% 2.4% 0.0%0.0% 0.2% 2.1% 0.2% 0.0%0.0% 0.1% 0.0% 0.0% 0.0%
0.0% 0.0% 0.0% 0.0% 0.0%0.0% 0.2% 1.8% 0.2% 0.0%0.0% 2.2% 91.5% 2.1% 0.0%0.0% 0.2% 1.6% 0.2% 0.0%0.0% 0.0% 0.0% 0.0% 0.0%
0.0% -0.1% 0.0% 0.0% 0.0%0.0% 0.2% 1.7% 0.2% 0.1%0.0% 1.9% 92.3% 1.9% 0.0%0.0% 0.2% 1.7% 0.2% 0.0%-0.1% -0.1% -0.1% 0.0% 0.0%
18237 18238 18239
18240 18241 18242 21

-0.1% 0.0% 0.0% 0.0% 0.1%0.0% 0.3% 1.7% 0.2% 0.0%0.1% 1.9% 91.7% 1.9% 0.1%0.0% 0.3% 1.7% 0.2% 0.0%0.0% 0.0% 0.1% -0.1% 0.0%
0.0% 0.0% 0.0% 0.0% 0.0%0.0% 0.2% 1.9% 0.2% 0.0%0.1% 2.0% 91.5% 2.0% 0.1%0.0% 0.2% 1.8% 0.2% 0.0%0.0% 0.0% 0.0% 0.0% 0.0%
0.0% 0.0% 0.0% 0.0% 0.0%0.0% 0.3% 2.4% 0.3% 0.0%0.0% 2.5% 89.4% 2.5% 0.0%0.0% 0.3% 2.2% 0.3% 0.0%0.0% 0.0% 0.0% 0.0% 0.0%
0.0% 0.0% 0.0% 0.0% 0.0%0.0% 0.2% 2.2% 0.2% 0.0%0.1% 2.3% 90.2% 2.3% 0.0%0.0% 0.2% 2.1% 0.2% 0.0%0.0% 0.0% 0.0% 0.0% 0.0%
18243 18438
18440 18443 22
Detectors meeting Milestone #4 Requirements: 10/13 = 77%! 23
PV3 Performance SummaryDCL Results @ T=100K, 1.0V
DetectorPixels with
Nominal Photo Response (%)
Median Dark Current (e/s)
MedianCDS Noise(electrons)
QE (%)(av. 800-2350nm)
Crosstalk (%) (nearest neighbor)
Persistence (% of FW in 150 sec. after 150 sec.)
95% < 0.1 < 20 > 60 < 3 < 0.10
18237 99.99 0.001 11.9 95 2.3 0.02
18238 99.3 0.001 15.1 96 2.6 0.01
18239 99.8 0.001 15.2 89 1.8 0.03
18240 99.97 0.001 15.7 93 2.3 0.01
18241 99.9 0.004 15.2 92 1.9 0.02
18242 99.9 0.040 16.0 93 1.8 0.02
18243 99.9 0.064 16.3 90 1.8 0.03
18244 99.9 0.003 15.1 90 1.9 0.20
18438 99.98 0.001 13.2 86 1.9 0.01
18440 99.96 0.001 14.4 81 2.4 0.01
18441* 99.97
18442 99.96 0.35 16.2 93 1.9 0.02
18443 99.95 0.003 12.8 87 2.2 0.02
*18441 was not fully analyzed due to an electrical coupling between Vreset and DSUB bias lines

Looking Ahead To Flight
• The performance of the PV3 SCAs from the full-array lot exceeds, with significant margin, the requirements set out in DTAC Milestone #4
• We continue to work with the WFIRST FSWG to finalize the SCA requirements for flight.
• The flight requirements will differ somewhat from the milestone requirements, and thus it would incorrect to attempt to infer an expected yield for flight from the results presented here.
• In addition, yield can be expected to vary from lot-to-lot, as has been seen in previous flight programs (e.g. HST, JWST, Euclid).
24