why test the aquifers of new mexico? w. peter balleau, balleau groundwater, inc balleau groundwater,...
TRANSCRIPT
Why Test the Aquifers of Why Test the Aquifers of New Mexico?New Mexico?
Why Test the Aquifers of Why Test the Aquifers of New Mexico?New Mexico?
W. Peter Balleau,W. Peter Balleau,Balleau Groundwater, IncBalleau Groundwater, Inc.
January 24, 2009January 24, 2009

CHALLENGES TO GROUNDWATER RESOURCE DEVELOPMENT
•“The sustainability of groundwater represents one of the major water challenges.”
-3rd World Water Forum (2003)
•“The problem of ground water mining represents a fundamental threat…”-World Bank (1999)
•“The country cannot sustain even the current levels of groundwater use…we must act to protect our rivers, springs, wetlands, lakes and estuaries from groundwater pumping.”
-Water Follies (R. Glennon, 2002)
•“Water in the West: …the American West is facing a serious water crisis. In the long run, we do not have enough water to meet the West’s fast-growing needs.”
Barackobama.com (2008)

DRY SEASONBASEFLOW FROM
AQUIFER DISCHARGE
SUM = 300,000 AFYAQUIFER YIELD
Wells

DRY SEASONBASEFLOW FROM
AQUIFER DISCHARGE
SUM = 300,000 AFYAQUIFER YIELD
Wells

NEW MEXICO AQUIFER DISCHARGEBasin Dry Season Baseflow
(AFY)Well Withdrawal1
(AFY)
Canadian River 6,000 66,000
Rio Grande 80,000 695,000
Pecos River 60,000 445,000
Mimbres River 2,000
San Juan River 6,000 4,000
Gila/San Francisco River
45,000 104,000
High Plains 100,000 525,000
300,000 AFY(some already
depleted by wells)
1,800,000 AFY
1New Mexico Office of the State Engineer, 2008

SANTA FE
ESTANCIA
REGIONAL TREND EXAMPLE

AREAS OF AQUIFER DRAWDOWN
Adapted from: USGS, 1972, New Mexico State Water Plan:Map Showing Observed Changes of Ground-Water Level and Hydrographs of Selected Wells in New Mexico.

Wells
AREAS OF WELL DENSITY

OBSERVED BASEFLOW GAIN ON SEGMENT OF PECOS RIVER, NEW MEXICO
0
20,000
40,000
60,000
80,000
100,000
120,000
140,000
Jan-1900 Dec-1909 Jan-1920 Dec-1929 Jan-1940 Dec-1949 Jan-1960 Dec-1969 Jan-1980 Dec-1989 Jan-2000
DATE
BA
SE
FL
OW
(A
FY
)
OBSERVED BASEFLOW GAIN ACME TO ARTESIA
TREND OF BASIN DRYING OUT
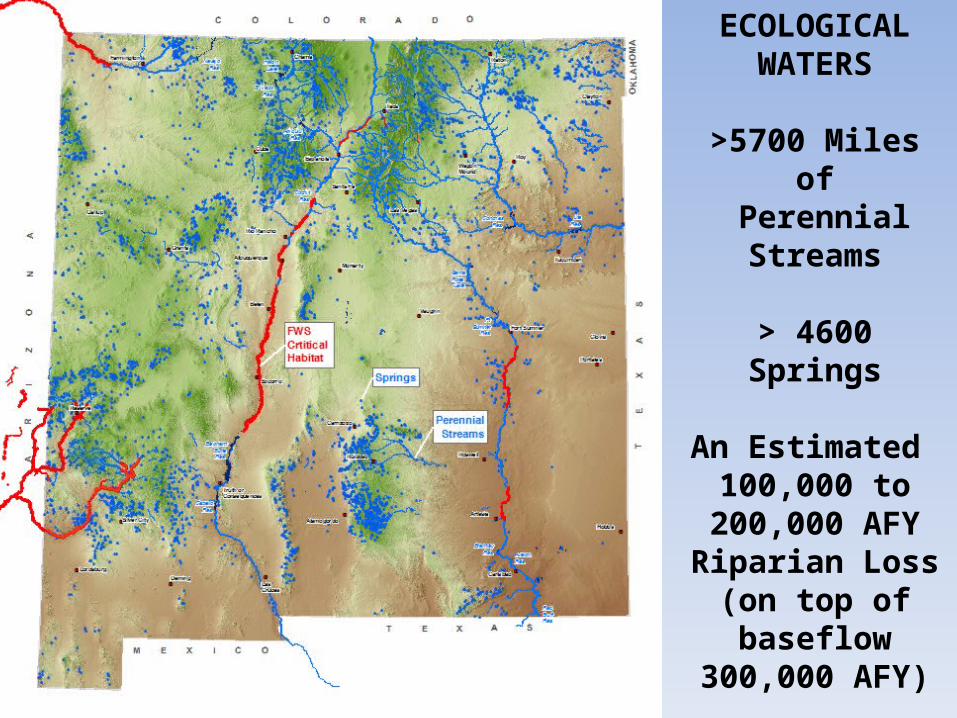
ECOLOGICAL WATERS
>5700 Miles of Perennial Streams
> 4600 Springs
An Estimated 100,000 to
200,000 AFY Riparian Loss
(on top of baseflow 300,000 AFY)

THE GROUNDWATER IMPACT PROBLEM
+ new water (temporary)
How much to be reserved for ecological waters and downstream obligations, or taken for economic use?

SUSTAINABLE GROUNDWATER•Creates a managed, desirable groundwater condition regarding levels and chemistry.
•The “available groundwater resource” is the amount that also achieves ecological objectives and meets downstream obligations.
•Administering surface water rights does not result in sustainable groundwater development, (CU>net effect).
•The benefits of groundwater storage development need not be abandoned in the name of “sustainability”.

WHY AQUIFER/PUMP TEST?•Pick pump size and setting•Decide cause of well problem: Aquifer?
Screen?Pump?
•Subdivision approval on water availability•Find effects on neighbors for permitting•Find effects on own wellfield for management•Aquifer characterization for system management or models

Aquifer Properties
Storage CoefficientIs Volume of Water
Per Volume of Aquifer Drawdown
(ranges 1 AF water per 10 to 100,000 AF cone volume)
TransmissivityIs the flow in
a 1-ft wide stripof aquifer
(ranges 1000gpd to 100,000gpd per 1-ft strip, then adjusted for gradient)

33%
66%
100%
133%
166%
0
2
4
6
8
10
12
14
16
1 Minute 15 Minutes 2.4 Hours 1 Day 10 Days 100 Days
BENEFIT OF SHORT AND LONG TESTS
1-Day TestPeriod
(Plus information from recovery period)
Dra
wdow
n D
ata

KINDS OF WELL TEST
•Well-development pump•Step-test, multi-rate•Short-term, 1-12 hours constant rate•Longer-term, 1-10 days, rarely longer•Observation wells•Extended recovery•Operational tests-more popular
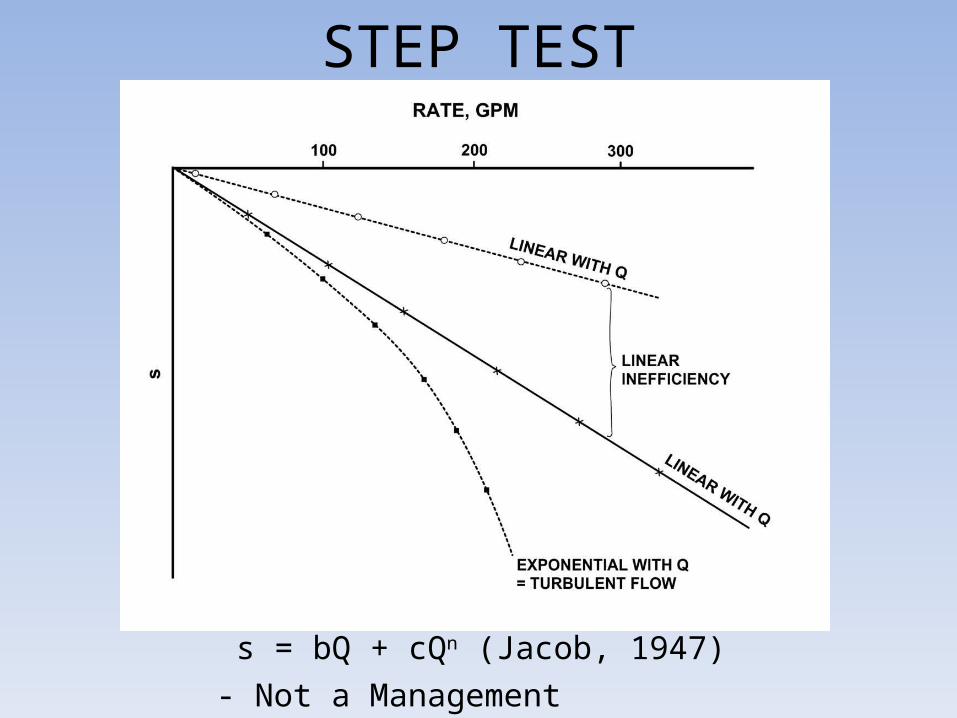
STEP TEST
s = bQ + cQn (Jacob, 1947) - Not a Management Tool

SUBDIVISION DOMESTIC WELL TEST
1. Drill and install a properly-constructed domestic well on the subdivision site.
2. Pump the well under controlled conditions at a rate of 5 to 20 gpm for 24 hours (or longer per County).
3. Collect water-level recovery data for three days after the end of pumping.
4. Calculate the radius of influence of the test and check if additional wells and tests are needed to get a representative sample of the subdivided area.


Adapted From:USEPA, 1993, Groundwater Issue: Suggested Operating Procedures forAquifer Pumping Tests, EPA/540/S-93/503.
Not quite full recovery
Not quite stable drawdown


Pump test methods have not changed much

Frequency Test Duration
1 min. 20 min.
5 min. 25 min. to 1 hr.
10 min. 1 hr. to 2 hrs.
30 min. 2.5 hrs. to 6 hrs.
1 hr. 6 hrs. to 12 hrs.
2 hrs. 14 hrs. to 24 hrs.
6 hrs. 1 day to 2 days
Daily 2 days or more
(Appreciable variation can be accepted)
OPTIMUM TIMES OF WATER LEVEL MEASUREMENTS FOR WELL AND AQUIFER TEST DATA
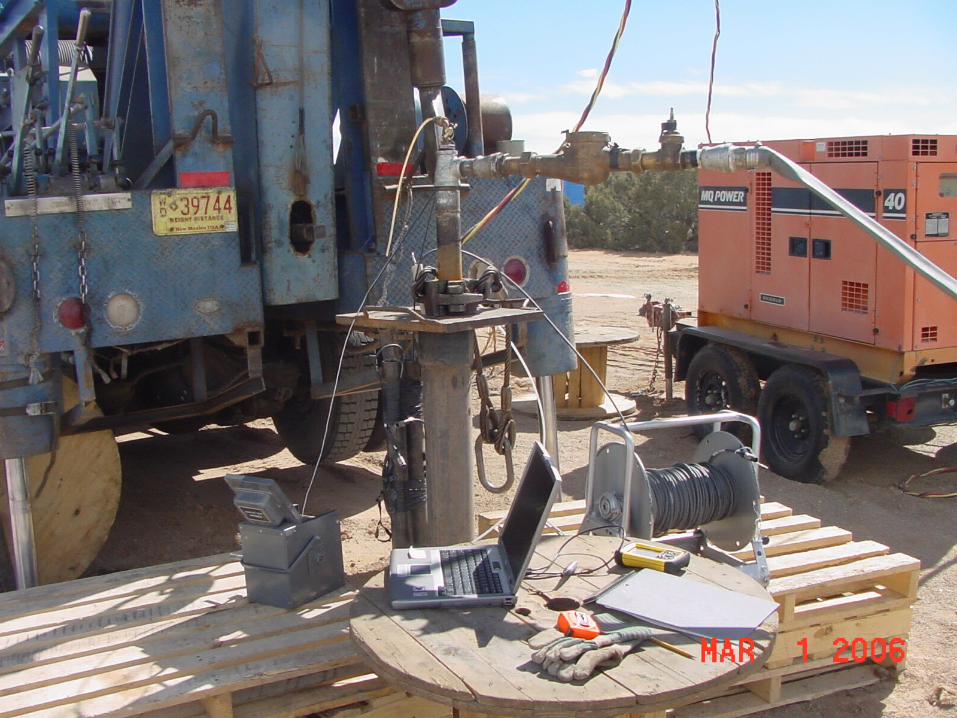
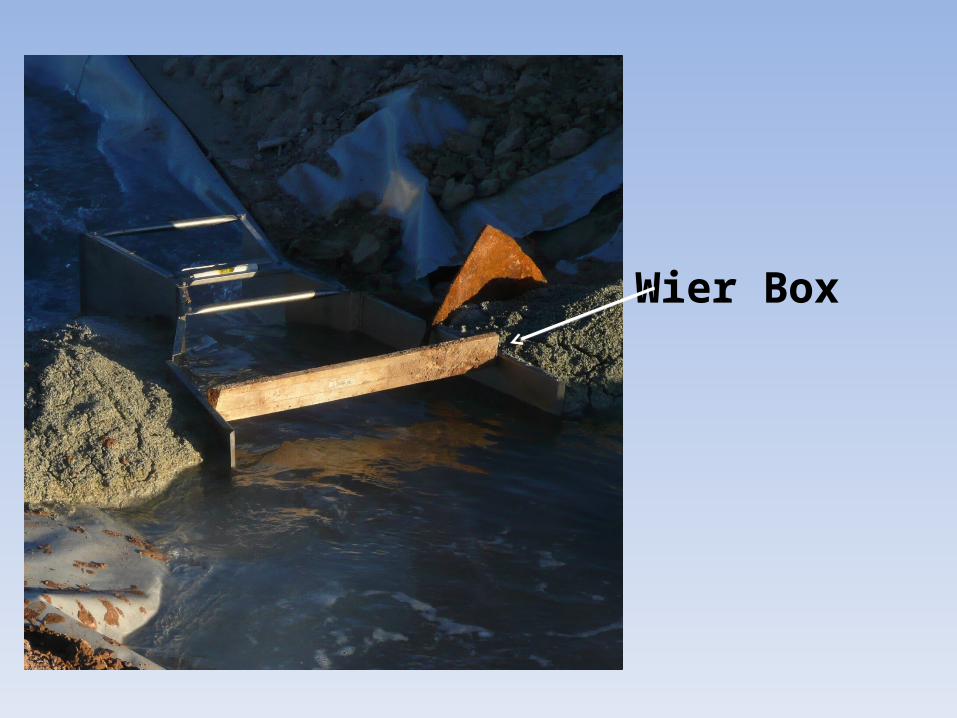
Wier Box

M-SCOPE

MeasuringTube

DRILLER TEST SETUP
•Rate control valve and meter•Electric probe, steel-tape and chalk, or transducer•Measuring tube•Pretest data•Recovery data twice as long as pump•Water-sample kit from lab

OPERATIONAL TESTING
Install: •Meter, recording•Measuring tube (Required by Regulation)•Transducer (pumping water level), recording

EXAMPLE 15 MINUTE DATA
6620
6625
6630
6635
6640
6645
6650
6-Apr 13-Apr 20-Apr 27-Apr 4-May 11-May 18-May 25-May 1-Jun 8-Jun
DATE
GR
OU
ND
WA
TE
R E
LE
VA
TIO
N (
FE
ET
, NG
VD
29)

5 9 5 0
5 9 6 0
5 9 7 0
5 9 8 0
5 9 9 0
6 0 0 0
6 0 1 0
5 9 5 0
5 9 6 0
5 9 7 0
5 9 8 0
5 9 9 0
6 0 0 0
6 0 1 0
5 9 5 0
5 9 6 0
5 9 7 0
5 9 8 0
5 9 9 0
6 0 0 0
6 0 1 0
5 9 5 0
5 9 6 0
5 9 7 0
5 9 8 0
5 9 9 0
6 0 0 0
6 0 1 0
PWL
Pump Setting No Change = No Problem
SUSTAINABLE
REGIONAL TREND
Change in PWL = Well
LOSE EFFICIENCY
DEWATER SCREEN, FRACTURE OR PWBS
Change in SWL = Aquifer
Abrupt Change
SWL
MANAGEMENT BY TREND ANALYSIS

Well Tests by Drillers are Needed
• To ensure well performance for the owner/user• Permitting• Data to help Manage and Operate aquifer,
wetland, and surface water systems to maintain hydrologic conditions for ecological waters, downstream obligations, and economic use.

“Water is fundamental for life and health. The human right to water is indispensable for leading a healthy life in human dignity. It is a prerequisite to the realization of all other human rights”.
(U.N. Committee on Economic Cultural and Social Rights)