why start with a customer for a company to be successful, it must : understand the customer – all...
TRANSCRIPT
Why Start with a Customer
For a company to be successful, it must :
• Understand the customer– All customers are not alike!
• Identify their preferences – Customers have different needs!
• Deliver value- Today,s customer is in the driver’s seat !
If you don’t know where you are going you probably aren't going to get there
The fundamental principle of Marketing is: To target a specific niche market as
your point of attack and focus all your resources on achieving the dominant leadership position in that segment
High risk low data decision
The market we will enter will not have experienced our type of product before.
We are in high risk low data state.
Lack of Data
The only proper response to this situation is to acknowledge the lack of data as a condition of the process.
To be sure, you can fight back against this ignorance by gathering highly focused data yourself.
You can not expect to transform a low data situation to high data situation quickly.
Memorable Images
Only work with memorable images.
Please note that we are not focusing on target market characterization. But target customer.
Let Them Guide Us
Markets are impersonal abstract things like the PC market
Neither the names nor the descriptions of markets evoke any memorable images.
We need something that feels a lot more like real people.
We are just going to have to make them up.
We can let them guide us to developing a truly responsive approach to their needs.

Target Customer Characterization
A formal process for making up these images, getting them out of individual heads and in front of a
marketing decision making group.
Target Customer Characterization Create as many characterizations as
possible Built a basic library of possible
target customer profiles Apply techniques to reduce these
data into a prioritized list of desirable target market segment opportunities.
Sample Scenario for a Pen based Laptop Customer Personal profile and job description Technical resources (environment) A day in life (before) The problem your product solves A day in life (after)
We are still operating in a low data situation
We just have a better set of material to work with.
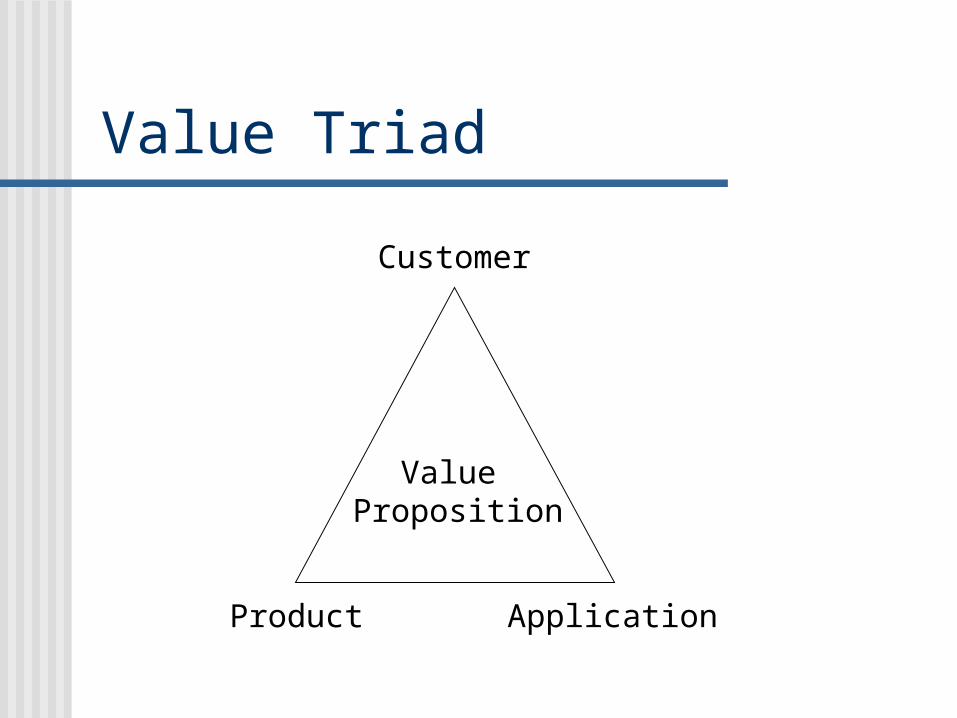
Value Triad
Product Application
Customer
Value Proposition
MarketAssumption: People will respond better to promotions,products tailored to their needs

Segmented MarketObjective: Find homogenous groups of people -so each group can be sent a different promotion-tailored to its needs.
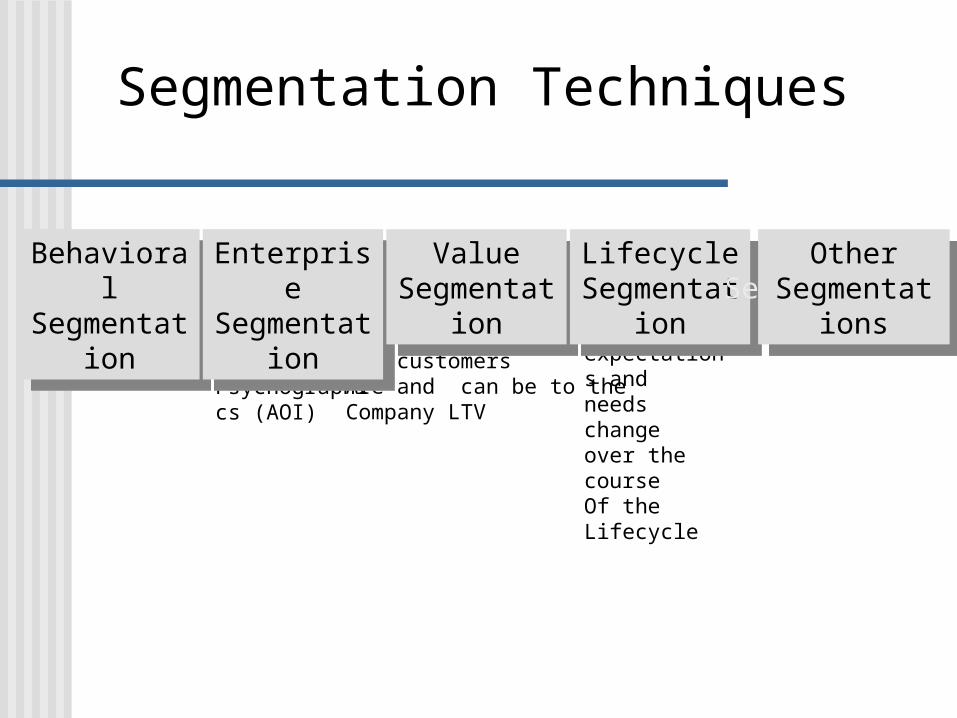
GeographicDemographicPsychographics (AOI)
How valuablethe customers Are and can be to theCompany LTV
RFMCustomers expectations andneeds changeover the course Of the Lifecycle
BehavioralSegmentation
BehavioralSegmentation
EnterpriseSegmentation
EnterpriseSegmentation
ValueSegmentation
ValueSegmentation
LifecycleSegmentation
LifecycleSegmentation
OtherSegmentations
OtherSegmentations
OtherSegmentations
Segmentation Techniques
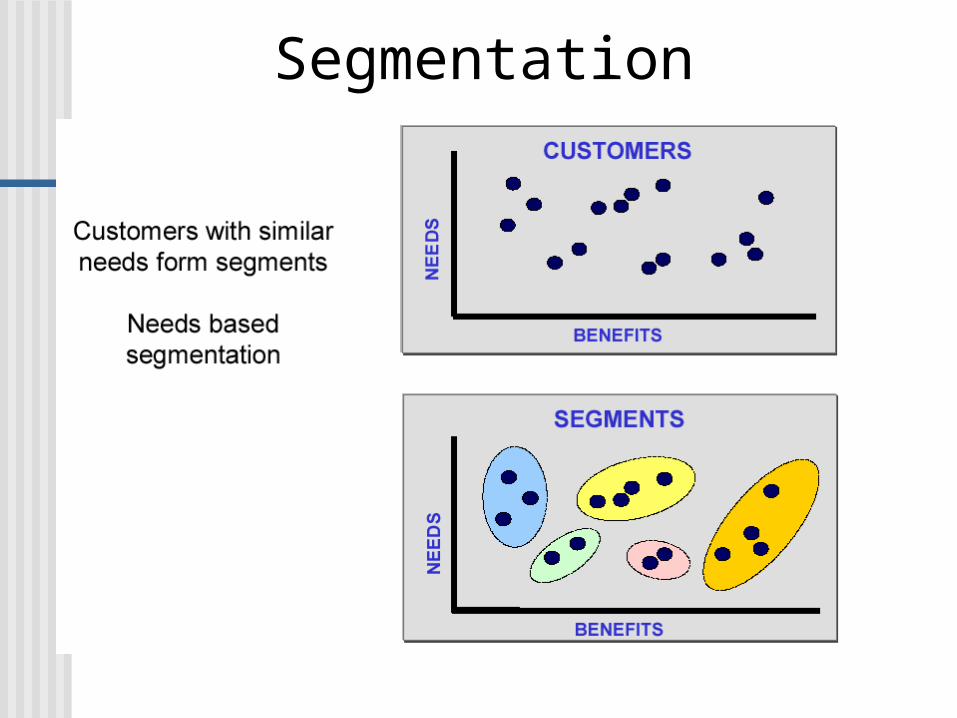
Segmentation

Key principles of segmentation Once a customer has purchased a product or service he or
she is likely to purchase again from the same source. Assuming the customer had a good experience Segment customers from non customers
• Than focus resources on repeat sales to the same customers.
By learning more about the best customers marketer can maximize profits.
All customers do not purchase the same product for the same reason. Seniors and kids purchase aspirin for different reasons

Lifetime Value
The Criterion of Strategy
The Loyalty Effect Accountants have developed
sophisticated techniques for appraising capital assets and their depreciation;
They have learned how to monitor the constantly changing value of work-in-progress; but they have not yet devised a way to track the value of a company's customer inventory.
Accountants They make no distinction between the
sales revenue from brand new customers and sales revenue from long term, loyal customers, because they don’t know or care it costs much more to serve new customers than an old one.
Worse accountant treat investment in customer acquisition as one more current expense instead of assigning it to specific customer accounts and amortizing it over the life of the customer relationship.
Why Lifetime Value Analysis?
• We need to know the value of our customers, so as to properly target our sales and retention efforts.
• We need to discriminate among our customers to acquire and retain the best.
The Importance of Measurements• Measures determine vision and strategy deciding what to
measure and how to link measures to incentives are the most important DBM decisions.
• NPV of customer base should be at the top of the measurement hierarchy.

LTV Analysis Goal:
Determine…
• Where to put your retention dollars• The value of each retention strategy • Where to put your acquisition dollars• How much to spend on acquisition
What is Life Time Value
• NPV of the profit to be realized on the average new customer during a given number of years.• Life time value is goodwill• To compute it you must be able to track customers from
year to year• Main use: To evaluate strategy
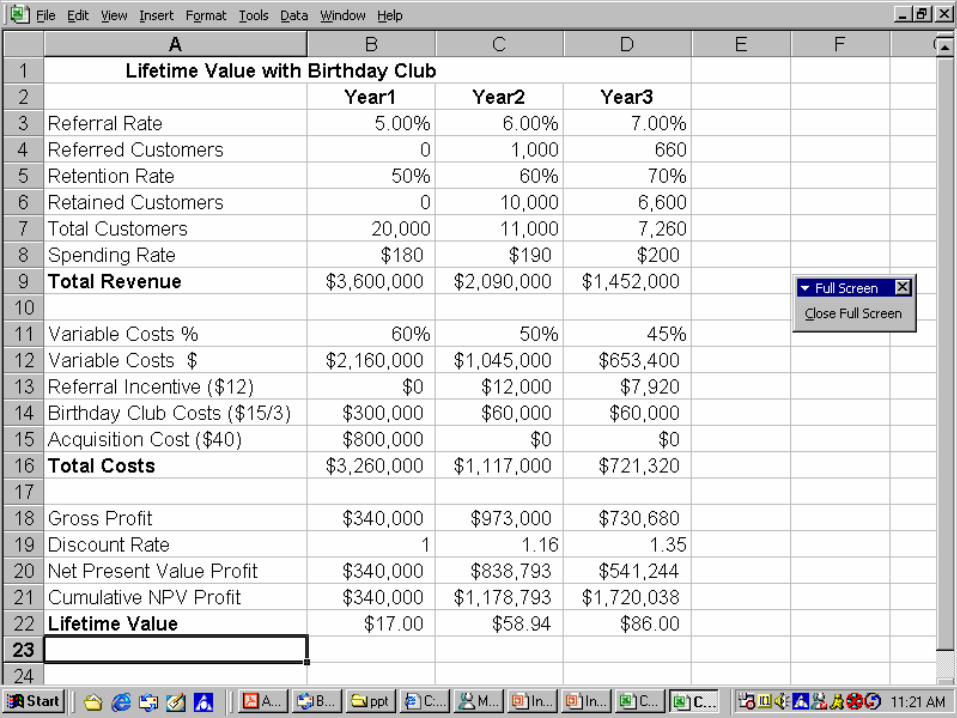
Birthday Club Strategy We will examine Ridgeway Fashions
before and after it adopted the new strategy of writing letters to husbands before their wives birthdays.
While this is a retail example the principles apply to any kind of industry.
Financial,Telecommunications, B2B

Variable Costs Include any variable cost. Do not include fix costs rent long
term debt overhead. These costs do not vary with number of customers.
The costs of servicing a customer tend to decrease with the number of years that the customer has been buying from you.

Acquisition Cost Marketing + Sales
Money you spend during the year. Than
Marketing+Sales/the number
of new customers who actually make purchases from you each year.
The Discount Rate The profits you receive from your
customers come in over several years. Money received in future years is not
worth as much as money received today. We must discount it by a certain
percentage so we can equate it to the present money.
Use the market rate of interest to discount the future revenue And include the risk factor
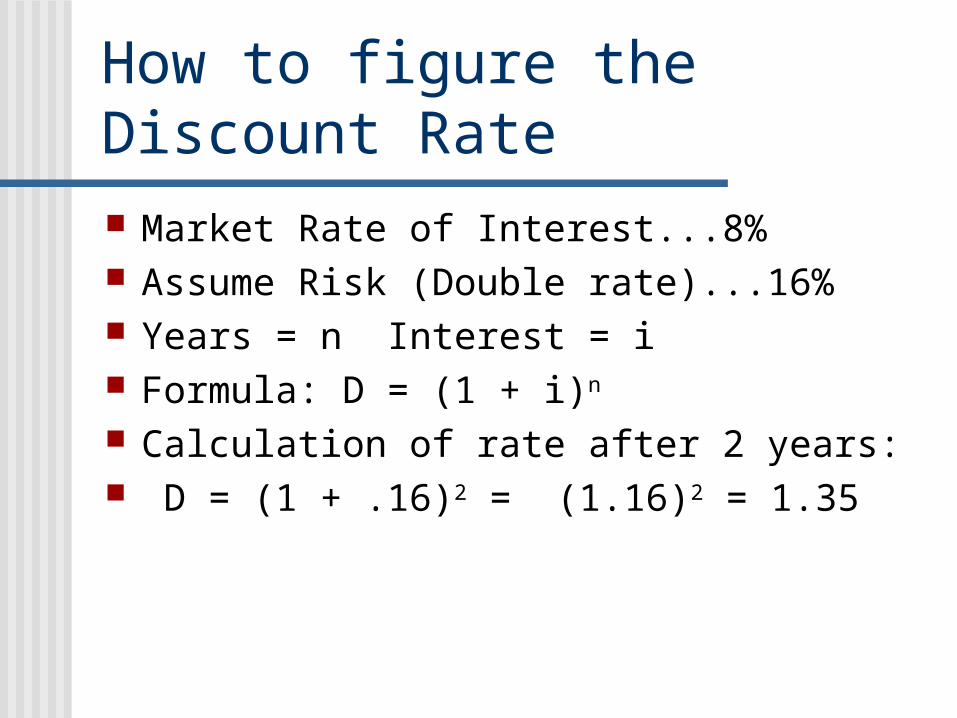
How to figure the Discount Rate Market Rate of Interest...8% Assume Risk (Double rate)...16% Years = n Interest = i Formula: D = (1 + i)n
Calculation of rate after 2 years: D = (1 + .16)2 = (1.16)2 = 1.35

Profits
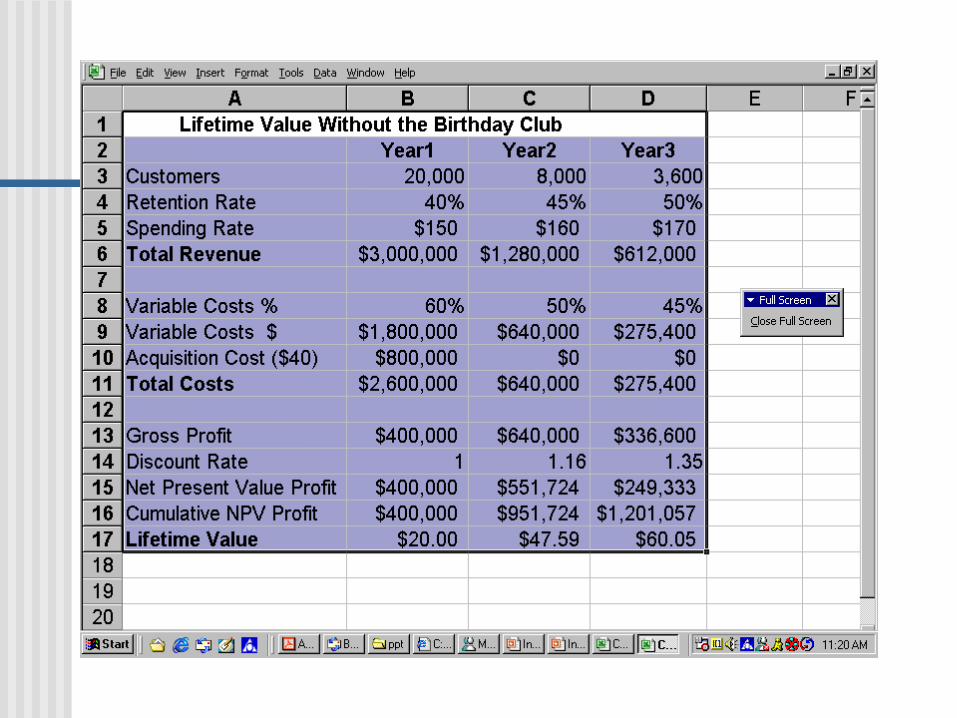
NPV Profits : Gross Profits / Discount rate
Cumulative NPV profits NPV year 1 + NPV year 2 + NPV
year 3

LTV
LTV : Cumulative NPV profits in each year /
original group of customers
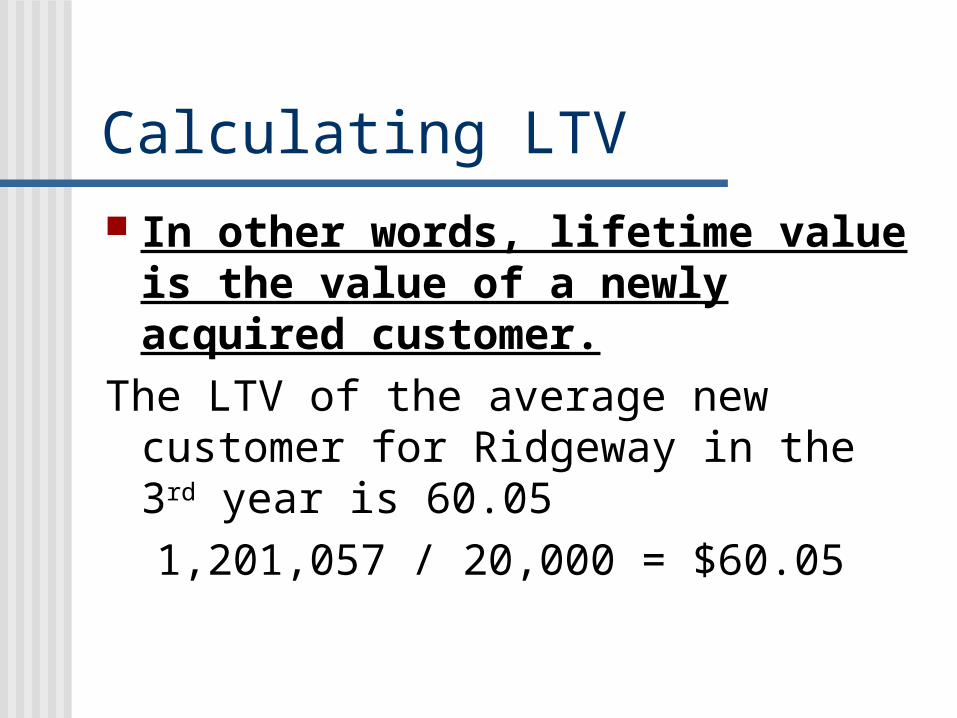
Calculating LTV In other words, lifetime value is
the value of a newly acquired customer.
The LTV of the average new customer for Ridgeway in the 3rd year is 60.05
1,201,057 / 20,000 = $60.05

LTV Table’s Significance Typically, the lifetime value numbers in
and of themselves have no particular significance.
What makes them important is when they are used in comparison with other numbers to evaluate the effect of proposed strategies.
What Life Time Value table shows is that if the new strategies were to be adopted…..
Ridgeway Fashions Assumption: The birthday club will
be successful and there will be a 5 % referral rate.
Assumptions 5 percent of her customers will
recommend Ridgeway to their friends or relatives.
As a result we will have 5 percent more customers in year 2 than we otherwise would have had.
Assumptions Spending rate, Loyal customers will buy more than new customers.
As customers drop out, those who are left are the more loyal customers.
To set the club up in the 1st year will cost $15 per customer. This includes training of the clerks to ask people to join the club and
giving the clerks a commission of $5/customer sign up in addition:• Getting the survey data• Entering the data, • Putting it into the database• Creating the birthday club software• Writing one letter to each members husband at birthday time.
In years 2 and 3 the costs are set at $3 per year.
You will note that she is sending out birthday letters to all club members, even though many have already stopped buying in the store.
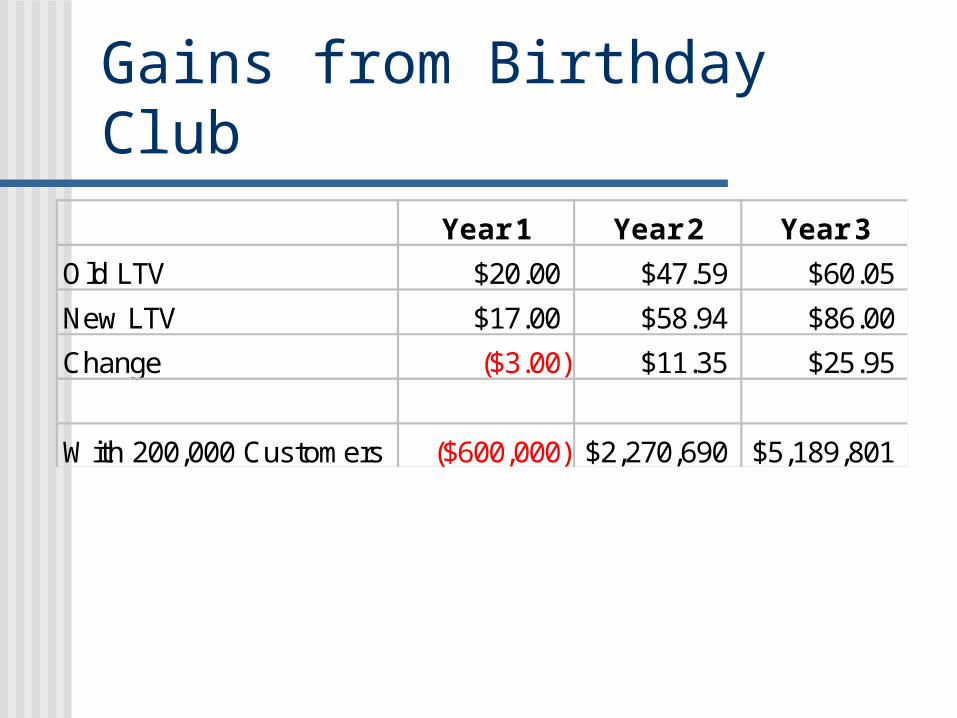
Gains from Birthday Club
Year 1 Year 2 Year 3
Old LTV $20.00 $47.59 $60.05
New LTV $17.00 $58.94 $86.00
Change ($3.00) $11.35 $25.95
With 200,000 Customers ($600,000) $2,270,690 $5,189,801

Event driven communication:
Dear Mr. Hughes:
I would like to remind you that your wife Helena’s birthday is coming up in two weeks on November 5th. We have the perfect gift for her in stock.
As you know, she loves Liz Claiborne clothing. We have an absolutely beautiful new suit in blue, her favorite color, in a fourteen, her size, priced at $232.00.
If you like, I can gift wrap the suit at no extra charge and deliver it to you next week, so that you will have it in plenty of time for her birthday. Or, I can put it aside so you can come in to pick it up. Please call me at (703) 754-4470 to let me know which you’d prefer.
Sincerely yours,
Robin Baumgartner Robin Baumgartner, Store Manager
Ridgeway Fashions
Leesburg, VA 22069
Recency, Frequency, Monetary Analysis
RFM Direct Marketers have been using
RFM Analysis to predict customer behavior for more than 50 years.
It is the basis for any model of customer behavior
You only need your Customer database with purchase history. You don’t need to hire a statistician.
RFM The predictor of future behavior is
past behavior RFM is pure behavior, it only works
with customer files It requires knowledge of the
customer purchase history. It works with any industry.
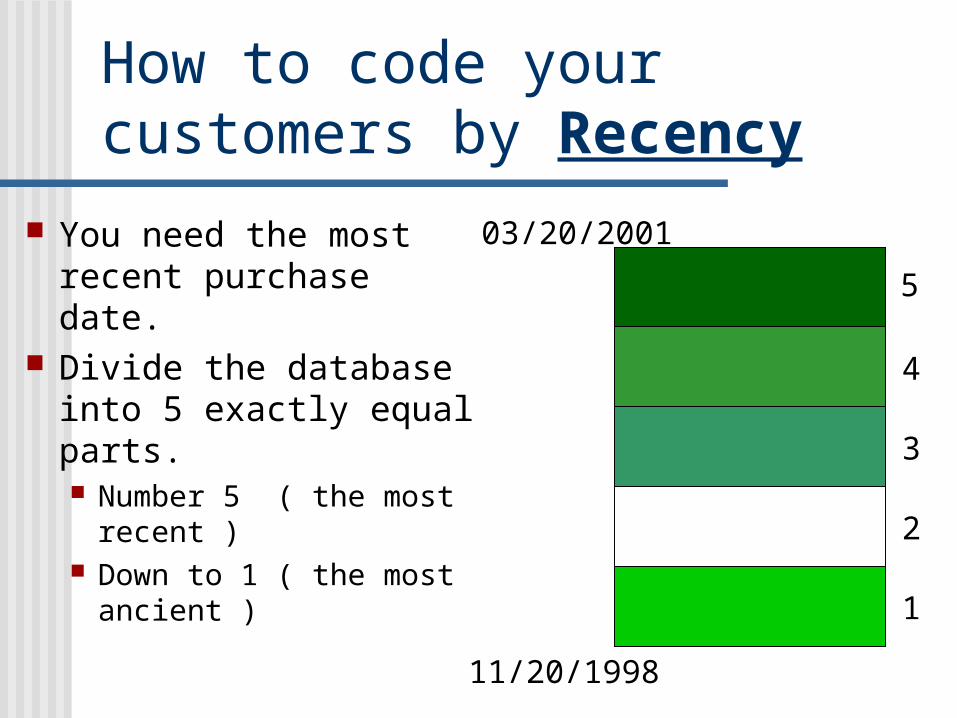
How to code your customers by Recency
You need the most recent purchase date.
Divide the database into 5 exactly equal parts. Number 5 ( the most
recent ) Down to 1 ( the most
ancient )
5
4
3
2
1
03/20/2001
11/20/1998
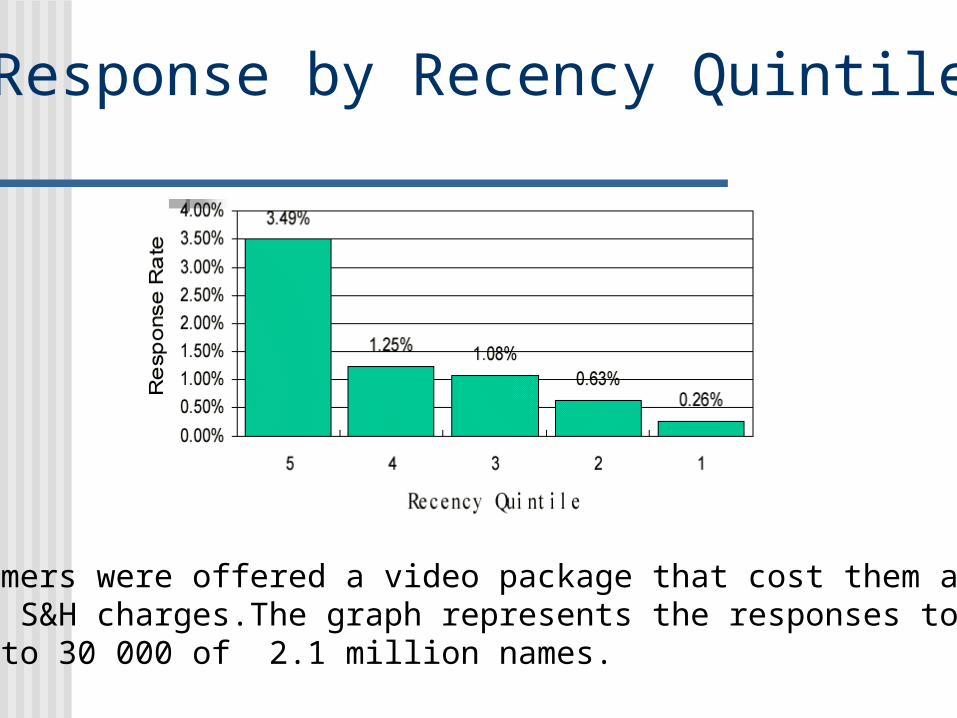
Response by Recency Quintile
The customers were offered a video package that cost them about $100including S&H charges.The graph represents the responses to a test mailing to 30 000 of 2.1 million names.
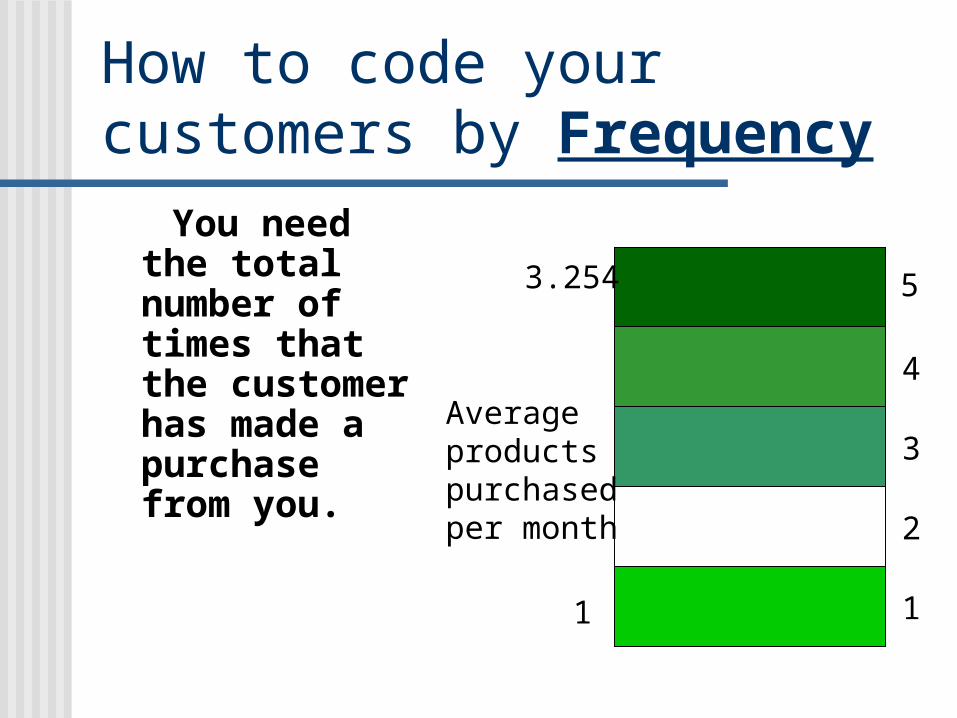
How to code your customers by Frequency You need the
total number of times that the customer has made a purchase from you.
5
4
3
2
1
3.254
1
Averageproductspurchased per month
Frequency Average number of telephone calls
made per month Total number of checks and deposits
made during a month This is a measure of how important
is doing business with you is in the minds of your customers.
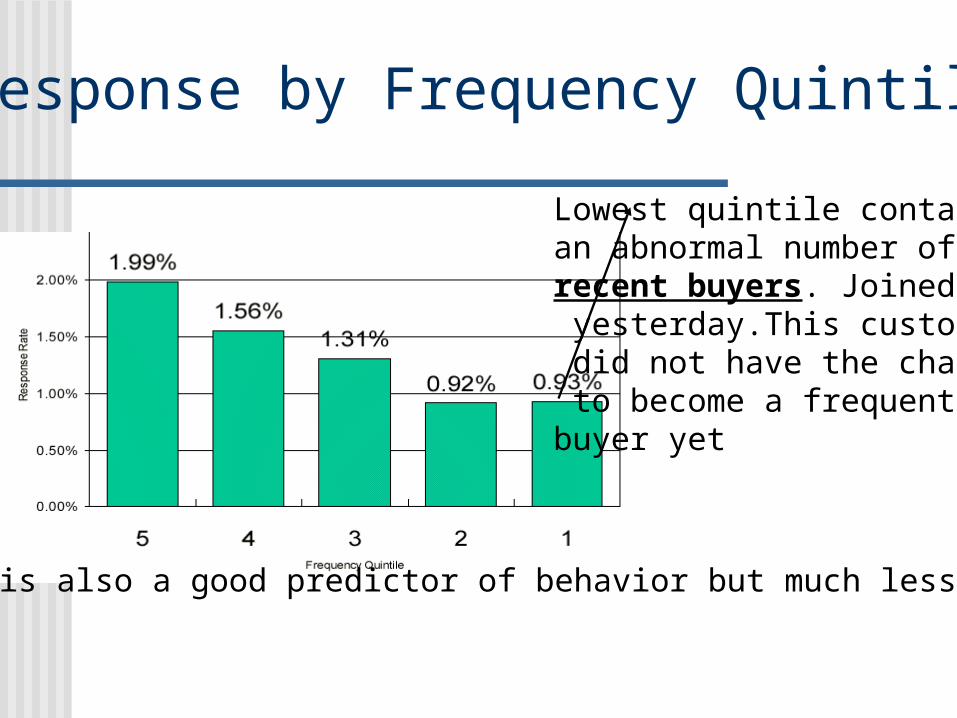
Response by Frequency Quintile
Frequency is also a good predictor of behavior but much less so than Recency.
Lowest quintile contains an abnormal number of recent buyers. Joined yesterday.This customer did not have the chance to become a frequent buyer yet
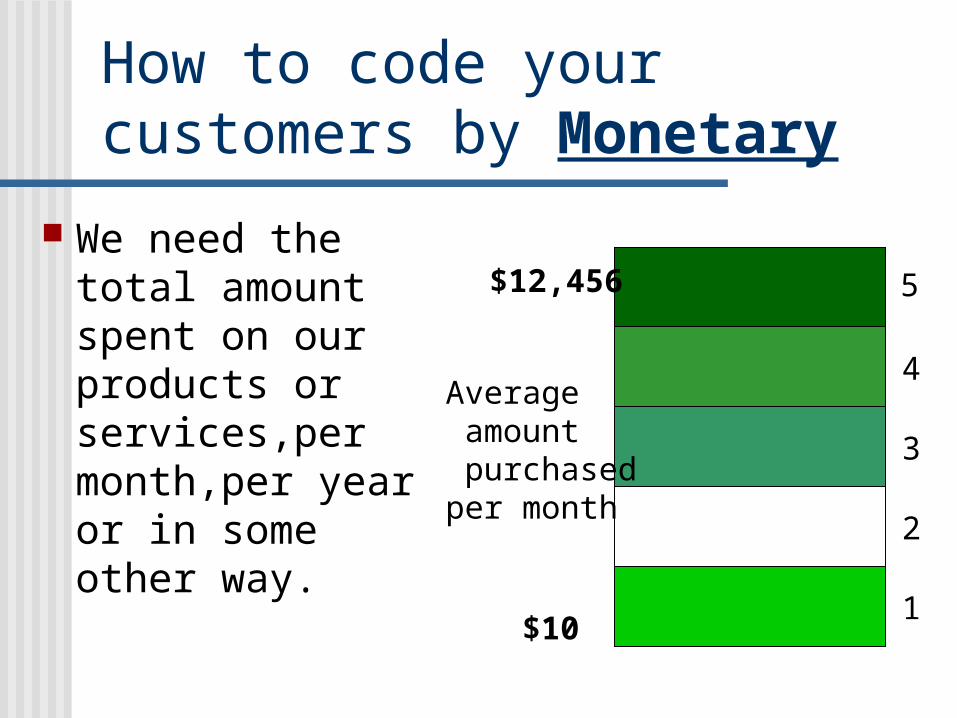
How to code your customers by Monetary
We need the total amount spent on our products or services,per month,per year or in some other way.
5
4
3
2
1
$12,456
$10
Average amount purchasedper month
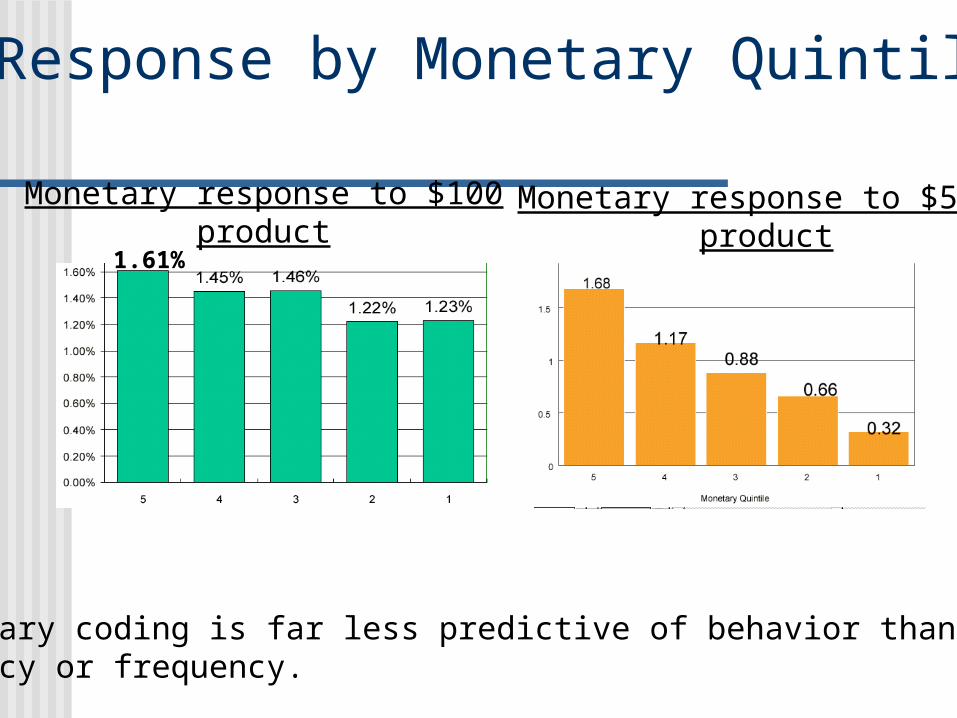
Response by Monetary Quintile
1.61%
Monetary coding is far less predictive of behavior than either recency or frequency.
Monetary response to $5000product
Monetary response to $100product

Putting It All Together
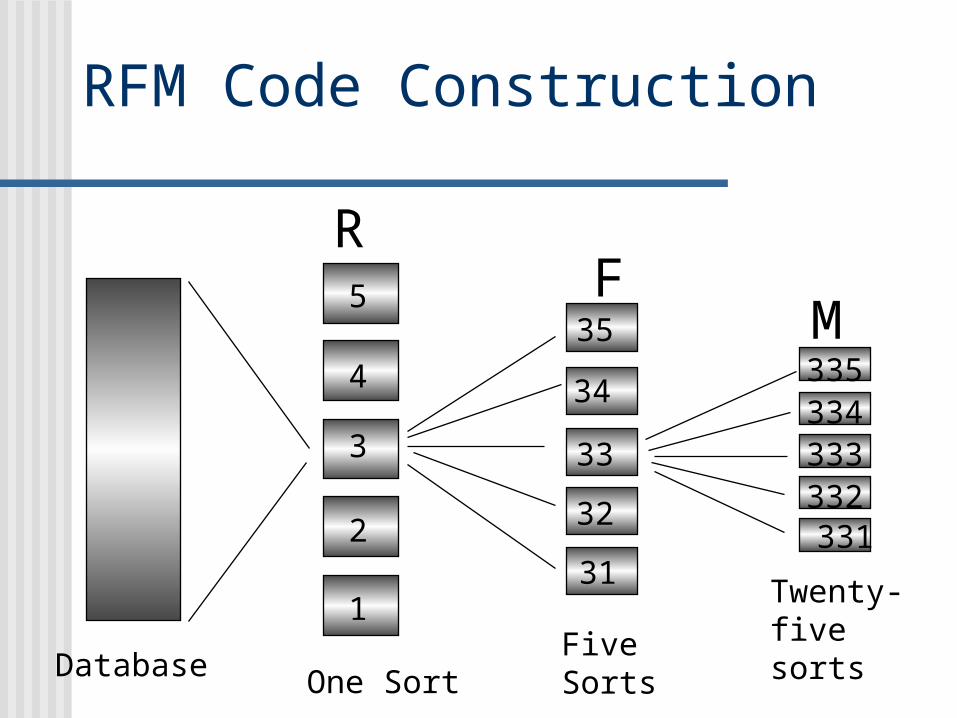
RFM Code Construction
FM
One SortFive Sorts
Twenty-five sorts
Database
5
4
3
2
1
35
34
33
32
31
335334333332331
R
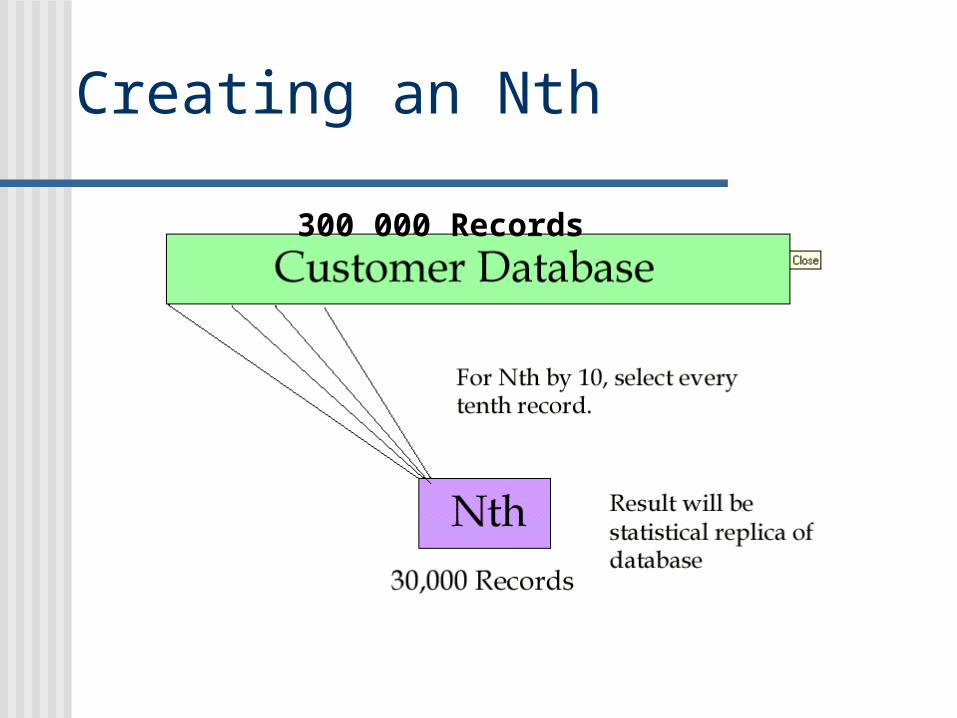
300 000 Records
Creating an Nth
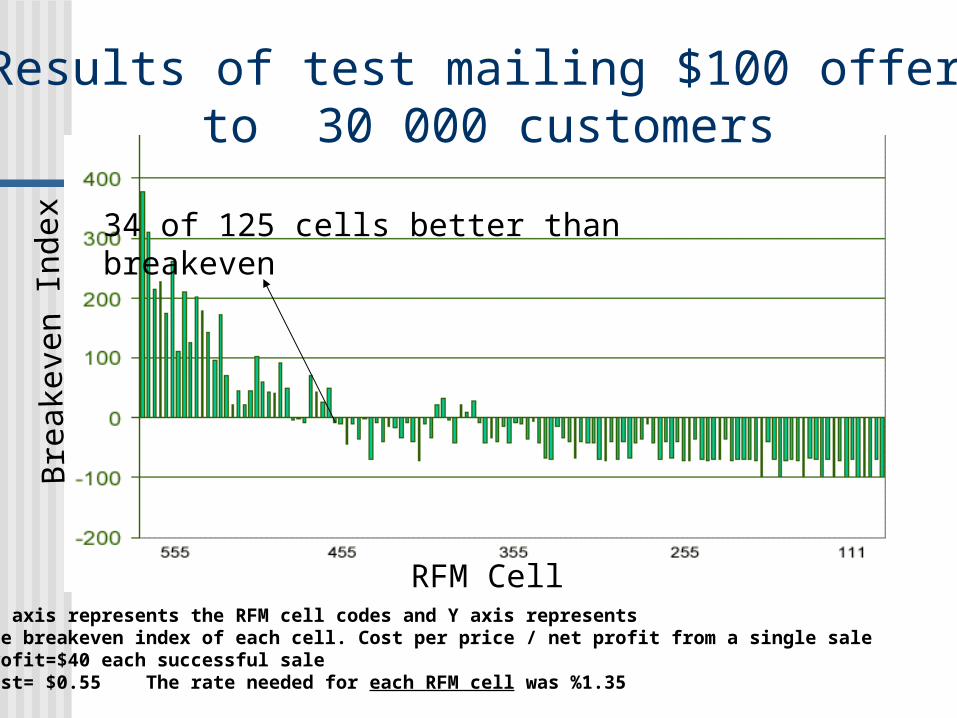
Results of test mailing $100 offer to 30 000 customers
RFM Cell
Bre
akev
en I
ndex
34 of 125 cells better than breakeven
X axis represents the RFM cell codes and Y axis representsThe breakeven index of each cell. Cost per price / net profit from a single saleProfit=$40 each successful saleCost= $0.55 The rate needed for each RFM cell was %1.35
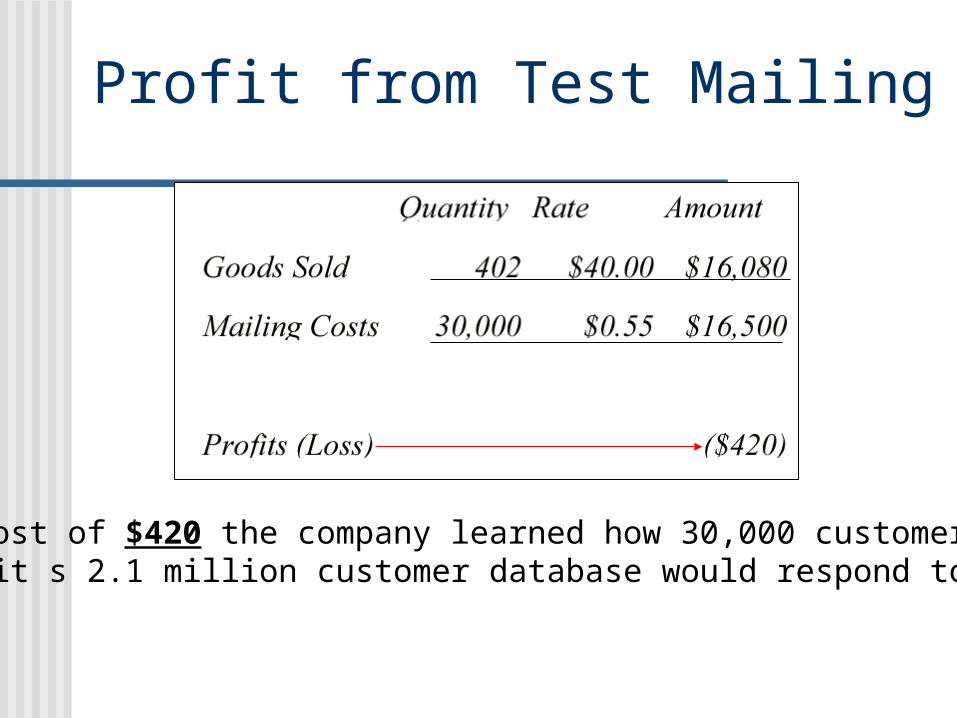
Profit from Test Mailing
For a net cost of $420 the company learned how 30,000 customer, an Nth of it s 2.1 million customer database would respond to this offer.
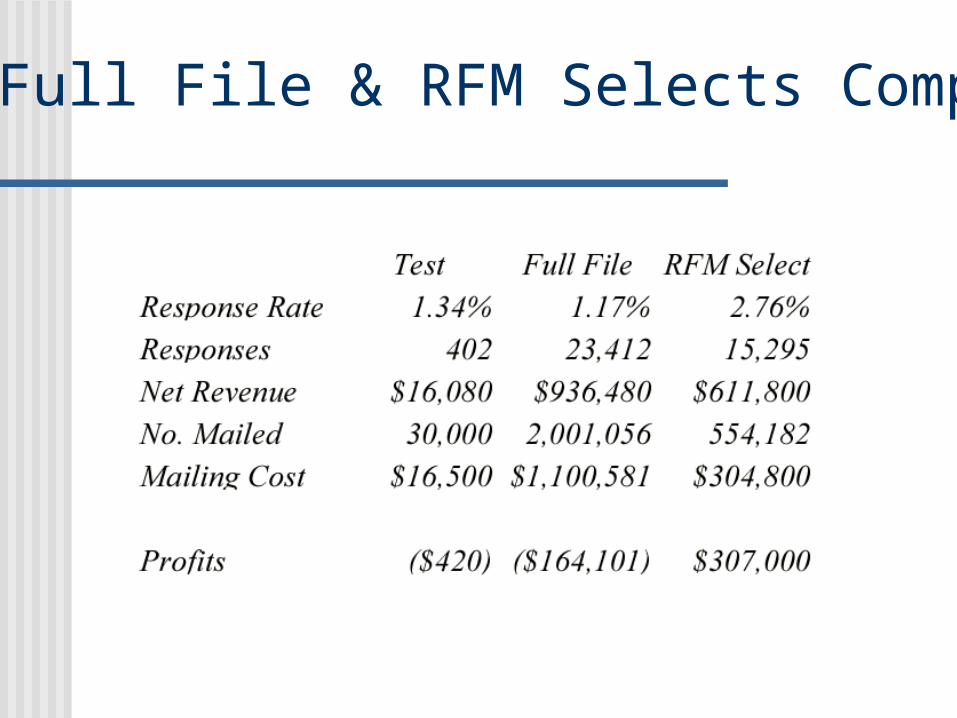
Test Full File & RFM Selects Compared
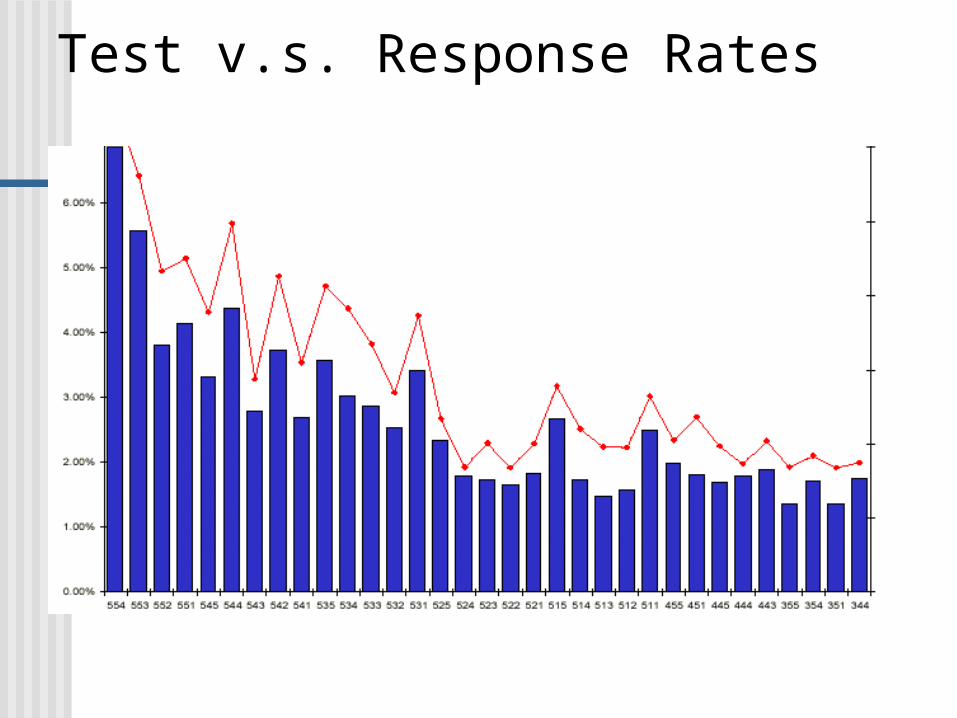
Test v.s. Response Rates