why should countries care? - oecd
TRANSCRIPT

Why Should Countries Care? The High Economic and Social Costs of
Education Failure
OECD, Paris
11 February 2010
Henry M. Levin
Professor Economics and Education
Teachers College, Columbia University
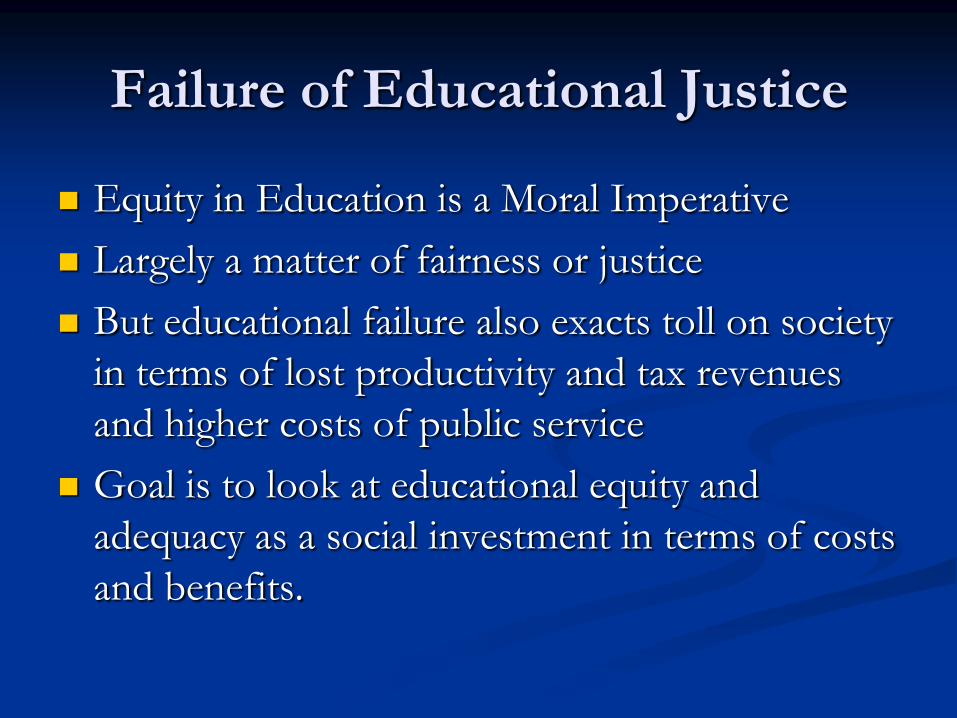
Failure of Educational Justice
Equity in Education is a Moral Imperative
Largely a matter of fairness or justice
But educational failure also exacts toll on society
in terms of lost productivity and tax revenues
and higher costs of public service
Goal is to look at educational equity and
adequacy as a social investment in terms of costs
and benefits.

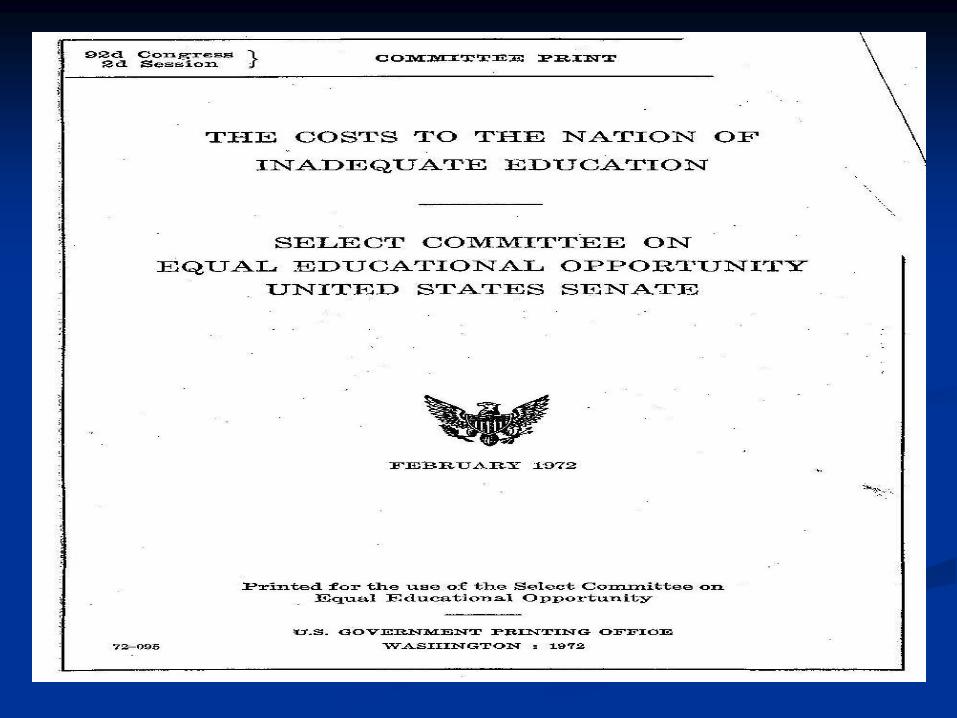
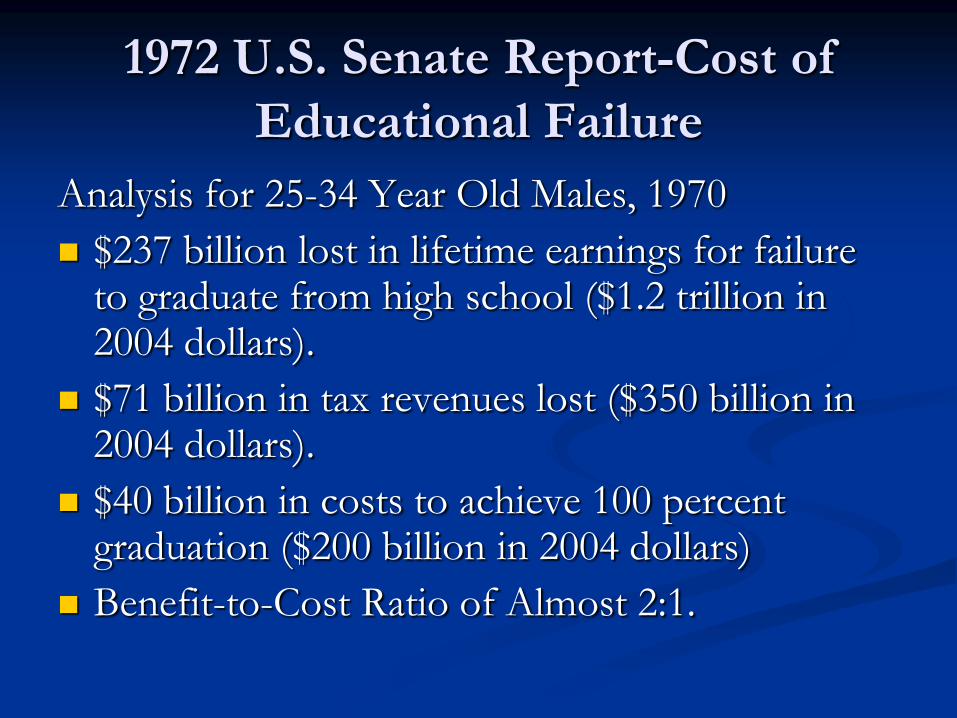
1972 U.S. Senate Report-Cost of
Educational Failure
Analysis for 25-34 Year Old Males, 1970
$237 billion lost in lifetime earnings for failure to graduate from high school ($1.2 trillion in 2004 dollars).
$71 billion in tax revenues lost ($350 billion in 2004 dollars).
$40 billion in costs to achieve 100 percent graduation ($200 billion in 2004 dollars)
Benefit-to-Cost Ratio of Almost 2:1.
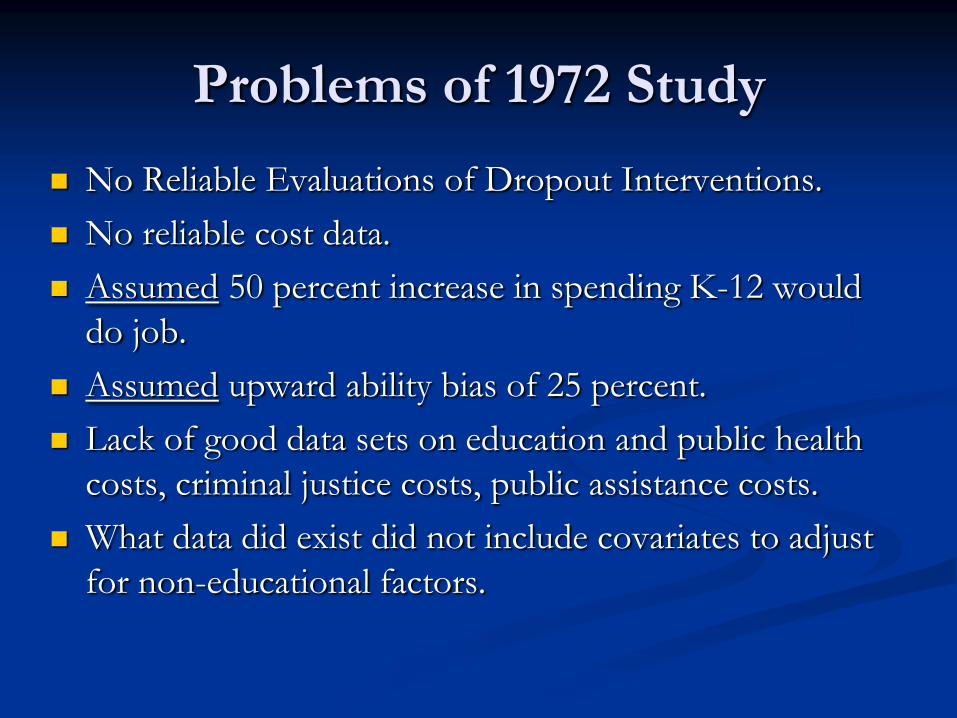
Problems of 1972 Study
No Reliable Evaluations of Dropout Interventions.
No reliable cost data.
Assumed 50 percent increase in spending K-12 would
do job.
Assumed upward ability bias of 25 percent.
Lack of good data sets on education and public health
costs, criminal justice costs, public assistance costs.
What data did exist did not include covariates to adjust
for non-educational factors.

Redux
Revisited Beginning 2004.
Research Team Colleagues:
Clive Belfield, Economics, Queens College, CUNY.
Cecilia Rouse, Economics, Princeton.
Peter Muennig, Public Health, Columbia.
Series of Studies.
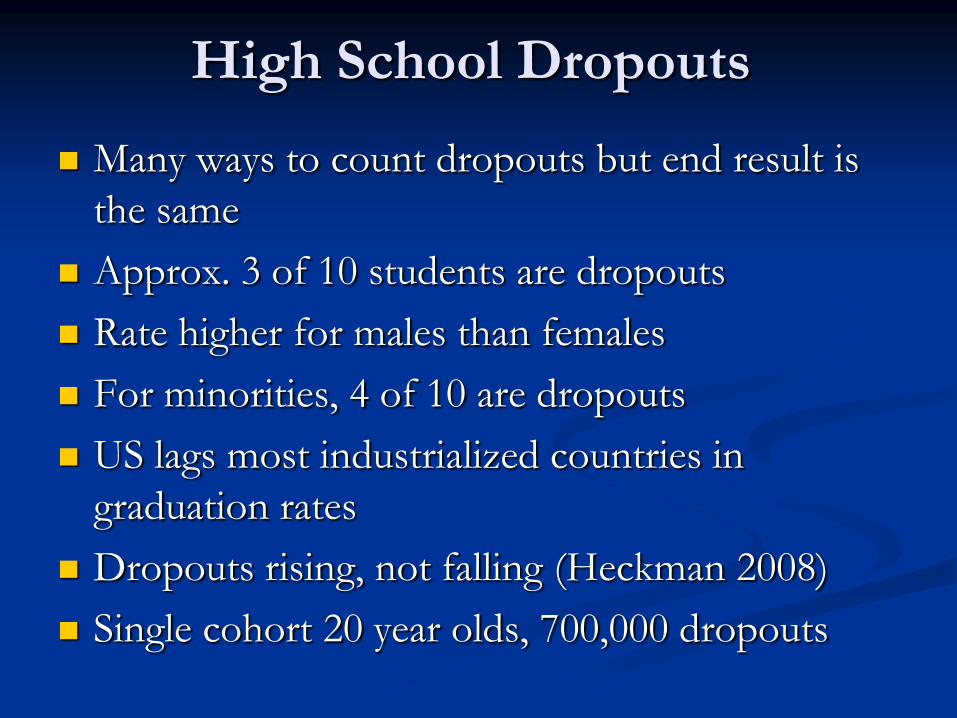
High School Dropouts
Many ways to count dropouts but end result is
the same
Approx. 3 of 10 students are dropouts
Rate higher for males than females
For minorities, 4 of 10 are dropouts
US lags most industrialized countries in
graduation rates
Dropouts rising, not falling (Heckman 2008)
Single cohort 20 year olds, 700,000 dropouts
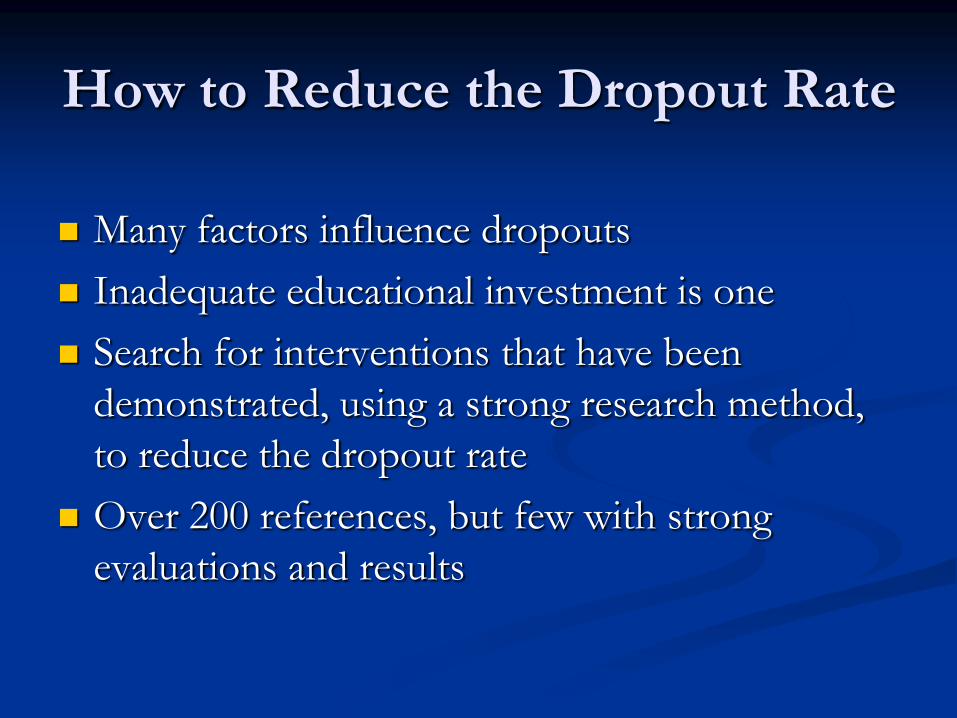
How to Reduce the Dropout Rate
Many factors influence dropouts
Inadequate educational investment is one
Search for interventions that have been
demonstrated, using a strong research method,
to reduce the dropout rate
Over 200 references, but few with strong
evaluations and results
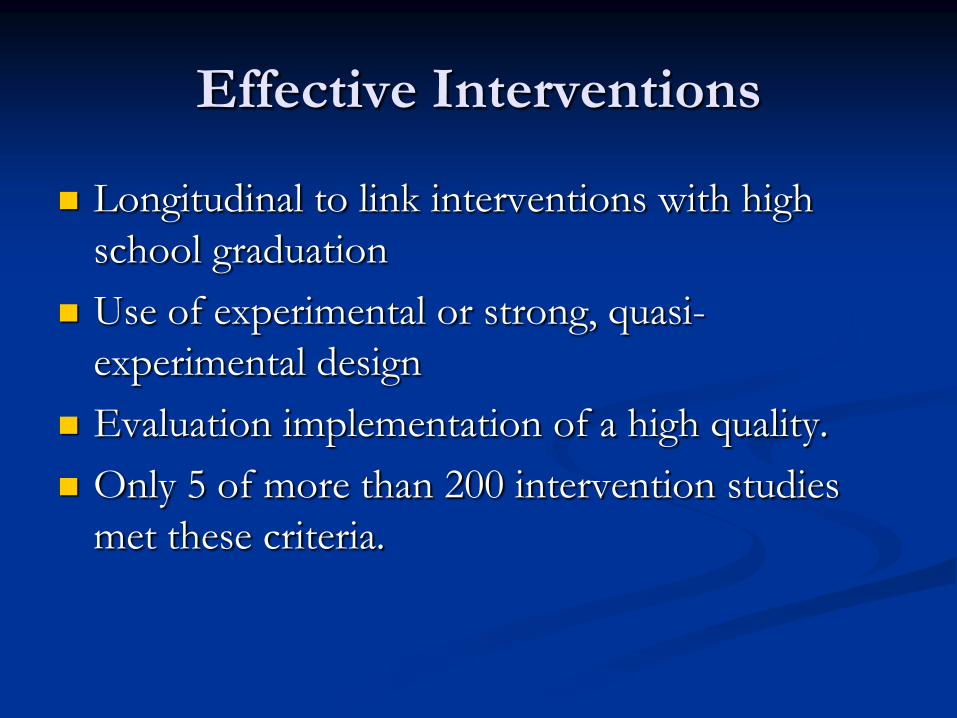
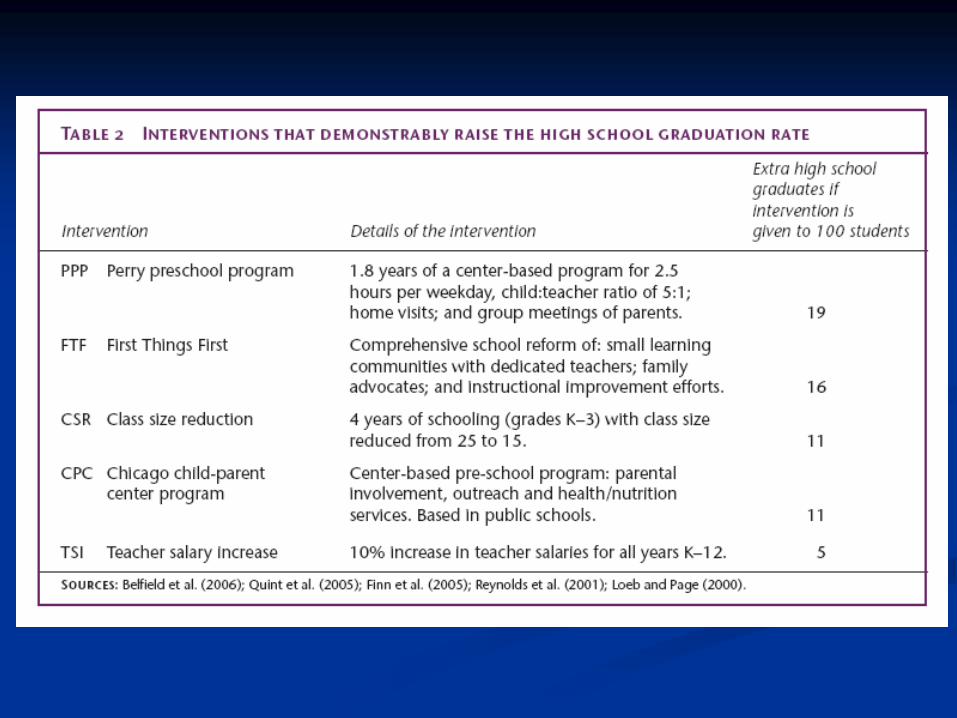
Effective Interventions
Longitudinal to link interventions with high
school graduation
Use of experimental or strong, quasi-
experimental design
Evaluation implementation of a high quality.
Only 5 of more than 200 intervention studies
met these criteria.
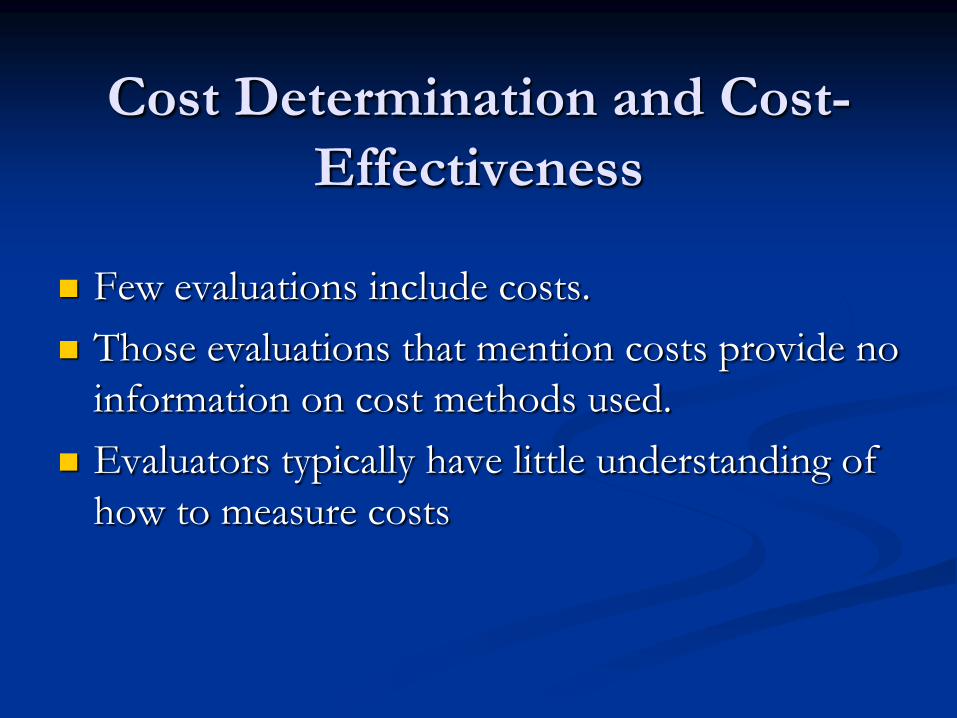
Cost Determination and Cost-
Effectiveness
Few evaluations include costs.
Those evaluations that mention costs provide no
information on cost methods used.
Evaluators typically have little understanding of
how to measure costs
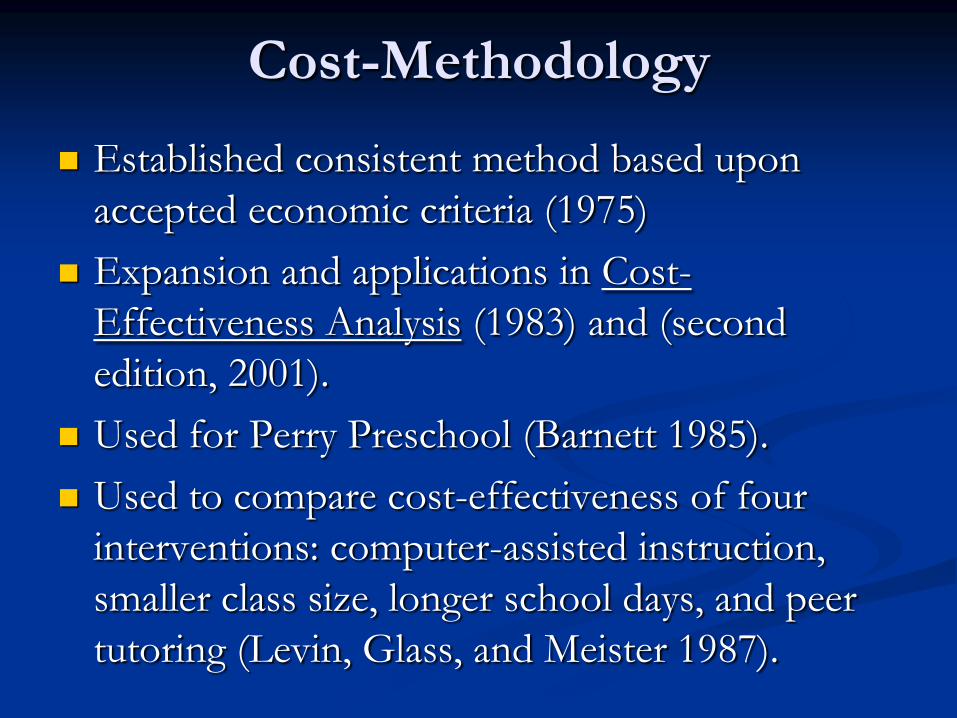
Cost-Methodology
Established consistent method based upon
accepted economic criteria (1975)
Expansion and applications in Cost-
Effectiveness Analysis (1983) and (second
edition, 2001).
Used for Perry Preschool (Barnett 1985).
Used to compare cost-effectiveness of four
interventions: computer-assisted instruction,
smaller class size, longer school days, and peer
tutoring (Levin, Glass, and Meister 1987).
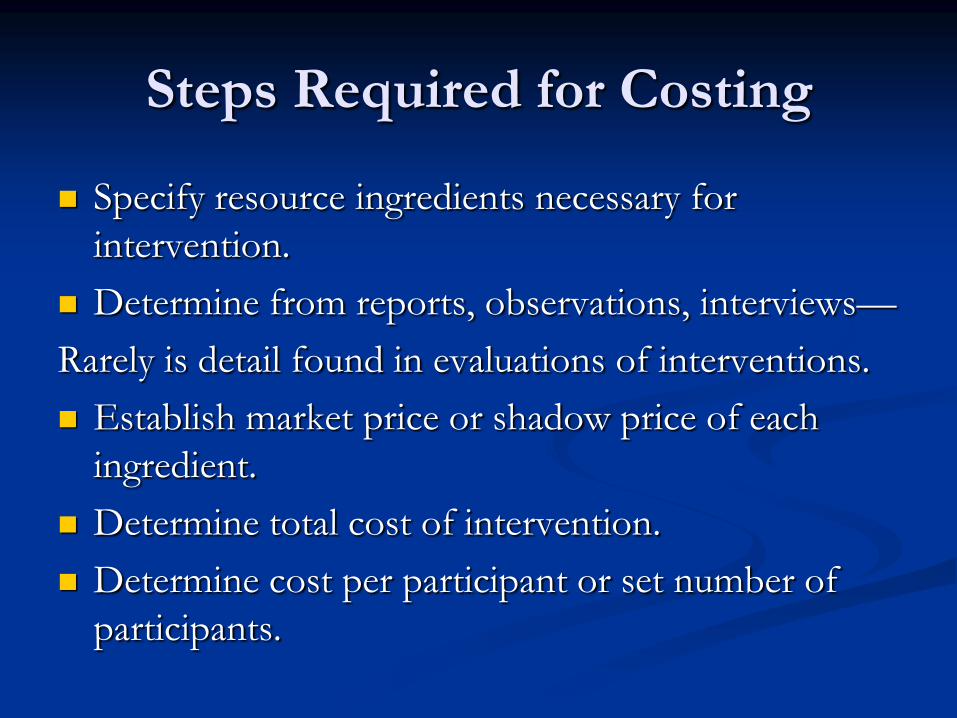
Steps Required for Costing
Specify resource ingredients necessary for
intervention.
Determine from reports, observations, interviews—
Rarely is detail found in evaluations of interventions.
Establish market price or shadow price of each
ingredient.
Determine total cost of intervention.
Determine cost per participant or set number of
participants.
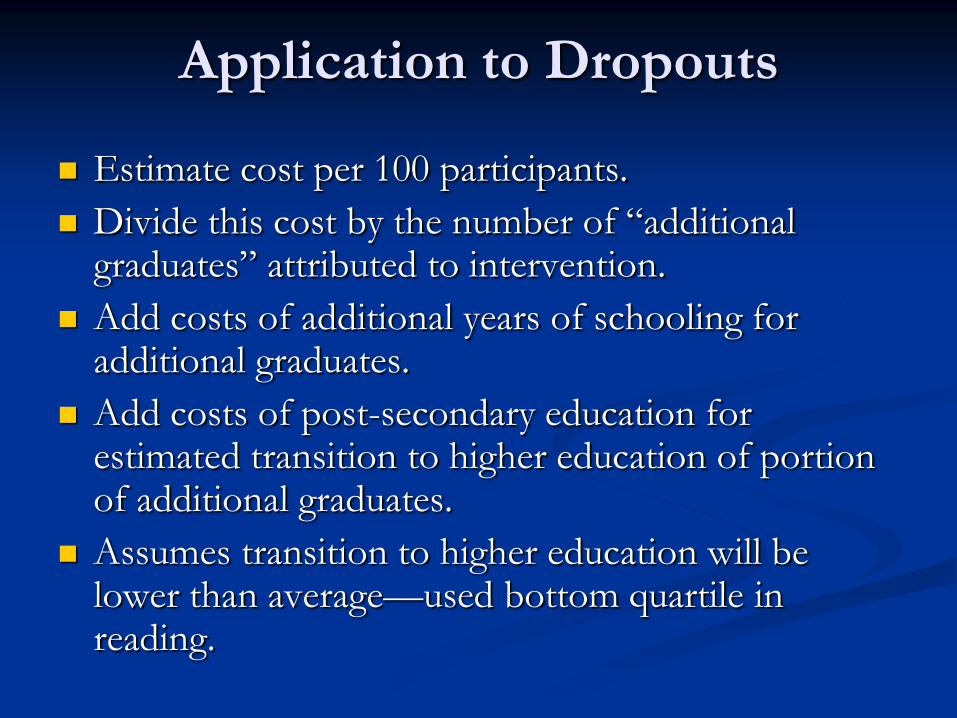
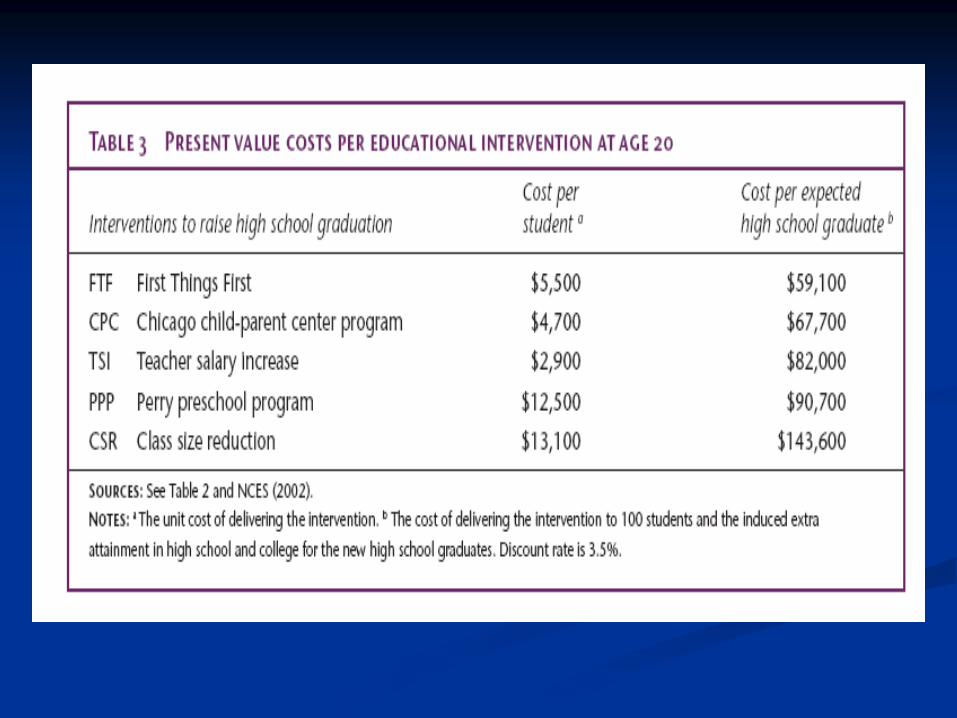
Application to Dropouts
Estimate cost per 100 participants.
Divide this cost by the number of “additional graduates” attributed to intervention.
Add costs of additional years of schooling for additional graduates.
Add costs of post-secondary education for estimated transition to higher education of portion of additional graduates.
Assumes transition to higher education will be lower than average—used bottom quartile in reading.

Present Value
Convert to present value at Age 20 of overall
investment at 3.5 percent interest rate for
comparison with benefits.
Present values of costs and benefits can be
compared directly.
Lottery example--$1 million received as $50,000
over 20 years or as lump sum.
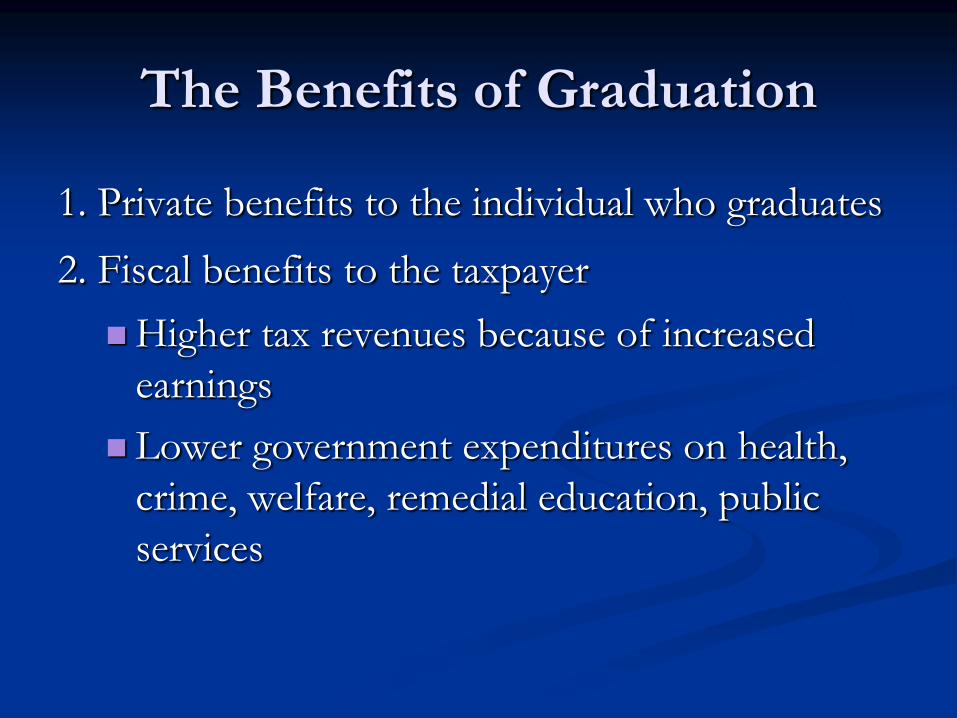
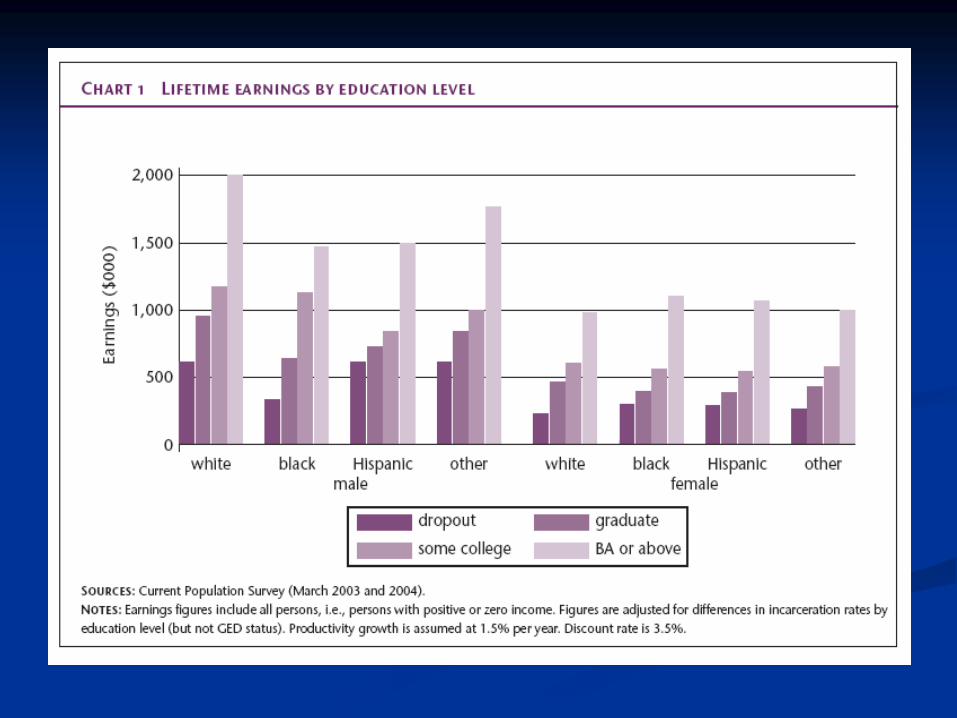
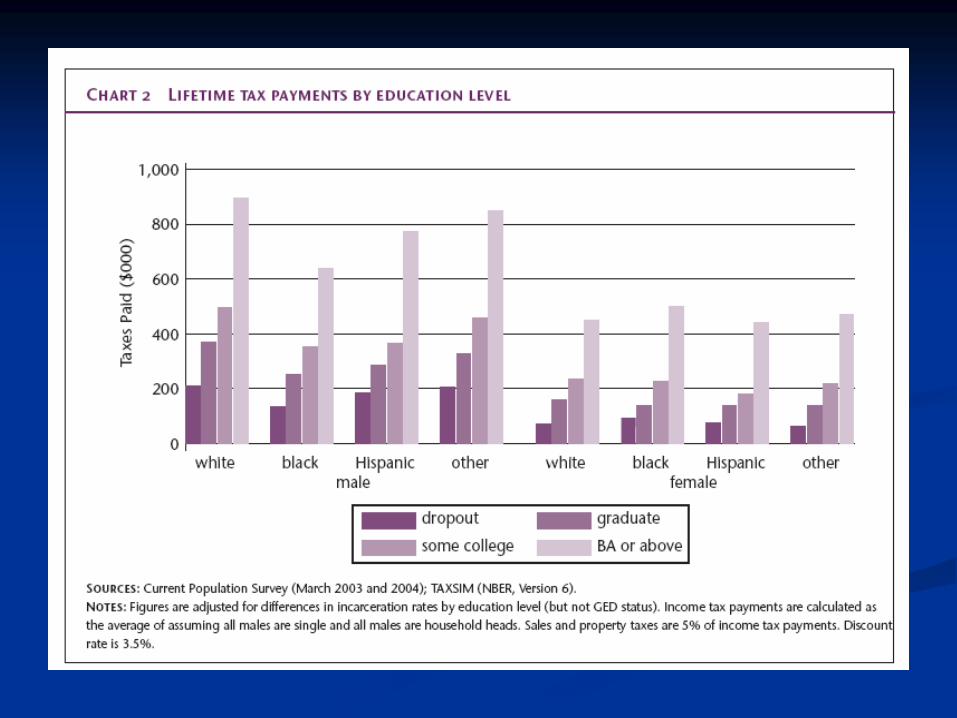
The Benefits of Graduation
1. Private benefits to the individual who graduates
2. Fiscal benefits to the taxpayer
Higher tax revenues because of increased
earnings
Lower government expenditures on health,
crime, welfare, remedial education, public
services
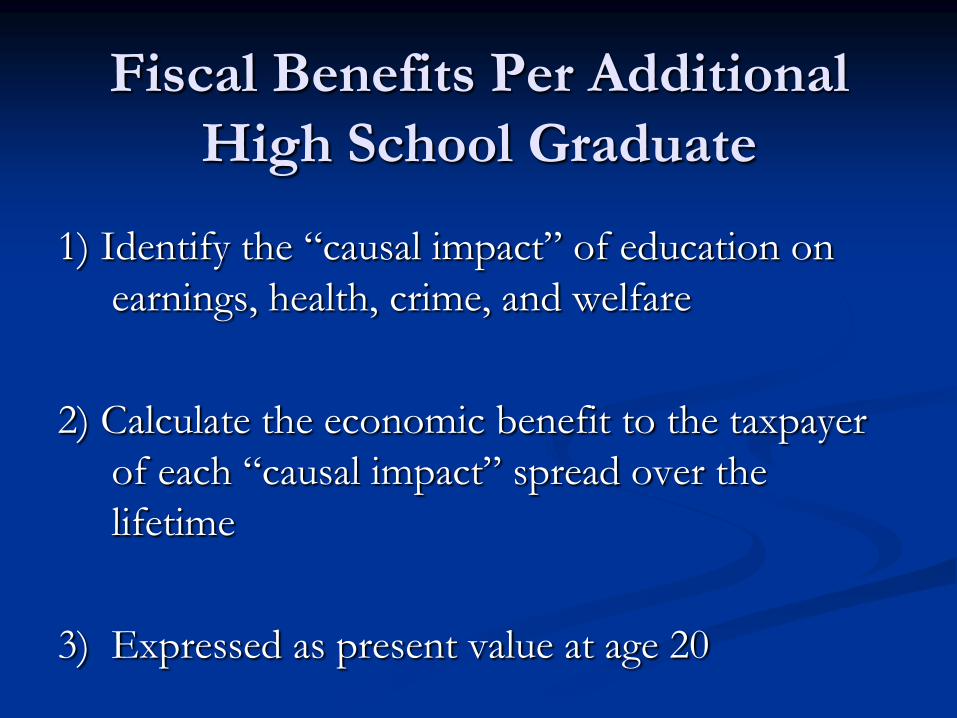
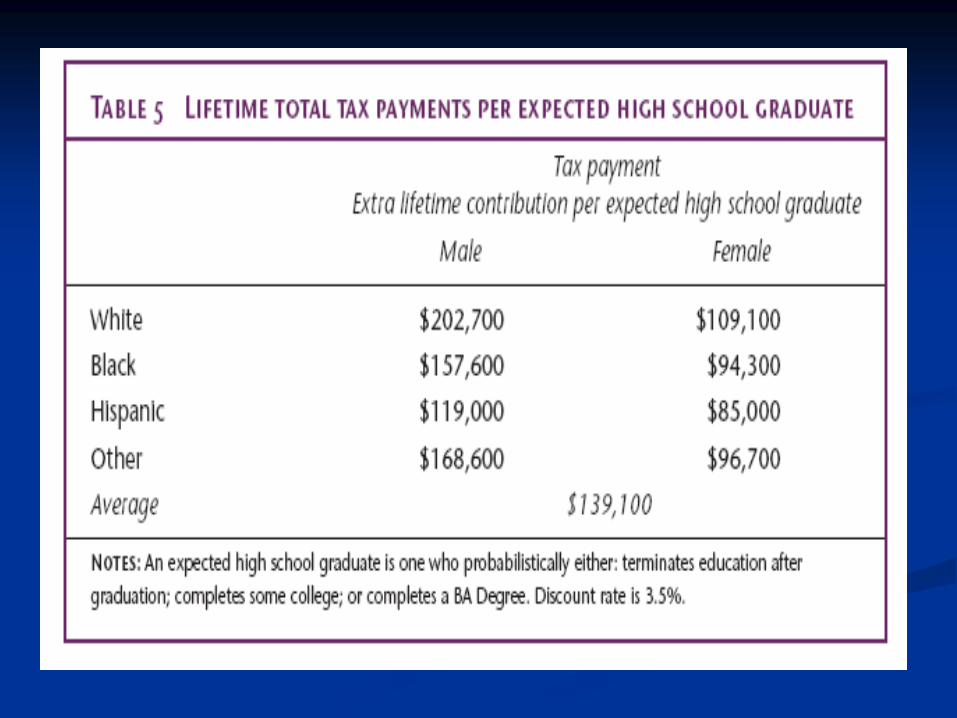
Fiscal Benefits Per Additional
High School Graduate
1) Identify the “causal impact” of education on
earnings, health, crime, and welfare
2) Calculate the economic benefit to the taxpayer
of each “causal impact” spread over the
lifetime
3) Expressed as present value at age 20
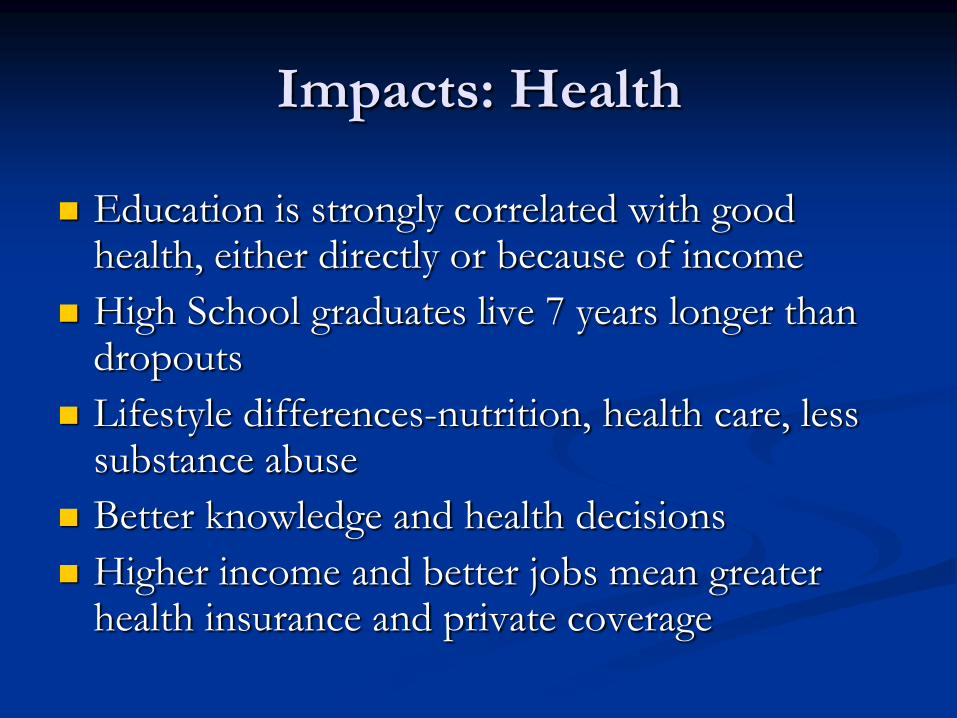
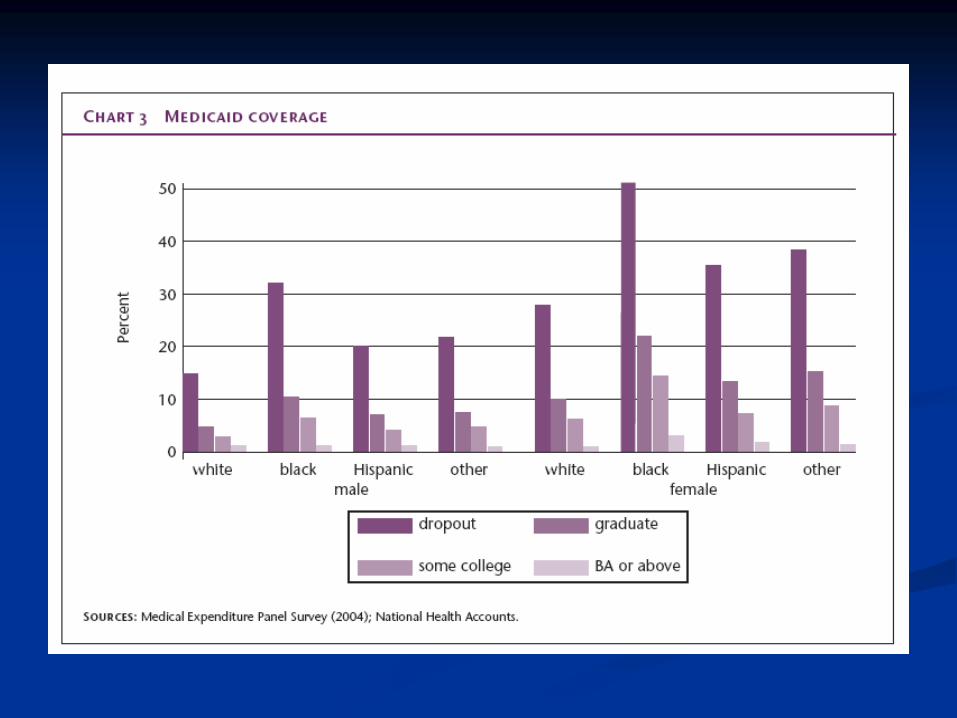
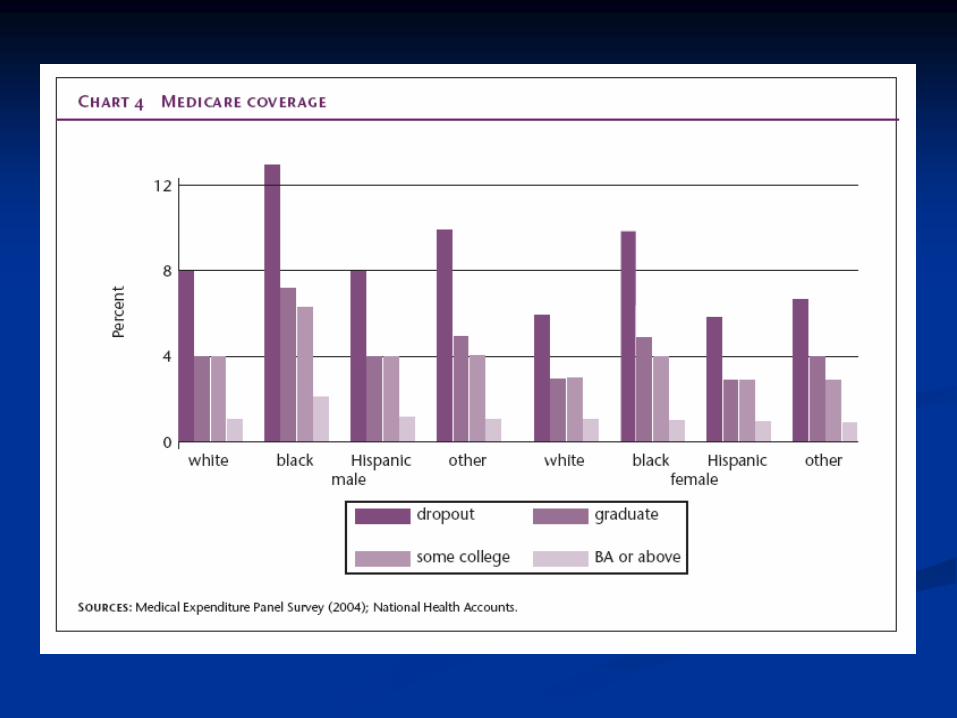
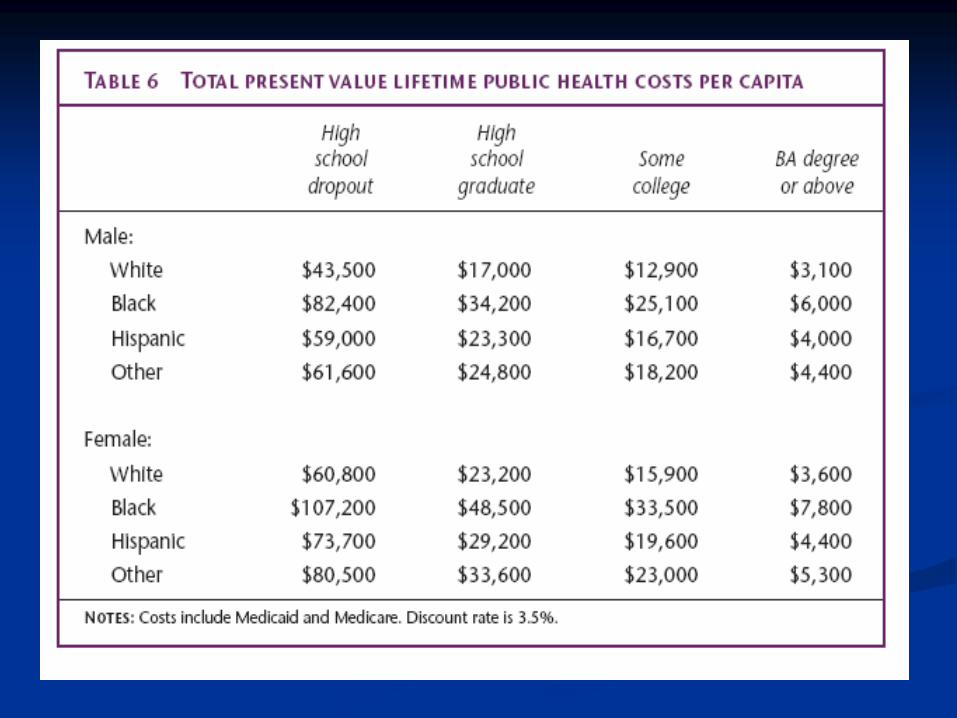
Impacts: Health
Education is strongly correlated with good health, either directly or because of income
High School graduates live 7 years longer than dropouts
Lifestyle differences-nutrition, health care, less substance abuse
Better knowledge and health decisions
Higher income and better jobs mean greater health insurance and private coverage
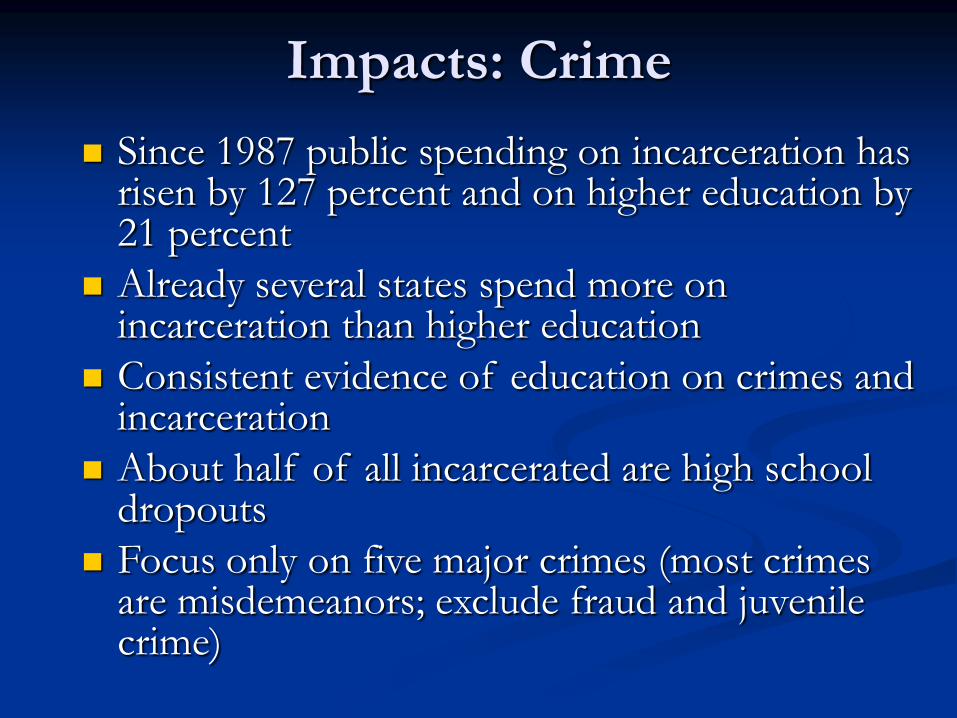
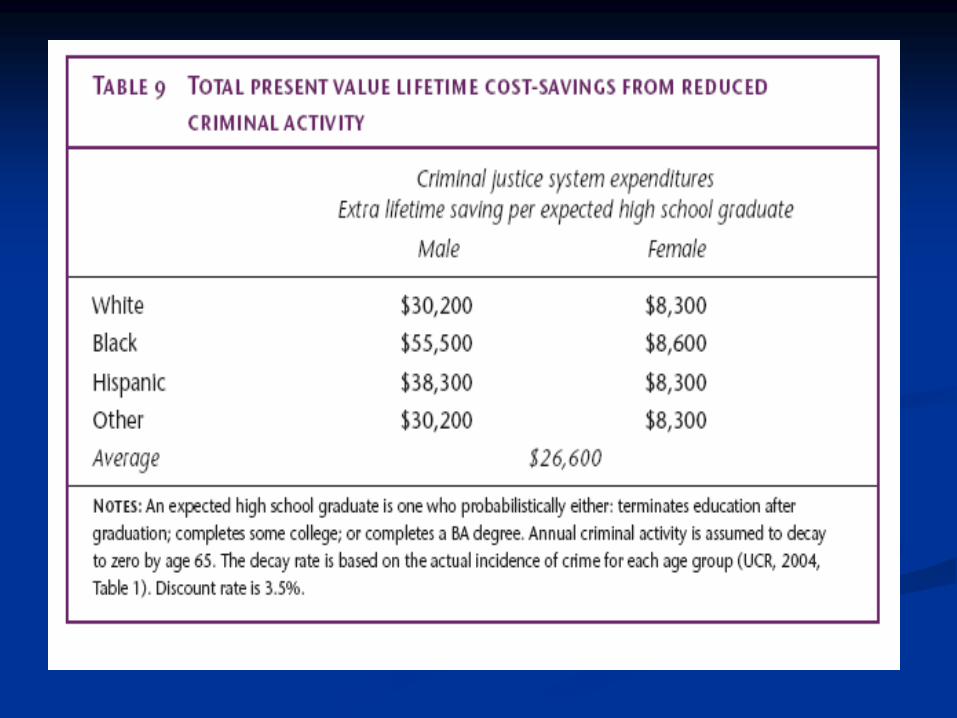
Impacts: Crime
Since 1987 public spending on incarceration has risen by 127 percent and on higher education by 21 percent
Already several states spend more on incarceration than higher education
Consistent evidence of education on crimes and incarceration
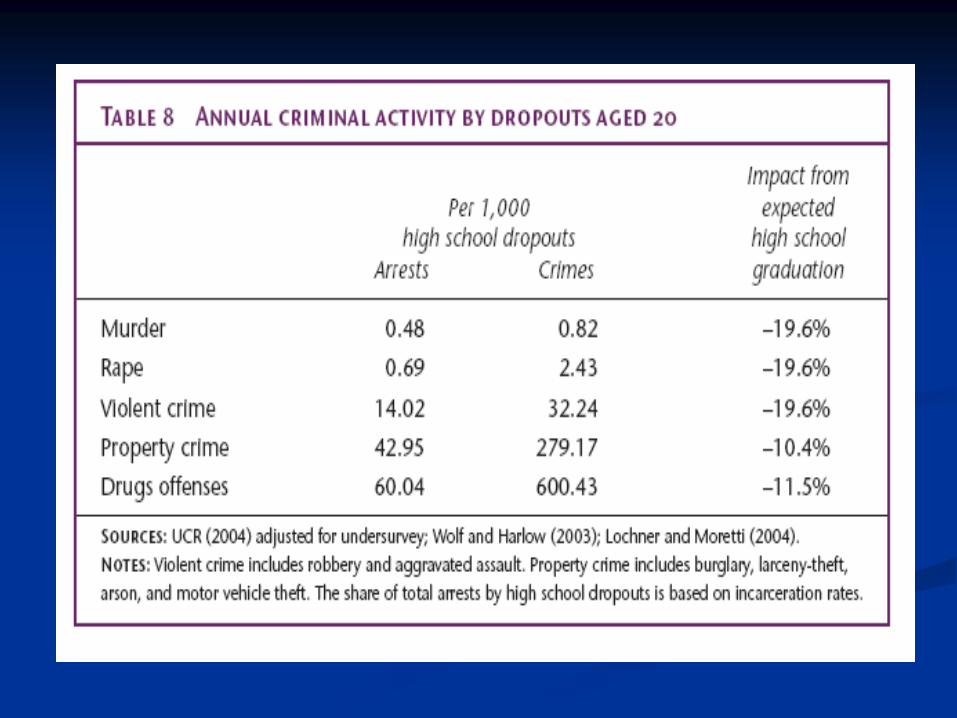
About half of all incarcerated are high school dropouts
Focus only on five major crimes (most crimes are misdemeanors; exclude fraud and juvenile crime)
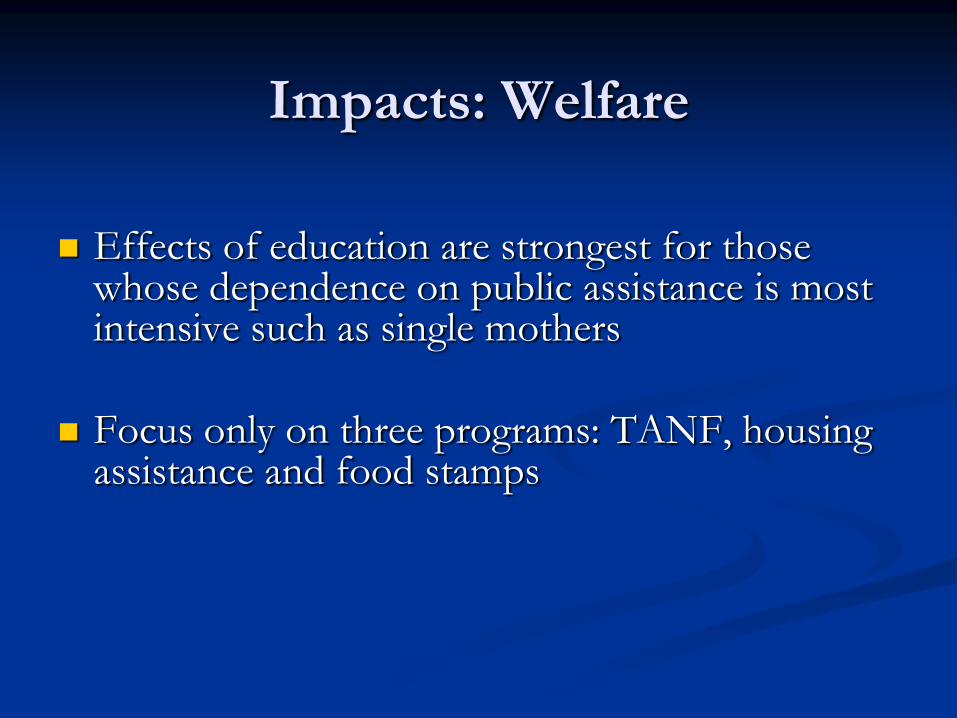
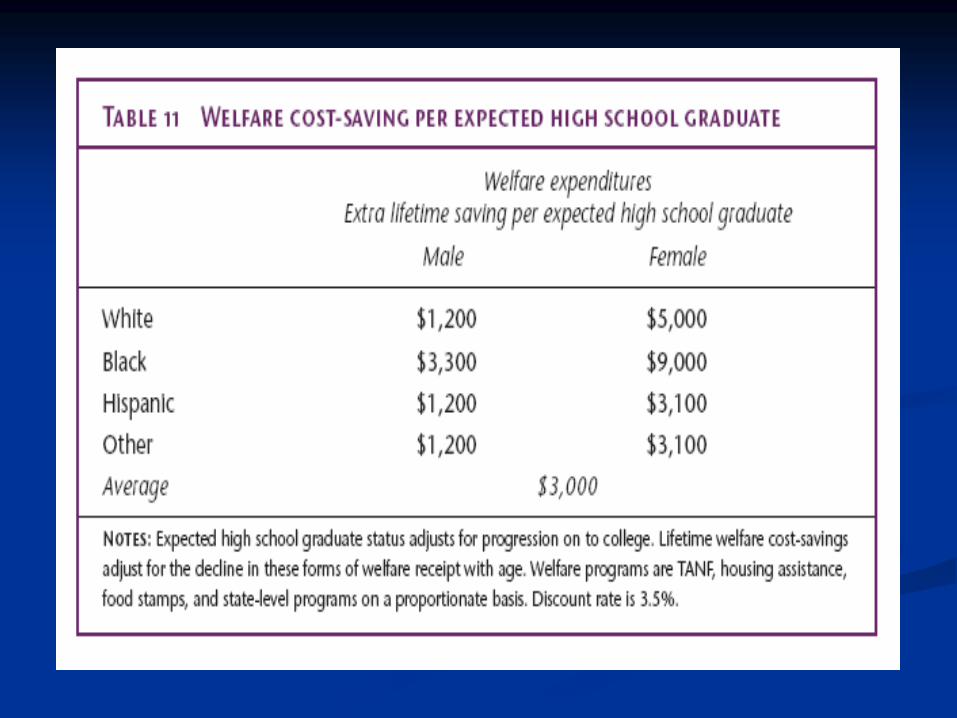
Impacts: Welfare
Effects of education are strongest for those whose dependence on public assistance is most intensive such as single mothers
Focus only on three programs: TANF, housing assistance and food stamps
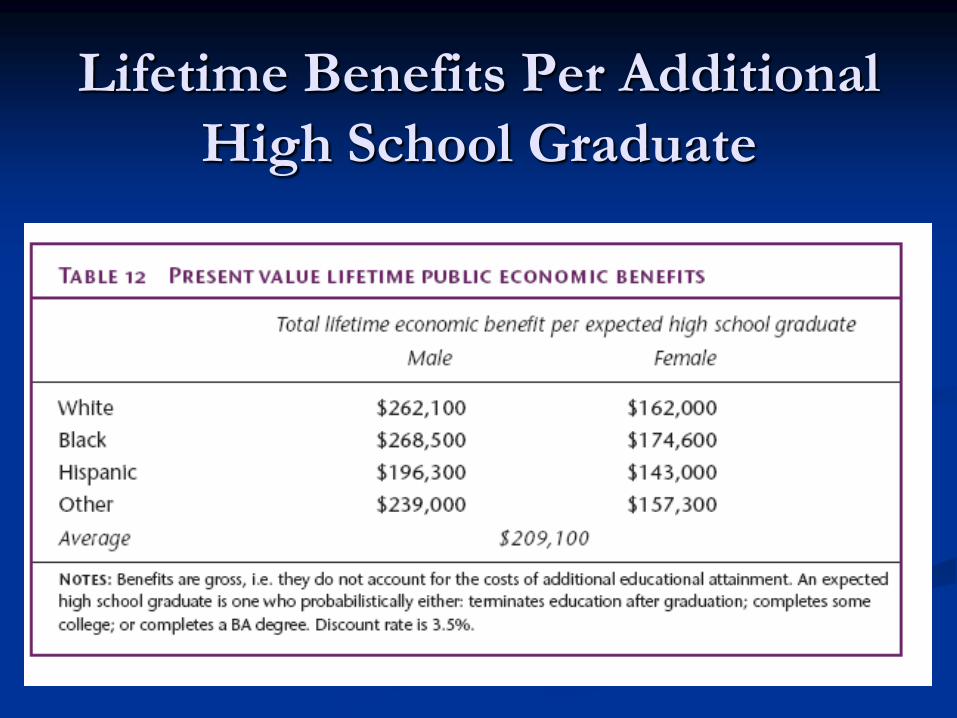
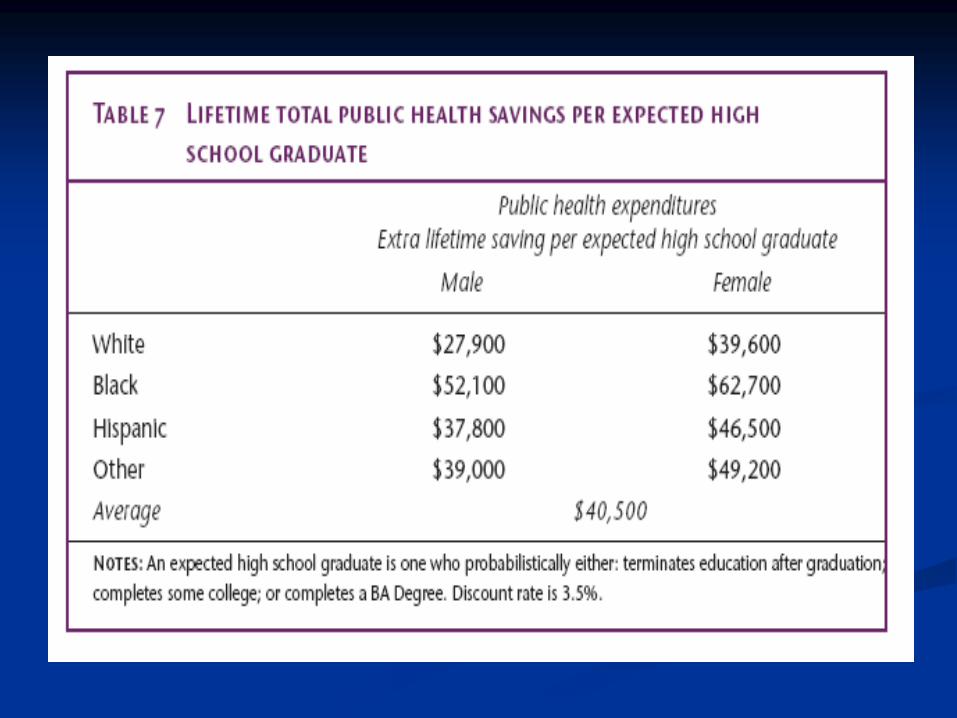
Lifetime Benefits Per Additional
High School Graduate
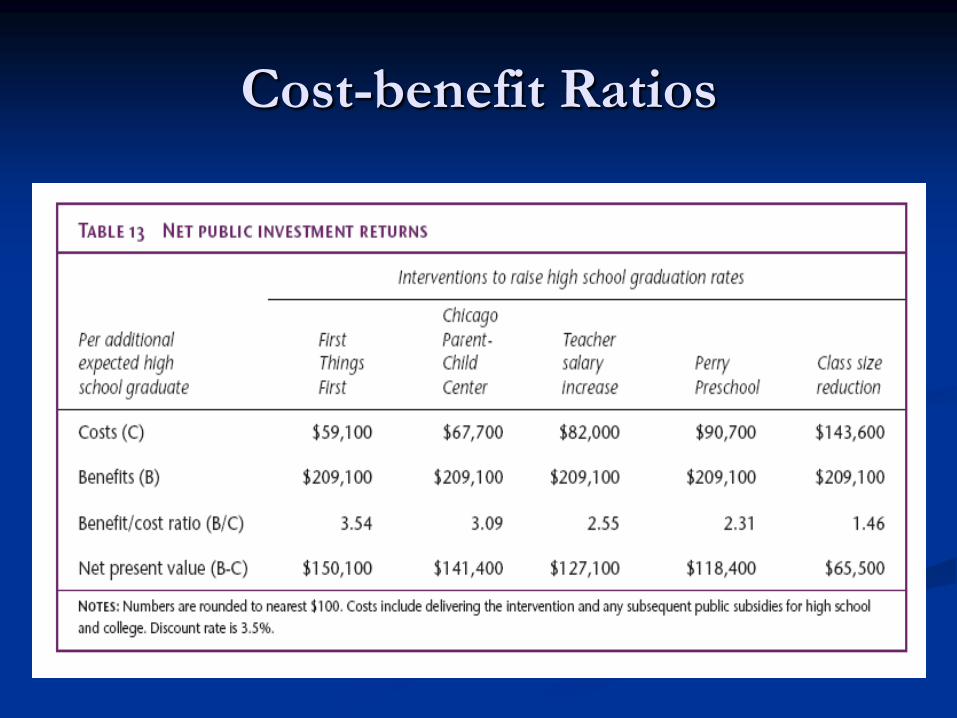
Cost-benefit Ratios
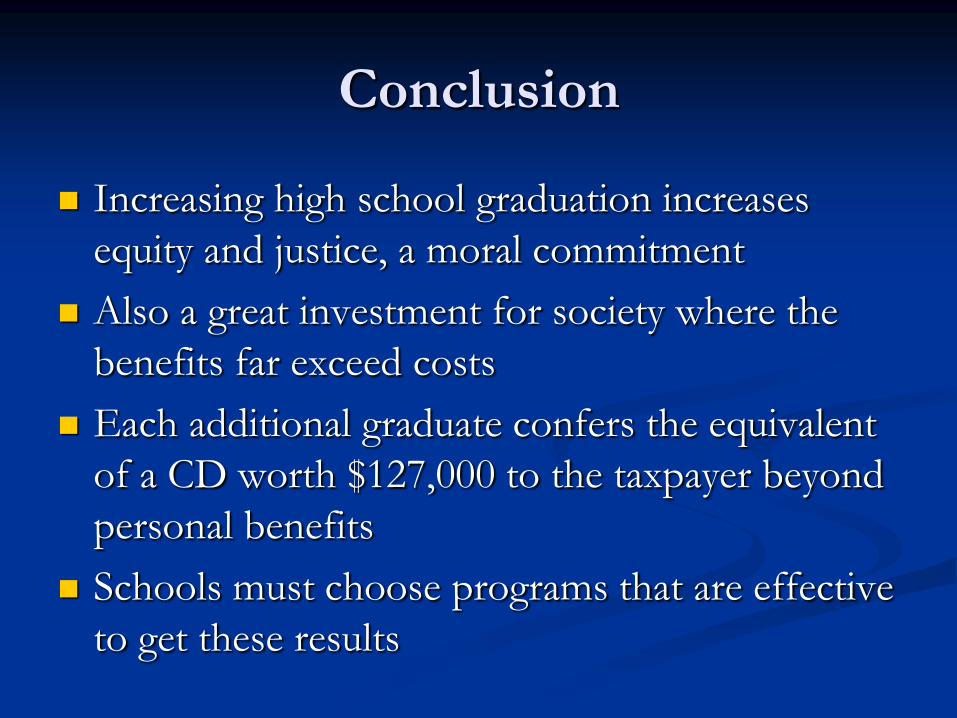
Conclusion
Increasing high school graduation increases
equity and justice, a moral commitment
Also a great investment for society where the
benefits far exceed costs
Each additional graduate confers the equivalent
of a CD worth $127,000 to the taxpayer beyond
personal benefits
Schools must choose programs that are effective
to get these results

Net Benefits Accumulate
Each cohort of 20 year olds has about 700,000
high school dropouts
If we could reduce that number by half, we
would provide a present value of $45 billion to
society
Each additional year would also add that amount
so that benefits for ten cohorts would be almost
a half-trillion dollars
Present Work
Increase number of interventions in analysis.
Few that measure HS graduation directly.
Many more that increase test scores and that
increase 9th grade course taking and passing.
Estimate impact of improvements in test scores
and/or course taking on increase in probability of
graduation.
One sigma improvement in combined
reading/math scores at eighth grade increases
probability of graduation by almost 50 percent.
Varies among groups.
Encouragement
Economic Studies Can Have Powerful Political
Impacts.
Reducing Failure has Benefits Far in Excess of
Costs.
Most Countries Have Adequate Data for
Credible Studies. (even U.S. states).
Sources of Assistance.
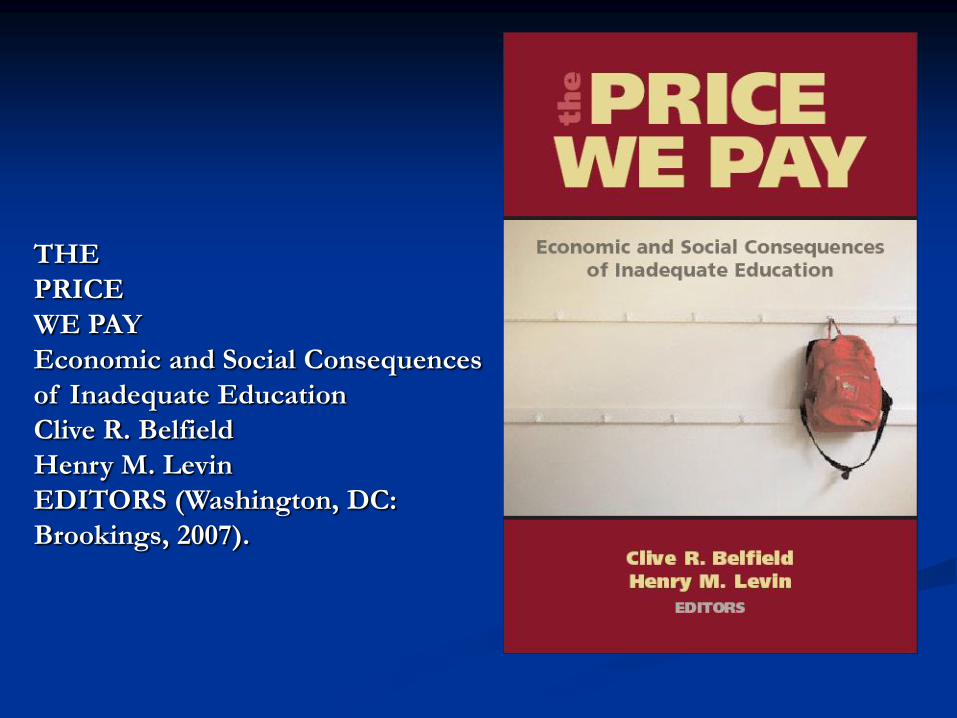
THE
PRICE
WE PAY
Economic and Social Consequences
of Inadequate Education
Clive R. Belfield
Henry M. Levin
EDITORS (Washington, DC:
Brookings, 2007).

Resources
Center for Cost-Benefit Studies in Education
20 percent discount on book
(www.cbcse.org)
Henry M. Levin, Teachers College, Columbia University