why rating agencies disagree on sovereign ratings
TRANSCRIPT
Gutenberg School of Management and Economics
& Research Unit “Interdisciplinary Public Policy”
Discussion Paper Series
Why Rating Agencies Disagree on Sovereign Ratings
Bernhard Bartels
December 2014
Discussion paper number 1416
Johannes Gutenberg University Mainz Gutenberg School of Management and Economics
Jakob-Welder-Weg 9 55128 Mainz
Germany wiwi.uni-mainz.de
All discussion papers can be downloaded from http://wiwi.uni-mainz.de/DP
Contact details
Bernhard Bartels Department of Economics Johannes-Gutenberg-Universität Mainz Jakob-Welder-Weg 9 55128 Mainz [email protected]

Why Rating Agencies Disagree on Sovereign Ratings∗
Bernhard Bartels †
December 2, 2014
Working Paper
Abstract
We empirically analyze why rating agencies disagree on countries' default risk. Speci�cally,
we explore the sovereign ratings of four agencies and their interaction. Our results indicate
that the frequency of split ratings and their lopsidedness is not related to their home
region. We nevertheless �nd that rating agencies treat world regions di�erently. The
Big Three rating agencies tend to follow each other predominantly in times of crises. The
smaller European agency seems to be more independent but also more volatile in its rating
behaviour.
JEL Classi�cation: E62, F34
Keywords: Sovereign Risk, European Rating Agency, Rating Agencies
∗I would like to thank Feri Rating and Research GmbH for the provision of their ratings. I have further ben-e�ted from helpful comments from Constantin Weiser, Thomas Apolte, Frank Smets, Isabel Schnabel, PhilippHarms, Beatrice Weder di Mauro and seminar participants of the Brown Bag Seminar, the 3rd IWH/INFERWorkshop on Applied Economics and Economic Policy in Halle and the European Economic Association AnnualMeeting in Toulouse.†Bernhard Bartels, Johannes Gutenberg-University Mainz, Economics Department, Jakob-Welder-Weg 4,
55128 Mainz, Email: [email protected]
1

1 Introduction
The recent �nancial crisis has evoked a revival of the discussion about the role of Credit Rating
Agencies (CRAs). During the sovereign debt crisis in Europe, the so called Big Three rating
agencies Standard & Poor's, Moody's and Fitch Ratings started to downgrade several euro
area economies and even assigned junk status to Ireland, Portugal and Greece. The sudden
decline of trust in the solvency of European economies led many politicians to claim that the
Big Three did either not realize the true credit risk or that their decisions were biased by
political in�uence.1
Also, the academic literature has contributed to this debate: For instance, Gaertner et al.
(2011) �nd that ratings in selected euro area economies between 2009 and 2010 ranked 2.3
notches below a hypothetical rating for a country outside the monetary union with the same
economic fundamentals. Ferri et al. (1999) show that ratings have been pro-cyclical during
the Asian crisis, thereby amplifying the recessions in a�ected countries. Add to this, empir-
ical results by Fuchs and Gehring (2013) reveal that sovereign ratings are subject to a home
bias. Comparing the behaviour of nine agencies, the authors �nd that cultural and economic
ties of a respective agency's and its major stockholders' origin have a signi�cant impact on a
country's sovereign rating.
At the same time, the literature on determinants of sovereign credit ratings shows that large
parts of the variation can be explained with few macroeconomic variables (see for instance
Cantor and Packer (1996)). In a related panel analysis for sovereign ratings between 1995 and
2005, Afonso et al. (2011) �nd that their model (including a set of macroeconomic, political
and regional variables) correctly predicts 75 percent of the ratings (within one notch varia-
tion) despite the fact that expectations for future economic development or other qualitative
assessments are not taken into account by the respective agency.
Thus, empirical evidence towards the adequacy of sovereign ratings appears to be mixed: In
general, ratings seem to quite well re�ect the credit risk of a country, however, during times
1see Handelsblatt (January 17, 2012): "The myth of the U.S. conspiracy"
2
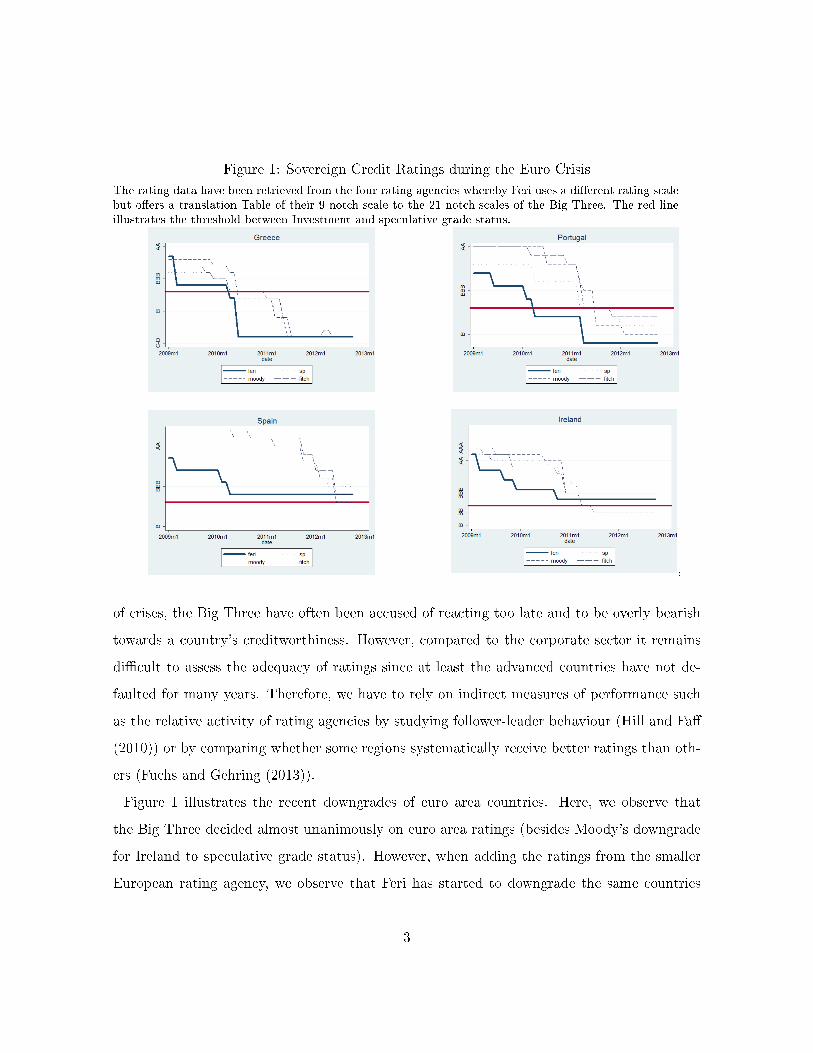
Figure 1: Sovereign Credit Ratings during the Euro Crisis
The rating data have been retrieved from the four rating agencies whereby Feri uses a di�erent rating scalebut o�ers a translation Table of their 9-notch-scale to the 21-notch-scales of the Big Three. The red lineillustrates the threshold between Investment and speculative grade status.
,
of crises, the Big Three have often been accused of reacting too late and to be overly bearish
towards a country's creditworthiness. However, compared to the corporate sector it remains
di�cult to assess the adequacy of ratings since at least the advanced countries have not de-
faulted for many years. Therefore, we have to rely on indirect measures of performance such
as the relative activity of rating agencies by studying follower-leader behaviour (Hill and Fa�
(2010)) or by comparing whether some regions systematically receive better ratings than oth-
ers (Fuchs and Gehring (2013)).
Figure 1 illustrates the recent downgrades of euro area countries. Here, we observe that
the Big Three decided almost unanimously on euro area ratings (besides Moody's downgrade
for Ireland to speculative grade status). However, when adding the ratings from the smaller
European rating agency, we observe that Feri has started to downgrade the same countries
3
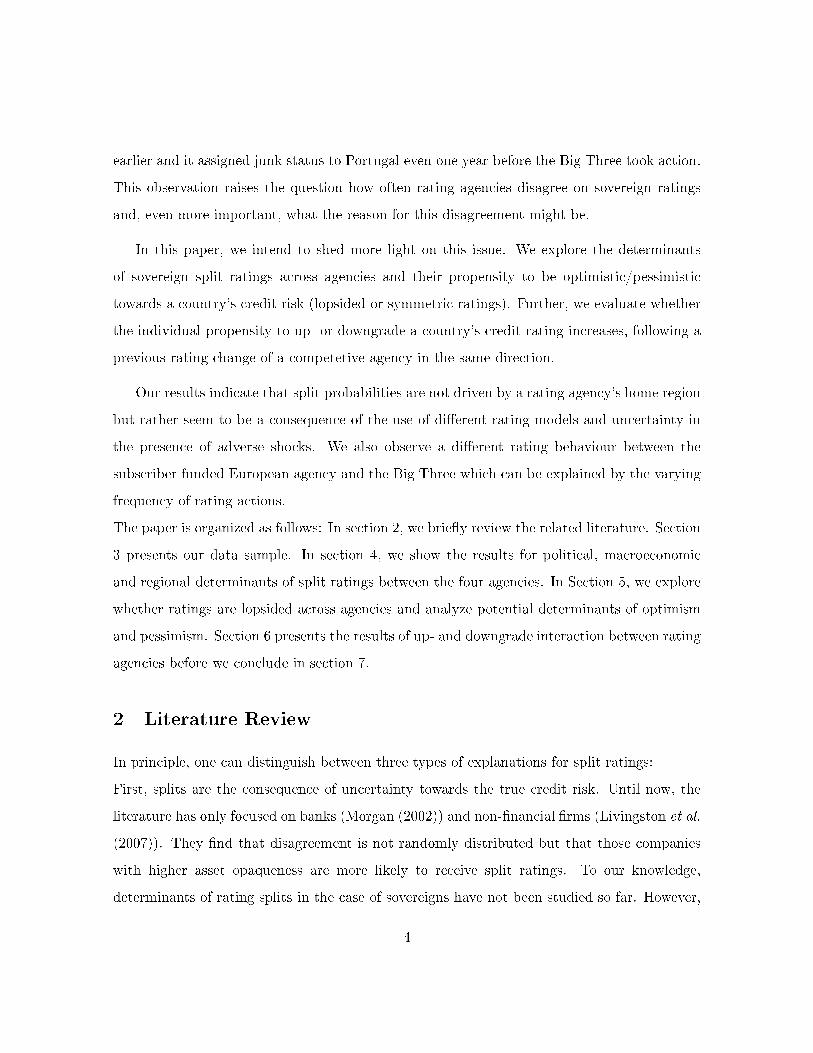
earlier and it assigned junk status to Portugal even one year before the Big Three took action.
This observation raises the question how often rating agencies disagree on sovereign ratings
and, even more important, what the reason for this disagreement might be.
In this paper, we intend to shed more light on this issue. We explore the determinants
of sovereign split ratings across agencies and their propensity to be optimistic/pessimistic
towards a country's credit risk (lopsided or symmetric ratings). Further, we evaluate whether
the individual propensity to up- or downgrade a country's credit rating increases, following a
previous rating change of a competetive agency in the same direction.
Our results indicate that split probabilities are not driven by a rating agency's home region
but rather seem to be a consequence of the use of di�erent rating models and uncertainty in
the presence of adverse shocks. We also observe a di�erent rating behaviour between the
subscriber funded European agency and the Big Three which can be explained by the varying
frequency of rating actions.
The paper is organized as follows: In section 2, we brie�y review the related literature. Section
3 presents our data sample. In section 4, we show the results for political, macroeconomic
and regional determinants of split ratings between the four agencies. In Section 5, we explore
whether ratings are lopsided across agencies and analyze potential determinants of optimism
and pessimism. Section 6 presents the results of up- and downgrade interaction between rating
agencies before we conclude in section 7.
2 Literature Review
In principle, one can distinguish between three types of explanations for split ratings:
First, splits are the consequence of uncertainty towards the true credit risk. Until now, the
literature has only focused on banks (Morgan (2002)) and non-�nancial �rms (Livingston et al.
(2007)). They �nd that disagreement is not randomly distributed but that those companies
with higher asset opaqueness are more likely to receive split ratings. To our knowledge,
determinants of rating splits in the case of sovereigns have not been studied so far. However,
4
looking at the frequency of rating splits (see section 2), it seems that rating agencies have
di�erent views on a country's default risk. These may be attributed to the use of di�erent
rating models or uncertainty in times of adverse shocks. For instance, one agency may put
more weight on the default history and public debt ratio of a country whereas another primarily
considers the economic well-being and political stability. Taking into account the empirical
�ndings during times of crises, one may also contemplate whether the frequency of split ratings
increases when a country is subject to adverse shocks.
Second, prior studies have discussed whether di�erent business models among rating agen-
cies can be a reason for split ratings. Using corporate bond ratings from 1999 to 2013 Bruno
et al. (2013) �nd that a subscriber funded rating agency (Egan-Jones Rating Company) pro-
vides more rating updates than a rating agency that uses the issuer-pays model (Big Three
agencies). This observation is robust to the registration of Egan-Jones as a National Recog-
nized Statistical Rating Organization (NRSRO) in 2007. The authors conclude that the rat-
ing behaviour is thus driven by di�erent business models (issuer-pays vs. subscriber funded).
Bhattacharya et al. (2014) �nd that Egan-Jones provides not only more rating updates but
also a higher rating quality suggesting that subscriber-funded agencies are even better suited
to act in the best interest of investors. In case of sovereign ratings it is more di�cult to
measure the rating performance due to a lack of defaults. However, issuer-paid agencies may
be acting in the home country's interest in order to keep their mandate whereas subscriber
funded companies should be primarily interested in satisfying their customers.2
Third, split ratings can be the consequence of a rating agency's inclusion in regulatory
frameworks. Many studies �nd that decisions by the Big Three have an impact on bond
rates (Gaertner et al. (2011), Afonso et al. (2012), Alsakka and ap Gwilym (2010), Candelon
et al. (2011)) and stock prices. That is to say, interest rates often follow rating decisions.3
One may suggest that a part of the causal relationship is driven by the quasi-automatic
2Only a limited number of the Big Three ratings are unsolicited (26.6%). In our dataset, we �nd nosigni�cant di�erence across rating agencies between unsolicited and solicited ratings for one particular country.
3Some of those studies �nd that the relationship is bi-directional.
5

impact on bond rates and stock prices via the inclusion of external ratings in regulatory
frameworks: According to the Basel rules, institutional investors (pension funds, insurance
companies etc.) are required to hold a �xed share of investment grade rated bonds in their
portfolio. The decision of a rating agency to downgrade a country close to (or even to)
junk status, might prompt investors to sell the respective bonds just to comply with the
established rules.4 Consequently, if ratings are included in regulation, a respective CRA may
have incentives to follow the decisions of other regulated competitors due to the expected e�ect
of a rating change on interest rates.
Moreover, CRAs whose ratings are used by regulators may have incentives to be reluctant
towards sovereign downgrades when they use sovereign ceiling policies which compel rating
agencies not to assign a better rating to a �rm than to the sovereign (Borensztein et al. (2013)).
Adelino and Ferreira (2014) �nd that the downgrades of banks due to sovereign ceiling policies
have signi�cant negative e�ects on bank lending. This may lead rating agencies to be reluctant
towards changes in sovereign credit risk. However, if one of the Big Three agencies takes the
�rst step, competitors are incentivized to follow this decision due to expected repercussions
on the country's credit risk. On the contrary, a smaller CRA has a higher degree of �exibility
(it rates fewer big issuers like large banks and corporates (Bhattacharya et al. (2014))) and
may thus have less concern to change a country's rating.
We contribute to the literature by exploring major determinants of split ratings for
sovereigns across the four agencies. In particular, we investigate three hypotheses why split
ratings for countries may exist:
(1) Split ratings for sovereigns can be explained by model uncertainty when rating agencies
measure default risk di�erently, especially in the presence of large adverse shocks to credit
risk.
(2) Conditional on the place of residence and the ownership, rating agencies assign better
ratings to their home region (given the economic and political environment of countries).
4Investors do not necessarily rely on the rules of this standardized approach if they use the internal riskbased approach (IRB).
6
(3) The inclusion of ratings into regulatory frameworks leads to a more reluctant stance of the
respective agency towards downgrades because it fears more far-reaching consequences than
intended such as accompanying downgrades of bank ratings and rising interest rates. This
in turn increases the tendency of agencies to follow competitors if these assign a downgrade
previously.
3 Data and Stylized Facts
In this paper, we use monthly sovereign ratings from the Big Three rating agencies and from
Feri AG, Germany's largest non-bank advisor/asset manager for private and institutional
assets.5
Exploring these data, we obtain a sample of 54 countries with monthly rating actions ranging
from June 1999 to October 2012. The sample comprises 23 industrial countries and 31 emerging
market economies and the total number of monthly observations for each rating agency is 9,016
(except for Fitch with 8,929 country-month observations).6 During our sample period of 13
years, we observe between 169 (Moody's) and 393 (Feri) rating changes. For robustness checks,
we also consider watch and outlook decisions by the Big Three.
One part of the analysis will use annual data due to the fact that political and economic
variables are only available on a yearly basis. The dataset entails 702 (except for Fitch with
695) rating observations by using end-of-year ratings in the analyses. As robustness checks,
we also computed our results by using yearly rating averages.
We start by mapping the alphabetical notches into numerical values in order to perform
statistical analyses.7 A 17 maps the best rating (AAA or AAa) and a 1 the worst (D/D/C).
Therefore, lower values indicate a higher default probability. The Big Three ratings have 22
notches when using a linear scale.8 Feri uses 11 notches and provides a translation Table for
5see homepage of Feri AG at http://www.feri.de/en/company/portrait/6see list of countries in Table 15 of the appendix7see Table 16 in the appendix8We follow Güttler and Wahrenburg (2007) and Afonso et al. (2011) in restricting the scale to 17 values
since there are few observations in the lowest range
7
comparison with the Big Three. We apply this transformation.9 The dividing line between
investment grade and speculative grade on Feri's scale is between C and D, for S&P and Fitch
the dividing line is between BBB- and BB+ and for Moody's it runs between the Baa3 and
Ba1.
In order to compare rating di�erences across CRAs, the most convenient approach would be
to use the transformation in Table 16. However, we cannot ensure that the values in the
provided diagram by Feri are perfectly comparable. For instance, we are not able to verify
that a letter B+ on the Feri scale is comparable to the letter A on the Big Three scale. For that
reason, we decided to classify the rating scales into broader categories as to ensure a better
comparability. In the roughest classi�cation we distinguish between three classes (see Table 1):
First, we separate the best possible rating category (AAA) from those ratings considered as
investment grade (while lower than AAA). The third category entails country-year observations
with speculative grade ratings. In the authors' opinion, this approach has two advantages:
First, we ensure that ratings are better comparable across agencies and second, the balanced
number of ratings in each category enables us to exploit di�erences in the rating behaviour
among industrialized countries (AAA/ investment grade) and emerging markets (investment
grade/ speculative grade). A more segmented classi�cation is provided in Table 17 of the
appendix and has been used for our mean-comparison tests in section 5.
Table 2 shows the absolute numbers of split ratings across the agencies. Here, all four
agencies agreed in more than 50 percent of the sample (396/702). Feri has relatively often
disagreed with the ratings of the Big Three (200-300/702) whereas we observe a split across
the Big Three only in every �fth case (105/702). The numbers remain broadly the same if
we use yearly averages instead of year-end values and they indicate that Feri has more often
deviated from the assessments of the Big Three than the latter to each other. Consequently,
one might suggest that Feri's ratings are more independent compared to those by the Big
9see Feri press release on country ratings: http://frr.feri.de/�les/documents/fer/press/2010-06-07_FER_PM_0.pdf
8
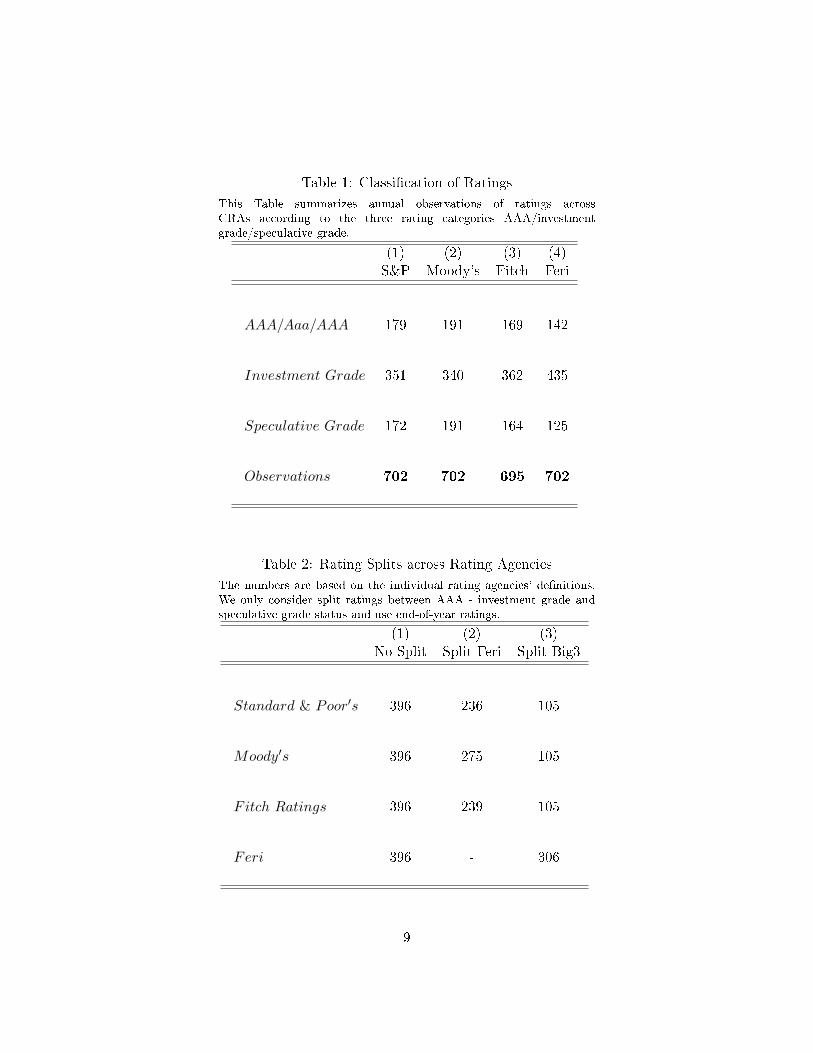
Table 1: Classi�cation of Ratings
This Table summarizes annual observations of ratings acrossCRAs according to the three rating categories AAA/investmentgrade/speculative grade.
(1) (2) (3) (4)S&P Moody's Fitch Feri
AAA/Aaa/AAA 179 191 169 142
Investment Grade 351 340 362 435
Speculative Grade 172 191 164 125
Observations 702 702 695 702
Table 2: Rating Splits across Rating Agencies
The numbers are based on the individual rating agencies' de�nitions.We only consider split ratings between AAA - investment grade andspeculative grade status and use end-of-year ratings.
(1) (2) (3)No-Split Split Feri Split Big3
Standard & Poor′s 396 236 105
Moody′s 396 275 105
Fitch Ratings 396 239 105
Feri 396 - 306
9
Three. However, the results give no indication of whether the observed di�erences are region-
speci�c or randomely distributed. We will shed more light on this issue in the next section.
4 Determinants of Split Ratings
We now turn to show how often rating agencies disagree on a region's rating in order to �nd
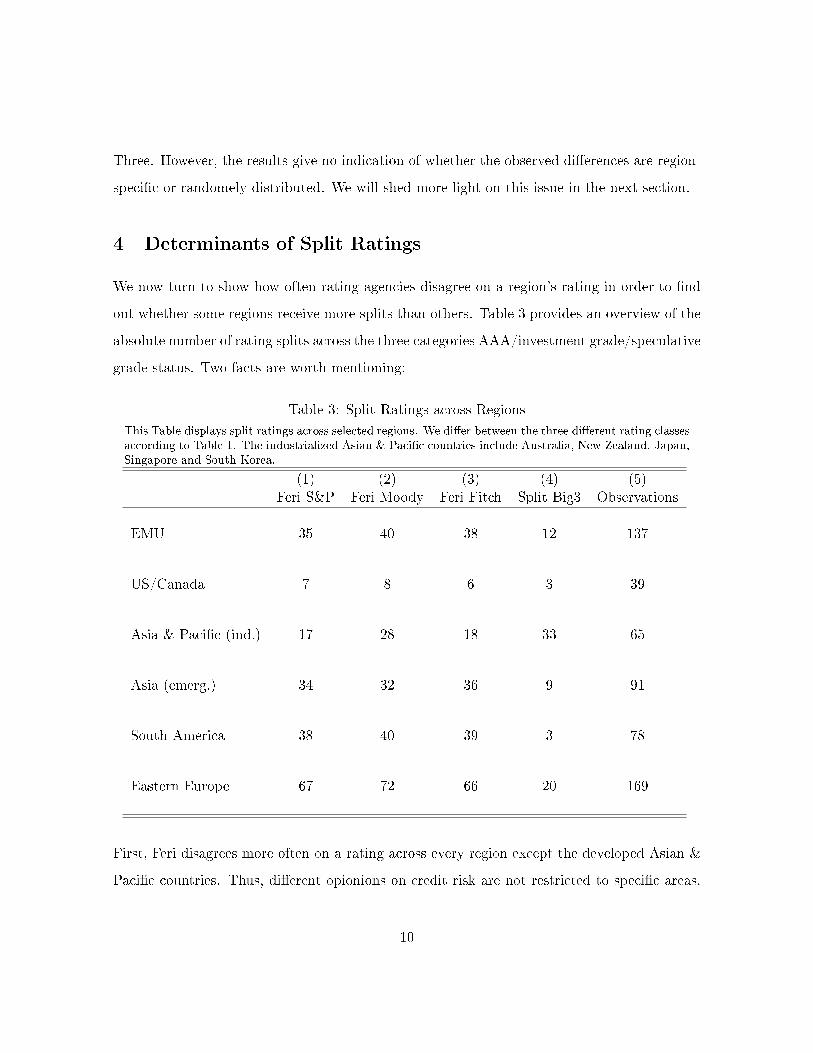
out whether some regions receive more splits than others. Table 3 provides an overview of the
absolute number of rating splits across the three categories AAA/investment grade/speculative
grade status. Two facts are worth mentioning:
Table 3: Split Ratings across Regions
This Table displays split ratings across selected regions. We di�er between the three di�erent rating classesaccording to Table 1. The industrialized Asian & Paci�c countries include Australia, New Zealand, Japan,Singapore and South Korea.
(1) (2) (3) (4) (5)Feri S&P Feri Moody Feri Fitch Split Big3 Observations
EMU 35 40 38 12 137
US/Canada 7 8 6 3 39
Asia & Paci�c (ind.) 17 28 18 33 65
Asia (emerg.) 34 32 36 9 91
South America 38 40 39 3 78
Eastern Europe 67 72 66 20 169
First, Feri disagrees more often on a rating across every region except the developed Asian &
Paci�c countries. Thus, di�erent opionions on credit risk are not restricted to speci�c areas.
10

Also, disagreement does not seem to depend on a region's level of economic development.
Second, we observe a higher frequency of split ratings across the Big Three in developed Asian
& Paci�c countries (50% of the observations). One explanation for this result might be the
distance between a rating agency's home region and the rated country. Still, the descriptive
results may also be the consequence of country-speci�c characteristics. In the following, we
will test whether the macroeconomic stance on the country level and the political environment
have an in�uence on the disagreement across CRAs.
It is a generally accepted view that political risk determines the willingness to repay debt
obligations whereas economic risk mirrors the country's ability to repay. Both variables are
considered in the rating agencies' methodologies. By contrast, a country's business climate
(protection of property rights, predictability of tax and legal regimes) is not necessarily related
to the probability of sovereign debt repayment.10
The authors include the following two determinants of political uncertainty: (1) Political
stability measures the probability of a government to be destabilized by unconstitutional or
violent means. If political stability is endangered rating agencies may have di�erent views
on political developments within the country or on future governments. (2) Government
e�ectiveness captures the ability of a government to provide public services, the degree of
independence from political pressures and government credibility (Kaufmann et al. (2010)).
If government e�ectiveness is low, rating agencies may face uncertainty with respect to the
formal capacity of the government to service its debt.
We also use determinants for economic uncertainty: First, a higher (1) GDP per capita reduces
the uncertainty towards a country's ability to repay its debt due to a large tax base. Second,
a low ratio of (2) government debt to GDP reduces uncertainty as well as a low ratio of (3)
external debt to imports. We also control for the (4) default history where a past default (after
1945) potentially increases uncertainty.
Finally, we include a measure for large adverse shocks to a country's default risk within a given
year. If a country is subject to such a shock, we assume that rating agencies face a greater
10For details, we refer to the published methodologies of the CRAs
11

uncertainty towards future country risk. In our model, we use the the Institutional Investor's
country credit risk index which is based on a semi-annual survey among institutional investors
and weighted by their exposure to sovereign risk. The variable is computed as the squared one-
year-change in credit risk whereby we only consider negative changes in credit risk.11 Thus,
positive coe�cients indicate that large adverse shocks to credit risk lead to higher uncertainty
among rating agencies.
In the following, we carry out two seperate regressions and present the results. First,
we restrict the sample to advanced economies and measure the probability to observe a split
rating between AAA and below. In the second probit model, we measure the probability of
split ratings in emerging economies at the threshold between investment and speculative grade
status.
Pr(Split AAAij,t) = F (macrok,t, region,∆CCRk,t) + eij,t (1)
and
Pr(Split InvJunkij,t) = F (macrok,t, region, defaultk,∆CCRk,t) + eij,t. (2)
Table 4 provides the results obtained from the probit regression on AAA-level splits. Columns
(1) and (2) present split results for Feri against the Big Three. Most importantly, we �nd no
systematic increase in the split probability across regions. Higher government debt and a
negative external balance increase the split probability whereby a lower value of government
e�ectiveness leads to a decline. The latter result looks surprising, however, one may think
of countries having a low probability to receive AAA-status by any agency if the index has
not reached a certain upper threshold. The split probability increases signi�cantly with a
large decline in the Country Credit Rating. Indeed, this result con�rms earlier �ndings in
the literature stating that ratings are less reliable during times of crises (Ferri et al. (1999),
11Positive values are set equal to zero.
12

Table 4: Split Ratings AAA vs. Non-AAA
This Table displays split probabilities for advanced economies at the threshold between AAA and below.We use a probit model with a dummy variable equal to one if two agencies disagree on the rating category(AAA/Non-AAA). Positive coe�cients re�ect an increase in the split probability, negative coe�cientsindicate a decrease. Standard errors are clustered on the country level.
(1) (2) (3) (4)Split Feri-Big3 Split Feri-Big3 Split Big3 Split Big3
∆ CCR sq. 0.000533* 0.000847*** 0.00105*** 0.00134***(1.92) (2.83) (3.94) (4.10)
EMU -0.110 -0.0204 -0.171 -0.167(-0.58) (-0.14) (-1.15) (-1.23)
Asia & Paci�c 0.0975 0.206 0.176 0.179*(0.46) (1.59) (1.27) (1.73)
USA & Canada -0.142 -0.232 -0.123 -0.152(-0.60) (-1.27) (-0.89) (-1.16)
GDP per Capita 0.00167 -0.00385(0.57) (-1.15)
Government Debt 0.00176* 0.000578(1.81) (1.14)
Fiscal Balance -0.00213 -0.00565(-0.22) (-0.83)
External Balance -0.0302*** -0.0175***(-4.47) (-3.73)
GDP Growth 0.00259 0.00889(0.21) (0.80)
Government E�ectiveness 0.651*** 0.358***(4.70) (3.79)
Political Stability 0.0322 0.0934(0.20) (0.78)
Observations 299 297 299 297Pseudo R2 0.025 0.189 0.138 0.283
t statistics in parentheses* p<0.10, ** p<0.05, *** p<0.01
13

Table 5: Split Ratings Speculative vs. investment grade
This Table displays split probabilities for countries at the threshold between investment grade and junkstatus. We use a probit model with a dummy variable equal to one if two agencies disagree on the ratingcategory (Inv. Grade/Junk). Positive coe�cients re�ect an increase in the split probability, negativecoe�cients indicate a decrease. Standard errors are clustered on the country level.
(1) (2) (3) (4)Split Feri-Big3 Split Feri-Big3 Split Big3 Split Big3
∆ CCR sq. -0.0000553 -0.000897*** 0.0000973 -0.000226(-0.14) (-2.63) (0.55) (-0.76)
Default History 0.137 -0.0360 0.0252 -0.102**(1.22) (-0.32) (0.66) (-2.28)
Eastern Europe 0.0796 0.0225 0.0179 0.0570(0.44) (0.15) (0.32) (0.77)
Asia 0.127 -0.110 0.00731 -0.0226(0.60) (-0.71) (0.11) (-0.33)
South America 0.185 -0.107 -0.0611 -0.0927(0.93) (-0.65) (-0.94) (-1.09)
GDP per Capita -0.0181 0.00307(-1.48) (0.35)
Government Debt -0.000706 0.000970(-0.29) (0.69)
External Debt 0.00166** 0.000206(2.28) (0.55)
Fiscal Balance -0.0101 -0.00283(-0.74) (-0.48)
External Balance -0.00153 -0.000868(-0.19) (-0.26)
GDP Growth -0.00611 -0.00583(-0.69) (-1.27)
Government E�ectiveness -0.299** -0.142*(-2.44) (-1.85)
Political Stability -0.0650 0.0426(-0.90) (1.47)
Observations 403 284 403 284Pseudo R2 0.021 0.217 0.015 0.117
t statistics in parentheses* p<0.10, ** p<0.05, *** p<0.01
14

Gaertner et al. (2011)).
The split results for the Big Three in columns (3) and (4) are similar, however, we observe
that the agencies disagree more often on ratings for Asian & Paci�c countries.12 In contrast
to S&P's and Moody's, Fitch has never assigned AAA-status to these countries. Also, the
Big Three are often discordant on Japan's credit risk with S&P's being the most pessimistic
agency.
Taken together, the �ndings for splits on AAA-status do not suggest that countries in the euro
area are particularly a�ected by split ratings whereas other regions are not. It seems that the
frequency of disagreement increases only between the Big Three in the case of Asian & Paci�c
countries, con�rming our descriptive result in Table 3.
Table 5 presents the results for splits between investment and speculative grade ratings.
We �nd more split ratings between Feri and the Big Three in countries with high external
debt and low levels of government e�ectiveness given. Again, we �nd no signi�cant increase in
the split probability across regions. In contrast to the results in Table 4, we �nd no positive
e�ect of adverse shocks on the split probability. The coe�cient is even negative and signi�cant
in column (2) suggesting that in the case of emerging markets, the agreement (to downgrade
countries) among CRAs even increases. The Big Three disagree more often if countries have
no default history and if the index of government e�ectiveness is low. We do not �nd an
indication for the Big Three to disagree more often on country risk in one region than in
another.
To sum up, our results suggest that disagreement among rating agencies stems either from the
use of di�erent rating models (external balance and debt ratios seem to have di�erent weights)
or from uncertainty during times of adverse shocks (only in advanced economies). We �nd
that regional splits occur more frequently among the Big Three in Asian & Paci�c countries.
In the following, we explore in which cases a CRA is more likely to be optimistic or pessimistic
than its competitors.
12The Asian & Paci�c region includes Australia, New Zealand, Japan, Singapore and South Korea.
15

5 Are sovereign ratings lopsided?
During the euro crisis, policy makers have expressed the expectation that a European based
rating agency would publish a more unbiased view about European countries than rating
agencies with headquarters in the U.S. Accordingly, one should expect that the U.S. based
agencies assign better ratings to their immediate neighbours. Given the recent criticism by
European politicians, we �rst examine rating di�erences in the euro area. The results are
based on a study by Bartels and Weder di Mauro (2013).
Table 6: Mean comparison of ratings to the world
Di�erences of the ratings are based on the transformation in Table 12; Positive coe�cients indicate a betterrating average compared to Feri; Signi�cance levels of T-test are given as ***, **, and * representing 1%,5%, and 10% respectively
(1) (2) (3)Country Group Feri - S&P Feri - Moody's Feri - Fitch Observations
1999-2012
All Countries 0.18*** 0.12*** 0.19*** 702industrialized Countries -0.1*** -0.16*** -0.09*** 299Emerging Economies 0.12*** 0.11*** 0.11*** 403
Great Moderation (1999-2007)
All Countries 0.36*** 0.33*** 0.35*** 486industrialized Countries 0.02 -0.03 -0.02 207Emerging Economies 0.62*** 0.60*** 0.58*** 279
Crisis Period (2008-2012)
All Countries -0.22*** -0.32*** -0.16*** 216Advanced Countries -0.37*** -0.46*** -0.34*** 92Emerging Economies -0.11*** -0.22*** -0.02 124
To begin, we investigate the rating di�erences in industrialized and emerging markets and
on the euro area in particular. In Tables 6 and 7, we compute the mean comparisons of rating
di�erences between Feri and the Big Three. The coe�cients indicate that Feri has assigned
more positive ratings to emerging markets (between 1999 to 2007) and has had a more pes-
simistic view on industrialized countries (only during the crisis). Within the euro area (Table
7), we observe no signi�cant di�erence across the agencies during the Great Moderation, but a
16
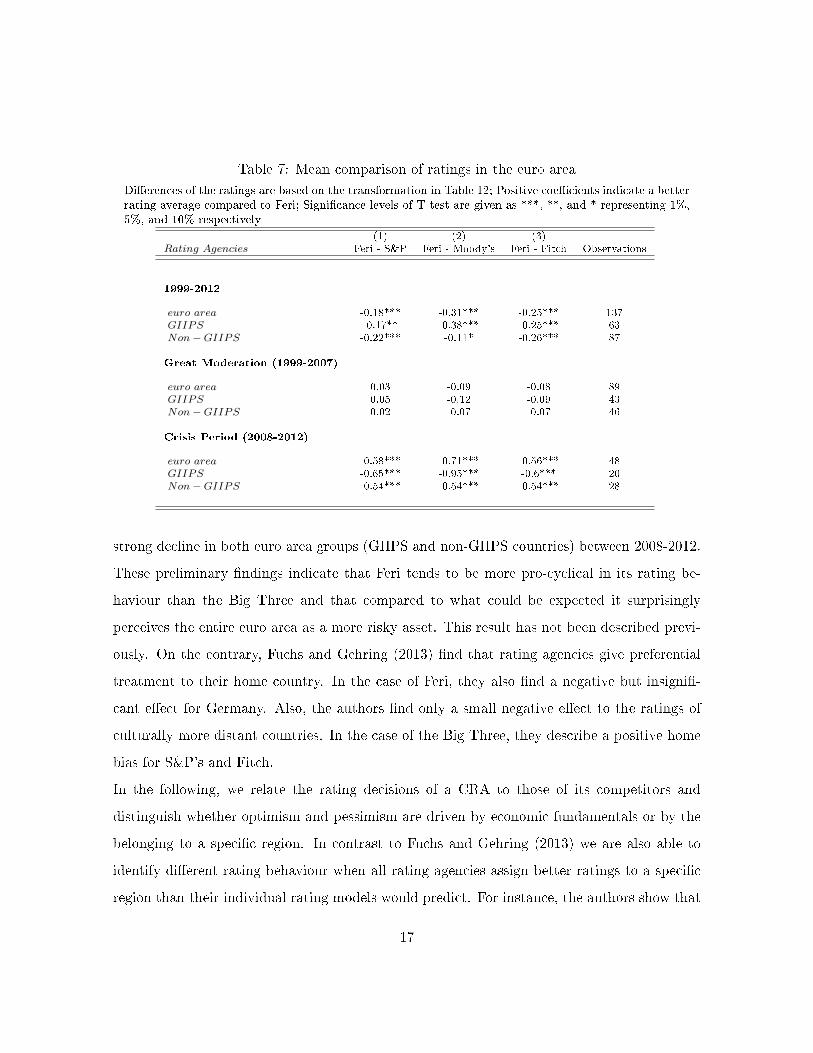
Table 7: Mean comparison of ratings in the euro area
Di�erences of the ratings are based on the transformation in Table 12; Positive coe�cients indicate a betterrating average compared to Feri; Signi�cance levels of T-test are given as ***, **, and * representing 1%,5%, and 10% respectively
(1) (2) (3)Rating Agencies Feri - S&P Feri - Moody's Feri - Fitch Observations
1999-2012
euro area -0.18*** -0.31*** -0.25*** 137GIIPS -0.17** -0.38*** -0.25*** 63Non−GIIPS -0.22*** -0.11* -0.26*** 87
Great Moderation (1999-2007)
euro area 0.03 -0.09 -0.08 89GIIPS 0.05 -0.12 -0.09 43Non−GIIPS 0.02 -0.07 -0.07 46
Crisis Period (2008-2012)
euro area -0.58*** -0.71*** -0.56*** 48GIIPS -0.65*** -0.95*** -0.6*** 20Non−GIIPS -0.54*** -0.54*** -0.54*** 28
strong decline in both euro area groups (GIIPS and non-GIIPS countries) between 2008-2012.
These preliminary �ndings indicate that Feri tends to be more pro-cyclical in its rating be-
haviour than the Big Three and that compared to what could be expected it surprisingly
perceives the entire euro area as a more risky asset. This result has not been described previ-
ously. On the contrary, Fuchs and Gehring (2013) �nd that rating agencies give preferential
treatment to their home country. In the case of Feri, they also �nd a negative but insigni�-
cant e�ect for Germany. Also, the authors �nd only a small negative e�ect to the ratings of
culturally more distant countries. In the case of the Big Three, they describe a positive home
bias for S&P's and Fitch.
In the following, we relate the rating decisions of a CRA to those of its competitors and
distinguish whether optimism and pessimism are driven by economic fundamentals or by the
belonging to a speci�c region. In contrast to Fuchs and Gehring (2013) we are also able to
identify di�erent rating behaviour when all rating agencies assign better ratings to a speci�c
region than their individual rating models would predict. For instance, the authors show that
17

all Big Three agencies assign better ratings to the U.S. than predicted. In our model, we focus
on regions instead of single countries to increase the number of observations.
In Table 8, we summarize the number of months in which a CRA had a more pessimistic
stance compared to all competitors across regions. In the case of Feri, we use the classi�cation
in Table 1 due to the di�erent rating scales. The comparison among the Big Three is based
on the scale of alphabetical notches.13 For instance, we consider a more pessimistic stance for
Feri if the agency assigns investment grade whereas all Big Three agencies assign AAA-status.
In case of the Big Three, we attribute a negative stance if one agency assign B+ whereas
another one assigns a B.
Our descriptive �ndings indicate that Feri is more often pessimistic towards credit risk in
North America and Eastern Europe than its competitors. Standard & Poor's takes the lead
by having most often a pessimistic stance towards the euro area and emerging Asia whereas
Moody's has a negative bias towards South America. Fitch Ratings has most often assigned
lower ratings to the Asian & Paci�c region (industrialized).
The �ndings for optimism in Table 9 show that Feri assigns more often better ratings to
emerging Asia and South America than the Big Three. Moody's has most often assigned
better ratings to the EMU, North America, Asian & Paci�c economies and Eastern Europe.
Taking the two tables together, three observations are worth mentioning: First, we �nd more
volatility in ratings towards emerging markets than towards advanced economies (this con�rms
earlier �ndings). Second, the Big Three are more often optimistic towards advanced countries
whereas Feri has more frequently assigned better ratings to the emerging world (except for
Eastern Europe). Third, we observe that Moody's is the most often optimistic agency among
the Big Three. The agency assigns more often better ratings in four of the six regions. It
turns out that pessimism is more dispersed across agencies and regions.
Next, we include a set of macroeconomic variables following Cantor and Packer (1996) and
13This explains why disagreement with Feri is less frequent although the agency assigns more rating changesoverall.
18

Table 8: No. of Negative Deviations towards other CRAs
This Table displays country-month observations in which a rating agency has assigned lower ratings tospeci�c regions than its competitors. Due to the di�erent scales, we compare Feri's ratings with those ofthe Big Three along the pre-de�ned three rating categories whereas we use the full rating scale for the BigThree.
(1) (2) (3) (4) (5)Feri Pes. S&P Pes. Moody Pes. Fitch Pes. Observations
EMU 235 296 92 111 1,738
North America 101 17 0 52 486
Asia & Paci�c (industr.) 12 99 74 136 810
South America 19 9 413 98 972
Eastern Europe 526 249 259 156 2,106
Asia (em. markets) 0 202 157 84 1,134
Observations 893 872 995 637 7,246
Table 9: No. of Positive Deviations towards other CRAsThis Table displays country-month observations in which a rating agency has assigned higher ratings tospeci�c regions than its competitors. Due to the di�erent scales, we compare Feri's ratings with those ofthe Big Three along the pre-de�ned three rating categories whereas we use the full rating scale for the BigThree.
(1) (2) (3) (4) (5)Feri Opt. S&P Opt. Moody Opt. Fitch Opt. Observations
EMU 123 74 193 53 1,738
North America 0 12 98 0 486
Asia & Paci�c (industr.) 45 51 221 158 810
South America 418 159 29 118 972
Eastern Europe 181 302 733 133 2,106
Asia (em. markets) 364 88 87 228 1,134
Observations 1131 686 1361 657 7,246
19
use a probit model to explain in which cases a rating agency shows a lower/higher probability
to deviate from its competitors:
Pr(pessimismij,t) = F (macrok,t, region, defaultk) + eij,t. (3)
and
Pr(optimismij,t) = F (macrok,t, region, defaultk) + eij,t (4)
Thereby, we can examine whether our descriptive �ndings hold when we control for country-
speci�c variation in the macroeconomic stance. North American countries are not taken into
account due to the low overall disagreement across agencies. Table 10 presents the probit
results for a negative rating bias. We �nd that Feri shows a higher probability to downgrade
Eastern European countries and to assign lower ratings to countries with higher per capita
income. S&P's is more pessimistic on Eastern Europe and on EMU economies than the other
Big Three. Moody's assigns more often negative ratings to South America, emerging Asia,
countries with a default history and those with higher growth rates. The results for Fitch
mirror our descriptive �ndings: We �nd no signi�cant relation between the region and a
higher frequency of stand-alone negative ratings. Here, we do not include the United States
and Canada due to the lack of variation across agencies.
In Table 11, we show the probit results for a positive rating bias. Here, Feri is more generous
to countries with large ratios of public debt and in�ation. We do not �nd that a rating agency
is characterized by marked optimism towards a speci�c region. This result stands in contrast
to our descriptive �ndings when Feri often assigned more positive ratings to emerging markets
than the Big Three. S&P's has more often an optimistic view on South America, Eastern
Europe and Asia. They also frequently assign better ratings to previous defaulters than the
other Big Three agencies. Moody's is only more optimistic towards countries with higher
public debt ratios whereas Fitch assigns better ratings to the industrialized Asian & Paci�c
region and the euro area.
20
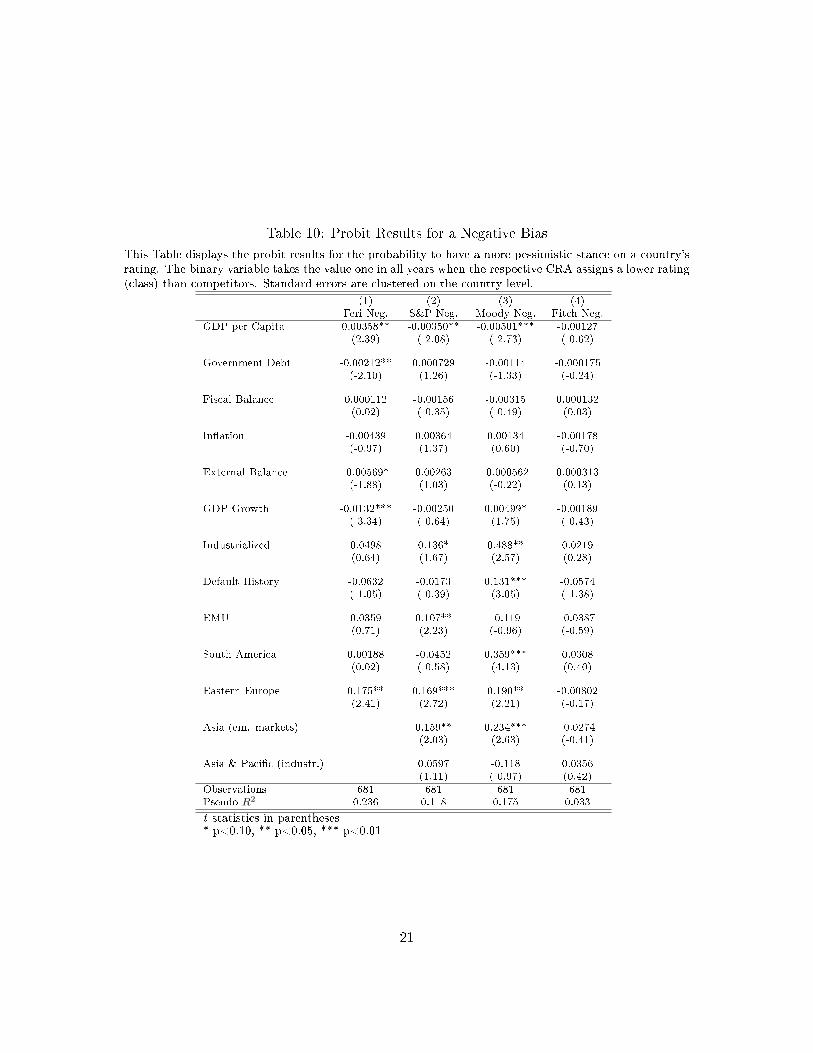
Table 10: Probit Results for a Negative Bias
This Table displays the probit results for the probability to have a more pessimistic stance on a country'srating. The binary variable takes the value one in all years when the respective CRA assigns a lower rating(class) than competitors. Standard errors are clustered on the country level.
(1) (2) (3) (4)Feri Neg. S&P Neg. Moody Neg. Fitch Neg.
GDP per Capita 0.00358** -0.00350** -0.00501*** -0.00127(2.39) (-2.08) (-2.73) (-0.62)
Government Debt -0.00212** 0.000729 -0.00114 -0.000175(-2.10) (1.26) (-1.33) (-0.24)
Fiscal Balance 0.000112 -0.00156 -0.00315 0.000132(0.02) (-0.35) (-0.49) (0.03)
In�ation -0.00439 0.00364 0.00134 -0.00178(-0.97) (1.37) (0.60) (-0.70)
External Balance -0.00569* 0.00263 -0.000562 0.000313(-1.88) (1.03) (-0.22) (0.13)
GDP Growth -0.0132*** -0.00250 0.00499* -0.00189(-3.34) (-0.64) (1.75) (-0.43)
Industrialized 0.0498 0.136* 0.488** 0.0219(0.64) (1.67) (2.57) (0.28)
Default History -0.0632 -0.0173 0.131*** -0.0574(-1.05) (-0.39) (3.05) (-1.38)
EMU 0.0359 0.107** -0.119 -0.0387(0.71) (2.23) (-0.96) (-0.59)
South America 0.00188 -0.0452 0.359*** 0.0308(0.02) (-0.58) (4.13) (0.40)
Eastern Europe 0.175** 0.169*** 0.190** -0.00802(2.41) (2.72) (2.21) (-0.17)
Asia (em. markets) 0.159** 0.234*** -0.0274(2.03) (2.63) (-0.41)
Asia & Paci�c (industr.) 0.0597 -0.118 0.0356(1.11) (-0.97) (0.42)
Observations 681 681 681 681Pseudo R2 0.236 0.118 0.175 0.033
t statistics in parentheses* p<0.10, ** p<0.05, *** p<0.01
21
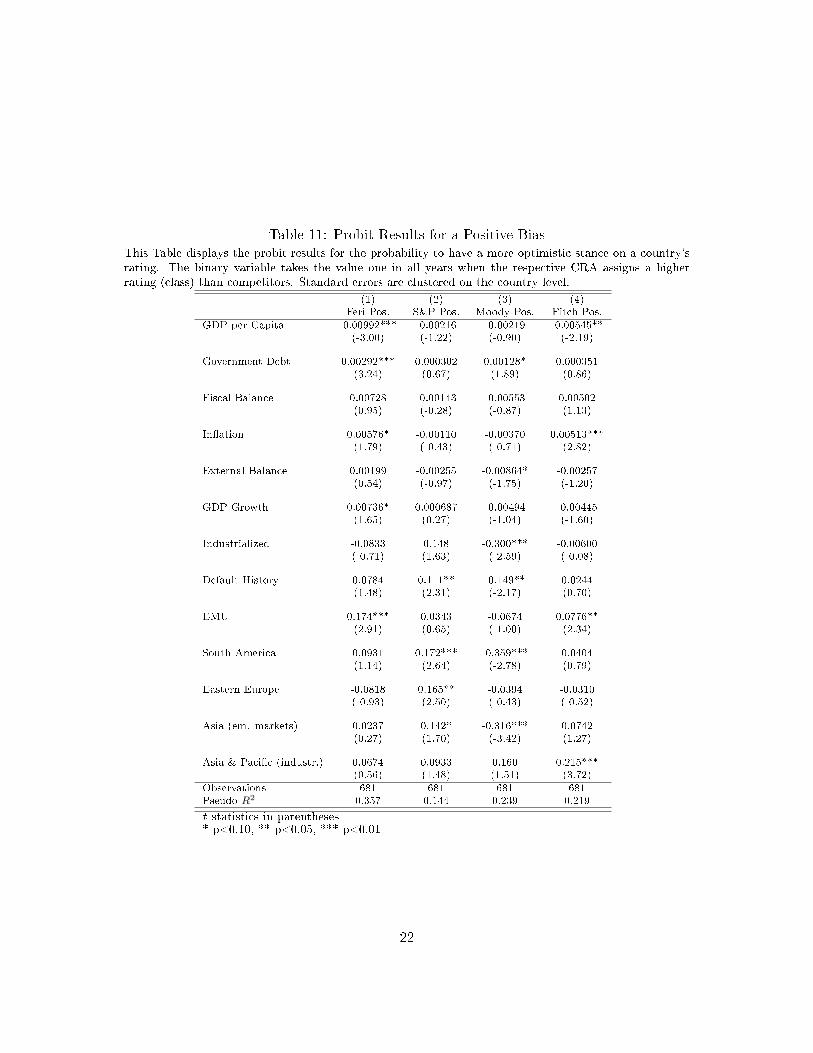
Table 11: Probit Results for a Positive BiasThis Table displays the probit results for the probability to have a more optimistic stance on a country'srating. The binary variable takes the value one in all years when the respective CRA assigns a higherrating (class) than competitors. Standard errors are clustered on the country level.
(1) (2) (3) (4)Feri Pos. S&P Pos. Moody Pos. Fitch Pos.
GDP per Capita -0.00992*** -0.00216 -0.00219 -0.00545**(-3.00) (-1.22) (-0.90) (-2.19)
Government Debt 0.00292*** 0.000302 0.00128* 0.000351(3.24) (0.67) (1.89) (0.86)
Fiscal Balance 0.00728 -0.00143 -0.00553 0.00502(0.95) (-0.28) (-0.87) (1.13)
In�ation 0.00576* -0.00110 -0.00370 0.00513***(1.79) (-0.43) (-0.71) (2.82)
External Balance 0.00199 -0.00255 -0.00864* -0.00257(0.54) (-0.97) (-1.75) (-1.20)
GDP Growth 0.00736* 0.000687 -0.00494 -0.00445(1.65) (0.27) (-1.04) (-1.60)
Industrialized -0.0833 0.148 -0.300*** -0.00600(-0.71) (1.63) (-2.59) (-0.08)
Default History 0.0784 0.111** -0.149** 0.0244(1.48) (2.31) (-2.17) (0.70)
EMU 0.174*** 0.0343 -0.0674 0.0776**(2.91) (0.65) (-1.00) (2.34)
South America 0.0931 0.172*** -0.359*** 0.0404(1.14) (2.64) (-2.78) (0.79)
Eastern Europe -0.0818 0.165** -0.0394 -0.0310(-0.93) (2.50) (-0.43) (-0.52)
Asia (em. markets) 0.0237 0.142* -0.316*** 0.0742(0.27) (1.70) (-3.42) (1.27)
Asia & Paci�c (industr.) 0.0674 0.0933 0.160 0.215***(0.56) (1.48) (1.51) (3.72)
Observations 681 681 681 681Pseudo R2 0.357 0.144 0.239 0.219
t statistics in parentheses* p<0.10, ** p<0.05, *** p<0.01
22
Taken together, in contrast to widespread political presumptions our results do not point to
the existence of a home bias across the four rating agencies. If anything, Eastern European
countries receive more often lower ratings by Feri than by the Big Three and S&P's assigns
relatively low ratings to the euro area. South American countries are favoured by S&P's and
disadvantaged by Moody's. Overall, it seems that Feri assigns more often positive ratings
to emerging markets (and less often negative ratings) whereas the Big Three are more often
generous towards the advanced economies. Fitch seems to have a more neutral stance towards
all regions except for the industrialized Asian & Paci�c countries.
6 Rating Agency Interaction
Previously, we have explained the behaviour of rating agencies by using economic, political or
regional determinants. In this section, we take a closer look at the interaction between rating
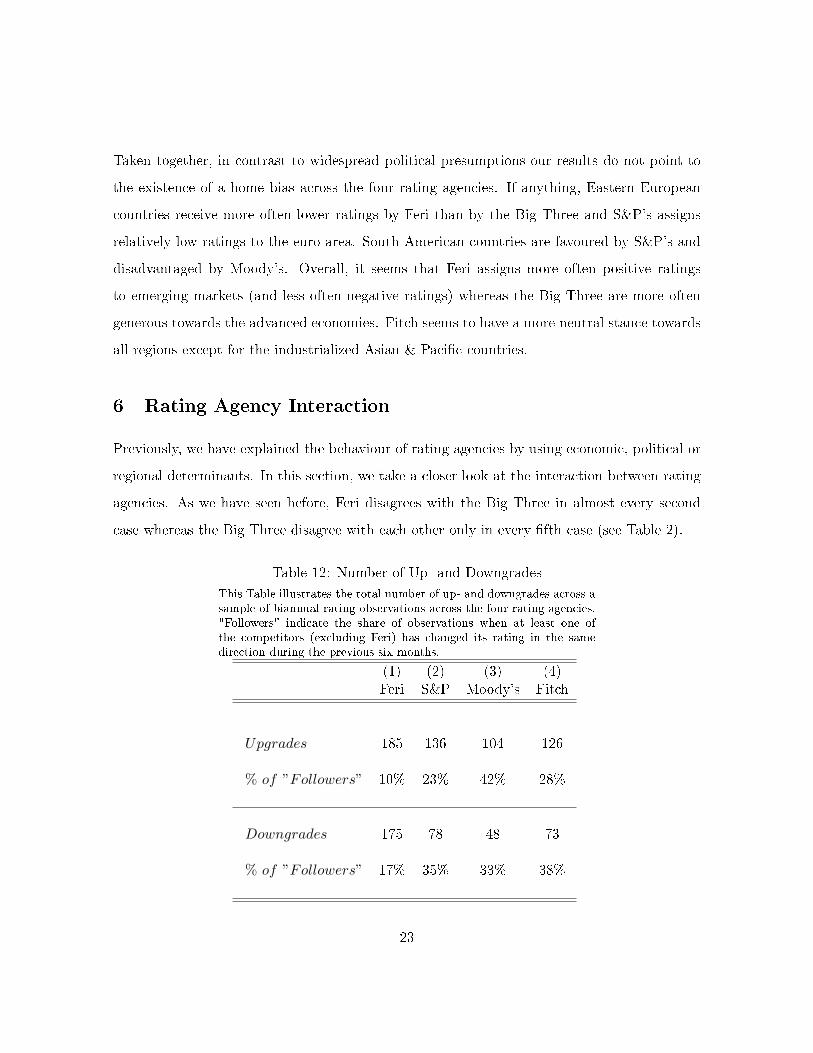
agencies. As we have seen before, Feri disagrees with the Big Three in almost every second
case whereas the Big Three disagree with each other only in every �fth case (see Table 2).
Table 12: Number of Up- and Downgrades
This Table illustrates the total number of up- and downgrades across asample of biannual rating observations across the four rating agencies."Followers" indicate the share of observations when at least one ofthe competitors (excluding Feri) has changed its rating in the samedirection during the previous six months.
(1) (2) (3) (4)Feri S&P Moody's Fitch
Upgrades 185 136 104 126
% of ”Followers” 10% 23% 42% 28%
Downgrades 175 78 48 73
% of ”Followers” 17% 35% 33% 38%
23
Bartels and Weder di Mauro (2013) and Hill and Fa� (2010) have shown how often rating
agencies take a lead in times of crisis and how often they followed another agency.14 In this
paper, we explore whether it is possible to predict a rating agency's downgrade probability
with an empirical model. We deliberately control for times of crises and focus on the rating
behaviour in normal times. During times of crises CRAs have changed their ratings frequently
which makes it hard to di�erentiate between pure interaction behaviour and common responses
to crisis events such as a declaration of default.
Our reasoning during normal times is as follows: If one of the Big Three agencies decides to
downgrade a country's rating by at least one notch, sovereign issuers face higher re�nancing
costs when investors begin to sell their positions or when they issue new bonds. Accordingly,
competitors follow with subsequent downgrades as a lower rating increases sovereign risk by
itself due to regulatory provisions such as the Basel capital regulation. The following behaviour
is more pronounced for regulated agencies because they face higher costs of downgrades in the
form of subsequent changes in bank ratings or rising interest rates in the economy. On the
contrary, a smaller, less in�uential agency is not impeded by sovereign ceilings policy or other
forms of unintended feedbacks.
In the following probit model we compute the probability of a negative/positive change in
the rating within six months following the assignment of a lower rating by at least one other
agency (lagged DG/ lagged UG). When considering downgrades, we control for the recent
sovereign debt crises in emerging markets as well as the crises in the GIIPS economies. We
also control for external credit risk shocks of common knowledge re�ected by the semi-annual
change in the Institutional Investor's Country Credit Rating (CCR). The inclusion of this
variable helps to account for situations when rating agencies respond together to previously
observable external shocks. Table 12 illustrates the number of up- and downgrades for each
rating agency and shows the share of rating changes when a competitor has assigned a change
14This part extends an earlier study by Bartels and Weder di Mauro (2013) in which we provide a �rstdescriptive analysis of leader/follower behaviour during selected crises in emerging markets and the euro area.Here, we extend the previous research by setting up a probit model which also includes potential interactionin normal times.
24
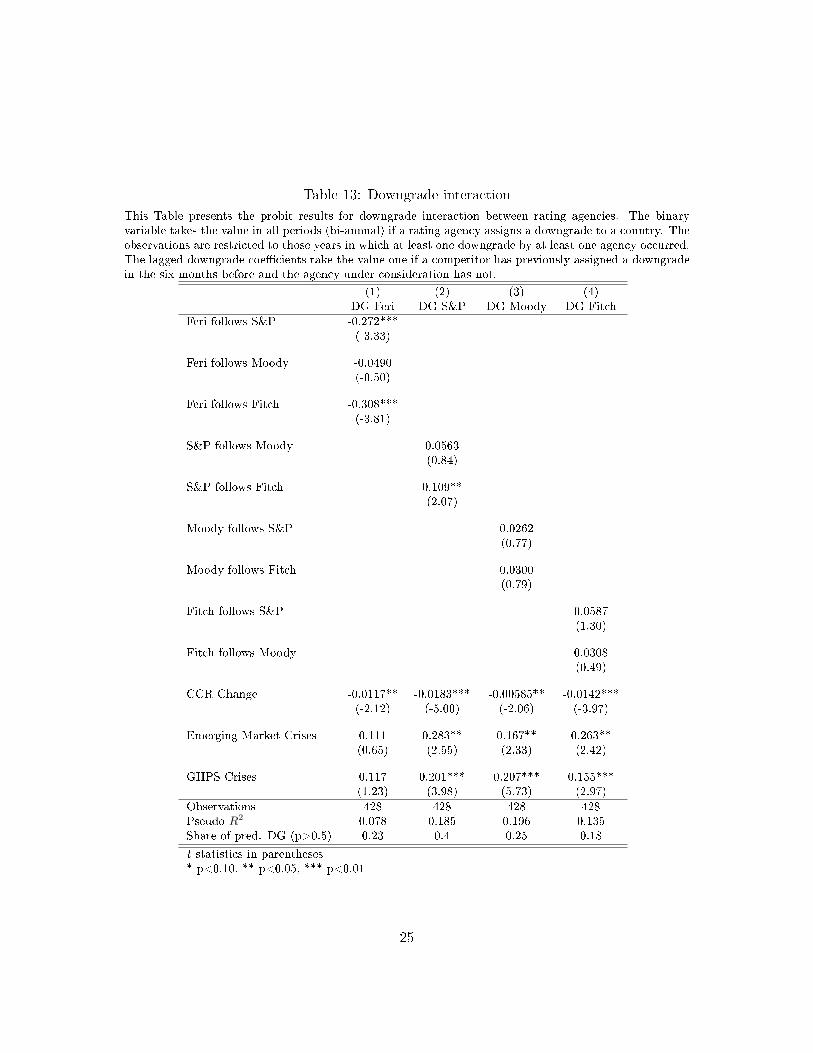
Table 13: Downgrade interaction
This Table presents the probit results for downgrade interaction between rating agencies. The binaryvariable takes the value in all periods (bi-annual) if a rating agency assigns a downgrade to a country. Theobservations are restricted to those years in which at least one downgrade by at least one agency occurred.The lagged downgrade coe�cients take the value one if a competitor has previously assigned a downgradein the six months before and the agency under consideration has not.
(1) (2) (3) (4)DG Feri DG S&P DG Moody DG Fitch
Feri follows S&P -0.272***(-3.33)
Feri follows Moody -0.0490(-0.50)
Feri follows Fitch -0.308***(-3.81)
S&P follows Moody 0.0563(0.84)
S&P follows Fitch 0.109**(2.07)
Moody follows S&P 0.0262(0.77)
Moody follows Fitch 0.0300(0.79)
Fitch follows S&P 0.0587(1.30)
Fitch follows Moody 0.0308(0.49)
CCR Change -0.0117** -0.0183*** -0.00585** -0.0142***(-2.12) (-5.00) (-2.06) (-3.97)
Emerging Market Crises 0.111 0.283** 0.167** 0.263**(0.65) (2.55) (2.33) (2.42)
GIIPS Crises 0.117 0.201*** 0.207*** 0.155***(1.23) (3.98) (5.73) (2.97)
Observations 428 428 428 428Pseudo R2 0.078 0.185 0.196 0.135Share of pred. DG (p>0.5) 0.23 0.4 0.25 0.18
t statistics in parentheses* p<0.10, ** p<0.05, *** p<0.01
25

Table 14: Upgrade interaction
This Table presents the probit results for upgrade interaction between rating agencies. The binary vari-able takes the value in all periods (bi-annual) if a rating agency assigns an upgrade to a country. Theobservations are restricted to those years in which at least one upgrade by at least one agency occurred.The lagged upgrade coe�cients take the value one if a competitor has previously assigned an upgrade tothe same country in the six months before and the agency under consideration has not.
(1) (2) (3) (4)UG Feri UG S&P UG Moody UG Fitch
Feri follows S&P -0.203***(-3.93)
Feri follows Moody -0.167***(-3.01)
Feri follows Fitch -0.178***(-3.28)
S&P follows Moody 0.0320(0.71)
S&P follows Fitch 0.139***(3.42)
Moody follows S&P -0.00677(-0.18)
Moody follows Fitch -0.00721(-0.19)
Fitch follows S&P 0.131***(3.52)
Fitch follows Moody 0.00292(0.06)
CCR Change -0.00287 0.00880** 0.000473 0.0134***(-0.63) (2.02) (0.12) (3.03)
Observations 628 628 628 628Pseudo R2 0.073 0.025 0.000 0.036Share of pred. UG (p>0.5) 0 0 0 0
t statistics in parentheses
* p<0.10, ** p<0.05, *** p<0.01
26
in the same direction during the six previous months. These preliminary results show that the
Big Three respond to each other in 23 to 42 percent of the change observations. Feri follows
the Big Three less often which is probably due to its higher volatility. In the following, we test
in three speci�cations for each agency whether the Big Three have a statistically signi�cant
propensity to follow each other. We also test in a fourth speci�cation whether Feri responds
to the Big Three.
Pr(up− /downgradei,t) = F (up− /downgradej,t−1, crisisk,t, ccrk,t) + ei,t (5)
Table 13 presents the probit results for downgrade interaction across agencies. In the case
of Feri (column (1)), we observe that Feri's downgrades are not related to the rating actions
of the Big Three. On the contrary, our coe�cients suggest that a downgrade by Feri is even
less likely when the Big Three assigned a downgrade in the previous six months. Overall, the
model is not able to predict Feri's downgrade probability. Even in times of crises in the GIIPS
and in emerging markets, Feri does not assign more downgrades than usual.
In case of the Big Three, we observe that all interaction coe�cients are positive. However,
only the coe�cient for S&P following Fitch is signi�cant. Besides, the Big Three show a
higher probability to assign a downgrade in times of crises and after negative shocks to the
Country Credit Rating. Yet, due to the small number of rating change observations in the
overall sample, our model can only predict between 18 and 40 percent of the downgrades.
In Table 14, we present the results for upgrade interaction. We �nd that Feri assigns upgrades
in a rather anti-cyclical fashion whereas S&P and Fitch have a higher degree of interaction. We
also observe that positive shocks to the CCR increase the upgrade probability among two of
the Big Three, however the coe�cients are much smaller relative to those in the probit model
for downgrade interaction. Add to this, the model does not predict the upgrade propensity of
agencies at all which is in line with former theoretical and empirical studies which �nd that
upgrades usually do not come as a surprise to market participants because they are based on
27

public information (Hand et al. (1992), Boot et al. (2006)). Also, rating agencies should be
less reluctant to assign upgrades since they are not constrained by sovereign ceiling policies.
To sum up, we observe that Feri seems to be more independent in its decisions to downgrade
a country. The coe�cients for Feri are even negative whereas we �nd positive and signi�cant
results for the Big Three. One explanation is that the smaller European agency uses a di�erent
rating model and that it is more independent than the Big Three. Second, it seems that
following behaviour is more likely to occur during times of recessions rather than in times of
economic booms.
7 Conclusions
The purpose of this paper is to investigate the question why rating agencies have di�erent
perceptions of country credit risk. After exploring the rating behavior of four agencies we
�nd that belonging to a particular world region or the membership in the European Monetary
Union neither leads to a higher split probability nor does it explain a rating if we control for
other macroeconomic and political determinants.
Besides, the subscriber funded European agency Feri seems to have a stronger short-term focus
(economic growth, �scal balance, external balance) whereas the Big Three put more weight
on long-term macroeconomic developments (GDP per capita, Government Debt). This can
serve as an explanation why Feri tends to change its ratings more often than the Big Three.
Our �ndings further suggest that sovereign ratings are not shaped by the origin or the language
of the rating agency. Thus, the issuer-pays model does not constitute a con�ict of interest
for sovereign ratings. We argue that this is due to the fact that fees for sovereign ratings
are relatively low compared to for instance structured �nance products. Also, the agencies
produce unsolicited ratings 15. However, we �nd that CRAs use di�erent rating models to
assess a country's default risk. As we have stated above, our results suggest that Feri puts
15Feri produces only unsolicited ratings and the Big Three also have a share of 10-20% unsolicited ratingsacross all country groups and regions.
28
more weight on short-term variables.
Finally, we have explored whether rating agencies respond to the actions of their competitors.
Our probit results indicate that the Big Three have a higher propensity to follow each other
than Feri. The descriptive results show that the Big Three follow each other in every third
case on average while Feri tends to be more independent (10-17% follower decisions). Also,
the probit results support this �nding with the follower coe�cients even being negative and
signi�cant. The probit results for downgrades largely support the empirical �ndings whereas
the upgrade results cannot be explained by following behavior. This result is related to earlier
�ndings by Hand et al. (1992) who show that the impact of downgrades on markets is much
stronger than the response of interest rates on upgrades. The authors conclude that down-
grade decisions include more new information than upgrades.
One may conclude from this that the inclusion of sovereign ratings in regulatory frameworks
puts large and in�uential agencies under pressure to be reluctant towards rating changes until
one of the competitors starts to take action. We have shown that this behavior is especially
pronounced in times of crises (in the euro area and in emerging markets) which might con-
tribute to explain the pro-cyclical downgrades that we have seen in the past.
To conclude, our analysis does not support the notion that rating agencies have deliber-
ately caused or at least aggravated the sovereign debt crisis in the euro area and might thus
contribute to soothe concerns of European politicians. However, the inclusion in regulatory
frameworks and the sheer size of agencies may have led to some unintended pro-cyclicality.
Of course, we do not claim that the same applies to asset classes such as structured �nance
products or corporate bonds where the issuer-pays model is of much more importance.
29

References
Adelino, M. and Ferreira, M. A. (2014). Bank ratings and lending supply: Evidence from
sovereign downgrades. Working Paper presented at the 2014 NBER Credit Rating Agency
Meeting.
Afonso, A., Furceri, D. and Gomes, P. (2012). Sovereign credit ratings and �nancial mar-
kets linkages: Application to european data. Journal of International Money and Finance,
31 (3), 606�638.
�, Gomes, P. and Rother, P. (2011). Short and long run determinants of sovereign debt
credit ratings. International Journal of Finance & Economics, 16 (1), 1�15.
Alsakka, R. and ap Gwilym, O. (2010). Leads and lags in sovereign credit ratings. Journal
of Banking & Finance, 34 (11), 2614�2626.
Bartels, B. and Weder di Mauro, B. (2013). A rating agency for europe - a good idea?
CEPR Discussion Paper, No. DP9512.
Bhattacharya, U., Wei, K. D. and Xia, H. (2014). Follow the money: Investor trading
around investor-paid rating changes. Working Paper presented at the 2014 NBER Credit
Rating Agency Meeting.
Boot, A. W., Milbourn, T. T. and Schmeits, A. (2006). Credit ratings as coordination
mechanisms. Review of Financial Studies, 19(1) (02-058/2), 81�118.
Borensztein, E., Cowan, K. and Valenzuela, P. (2013). Sovereign ceilings "lite"? the
impact of sovereign ratings on corporate ratings. Journal of Banking & Finance, 37 (11),
4014�4024.
Bruno, V., Cornaggia, J. and Cornaggia, K. R. (2013). Does regulatory certi�cation
a�ect the information content of credit ratings? Available at SSRN 1962840.
30
Candelon, B., Sy, A. N. R. and Arezki, R. (2011). Sovereign rating news and �nancial
markets spillovers: Evidence from the european debt crisis. IMF Working Paper, (11/68).
Cantor, R. and Packer, F. (1996). Determinants and impact of sovereign credit ratings.
Economic Policy Review, (Oct), 37�53.
Ferri, G., Liu, L.-G. and Stiglitz, J. E. (1999). The procyclical role of rating agencies:
Evidence from the east asian crisis. Economic Notes, 28, 335�355.
Fuchs, A. and Gehring, K. (2013). The home bias in sovereign ratings. University of Hei-
delberg.
Gaertner, M., Griesbach, B. and Jung, F. (2011). Pigs or lambs? the european sovereign
debt crisis and the role of rating agencies. International Advances in Economic Research,
17 (3), 288�299.
Güttler, A. and Wahrenburg, M. (2007). The adjustment of credit ratings in advance of
defaults. Journal of Banking & Finance, 31 (3), 751�767.
Hand, J. R. M., Holthausen, R. W. and Leftwich, R. W. (1992). The e�ect of bond
rating agency announcements on bond and stock prices. Journal of Finance, 47 (2), 733�52.
Hill, P. and Faff, R. (2010). The market impact of relative agency activity in the sovereign
ratings market. Journal of Business Finance & Accounting, 37 (9-10), 1309�1347.
Kaufmann, D., Kraay, A. and Mastruzzi, M. (2010). The worldwide governance indica-
tors - methodology and analytical issues. The World Bank Policy Research Working Paper,
WP5430, 1�29.
Livingston, M., Naranjo, A. and Zhou, L. (2007). Asset opaqueness and split bond
ratings. Financial Management, 36 (3), 49�62.
Morgan, D. P. (2002). Rating banks: Risk and uncertainty in an opaque industry. American
Economic Review, 92 (4), 874�888.
31

A Tables
Table 15: Country Table 1999-2012
Country Group (1) (2)Advanced Countries Emerging Countries
Australia ArgentinaAustria BrazilBelgium BulgariaCanada ChileDenmark ChinaFinland ColombiaFrance CroatiaGermany Czech RepublicGreece EgyptIreland EstoniaItaly HungaryJapan India
Netherlands IndonesiaNew Zealand Israel
Norway LatviaPortugal LithuaniaSingapore Malaysia
South Korea MexicoSpain PeruSweden Philippines
Switzerland PolandU.K. RomaniaU.S. Russia
SlovakiaSlovenia
South AfricaThailandTurkeyUkraineVenezuelaVietnam
classi�cation according to the IMF de�nition
32
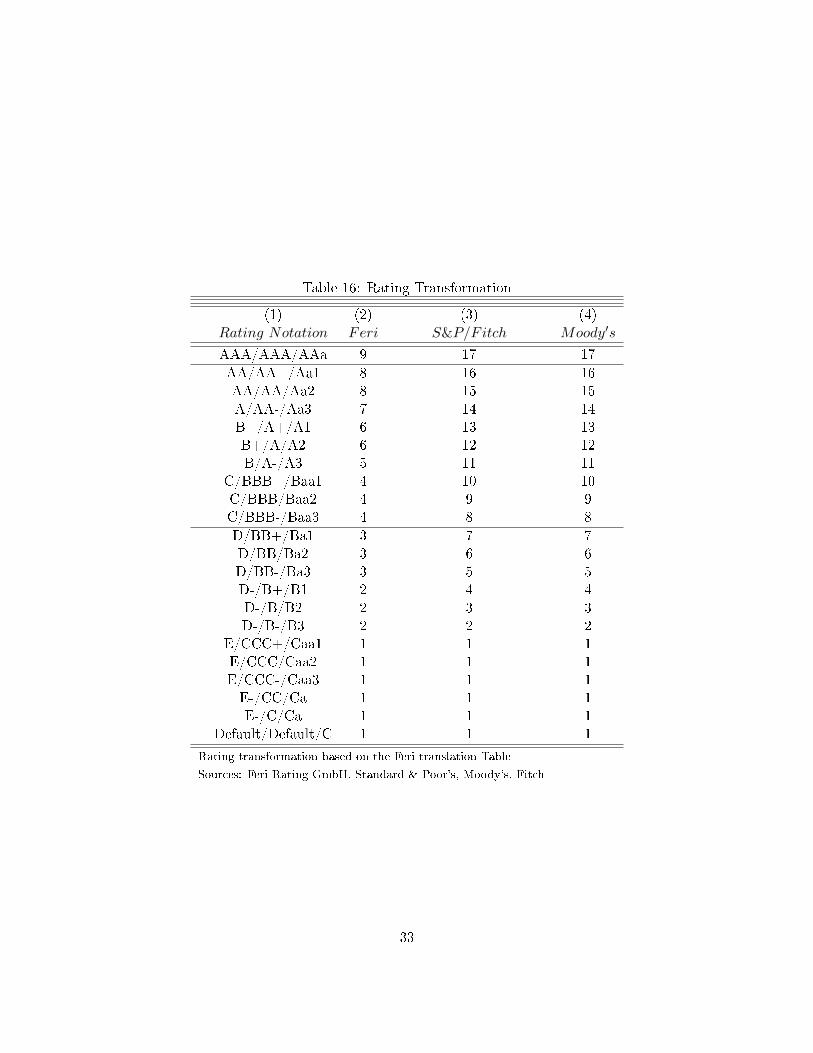
Table 16: Rating Transformation
(1) (2) (3) (4)Rating Notation Feri S&P/Fitch Moody′s
AAA/AAA/AAa 9 17 17
AA/AA+/Aa1 8 16 16AA/AA/Aa2 8 15 15A/AA-/Aa3 7 14 14B+/A+/A1 6 13 13B+/A/A2 6 12 12B/A-/A3 5 11 11
C/BBB+/Baa1 4 10 10C/BBB/Baa2 4 9 9C/BBB-/Baa3 4 8 8
D/BB+/Ba1 3 7 7D/BB/Ba2 3 6 6D/BB-/Ba3 3 5 5D-/B+/B1 2 4 4D-/B/B2 2 3 3D-/B-/B3 2 2 2
E/CCC+/Caa1 1 1 1E/CCC/Caa2 1 1 1E/CCC-/Caa3 1 1 1E-/CC/Ca 1 1 1E-/C/Ca 1 1 1
Default/Default/C 1 1 1
Rating transformation based on the Feri translation Table
Sources: Feri Rating GmbH, Standard & Poor's, Moody's, Fitch
33

Table 17: Classi�cation of Ratings
(1) (2) (3) (4)S&P Mooody's Fitch Feri
AAA/Aaa/AAA 179 191 169 142
AA/Aa/AA 95 89 104 118
A/A/A−B 122 129 117 145
BBB/Baa/C 134 122 141 172
BB/Ba/D 113 112 110 52
B/B/D− 43 50 43 34
CCC −D/Caa−D/E − E− 16 8 11 39
34

Table 18: Descriptive Statistics
(1) (2) (3) (4)Overall Sample Non-Split Split Feri-Big3 Split Big3
GDP per Capita 19.000 27.205 14.265 15.848
Government Debt 52.6 58.8 48.3 50.8
External Debt 64.2 36.1 84.7 73.2
Political Stability 0.92 1.04 0.98 0.69
Government Effectiveness 0.82 1.18 0.6 0.72
∆ Country Credit Rating (CCR) 4.58 4.17 5.12 5.02
Default History 221 47 100 74
European Monetary Union 137 63 51 23
35