why more midwest k problems in 2003? (and what can i do?) · . use a recent soil test to evaluate...
TRANSCRIPT

Why more Why more midwestmidwest K problems in K problems in 2003? (And what can I do?)2003? (And what can I do?)
Paul Fixen and T. Scott MurrellPaul Fixen and T. Scott MurrellPotash & Phosphate InstitutePotash & Phosphate Institute

Some possibilities to be discussed
• K application vs crop removal
• Soil test K levels and trends
• Factors influencing soil test K measurement and interpretation

K fertilizer consumption in WI
200
250
300
350
400
450
1975 1980 1985 1990 1995 2000 2005
K 20,
100
0 sh
ort
ton
s .

Percent of total area planted that is in a corn-soybean rotation
47
35
18
69
84
3172 70 40
3122
Padgitt et al., 2000
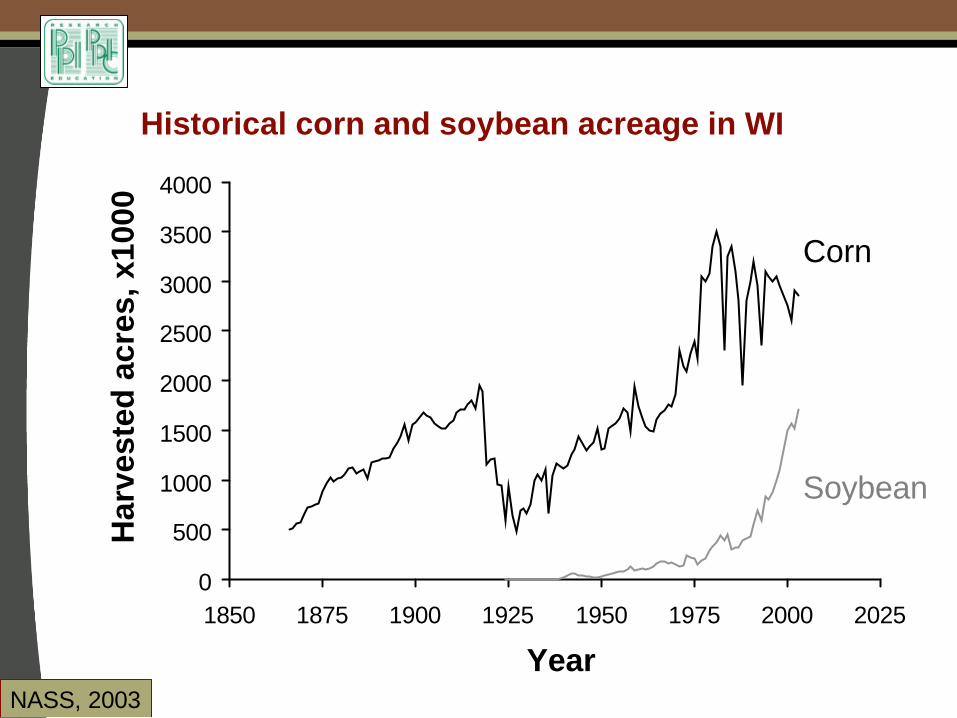
Historical corn and soybean acreage in WI
0
500
1000
1500
2000
2500
3000
3500
4000
1850 1875 1900 1925 1950 1975 2000 2025
Year
Har
vest
ed a
cres
, x10
00
Corn
Soybean
NASS, 2003

Historical K removal by corn/soybean rotation in WI
0
20
40
60
80
100
120
1920 1940 1960 1980 2000 2020
End of soybean year in corn/soybean rotation
To
tal K
rem
ove
d b
y ro
tati
on
, lb
K2O
/A
NASS, 2003; PPI, 2003
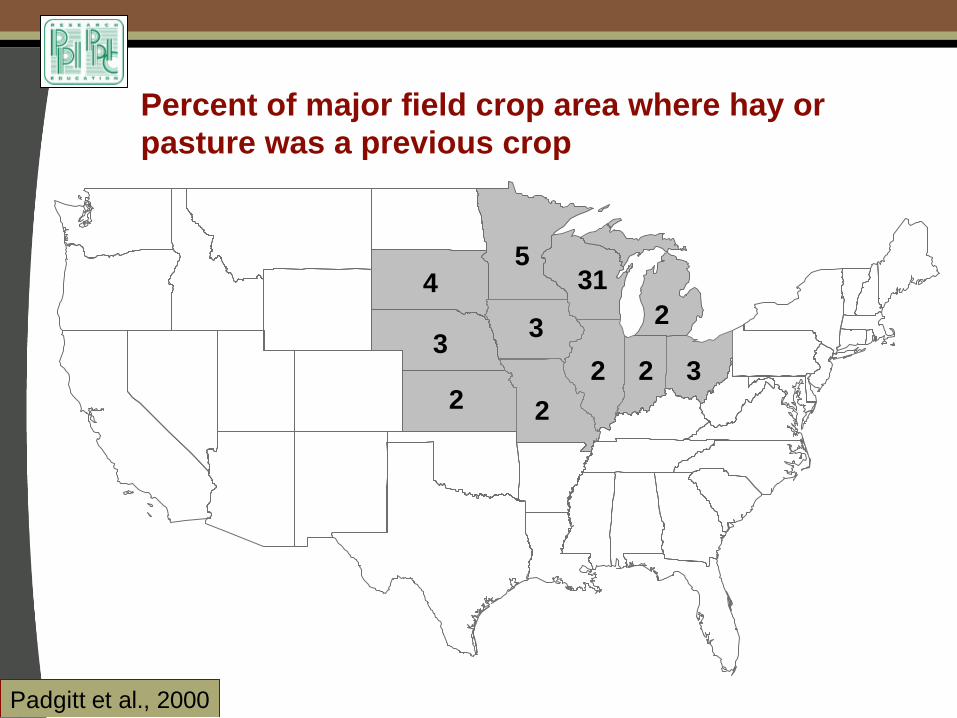
Percent of major field crop area where hay or pasture was a previous crop
4
3
2
5
3
22 2 3
312
Padgitt et al., 2000

Historical alfalfa and corn silage acreage
0
500
1000
1500
2000
2500
3000
3500
1900 1925 1950 1975 2000 2025
Year
Har
vest
ed a
cres
, x10
00
Alfalfa
Corn silage
NASS, 2003

Historical K removal by forage crops in WI
0
50
100
150
200
250
1900 1920 1940 1960 1980 2000 2020
Year
K r
emo
val,
lb K
2O/A
/Yr
Alfalfa
Corn silage
NASS, 2003; PPI, 2003

Wisconsin K Removal by Major Crops
PPI/PPIC/FAR 2002
Alfalfa47%
Corn (grain)15%
Corn (silage)13%
Soybeans11%
Other hay6%
Other8%

Wisconsin partial K budget
PPI/PPIC/FAR 2002
0.94Ratio: R / (F + M)
1.30Ratio: R / F
50.0Balance: (F + M) – R
-172.0Balance: F – R
222Recoverable manure (M)
567Applied fertilizer (F)
739.0Crop removal (R)
Million lb K2O
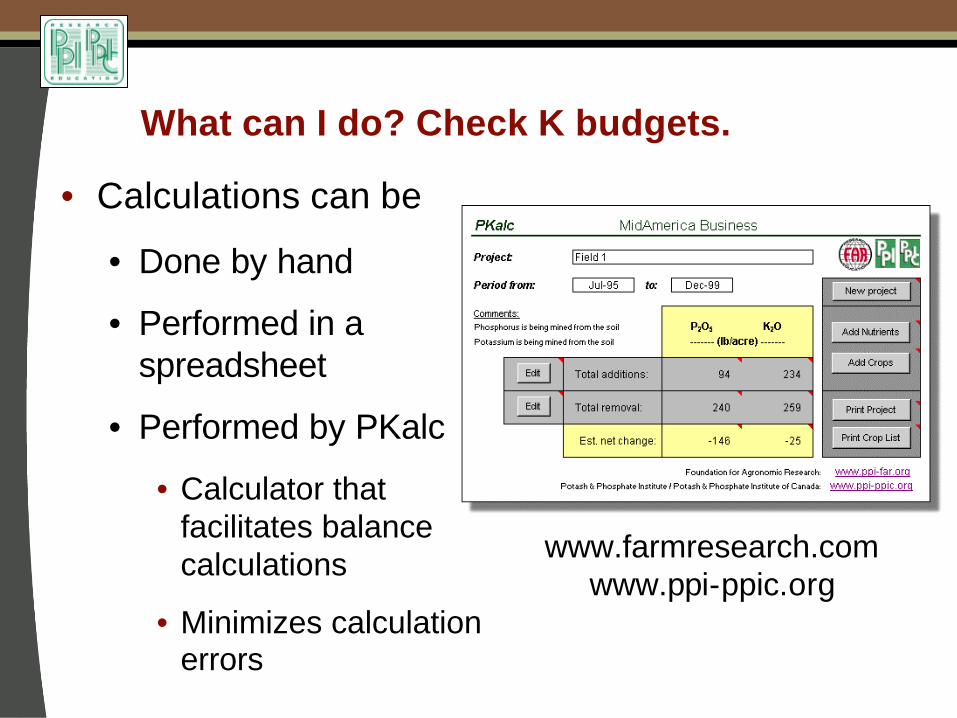
What can I do? Check K budgets.
• Calculations can be
• Done by hand
• Performed in a spreadsheet
• Performed by PKalc
• Calculator that facilitates balance calculations
• Minimizes calculation errors
www.farmresearch.comwww.ppi-ppic.org
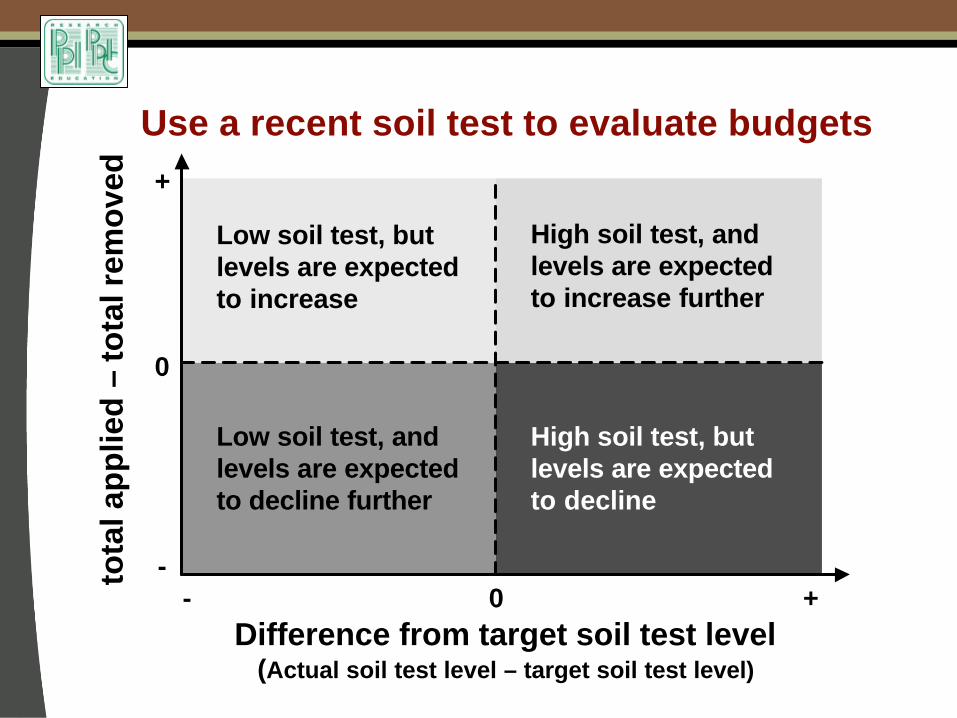
Use a recent soil test to evaluate budgets
Low soil test, andlevels are expectedto decline further
Low soil test, butlevels are expectedto increase
High soil test, butlevels are expectedto decline
High soil test, andlevels are expectedto increase further
tota
l ap
plie
d –
tota
l rem
ove
d
0
+
-0
Difference from target soil test level(Actual soil test level – target soil test level)
+-

Combs and Peters

% o
f sa
mpl
es
Distribution of soil K levels in WI
Wisconsin has the highestWisconsin has the highestfrequency of soils below 160 frequency of soils below 160 ppm ppm in the central Corn Belt in the central Corn Belt MN
OHINIL
IA
WIMI
MO
KY
7077
56715662
54
56
51MN
OHINIL
IA
WIMI
MO
KY
7077
56715662
54
56
51
Central Corn Belt soils testing <160 ppm, %
2001
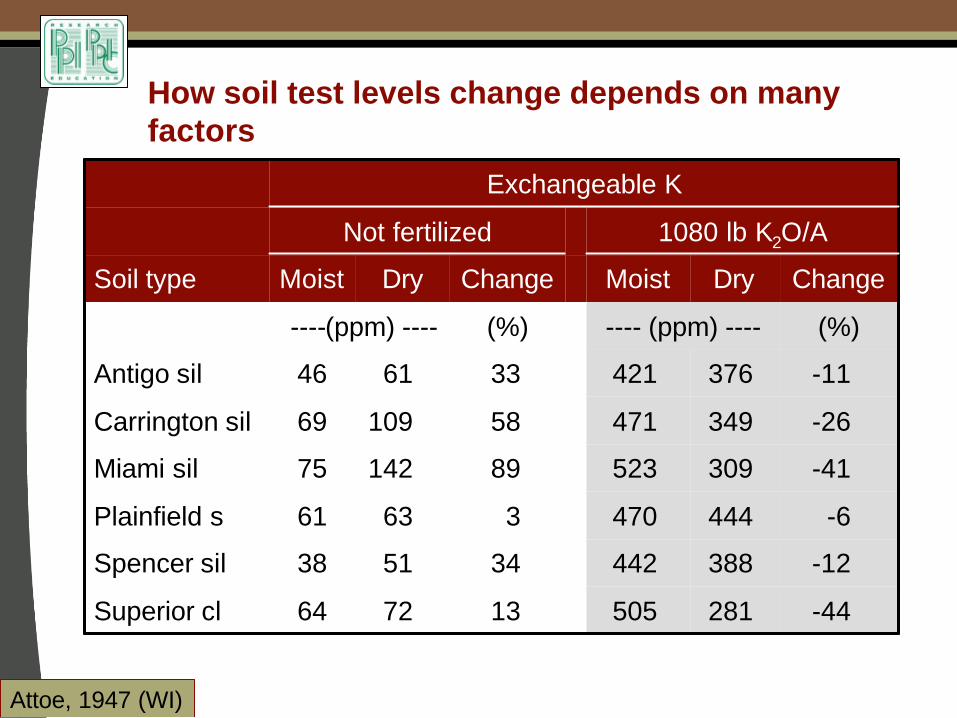
How soil test levels change depends on many factors
-44281505137264Superior cl
-12388442345138Spencer sil
-644447036361Plainfield s
-413095238914275Miami sil
-263494715810969Carrington sil
-11376421336146Antigo sil
(%)---- (ppm) ----(%)----(ppm) ----
ChangeDryMoistChangeDryMoistSoil type
1080 lb K2O/ANot fertilized
Exchangeable K
Attoe, 1947 (WI)

Laboratory drying temperature can affect soil test K differently for various soils
4357
107
137
47
70
152 151
6075
183198
0
50
100
150
200
250
Marshall Kenyon Mahaska Nicollet andWebsterSoil series
Incr
ease
in e
xtra
cted
K o
ver
a fie
ld m
oist
sam
ple,
per
cent
Dryingtemperature
Air
104 F
122 F
Mallarino et al., 2003 (IA)
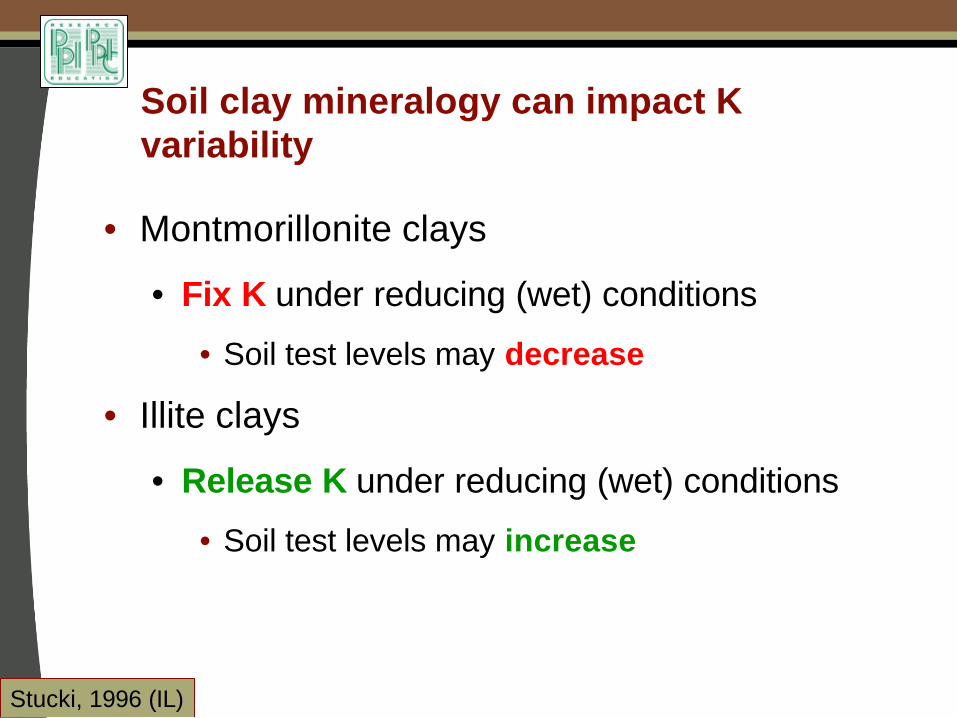
Soil clay mineralogy can impact K variability
• Montmorillonite clays
• Fix K under reducing (wet) conditions
• Soil test levels may decrease
• Illite clays
• Release K under reducing (wet) conditions
• Soil test levels may increase
Stucki, 1996 (IL)
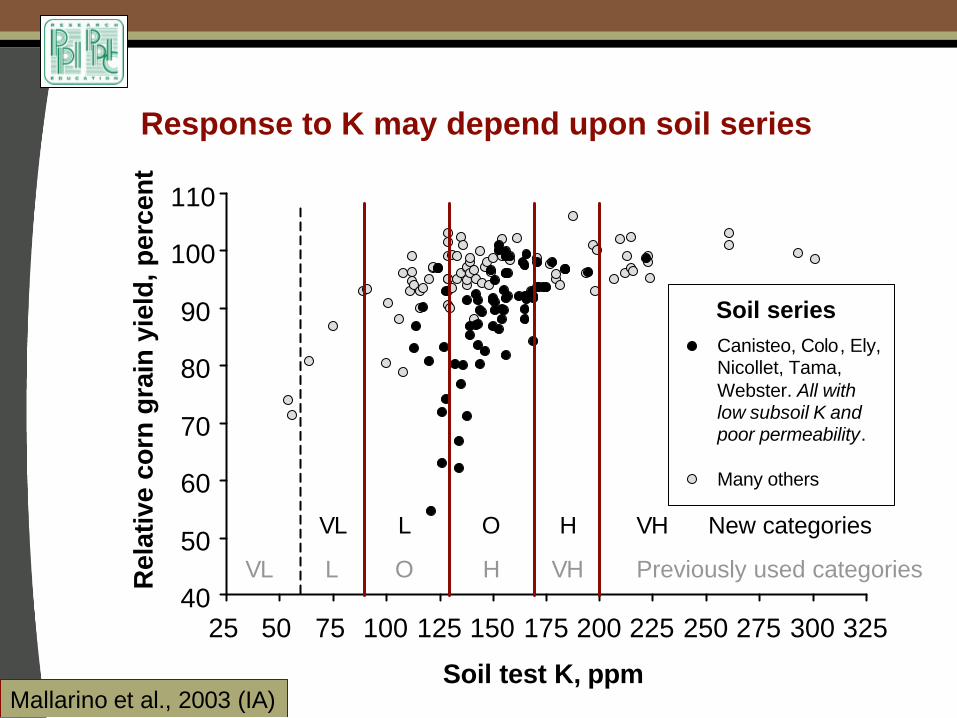
Response to K may depend upon soil series
40
50
60
70
80
90
100
110
25 50 75 100 125 150 175 200 225 250 275 300 325
Soil test K, ppm
Rel
ativ
e co
rn g
rain
yie
ld, p
erce
nt
VL L O H VH
Soil seriesCanisteo, Colo, Ely,Nicollet, Tama,Webster. All withlow subsoil K andpoor permeability.
Many others
Mallarino et al., 2003 (IA)
Previously used categories
VL L O H VH New categories
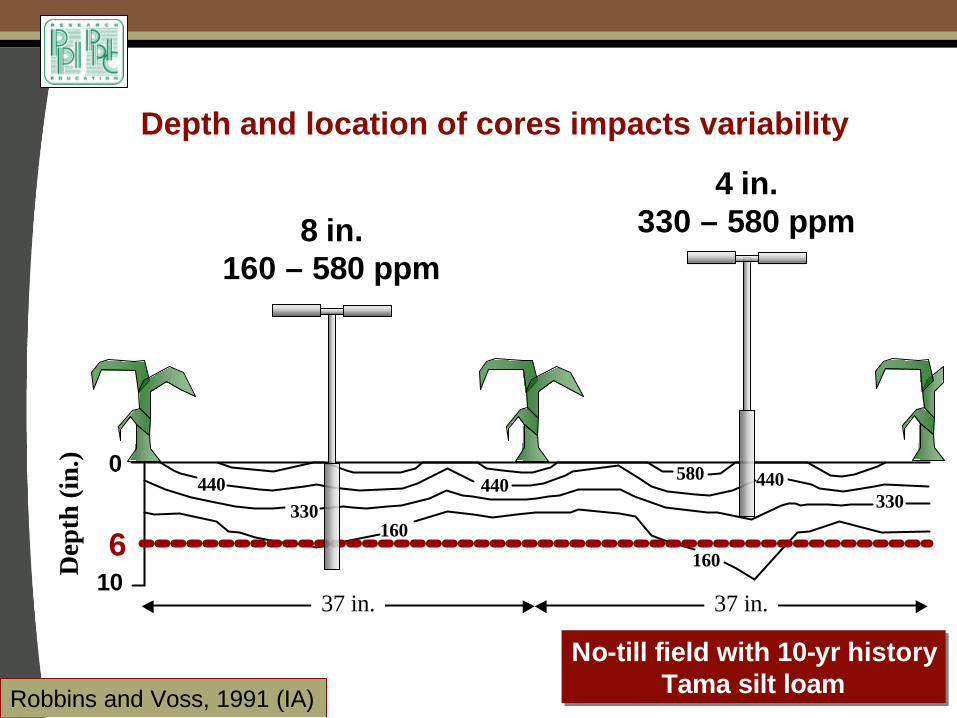
Depth and location of cores impacts variability
No-till field with 10-yr historyTama silt loam
No-till field with 10-yr historyTama silt loamRobbins and Voss, 1991 (IA)
440 580330
440
160
330
440
37 in.37 in.
0
10
Dep
th (i
n.)
1606
8 in.160 – 580 ppm
4 in.330 – 580 ppm

Core number impacts variability
Soil test P category upper limit (ppm)
Fre
qu
ency
(50
to
tal)
0 2
1720
73 1
0
5
10
15
20
25
30
35
40
5 cores per sample
0 0
8
34
8
0 00
5
10
15
20
25
30
35
40
10 20 30 40 50 60 70
20 cores per sample
True average

What can I do? Monitor K status of crops and record metadata.• Watch for visual symptoms of K
deficiency
• Test plant tissue
• Plants with and without visual deficiency symptoms
• Consult “Using Plant Analysis as a Diagnostic Tool”, Kelling et al.
• Test soils properly and consistently
• Note soil moisture conditions at sampling
• Record soil series, landscape position, past cropping history, and nutrient applications

Strive for improved K management
• K management may require more vigilance
• Consider making more intensive K measurements part of an initiative at the retail outlet or consulting business
• Let farmers know there is uncertainty in soil test K data and provide options
• Tissue testing
• Establishing monitoring areas for soil test K under different moisture conditions, soil series, and fertilization practices
• Share findings during meetings to create awareness of your efforts and any results