why local solar for all costs less
TRANSCRIPT
WHY LOCAL SOLAR FOR ALL COSTS LESS:A NEW ROADMAP FOR THE LOWEST COST GRIDR E S U L T S S U M M A R Y | D E C E M B E R 2 0 2 0
1
2
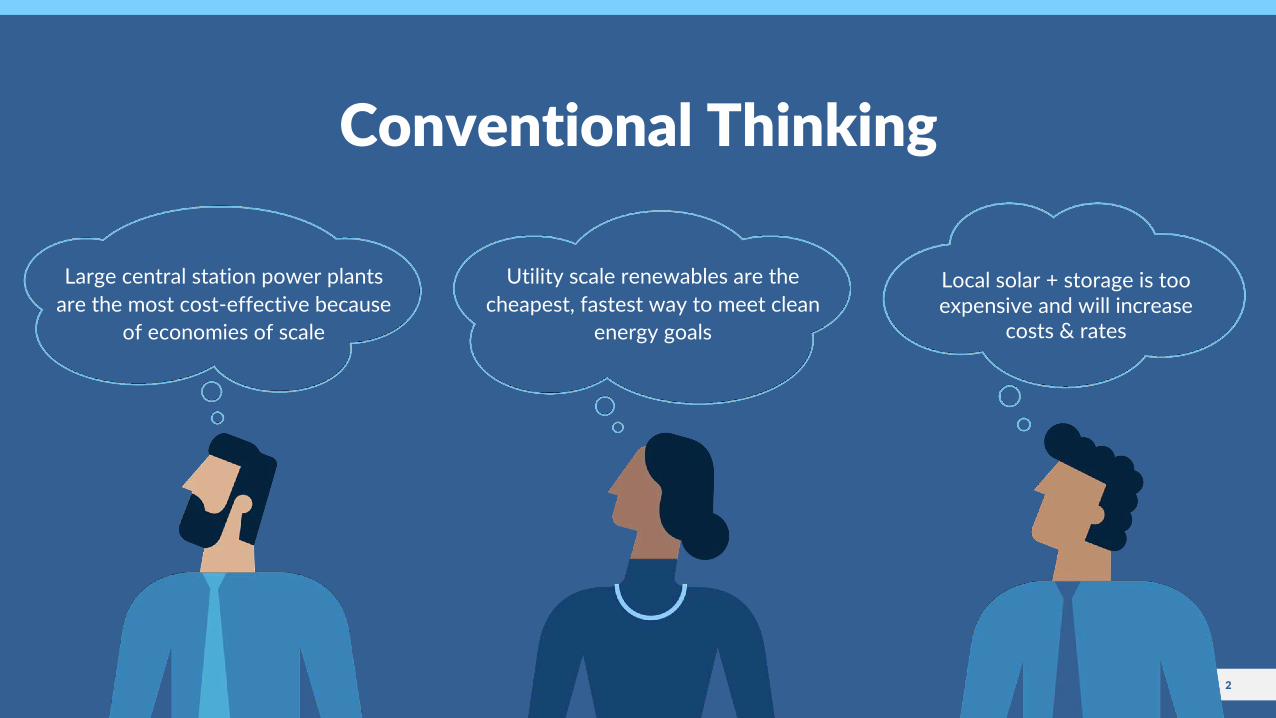
Conventional Thinking
Large central station power plants are the most cost-effective because
of economies of scale
Utility scale renewables are the cheapest, fastest way to meet clean
energy goals
Local solar + storage is too expensive and will increase
costs & rates

3
A New Paradigm
New & better modelsScaling utility renewables and local
solar and storage maximizes ratepayer savings
Grid of the future has at least 10x more local solar + storage
4
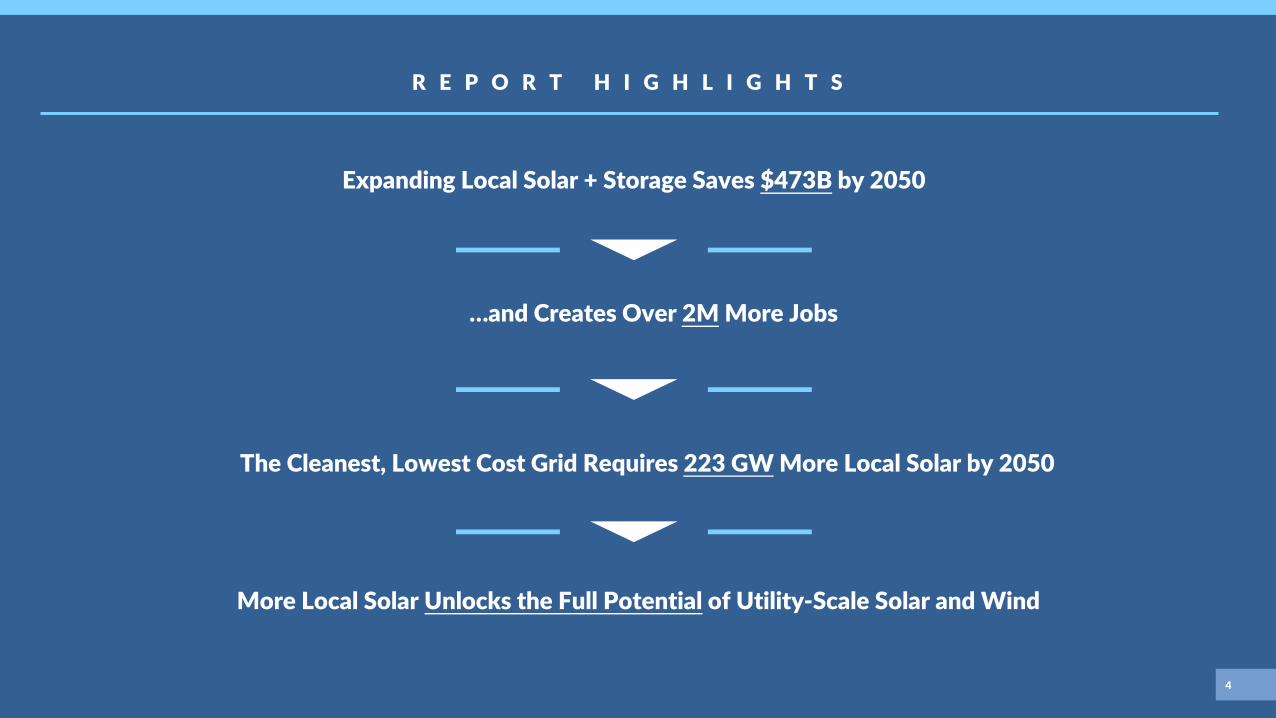
R E P O R T H I G H L I G H T S
Expanding Local Solar + Storage Saves $473B by 2050
…and Creates Over 2M More Jobs
More Local Solar Unlocks the Full Potential of Utility-Scale Solar and Wind
The Cleanest, Lowest Cost Grid Requires 223 GW More Local Solar by 2050
WHY TRADITIONAL UTILITY PLANNING MODELS ARE INSUFFICIENT
A SMARTER MODEL TO BUILD A MODERN ELECTRIC GRID
POLICY IMPLICATIONS
WHAT WIS:DOM® SAYS ABOUT LOCAL SOLAR + STORAGE
QUESTIONS
Table Of Contents
01
02
03
04
05
5
Why Traditional Utility Planning Models Are Insufficient
6
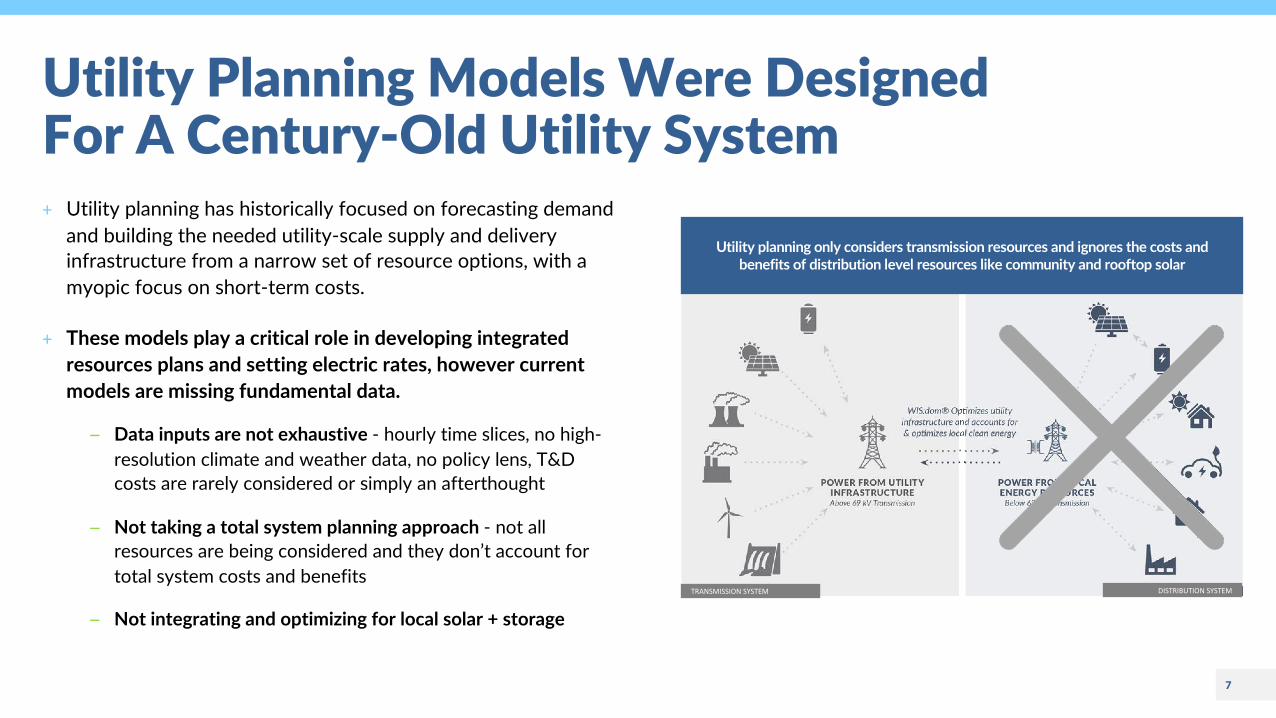
+ Utility planning has historically focused on forecasting demand and building the needed utility-scale supply and delivery infrastructure from a narrow set of resource options, with a myopic focus on short-term costs.
+ These models play a critical role in developing integrated resources plans and setting electric rates, however current models are missing fundamental data.
– Data inputs are not exhaustive - hourly time slices, no high-resolution climate and weather data, no policy lens, T&D costs are rarely considered or simply an afterthought
– Not taking a total system planning approach - not all resources are being considered and they don’t account for total system costs and benefits
– Not integrating and optimizing for local solar + storage
Utility Planning Models Were Designed For A Century-Old Utility System
7
TRANSMISSION SYSTEM DISTRIBUTION SYSTEM
Utility planning only considers transmission resources and ignores the costs and benefits of distribution level resources like community and rooftop solar

The World Is Changing, Traditional Utility Planning Models Are Not Keeping UpToday, almost everything except our planning models and processes have changed. Several forms of large-scale generation present unacceptable environmental costs. Policymakers are prioritizing energy and climate goals. Customers want more energy choices. Climate change and weather disruptions are making our grid less efficient and resilient. The number of low-wealth households with high energy burdens is growing. And local solar and storage is growing in popularity because it is cost-competitive and has numerous societal benefits.
8
The increasing pressures on the traditional utility planning models

The Rise Of Local Solar + Storage+ LOCAL SOLAR + STORAGE are distributed
solar generation and storage technologies that provide electric services to the grid. Technologies include rooftop and community solar and battery storage.
+ BENEFITS OF LOCAL SOLAR INCLUDE direct and indirect benefits such as reduced grid costs (as demonstrated in this report), lower energy bills, local job creation and economic impact, resiliency, innovation, and more equitable participation.
+ LOCAL SOLAR + STORAGE DEPLOYMENT IS GROWING NATIONALLY
Local Solar Continues to Grow: U.S. Distributed Solar PV Deployment Forecast
SOURCE: SEIA/Wood Mackenzie Power & Renewables U.S. Solar Market Insight 2020 Q3 9
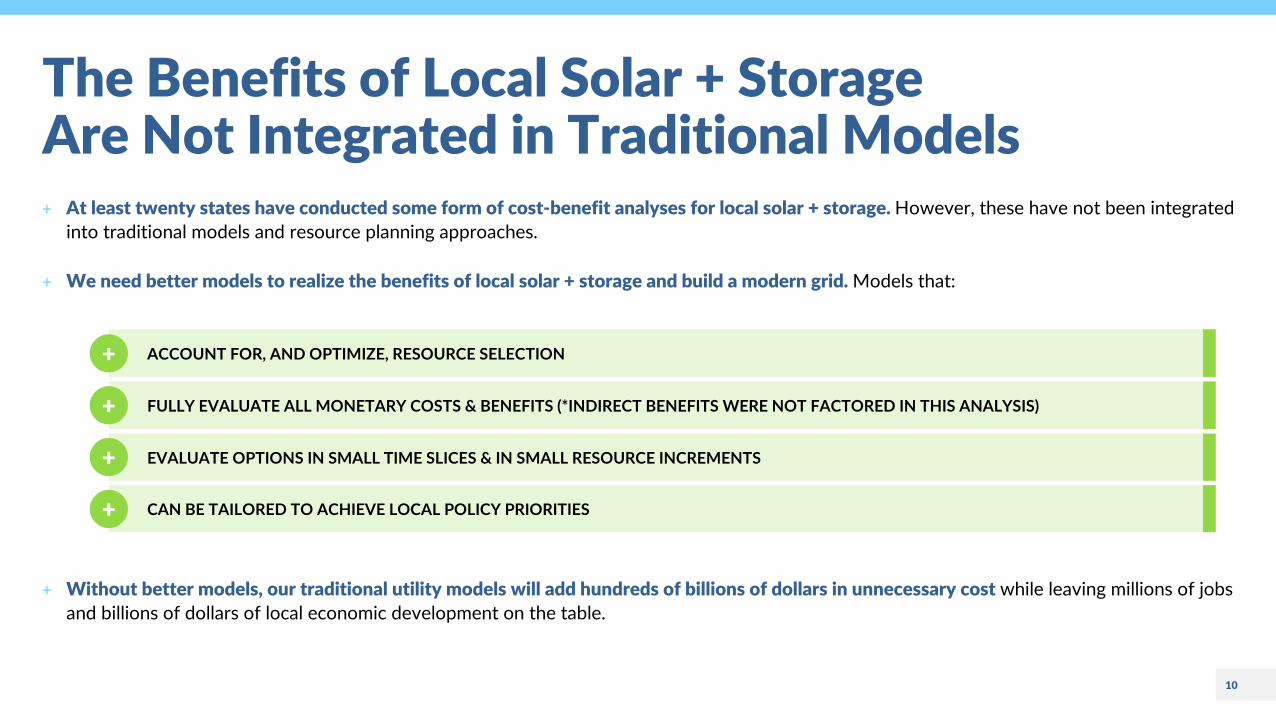
The Benefits of Local Solar + Storage Are Not Integrated in Traditional Models+ At least twenty states have conducted some form of cost-benefit analyses for local solar + storage. However, these have not been integrated
into traditional models and resource planning approaches.
+ We need better models to realize the benefits of local solar + storage and build a modern grid. Models that:
10
+ Without better models, our traditional utility models will add hundreds of billions of dollars in unnecessary cost while leaving millions of jobs and billions of dollars of local economic development on the table.
ACCOUNT FOR, AND OPTIMIZE, RESOURCE SELECTION
FULLY EVALUATE ALL MONETARY COSTS & BENEFITS (*INDIRECT BENEFITS WERE NOT FACTORED IN THIS ANALYSIS)
EVALUATE OPTIONS IN SMALL TIME SLICES & IN SMALL RESOURCE INCREMENTS
CAN BE TAILORED TO ACHIEVE LOCAL POLICY PRIORITIES
+
+
+
+

A Smarter Model To Build A Modern Electric Grid
11
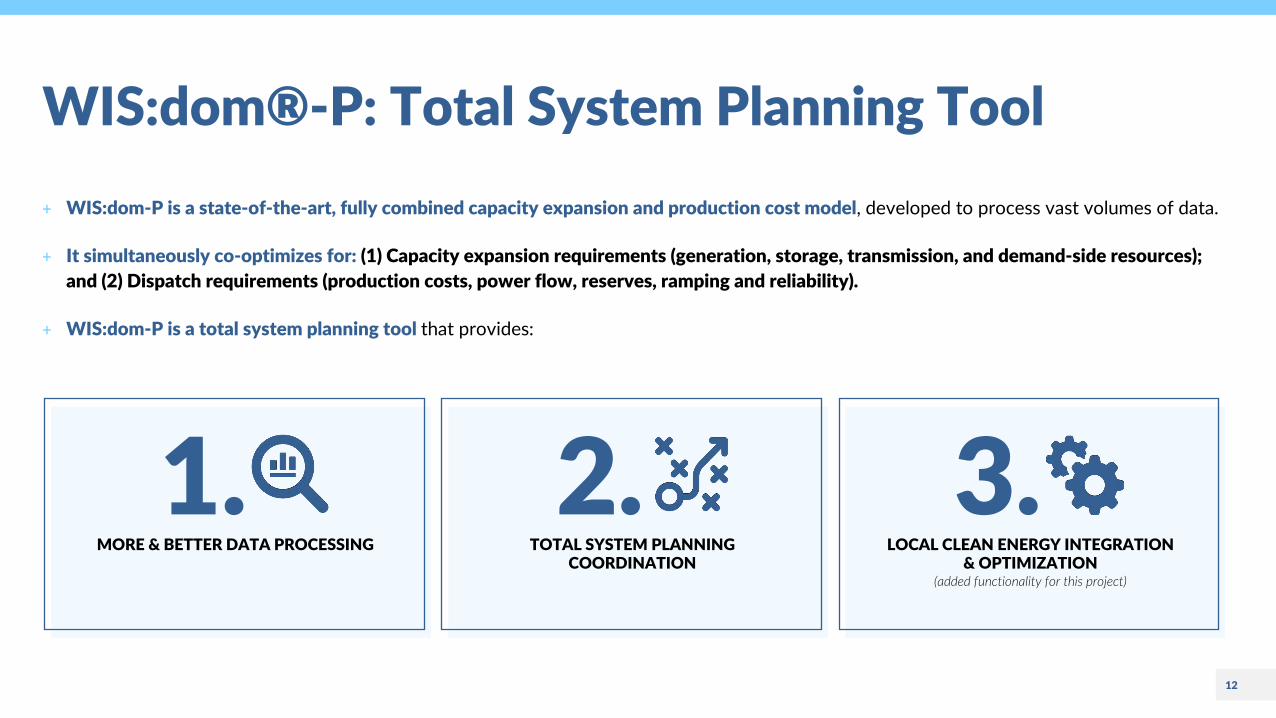
WIS:dom®-P: Total System Planning Tool+ WIS:dom-P is a state-of-the-art, fully combined capacity expansion and production cost model, developed to process vast volumes of data.
+ It simultaneously co-optimizes for: (1) Capacity expansion requirements (generation, storage, transmission, and demand-side resources); and (2) Dispatch requirements (production costs, power flow, reserves, ramping and reliability).
+ WIS:dom-P is a total system planning tool that provides:
12
1. 2. 3.MORE & BETTER DATA PROCESSING TOTAL SYSTEM PLANNING
COORDINATIONLOCAL CLEAN ENERGY INTEGRATION
& OPTIMIZATION(added functionality for this project)
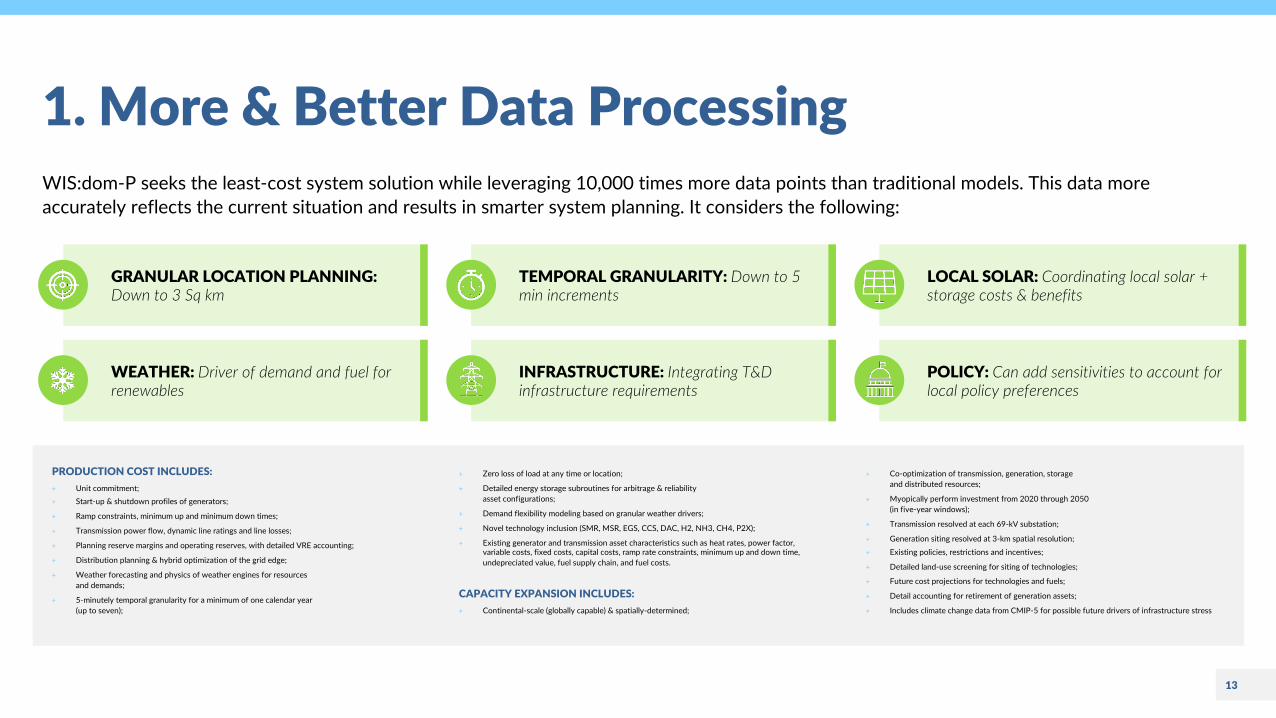
1. More & Better Data ProcessingWIS:dom-P seeks the least-cost system solution while leveraging 10,000 times more data points than traditional models. This data more accurately reflects the current situation and results in smarter system planning. It considers the following:
13
GRANULAR LOCATION PLANNING: Down to 3 Sq km
TEMPORAL GRANULARITY: Down to 5 min increments
LOCAL SOLAR: Coordinating local solar + storage costs & benefits
WEATHER: Driver of demand and fuel for renewables
INFRASTRUCTURE: Integrating T&D infrastructure requirements
POLICY: Can add sensitivities to account for local policy preferences
PRODUCTION COST INCLUDES:+ Unit commitment; + Start-up & shutdown profiles of generators;
+ Ramp constraints, minimum up and minimum down times;
+ Transmission power flow, dynamic line ratings and line losses;
+ Planning reserve margins and operating reserves, with detailed VRE accounting;
+ Distribution planning & hybrid optimization of the grid edge;
+ Weather forecasting and physics of weather engines for resourcesand demands;
+ 5-minutely temporal granularity for a minimum of one calendar year (up to seven);
+ Zero loss of load at any time or location;
+ Detailed energy storage subroutines for arbitrage & reliability asset configurations;
+ Demand flexibility modeling based on granular weather drivers;
+ Novel technology inclusion (SMR, MSR, EGS, CCS, DAC, H2, NH3, CH4, P2X);
+ Existing generator and transmission asset characteristics such as heat rates, power factor, variable costs, fixed costs, capital costs, ramp rate constraints, minimum up and down time, undepreciated value, fuel supply chain, and fuel costs.
CAPACITY EXPANSION INCLUDES:+ Continental-scale (globally capable) & spatially-determined;
+ Co-optimization of transmission, generation, storage and distributed resources;
+ Myopically perform investment from 2020 through 2050 (in five-year windows);
+ Transmission resolved at each 69-kV substation;
+ Generation siting resolved at 3-km spatial resolution; + Existing policies, restrictions and incentives;
+ Detailed land-use screening for siting of technologies;
+ Future cost projections for technologies and fuels;
+ Detail accounting for retirement of generation assets;
+ Includes climate change data from CMIP-5 for possible future drivers of infrastructure stress
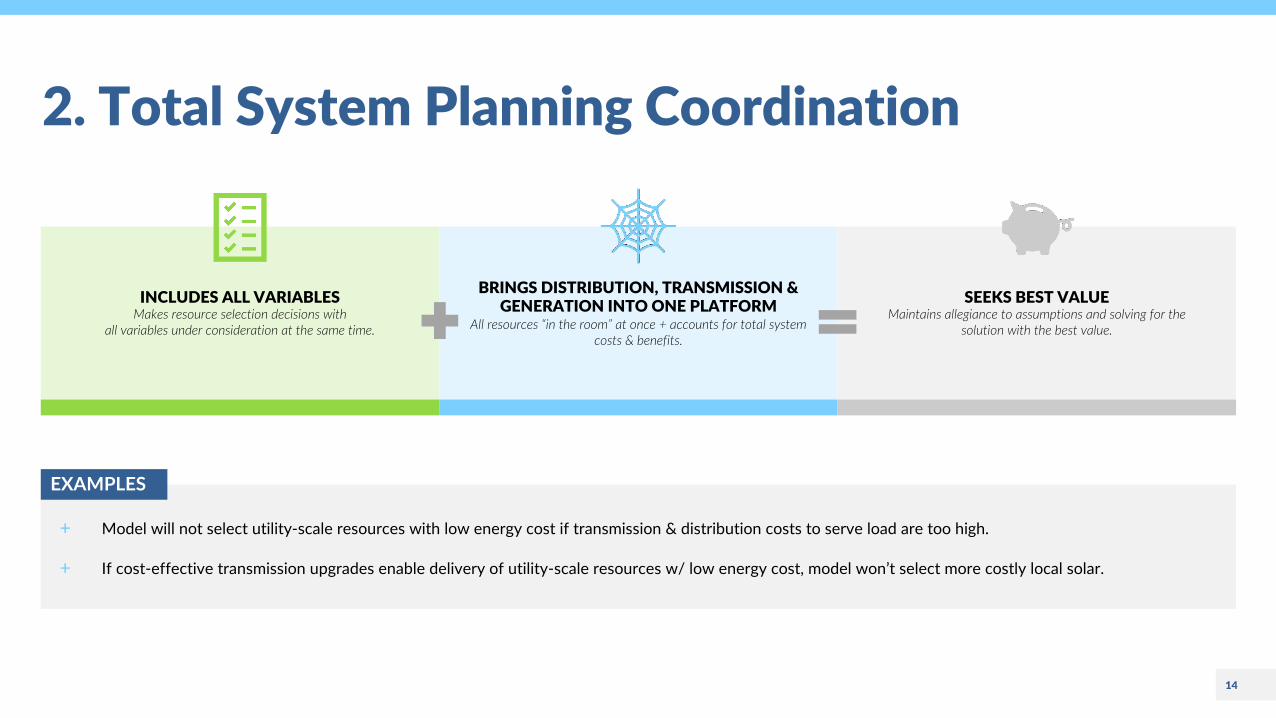
+ Model will not select utility-scale resources with low energy cost if transmission & distribution costs to serve load are too high.
+ If cost-effective transmission upgrades enable delivery of utility-scale resources w/ low energy cost, model won’t select more costly local solar.
2. Total System Planning Coordination
14
INCLUDES ALL VARIABLESMakes resource selection decisions with
all variables under consideration at the same time.
BRINGS DISTRIBUTION, TRANSMISSION & GENERATION INTO ONE PLATFORM
All resources “in the room” at once + accounts for total system costs & benefits.
SEEKS BEST VALUEMaintains allegiance to assumptions and solving for the
solution with the best value.
EXAMPLES

WIS:dom optimizes utility infrastructure (left) + integrates all resource options including local energy produced on the distribution grid (right)
DISTRIBUTION SYSTEMTRANSMISSION SYSTEM
3. Integrate & Optimize For Local Solar
15
+ WIS:dom-P co-optimizes and coordinates the utility-scale electricity grid (left) with the distribution grid (right) to find the overall least system cost.
+ Co-optimize and coordinate means it considers distribution infrastructure requirements and determines when leveraging local solar + storage to serve local load and/or reduce peak load, could lessen the need for some distribution infrastructure and forego additional utility-scale generation and transmission buildout.
LOAD FLOW BACK FLOW

What WIS:dom Says About Local Solar + Storage
16
17
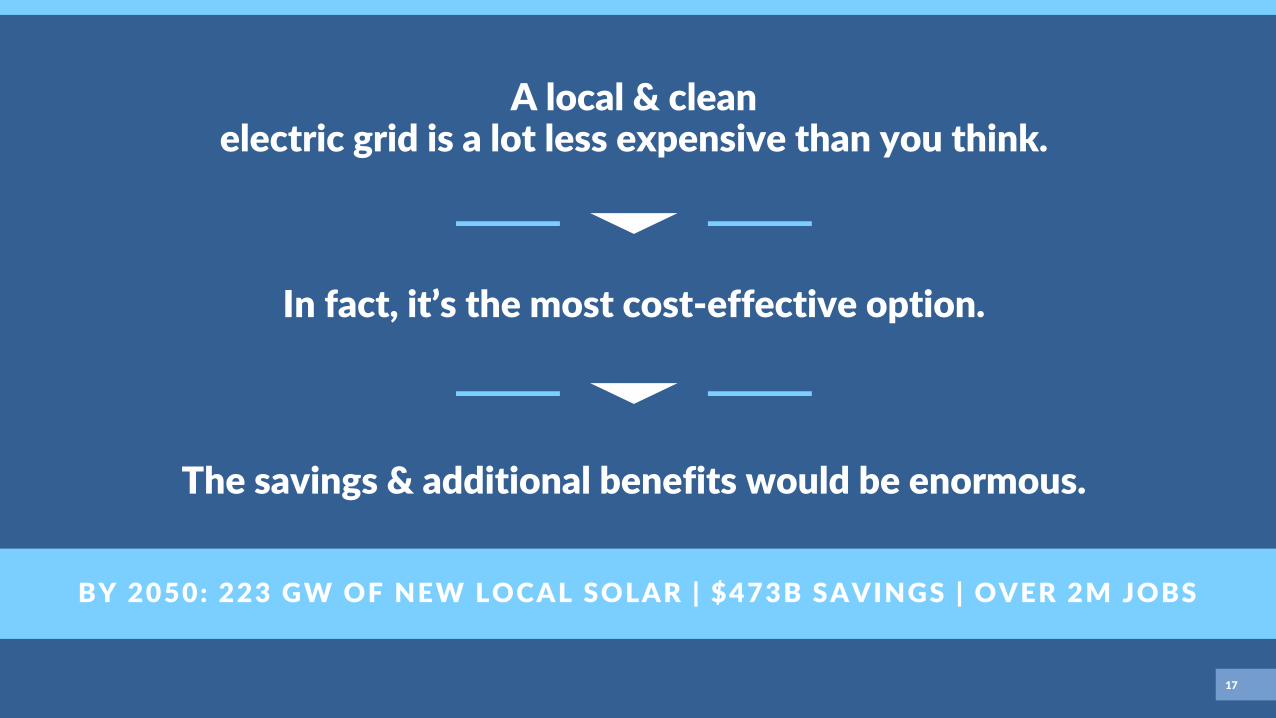
A local & clean electric grid is a lot less expensive than you think.
In fact, it’s the most cost-effective option.
The savings & additional benefits would be enormous.
BY 2050: 223 GW OF NEW LOCAL SOLAR | $473B SAVINGS | OVER 2M JOBS
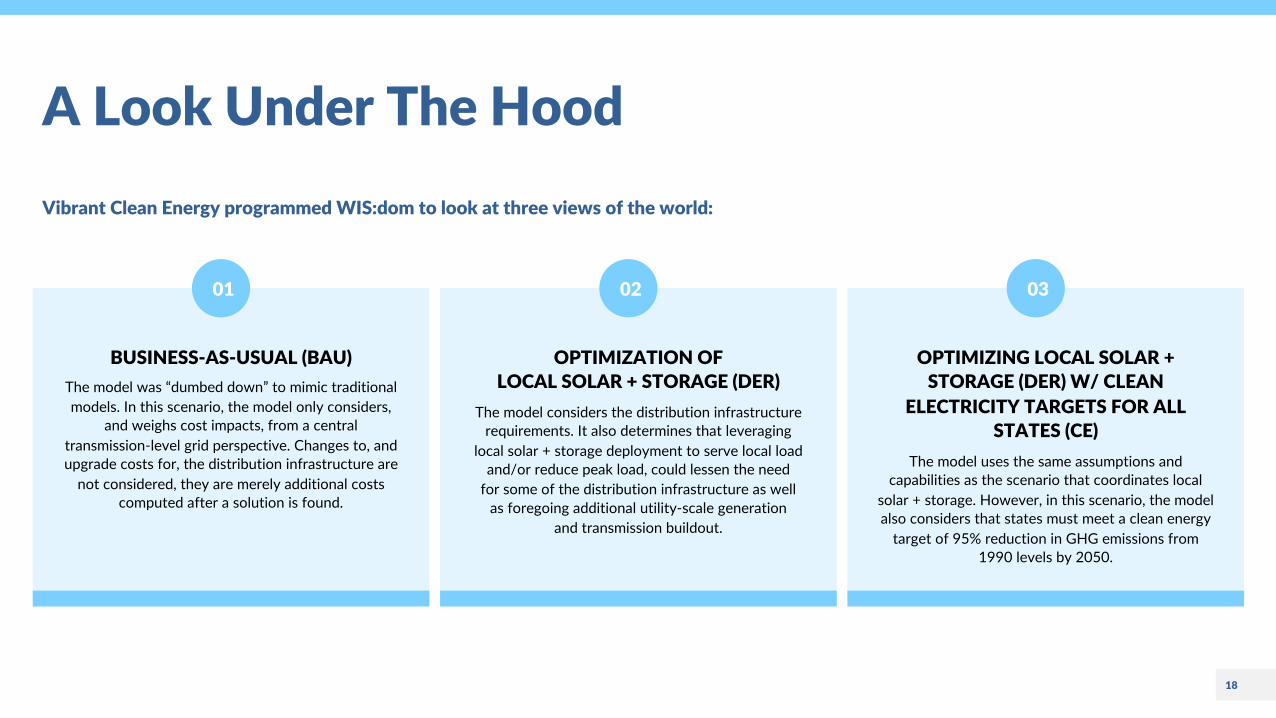
A Look Under The Hood
BUSINESS-AS-USUAL (BAU)The model was “dumbed down” to mimic traditional models. In this scenario, the model only considers,
and weighs cost impacts, from a central transmission-level grid perspective. Changes to, and upgrade costs for, the distribution infrastructure are
not considered, they are merely additional costs computed after a solution is found.
Vibrant Clean Energy programmed WIS:dom to look at three views of the world:
18
01
OPTIMIZATION OF LOCAL SOLAR + STORAGE (DER)
The model considers the distribution infrastructure requirements. It also determines that leveraging
local solar + storage deployment to serve local load and/or reduce peak load, could lessen the need
for some of the distribution infrastructure as well as foregoing additional utility-scale generation
and transmission buildout.
OPTIMIZING LOCAL SOLAR + STORAGE (DER) W/ CLEAN
ELECTRICITY TARGETS FOR ALL STATES (CE)
The model uses the same assumptions and capabilities as the scenario that coordinates local
solar + storage. However, in this scenario, the model also considers that states must meet a clean energy
target of 95% reduction in GHG emissions from 1990 levels by 2050.
02 03
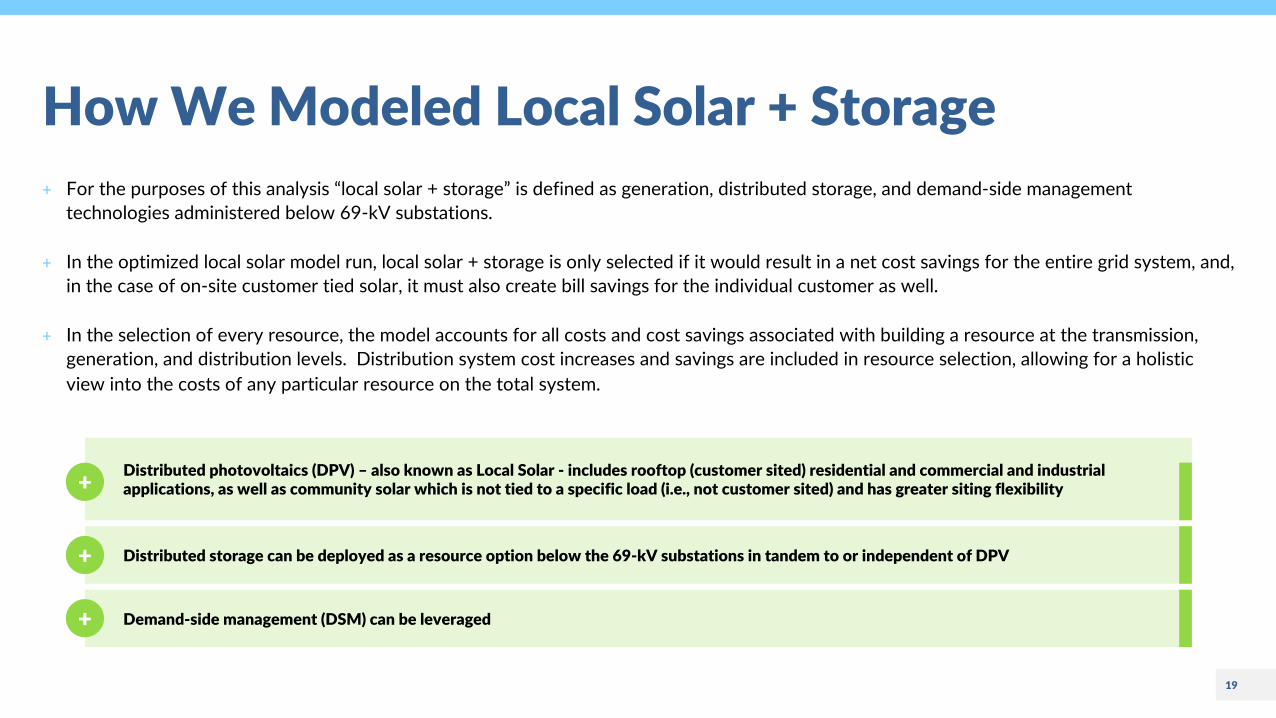
How We Modeled Local Solar + Storage+ For the purposes of this analysis “local solar + storage” is defined as generation, distributed storage, and demand-side management
technologies administered below 69-kV substations.
+ In the optimized local solar model run, local solar + storage is only selected if it would result in a net cost savings for the entire grid system, and, in the case of on-site customer tied solar, it must also create bill savings for the individual customer as well.
+ In the selection of every resource, the model accounts for all costs and cost savings associated with building a resource at the transmission, generation, and distribution levels. Distribution system cost increases and savings are included in resource selection, allowing for a holistic view into the costs of any particular resource on the total system.
19
Distributed photovoltaics (DPV) – also known as Local Solar - includes rooftop (customer sited) residential and commercial and industrial applications, as well as community solar which is not tied to a specific load (i.e., not customer sited) and has greater siting flexibility
Distributed storage can be deployed as a resource option below the 69-kV substations in tandem to or independent of DPV
Demand-side management (DSM) can be leveraged
+
+
+

Expanding Local Solar + Storage Saves $473B+ Optimizing and making initial investments in utility-scale and distribution
level grid infrastructure and capacity drives huge long-term savings relative to traditional electricity grid system planning.
+ The savings captured in this chart include only monetary grid costs and benefits, it doesn’t include indirect societal benefits.
+ When the model is allowed to choose and optimize local solar + storage (DER vs BAU), it results in cumulative savings of over $300B.
+ Comparing (BAU-CE) vs. (BAU) costs $385 billion by 2050.
+ Comparing (DER-CE) vs (BAU) saves $88 billion by 2050 demonstrating that a clean electric grid that leverages expanded local solar + storage is less expensive than a grid that does nothing different than we’re doing today.
+ The savings are even bigger when you model for a clean electricity targets (DER-CE vs BAU-CE): $473B!
+ In addition to saving billions, the model shows expanding local solar + storage results in lower costs per kilowatt hour (total system costs divided by total generation), translating into lower rates and customer savings.
20
DER Savings vs. BAU
Cumulative Electricity Spending Savings
DER-CE Savings vs. CE DER-CE Savings vs. BAU
-$100
$0
$100
$200
$300
$400
$500
2018
2019
2020
2021
2022
2023
2024
2025
2026
2027
2028
2029
2030
2031
2032
2033
2034
2035
2036
2037
2038
2039
2040
2041
2042
2043
2044
2045
2046
2047
2048
2049
2050
CU
MU
LAT
IVE
ELE
CT
RIC
ITY
SP
EN
DIN
G
SAV
ING
S (B
ILLI
ON
S $
)*BAU = Business as usual, DER = Optimization of Local solar + storage, and CE = clean electricity targets

What Did WIS:dom Build & Why?+ Conventional wisdom would predict the model choosing continued build out of
“lower cost” per unit utility-scale resources and transmission infrastructure with unidirectional flow from supply to load.
+ Modeling that ENABLES COMMUNICATION between both sides of the grid (transmission & distribution) with WIS:dom demonstrates an ability for local solar and storage to reshape load, as observed from the utility-scale grid (i.e., above 69 kV).
– One consequence of this co-optimizing and coordinating utility-scale with distributed-scale is the reduction of volatility in the demand as observed by the utility-scale grid.
– A second consequence is a dramatic drop in the peak demand requirements as observed by the utility-scale grid — ~16% reduction in peak by 2050 attributed to local solar + storage.
+ The result is more local solar + storage reduces net demand and smooths overall demand to enable access to lowest cost utility-scale generation – more utility wind and solar and less fossil firming capacity.
21
DER Altered Load Duration Curve (example state)
Reduced peak demands as observed from the utility-scale grid
Even after removing peak demand, the DER coordination further reduces overall demand
needs for the majority of the year
Increased utilization of distribution assets

Eases Stress On The Bulk Power System
22
LESS UTILITY-SCALE DEMAND NEEDED DURING PEAKSLESS UTILITY-SCALE GENERATION NEEDED DURING PEAKS
LOTS OF PEAKS IN SUPPLY
BAU
(sum
mer
mon
th in
sam
ple
stat
e)DER
(sum
mer
mon
th in
sam
ple
stat
e)
U T I L I T Y - S C A L E G E N E R A T I O N D I S T R I B U T I O N D E M A N D
+ Demand is sharp and spikey and supply ramps up and down to meet peaks
+ More firming capacity and peaker plants are required to meet demand at times of the day when customers are using the most electricity
+ Distributed solar + storage have minimal impacts on “shaping load” and meeting system needs
+ Demand is smooth because local solar + storage can be deployed at peak times and reshapes load from the perspective of the utility grid (above 69kV)
+ Permanently eases stress on system during critical peak hours & reduces how much bulk-scale power is needed to serve the distribution grid
+ Less bulk power = less money on expensive peakerplants and firming capacity thus overbuilding the system
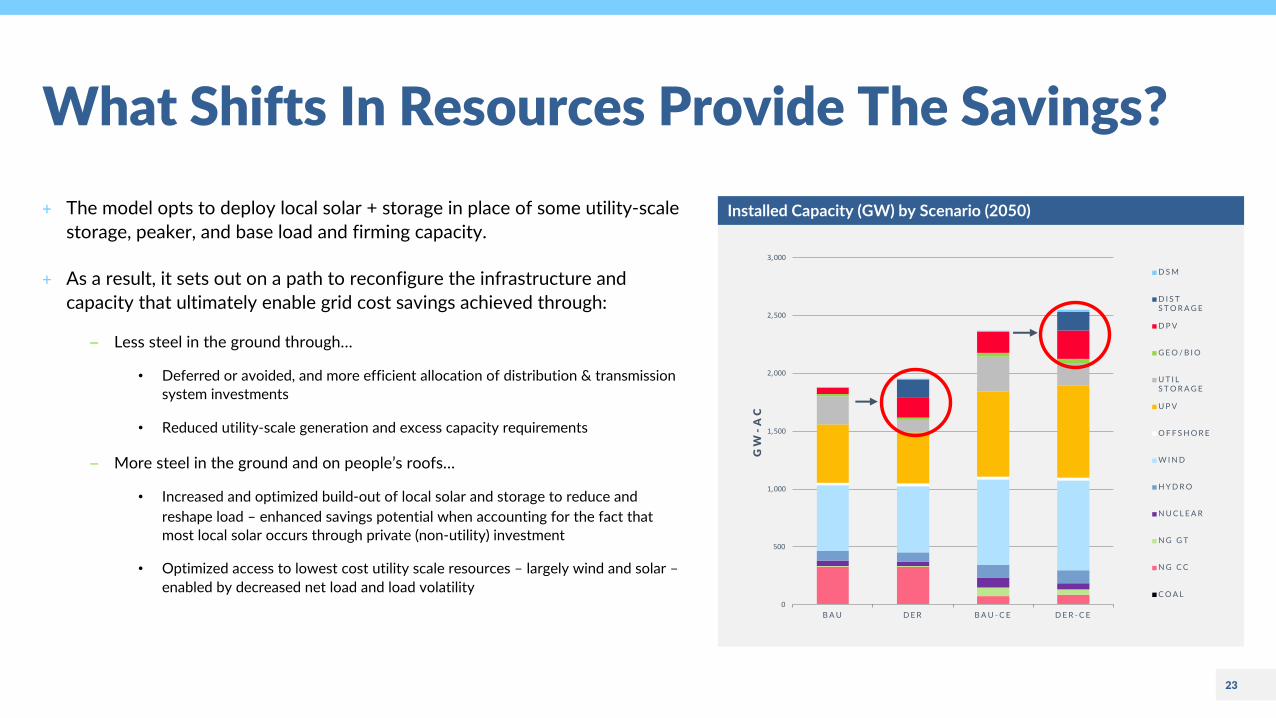
What Shifts In Resources Provide The Savings?+ The model opts to deploy local solar + storage in place of some utility-scale
storage, peaker, and base load and firming capacity.
+ As a result, it sets out on a path to reconfigure the infrastructure and capacity that ultimately enable grid cost savings achieved through:
– Less steel in the ground through…
• Deferred or avoided, and more efficient allocation of distribution & transmission system investments
• Reduced utility-scale generation and excess capacity requirements
– More steel in the ground and on people’s roofs…
• Increased and optimized build-out of local solar and storage to reduce and reshape load – enhanced savings potential when accounting for the fact that most local solar occurs through private (non-utility) investment
• Optimized access to lowest cost utility scale resources – largely wind and solar –enabled by decreased net load and load volatility
23
0
500
1,000
1,500
2,000
2,500
3,000
B A U D E R B A U - C E D E R - C E
GW
-AC
D S M
D I S T S T O R A G E
D P V
G E O / B I O
U T I L S T O R A G E
U P V
O F F S H O R E
W I N D
H Y D R O
N U C L E A R
N G G T
N G C C
C O A L
Installed Capacity (GW) by Scenario (2050)

Local Solar Capacity & Storage Key Takeaways+ To achieve the lowest overall system cost, the
WIS:dom-P model selects between 94-164 GW of total installed local solar by 2030 - an increase of 70-140 GW in the next decade.
– By 2050, it accounts for 171-247 GW, which is roughly consistent with some EIA and NREL model projections for local solar (they do not include community solar)
+ Distributed storage also plays a critical role in enabling growth and ensuring future savings. In fact, the clean electricity sensitivity relies heavily on it from a production standpoint.
– The model is able to select 4-hour batteries in early years, steadily climbing to up to 12-hour batteries by 2050 and even more in the clean electricity run.
Local Solar Increases to Achieve Lowest Overall System Cost
24
BAU DER BAU-CE DER-CE
Distributed Storage Capacity Increases to Achieve Lowest Overall System Cost
DER DER-CE
0
100
200
2020 - CURRENT 2030 2040 2050
GW
-AC
Y E A R
0
50
100
150
200
2020 - Current 2030 2040 2050
GW
Y E A R
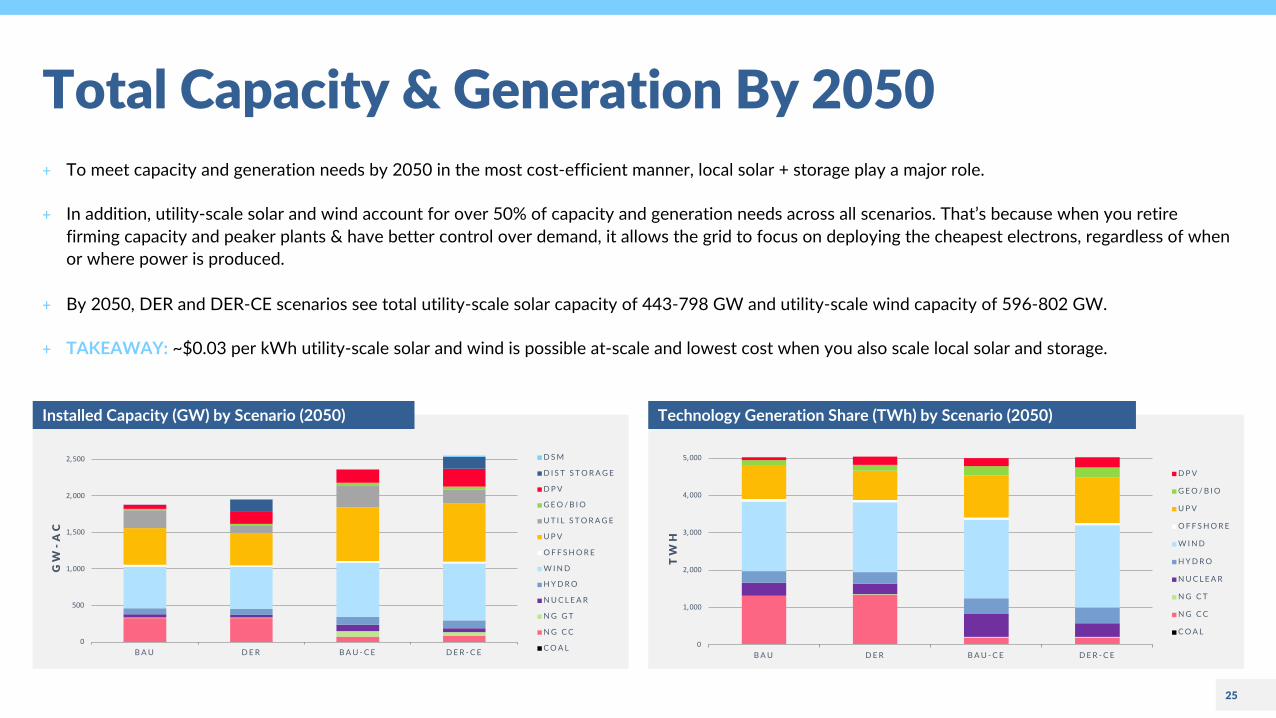
Total Capacity & Generation By 2050+ To meet capacity and generation needs by 2050 in the most cost-efficient manner, local solar + storage play a major role.
+ In addition, utility-scale solar and wind account for over 50% of capacity and generation needs across all scenarios. That’s because when you retire firming capacity and peaker plants & have better control over demand, it allows the grid to focus on deploying the cheapest electrons, regardless of whenor where power is produced.
+ By 2050, DER and DER-CE scenarios see total utility-scale solar capacity of 443-798 GW and utility-scale wind capacity of 596-802 GW.
+ TAKEAWAY: ~$0.03 per kWh utility-scale solar and wind is possible at-scale and lowest cost when you also scale local solar and storage.
25
Installed Capacity (GW) by Scenario (2050) Technology Generation Share (TWh) by Scenario (2050)
0
500
1,000
1,500
2,000
2,500
B A U D E R B A U - C E D E R - C E
GW
-AC
D S M
D I S T S T O R A G E
D P V
G E O / B I O
U T I L S T O R A G E
U P V
O F F S H O R E
W I N D
H Y D R O
N U C L E A R
N G G T
N G C C
C O A L 0
1,000
2,000
3,000
4,000
5,000
B A U D E R B A U - C E D E R - C E
TW
H
D P V
G E O / B I O
U P V
O F F S H O R E
W I N D
H Y D R O
N U C L E A R
N G C T
N G C C
C O A L
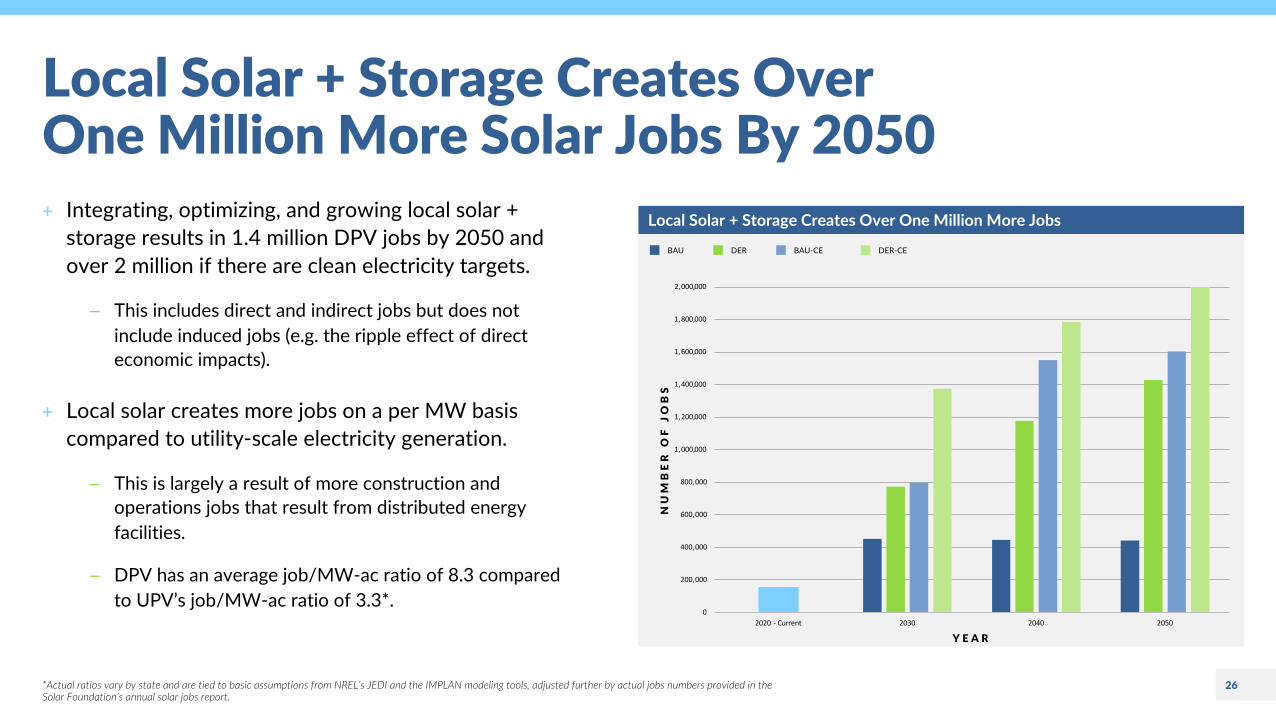
Local Solar + Storage Creates Over One Million More Solar Jobs By 2050+ Integrating, optimizing, and growing local solar +
storage results in 1.4 million DPV jobs by 2050 and over 2 million if there are clean electricity targets.
– This includes direct and indirect jobs but does not include induced jobs (e.g. the ripple effect of direct economic impacts).
+ Local solar creates more jobs on a per MW basis compared to utility-scale electricity generation.
– This is largely a result of more construction and operations jobs that result from distributed energy facilities.
– DPV has an average job/MW-ac ratio of 8.3 compared to UPV’s job/MW-ac ratio of 3.3*.
Local Solar + Storage Creates Over One Million More Jobs
*Actual ratios vary by state and are tied to basic assumptions from NREL’s JEDI and the IMPLAN modeling tools, adjusted further by actual jobs numbers provided in the Solar Foundation’s annual solar jobs report.
26
BAU DER BAU-CE DER-CE
0
200,000
400,000
600,000
800,000
1,000,000
1,200,000
1,400,000
1,600,000
1,800,000
2,000,000
2020 - Current 2030 2040 2050
NU
MB
ER
OF
JO
BS
Y E A R

Policy Implications27

Takeaways For Regulators
28
C O O R D I N A T I O N A N D O P T I M I Z A T I O N O F LO C A L S O LA R + S T O R A G E M O V E S P LA N N I N G B E Y ON D T H E “E I T H E R / OR ” FA LS E C H OI C E OF U T I L I T Y OR DI S T R I B U T E D R E S O U R C E S
S A V I N G S C R E A T E D B Y C O O R D I N A T I O N A N D O P T I M I Z A T I O N O F D I S T R I B U T E D R E S O U R C E S C A N B E R E I N V E S T E D T O A D V A N C E S T A T E P O LI C Y P R I O R I T I E S
P LA N N I N G D E C I S I ON S A R E T OO I M P OR T A N T T O B A S E S OLE LY ON T H E OU T P U T O F A S I N G LE M O D E L S E LE C T E D A N D R U N B Y T H E P LA N ’ S P R O P O N E N T
01
02
03

What’s At Stake?
29
Better models show scaling local solar + storage leads to maximum cost savings and job creation
and a more efficient, equitable & resilient electricity system.
Maximizing cost savings requires better models that can incorporate and optimize new
technologies and policy priorities.
Utilities and regulators need to work together to achieve these savings, because when they are not
savings, they are costs incurred by ratepayers.
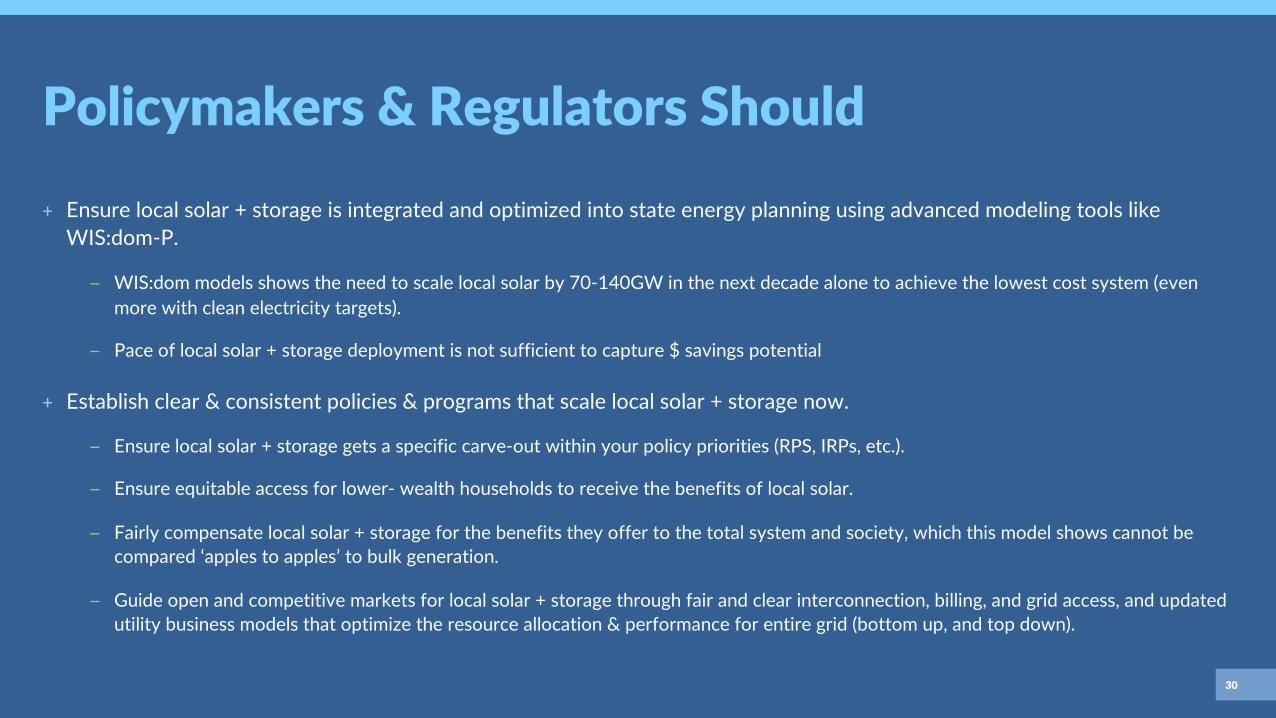
Policymakers & Regulators Should+ Ensure local solar + storage is integrated and optimized into state energy planning using advanced modeling tools like
WIS:dom-P.
– WIS:dom models shows the need to scale local solar by 70-140GW in the next decade alone to achieve the lowest cost system (even more with clean electricity targets).
– Pace of local solar + storage deployment is not sufficient to capture $ savings potential
+ Establish clear & consistent policies & programs that scale local solar + storage now.
– Ensure local solar + storage gets a specific carve-out within your policy priorities (RPS, IRPs, etc.).
– Ensure equitable access for lower- wealth households to receive the benefits of local solar.
– Fairly compensate local solar + storage for the benefits they offer to the total system and society, which this model shows cannot be compared ‘apples to apples’ to bulk generation.
– Guide open and competitive markets for local solar + storage through fair and clear interconnection, billing, and grid access, and updated utility business models that optimize the resource allocation & performance for entire grid (bottom up, and top down).
30
ACKNOWLEDGEMENTS
+ T o m H u n t f r o m P i v o t E n e r g y
+ H a n n a h M u l l e r f r o m C l e a r w a y E n e r g y G r o u p
+ E v a n D u b e f r o m S u n r u n
+ L a u r e l P a s s e r a f r o m C o a l i t i o n f o r C o m m u n i t y S o l a r A c c e s s
+ R i c k H u n t e r f r o m P i v o t E n e r g y
+ D a n H e n d r i c k f r o m C l e a r w a y E n e r g y G r o u p
+ B e n D e l m a n f r o m S o l a r U n i t e d N e i g h b o r h o o d s
+ S t e v e n R y m s h a , A n d y N e w b o l d , B a r t l e t t J a c k s o n , a n d K r y s t i S h a l l e n b e r g e r f r o m S u n r u n
+ S u z a n n e L e t a a n d C o u r t n e y W e l c h f r o m S u n P o w e r
+ S e a n G a l l a g h e r , K e v i n L u c a s , a n d D a n W i t t e n f r o m S o l a r E n e r g y I n d u s t r i e s A s s o c i a t i o n
+ A n n i e L a p p é , A y e s h a H e r i a n , H i l a r y L e w i s , E d S m e l o f a n d S a c h u C o n s t a n t i n e f r o m V o t e S o l a r
+ T h e e n t i r e K i v v i t t e a m 31
A D V I S O R Y G R O U PThank you to the following groups and individuals who provided ongoing guidance and support during the research and development of the report.
R E V I E W E R SThank you to the following groups and individuals for providing feedback and reviewing this presentation before public release.
A U T H O R S+ Dr. Christopher Clack from Vibrant Clean Energy+ Jeff Cramer, Matthew Hargarten and Charlie Coggeshall from Coalition for
Community Solar Access+ Karl Rabago from Rabago Energy LLC + J i g a r S h a h C o - F o u n d e r a n d P r e s i d e n t
o f G e n e r a t e C a p i t a l
+ W i l s o n R i c k e r s o n a n d J o n M o n k e n o f C o n v e r g e S t r a t e g i e s , L L C
+ J i l l T a u b e r , S h a n n o n F i s k , a n d K i m S m a c z n i a k f r o m E a r t h j u s t i c e
+ B r a d K l e i n a n d M e L e n a H e s s e l f r o m E n v i r o n m e n t a l L a w & P o l i c y C e n t e r
+ B e c k y S t a n f i e l d f r o m E n e r g y F o u n d a t i o n
+ M i k e O ’ B o y l e f r o m E n e r g y I n n o v a t i o n
+ P r i y a S r e e d h a r a n a n d R i c O ’ C o n n e l l f r o m G r i d L a b
+ M o h i t C h h a b r a f r o m N a t u r a l R e s o u r c e D e f e n s e C o u n c i l
+ M a r k D y s o n , M a r k S i l b e r g , A m a r S h a h , a n d N a t h a n I y e r f r o m R o c k y M o u n t a i n I n s t i t u t e
+ J e r e m y F i s h e r f r o m S i e r r a C l u b
+ T e d T h o m a s , C h a i r m a n o f A r k a n s a s P u b l i c S e r v i c e
+ J a m e s L e s t e r s t a f f a t C o l o r a d o P u b l i c U t i l i t i e s C o m m i s s i o n
+ J e n n i f e r P o t t e r , C o m m i s s i o n e r a t H a w a i i P u b l i c U t i l i t i e s C o m m i s s i o n
+ O d o g w u O b i L i n t o n , C o m m i s s i o n e r a t M a r y l a n d P u b l i c S e r v i c e C o m m i s s i o n
+ M a t t h e w S c h u e r g e r , C o m m i s s i o n e r a t M i n n e s o t a P u b l i c U t i l i t i e s C o m m i s s i o n
+ B r a n d o n P r e s l e y , C o m m i s s i o n e r a t M i s s i s s i p p i P u b l i c S e r v i c e C o m m i s s i o n
+ T y l e r H u e b n e r , C o m m i s s i o n e r a t W i s c o n s i n P u b l i c S e r v i c e C o m m i s s i o n

Thank You 32
Links to Other Assets: Report Executive SummaryPress Release