why invest in gold - uk gold investments€¦ · a weakening dollar and increasing inflation will...
TRANSCRIPT

An analysis of goldand investing in the current financial climatewww.ukassetcompany.co.uk
See us online
Why invest in GOLD
2019 Brochure

www.ukassetcompany. co.uk
History of Gold
www.ukassetcompany.co.ukSee us online
Gold and its use in civilisation can be traced
back almost 6,000 years. Gold as a currency
can be traced back 2,000 years to the Romans.
Even up until 1971 the world’s reserve currency,
the US Dollar, was backed by gold. It is because
of this longevity that gold is embedded in
society’s DNA as a trusted, safe store of value,
and, as result, in a deteriorating financial
environment or geo-political instability
there is a flight to safety into gold.
Following the collapse of Lehman Brothers
and the resultant near meltdown of the financial
system the Dow Jones dropped from 14,000
to 7,000; a 50% fall. In total, $10 trillion dollars
was wiped off global stock markets. Gold, on
the other hand, saw its price rise from $850 per oz.
to $1900 per oz.; a 131% increase in value as
investors moved into gold as a trusted
store of value.
How Gold resists a downturnin the markets
Gold is rare, so rare in fact, that the world
pours more steel in one hour than it has
produced gold since the beginning of
recorded history.
This rarity and finite supply of gold is what
gives it value over other major currencies
such as the US dollar, the British pound,
the Japanese yen and the European euro,
all of which can be printed at will.
The Rarity of Gold
1
Why choose gold as an investment

2
The US dollar, the British pound, the Japanese yen,
and the European euro are all known as fiat currencies.
This is the name given to a currency that a government
has declared to be legal tender, but is not backed by a
physical commodity.
The value of fiat money is derived from the relationship
between supply and demand rather than the value of the
material the money is made of. It is worth noting that the
history of fiat money, to put it kindly, has been one of
failure. In fact, almost every currency since the Romans
first began the practice in the first century has ended in
devaluation, and in most cases collapse.
According to a study of 775 fiat currencies by
Dollarday.org there is no historical precedence for a
fiat currency that has succeeded in holding its value.
The report found that of the 775 currencies examined
The Failure of Fiat Currencies
Even the British pound cannot claim to have escaped
this fate. Founded in 1694, the British pound sterling
is the oldest fiat currency in existence. At a ripe old
age of 317 years it must be considered a highly
successful fiat currency, right ?
24%Monetarily reformed
23%Still in circulation, awaiting outcomes
21%Destroyed by war
20%Failed through inflation
12%Destroyed by independence
I am afraid not so, success is relative.

3
Gold is the currency that stood the test of time.
The British pound was defined as 12 oz. of silver, so at today’s
value it is worth less than 1/200 or 0.5% of its original value.
In other words the most successful long-standing currency
in existence has lost 95.5% of its value. So gold is not only the
oldest currency, but also the only currency that has stood
the test of time.
Examples of fiat currencies
that have failed through inflation, been destroyed
by war or independence, or that have been
monetarily reformed include:
Germany 1923 (mark)
Turkey 1937 (lire)
Greece 1943 (drachmas)
Hungry 1945 (pengo)
Central Bank of China 1947 (CGU)
Chile 1975 (pesos)
Chile 1975 (pesos)
What all of this information on fiat currencies
highlights is that they are not as solid as people
believe, and that if history is anything to go by
they are incredibly vulnerable. Therefore, if the
global economy continues on its current path,
gold provides the most protection.
Argentina 1985 (pesos)
Peru 1989 (intis)
Nicaragua 1990 (cordoba)
Russia 1992 (rubles)
Zaire 1992 (zaire)
Brazil 1993 (cruzeiros real)
Bosnia 1993 (dinar)
Brazil 1993 (cruzeiros real)
Bosnia 1993 (dinar)
Ukraine 1995 (karbovantsiv)
Georgia 1994 (iaris)
Romania 2001 (lei)
Venezuela 2002 (Bolivar)
Zimbabwe 2006 (dollar)
The Failure of Fiat Currencies(continued)
MONTH

Between 2008 and 2016 the US Federal Reserve printed $12.3
trillion dollars as part of its quantitative easing initiative in a bid to
restore confidence in the economy and kick start growth following
the financial crisis. The US Federal Reserve announced the end of
its historic quantitative easing programme in 2017.
This level, of what amounts to no more than money printing, has
always had very bad consequences for governments that have
tried it in the past. Quantitative easing damages the value of the
US dollar. Each time you add a new dollar into the system, it
decreases the value of each existing dollar by just a little bit.
The Federal Reserves plans of quantitative easing and injecting
trillions into the economy clearly had a significant impact. A
number of analysts warned that the programme could result in a
decline of the US dollar of up to 20%, in turn leading to inflation,
something we know gold reacts positively to.
Between 2008 (when the financial crisis occurred and the Federal
Reserve embarked on a quantitative easing programme) and
2018 inflation increased by more than 15%.
In�ation has hit struggling
US consumers really hard.
Since 2008, investors have
been �eeing from the US
dollar and other paper
currencies and have been
�ocking to commodities,
precious metals and oil.
That means that the price
of food increased by over
16% between 2008 and
2017. American families
found their budgets
stretched even more.
Once an in�ationary spiral
gets going it is really hard
to stop. Just ask anyone
who lived through
hyper-in�ation in Germany
in 1923 or Zimbabwe
in 2006.
$12.3 Trillion Dollars
Quantitative Easing
Between 2008 and 2016 the US Federal Reserve printed...
4See us onlinewww.ukassetcompany.co.uk
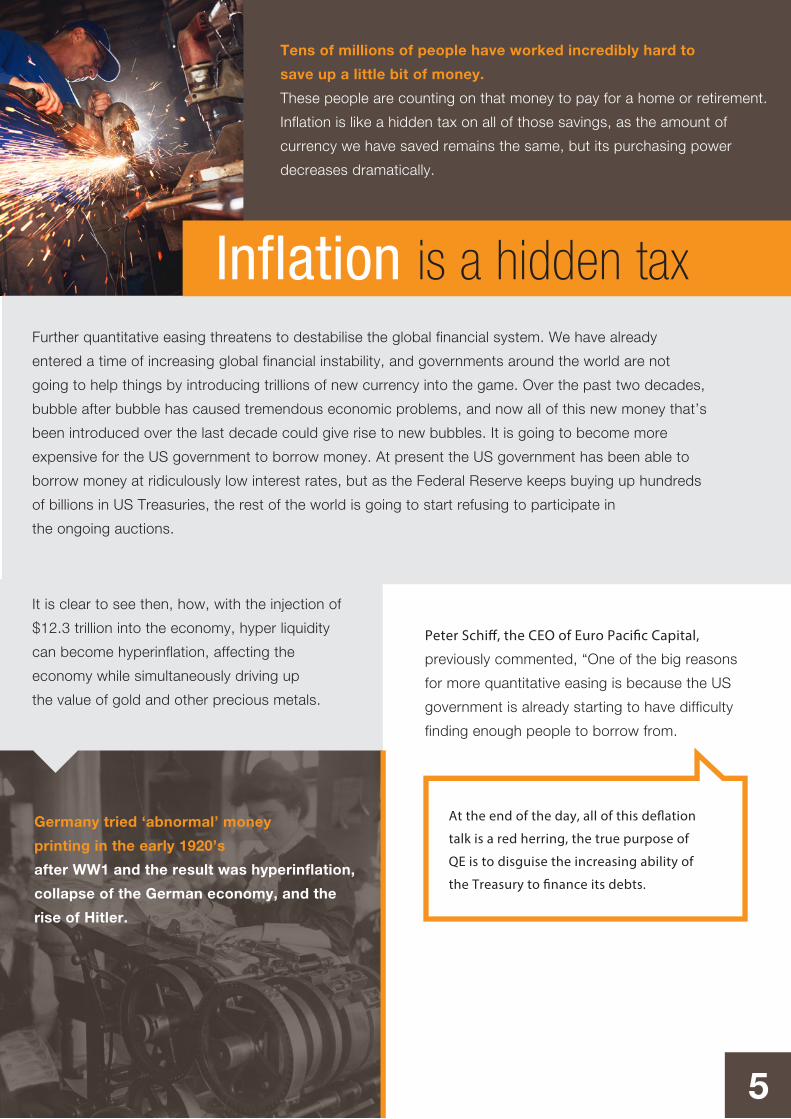
Tens of millions of people have worked incredibly hard to
save up a little bit of money.
These people are counting on that money to pay for a home or retirement.
Inflation is like a hidden tax on all of those savings, as the amount of
currency we have saved remains the same, but its purchasing power
decreases dramatically.
Further quantitative easing threatens to destabilise the global financial system. We have already
entered a time of increasing global financial instability, and governments around the world are not
going to help things by introducing trillions of new currency into the game. Over the past two decades,
bubble after bubble has caused tremendous economic problems, and now all of this new money that’s
been introduced over the last decade could give rise to new bubbles. It is going to become more
expensive for the US government to borrow money. At present the US government has been able to
borrow money at ridiculously low interest rates, but as the Federal Reserve keeps buying up hundreds
of billions in US Treasuries, the rest of the world is going to start refusing to participate in
the ongoing auctions.
Inflation is a hidden tax
Germany tried ‘abnormal’ money
printing in the early 1920’s
after WW1 and the result was hyperinflation,
collapse of the German economy, and the
rise of Hitler.
It is clear to see then, how, with the injection of
$12.3 trillion into the economy, hyper liquidity
can become hyperinflation, affecting the
economy while simultaneously driving up
the value of gold and other precious metals.
Peter Schi�, the CEO of Euro Paci�c Capital,
previously commented, “One of the big reasons
for more quantitative easing is because the US
government is already starting to have difficulty
finding enough people to borrow from.
At the end of the day, all of this de�ation
talk is a red herring, the true purpose of
QE is to disguise the increasing ability of
the Treasury to �nance its debts.
5
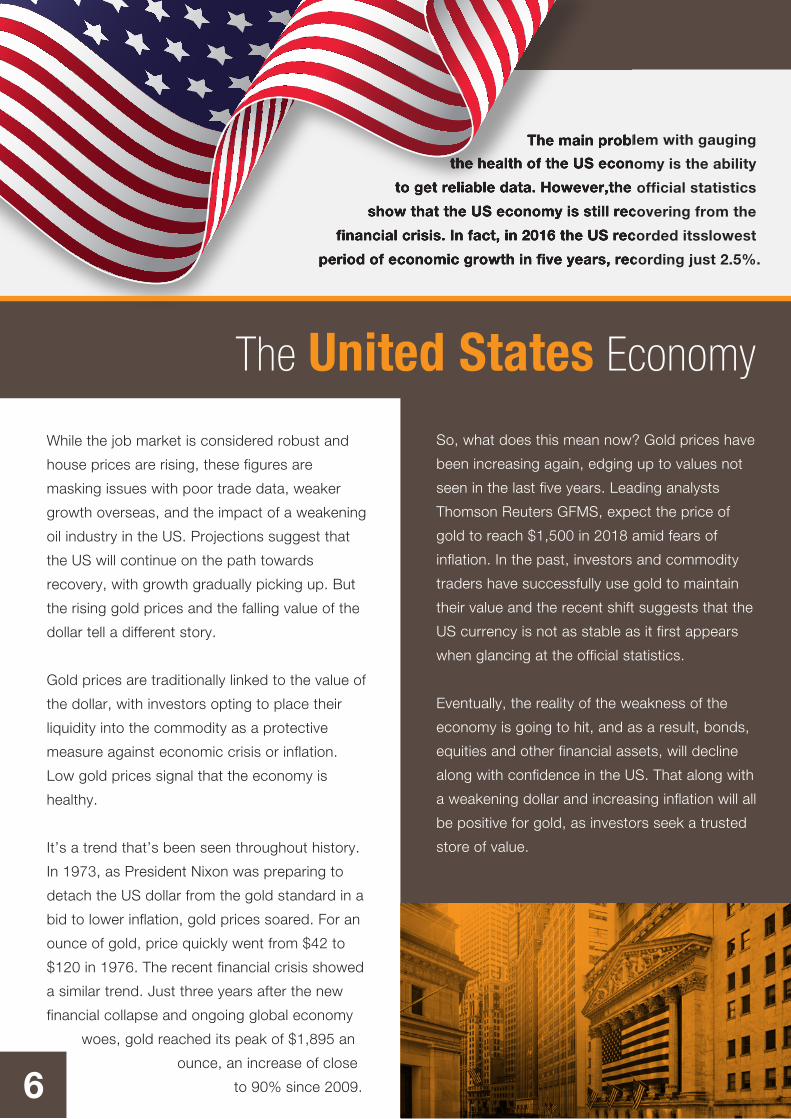
While the job market is considered robust and
house prices are rising, these figures are
masking issues with poor trade data, weaker
growth overseas, and the impact of a weakening
oil industry in the US. Projections suggest that
the US will continue on the path towards
recovery, with growth gradually picking up. But
the rising gold prices and the falling value of the
dollar tell a different story.
Gold prices are traditionally linked to the value of
the dollar, with investors opting to place their
liquidity into the commodity as a protective
measure against economic crisis or inflation.
Low gold prices signal that the economy is
healthy.
It’s a trend that’s been seen throughout history.
In 1973, as President Nixon was preparing to
detach the US dollar from the gold standard in a
bid to lower inflation, gold prices soared. For an
ounce of gold, price quickly went from $42 to
$120 in 1976. The recent financial crisis showed
a similar trend. Just three years after the new
financial collapse and ongoing global economy
woes, gold reached its peak of $1,895 an
ounce, an increase of close
to 90% since 2009.6
So, what does this mean now? Gold prices have
been increasing again, edging up to values not
seen in the last five years. Leading analysts
Thomson Reuters GFMS, expect the price of
gold to reach $1,500 in 2018 amid fears of
inflation. In the past, investors and commodity
traders have successfully use gold to maintain
their value and the recent shift suggests that the
US currency is not as stable as it first appears
when glancing at the official statistics.
Eventually, the reality of the weakness of the
economy is going to hit, and as a result, bonds,
equities and other financial assets, will decline
along with confidence in the US. That along with
a weakening dollar and increasing inflation will all
be positive for gold, as investors seek a trusted
store of value.
The main problem with gauging
the health of the US economy is the ability
to get reliable data. However,the official statistics
show that the US economy is still recovering from the
financial crisis. In fact, in 2016 the US recorded itsslowest
period of economic growth in five years, recording just 2.5%.
The United States Economy

US government debt is currently over
$20.7 trillion ($20,700,000,000,000) and rising.
By 2022 it’s expected that the figure will
have climbed to over 23.3 trillion if current
rates of spending and borrowing continue.
This is debt that has to be paid back at some
point, maybe not in our lifetime, or our children’s
lifetime, but ultimately if the world is continue to
have confidence in the US dollar, it has to be
paid; otherwise it means defaulting, and that
would be catastrophic.
The problem is that it is almost impossible to
envisage a scenario whereby the government
can pay this back at any point in the future.
For the fiscal year 2016, the US government
spent $3.9 trillion but only brought in revenue
of $3.3 trillion, highlighting the significant gap
and why debt continues to spiral. It’s an issue
that’s worsening rather than improving.
For the 2017 fiscal year the budget deficit
totalled $666 billion, $80 billion more than the
previous year. Measured as a share of GDP,
the 2017 deficit rose to 3.5%, this is compared
to the 2.4% recorded in 2015. It does not help
the situation either, that both the Democrats and
the Republicans seem more interested in point
scoring than addressing and implementing the
hard measures needed to correct this, even to
the point that the US federal government shut
down for 17 days in 2013 because the two
parties could not agree.
Tension have continued to rise between the
two parties, leading to another shutdown
between the 20 and 22 January 2018 and
rising concerns that it could happen again.
To put the level of US debt into perspective,
it is the equivalent of giving every man, woman
and child on the planet $2,957 each. Or put
another way, each person in the United States
needs to contribute over $64,000 to pay it off,
and this figure is on top of what they already pay
in taxes, living expenses, credit cards, mortgages,
and other expenses. When just taxpayers are
factored in, that amount rises further to over
$171,000. Given that the median wage for US
workers is around $44,500 according to the
Bureau of Labor Statistics, this looks like a tall
order. Perhaps the most frightening thoughts of
all though is what the debt means in terms of
interest. Net interest on debt is one of the largest
budget items, totalling in excess of $284 billion,
a number that’s rapidly rising. Should US rates
return to their historical average, as forecasts
suggest, the interest figure is likely to soar
even further. It is easy to see just how close
the US is to the edge of potential financial
oblivion. However, this is not a forgone
conclusion, and it is possible that over time the
US could manage the situation and bring it under
control; whatever the measures to achieve this,
they will be financially painful regardless of the
form. It is also easy to see how just a single
economic or geo-political event could
tip the scales and cause a major
financial panic...
The United States Economy
Either way, gold as a reliable,
safe store of value, should prosper.
Imagine what Greece, Portugal and Spain went
through and then multiply it by a factor of about 1,000.
Imagine what Greece, Portugal and Spain went
through and then multiply it by a factor of about 1,000.
7
(continued)
The United States
US government debt is currently over
(continued)
Take the Russian-Ukrainian conflict as an
example. When Russia invaded Ukraine in
2014 and subsequently annexed Crimea, both
the US and Europe had their hands tied, even
though the Ukraine is part of NATO, they could
not intervene militarily unless they wanted to
risk World War 3. Instead, they chose
economic confrontation and placed sanctions
on President Putin’s inner circle.
US funds also withdrew around $64 billion
from Russian investments and the resulting
fallout put pressure on an already struggling
Russian economy. So what started as an
armed confrontation became economic with
Russia retaliating by threatening to cut off gas
supplies to Ukraine under the guise of
non-payment, which would affect Europe,
and Germany in particular which relied on
Russian gas for 70% of its energy needs.
While much of the tensions related to the
Russia-Ukraine conflict have reduced
somewhat, this case makes it clear that
military conflict and economic conflict
cannot be considered separately...
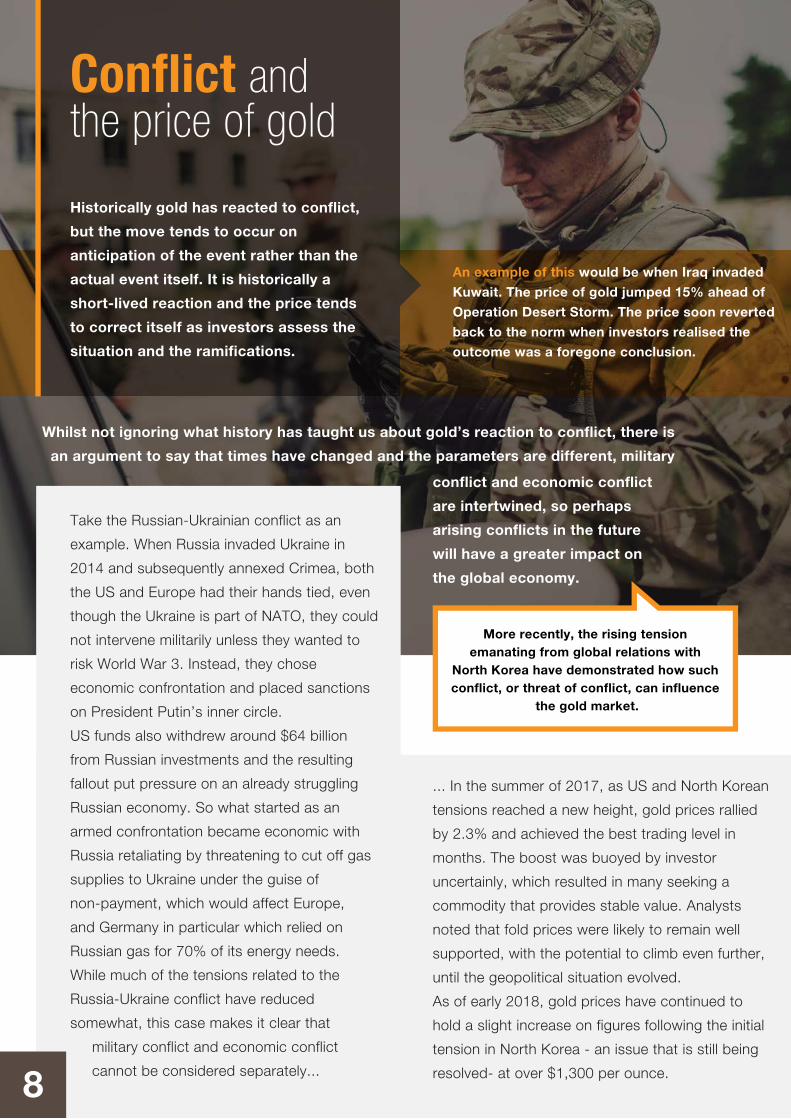
Whilst not ignoring what history has taught us about gold’s reaction to conflict, there is
an argument to say that times have changed and the parameters are different, military
An example of this would be when Iraq invaded
Kuwait. The price of gold jumped 15% ahead of
Operation Desert Storm. The price soon reverted
back to the norm when investors realised the
outcome was a foregone conclusion.
conflict and economic conflict
are intertwined, so perhaps
arising conflicts in the future
will have a greater impact on
the global economy.
... In the summer of 2017, as US and North Korean
tensions reached a new height, gold prices rallied
by 2.3% and achieved the best trading level in
months. The boost was buoyed by investor
uncertainly, which resulted in many seeking a
commodity that provides stable value. Analysts
noted that fold prices were likely to remain well
supported, with the potential to climb even further,
until the geopolitical situation evolved.
As of early 2018, gold prices have continued to
hold a slight increase on figures following the initial
tension in North Korea - an issue that is still being
resolved- at over $1,300 per ounce.
More recently, the rising tension emanating from global relations with
North Korea have demonstrated how such conflict, or threat of conflict, can influence
the gold market.
Conflict and the price of gold
Historically gold has reacted to conflict,
but the move tends to occur on
anticipation of the event rather than the
actual event itself. It is historically a
short-lived reaction and the price tends
to correct itself as investors assess the
situation and the ramifications.
8

Tensions between Sunni and
Shiite Muslims.
Continuing civil
war in Syria.
Threat of the Islamic State
of Iraq and Syria (ISIS)
which is continuing to
destabilise the Middle East.
Threat of overseas terrorist
attacks in Europe and the
US by ISIS harming
economies.
Ongoing conflict between
Israel and Palestine and the
threat of escalation beyond
the current fighting.
Rising tensions between the
US and North Korea, and
North Korean conducting
nuclear tests.
Growing political tensions in the
Horn of Africa and Red Sea regions
between Turkey and Egypt and
Saudi Arabia.
The risk of the Iran nuclear
deal falling through as the
deadline nears.
Expected continued political
stand off between Russia
and the West.
Discontent in Egypt between
military controlled
government and the previous
government the Muslim
Brotherhood.
Continuing instability in Libya caused
by a power struggle between rival
militia since the removal of Gaddafi.
Ongoing threat of Al-Qaeda seeking to
expand its presence in Pakistan, Algeria,
Egypt, Kenya, Libya, Mali, Mauritania,
Nigeria, Iraq, Syria and Yemen.
It does not require much imagination to see a significant increase in the flow of money in to gold as investors weigh up the ramifications of geo-political tensions.
When you take a look at all the other geo-political tensions around the world at the moment that could have similar outcomes...
Conflict and the price of gold(continued)
9

The term ‘the worlds’ reserve currency’ refers
to a foreign currency held by central banks and
other major financial institutions as a means to
pay off international debt obligations or to
influence their domestic exchange rate. A large
percentage of commodities, such as gold and
oil, are usually priced in the reserve currency,
causing other countries to hold this currency to
pay for these goods.
Back in 2013 more than 60% of all foreign currency
reserves in the world were in US dollars. But analysts
forecast changes and this shift in power in becoming
more obvious. Some of the biggest economies on
Earth have been making agreements to move away
from using the US dollar, signalling its fall in value
and stability. As more international trade is conduct-
ed in other rival currencies, it will increasingly cause
huge implications for both the US economy
and dollar.
See us online10
While the US dollar has been the world’s dominant currency for over seven decades,
China is seeking to supplant it. As of the final quarter of 2017, just 1% of foreign exchange reserves
were held in Chinese yuan, compared to 63.5% in the US dollar. However, a shift is underway.
The Chinese yuan has reached a high against the US dollar and the German Bundesbank has
indicated it would include yuan in its reserves for the first time, reflecting its growing
international role.
The French Central Bank also already holds reserves in yuan and last year the
European Central Bank announced it had exchanged $611 million worth
of US dollar reserves for yuan securities. So far, the change has not
severely affected the US’s dominance but it’s likely that other central
banks will follow suit and the power of the US dollar will
slowly decline.
The US Dollar’s Statusas the world’s reserve currency
www.ukassetcompany.co.uk

As these new trade agreements take hold and increase in value, it will mean that
central banks around the world will have to rebalance their foreign currency reserves,
and since not as many of the transactions are in dollars it will mean they have to sell them.
The second and third largest economies in the world, China and Japan,
struck a deal to use their own currencies, rather than the US dollar, when
trading with each other.
US President Donald Trump’s
‘America First’ policies are
pushing the US out of the
international limelight.
China has a Bilateral Trade agreement with
Russia to use their own national currencies
when trading with each other.
China is Africa’s biggest
trading partner and as a
result Chinese currency
is growing in popularity.
As a result of the US sanctions
on Iran over its nuclear policy, and
there exclusion from the international
banking system India now uses
gold to buy oil from Iran.
European central banks are
increasingly considering using
Chinese yuan as a reserve currency.
It is expected that Saudi Arabia
will begin using yuan pricing of
oil, with the rest of the industry
following suit.
The International Monetary Fund has
been pushing for a new world reserve
currency. The IMF also added the yuan
to its Special Drawing Rights basket in 2016
Loosening of the
US-Europe transatlantic
alliance, with the EU becoming
further independent.
Calls for a reserve currency that’s
disconnected from an individual
nation, and therefore able to
remain stable, have been growing
with particular support from Russia.
The UN has also continued to push for
a new world reserve system that no
longer relies on the US dollar
China is aggressively expanding its use of
the yuan for trading with African nations,
which have high growth potential.
Below are some of the changes
that are occurring globally that could mean
the beginning of the end for the US dollar as
a reserve currency:
Given that there is around $14 trillion outside the US held in cash or near cash, for example
US Treasuries, even the rebalancing of only 20% would mean the sale of $2.8 trillion dollar related
assets, a sale of this magnitude, especially with the current state of the US, would have a catastrophic
effect, resulting in massive inflation and huge increases in gold and gasoline prices.
The end of the US Dollar ?
11

12
Throughout history, debt levels over
90% of GDP are historically linked to
significantly elevated levels of inflation.
Specifically, when the ratio has met or
exceeded 90%, inflation has historically
risen to around 6% compared to the 0.5% to
2.5% range when debt levels are below 90%.
History also shows that the link is not
simultaneous, yet the emergence of higher
inflation has always been an eventuality.
Total US government has crossed this line and
it’s increasing further still. In 2008, prior to the
financial crisis is stood at just 67.7%, crossing
the 90% threshold in 2010. Alarmingly debt
levels to GDP now stand at over 105% and have
gradually increased in the years since apart
from a slight dip in 2015.
This is higher some than countries that are
associated with high levels of debt, such as
Spain, which stands at 99%. Further, the
Federal Reserve and Washington, and leaders
from other countries, are devaluing currencies
in order to reduce the burden of debt
repayment. This is a central thesis to investing
in gold: there is no way out of this level of debt
overhang except currency dilution.
Because the Federal Reserve continues to
pour money into the US economy, it’s difficult
to say for certain when gold will make a
dramatic move. The historical record indicates that a surge in money growth doesn’t impact economic
activity until 9-18 months later. Add another 12 months or so for it to show up in consumer price inflation.
China, which has already overtaken South Africa as the largest gold producer in the world, with an output of
455 metric tons in 2016, is also one of the world’s leading importers of the precious material. In 2016, China
was knocked off the top spot by Switzerland but it still imported an impressive $64 billion in gold while only
exporting $1.2 billion. Continued demand for gold and the outlook for the Chinese yuan means that gold
production and importing isn’t expected to slow down.
To add to this South Africa, previously the world’s largest gold producer, is in terminal decline as known gold
deposits are becoming uneconomical as a result of Labour unrest. There is also a greater difficulty in
extracting the gold as the gold that’s easier to mine has already be extracted.
Gold...The Facts and Figures
2008 2010 2012 2014 2016 201860
70
80
90
100
110
U.S. Gross Federal Debt to GDPSource | Tradingeconomics.com | U.S. Public Bureau of Public Debt

13
Gold...The Facts and Figures
To add to this, the significant new gold deposits that are
needed to replenish world gold production have thus far
failed to materialise.
Gold demand has been much greater than gold supply
for some time now, and at some point this is going to be
a significantly more important fact than the short term
speculation and sentiment that has kept the price low.
As of early 2018, gold prices are around $1,300 per
ounce but as supply dwindles and demand rises this is
expected to increase significantly.
Gold mining is a global business, with mining operating
occurring on almost every continent. The majority of gold
no longer comes from South Africa as it did just 40 years
ago. Today no one region dominates supply, although
China ranks in the top spot. Around 16% of the total
gold produced comes from North America, compared to
23% in Asia, of which China accounts for 14% However,
despite growing geographical diversity, gold is dwindling.
Existing mines are increasingly constrained while new
discoveries are occurring less frequently. When you
consider how long it takes for gold mine project
development to progress, often lasting decades, it’s
unlikely that supply will supersede demand even if new
projects receive approval.
Demand for Goldis expected to increase significantly.
This is evidenced by figures from the first quarter of 2017.
During the three month time period, gold supply fell sharply
by 12% when compared to the same period a year earlier.
In recent years, mine production has remained relatively
stable but it’s now anticipated that it will enter a period of
decline, further heightening the limited supply, as the
number of operational mines rapidly falls over the next
decade. As a result prices are expected to rise.
The US currently hold the most amount of gold in reserves
at 8,133.5 metric tons, a figure that has been virtually
unchanged since the turn of the century. Considering that
just 50 years ago, gold backed the entire US dollar,
reserves held today are incredibly low.
( Continued )

1970
1972
1974
1976
1978
1980
1982
1984
1986
1988
1990
1992
1994
1996
1998
2000
2002
2004
2006
2008
2010
2012
2014
14
Can you imagine what would happen to the price if the small
percentage of the investment world moved into gold?
If it matched the 1980 percentage of 26%, the price of gold
would be beyond the reach of most investors.
Many have been quick to point out that gold was in a bubble
that has burst following its retreat from the 2011 highs of
$1,900, likening the situation to the gold bubble of 1980.
There are many reasons why it would be incorrect to compare
the gold price today against the gold price leading up to 1980.
Gold...The Facts and Figures( Continued )
10000
20003000400050006000700080009000
10000
Firstly, the fundamentals are totally different to the environment in 1980 – the reasons
mentioned above are far more significant than those in the 1980 financial environment.
If you want compare the two events, then you need to compare like with like. The chart
below shows the gold price from 1970 to 2011 adjusted for inflation.
Sometimes a picture is worth a million words, in this case a chart. When you compare like
for like, the gold price is nowhere near its 1980 high. In fact for gold to match the 1980
high allowing for inflation the price would have to reach over $8,000 per oz.
Based on monthly average London PM Fix, March 2014 Dollars
March 2014Dollars Per Ounce

Given all of the fundamental reasons in this document, coupled with the fact that gold
is nowhere near its inflation adjusted high, we believe gold is in phase two of a bull
market cycle. The chart highlights this below.
Gold is the ultimate insurance policy. Throughout the last 1,000 years of history, most
episodes of printing money have been followed by pronounced periods of inflation or
even in extreme cases, hyperinflation, either severely affecting the nation’s stability or
culminating in warfare, dictatorships or political collapse. A simple glance will quickly
reveal that those who capitalised of these unique periods were holders of monetary
metals such as gold.
Even if you believe these possible outcomes are improbable, ownership of physical
gold will not only provide you with the opportunity to protect your wealth, but will
appreciate it significantly.
The opinions and views expressed above are re-enforced by a large number of
trusted market analysts. For more information, live gold prices and up to the minute
gold market analysis please contact the United Kingdom Asset Company on the
details below.
All rights reserved Copyright © 2018 United Kingdom Asset Company Limited, 71-75 Shelton Street, Covent Garden,
London, WC2H 9JQ company registered In England and Wales with company number: 09784057
Tel: 0203 695 9900
Web: www.ukassetcompany.co.uk
Email: [email protected]
United Kingdom Asset Company Limited (FRN 820128) is an Introducer Appointed Representative of
European American Capital Services Limited, a company which is authorised and regulated by the
Financial Conduct Authority (FRN 401897). 15
Conclusion
Gold bullion will never default on promises nor obligations, and in times of financial crisis, gold bullion tends to increase sharply in value.
Gold has been a store of value for over 6,000 years. As track records go, that’s a
fairly good one. In this age of uncertainty, nothing will weather the tests of time
better than gold.