why does democracy need education? - harvard...
TRANSCRIPT
J Econ Growth (2007) 12:77–99DOI 10.1007/s10887-007-9015-1
Why does democracy need education?
Edward L. Glaeser · Giacomo A. M. Ponzetto ·Andrei Shleifer
Published online: 31 May 2007© Springer Science+Business Media, LLC 2007
Abstract Across countries, education and democracy are highly correlated. We motivateempirically and then model a causal mechanism explaining this correlation. In our model,schooling teaches people to interact with others and raises the benefits of civic participa-tion, including voting and organizing. In the battle between democracy and dictatorship,democracy has a wide potential base of support but offers weak incentives to its defenders.Dictatorship provides stronger incentives to a narrower base. As education raises the benefitsof civic engagement, it raises participation in support of a broad-based regime (democ-racy) relative to that in support of a narrow-based regime (dictatorship). This increases thelikelihood of successful democratic revolutions against dictatorships, and reduces that ofsuccessful anti-democratic coups.
Keywords Democracy · Education · Political participation
1 Introduction
The hypothesis that higher education leads to more democratic politics (Lipset, 1959, 1960)has received a good deal of empirical support (Barro, 1999; Glaeser, LaPorta, Lopez-de-Silanes, and Shleifer, 2004; Papaioannou and Siourounis, 2005). However, the theoreticalreasons for this relationship remain unexplored. Indeed, according to (Barro, 1999,p. S182),“given the strength of the Aristotle/Lipset hypothesis as an empirical regularity, it is surpris-ing that convincing theoretical models of this relationship do not exist.” In this paper, wefirst motivate and then propose one model of a causal impact of education on democracy.
Our starting point is the connection between education and political participation. Thisconnection has been emphasized by Almond and Verba (1989,1st ed. 1963), who see
E. L. Glaeser · A. ShleiferHarvard University and NBER, Cambridge, MA, USA
G. A. M. Ponzetto · A. Shleifer (B)Department of Economics, Harvard University, M9 Littauer Center, Cambridge, MA 02138, USA
123
78 J Econ Growth (2007) 12:77–99
education as a crucial determinant of “civic culture” and participation in democratic pol-itics. “The uneducated man or the man with limited education is a different political actorfrom the man who has achieved a higher level of education (p. 315).” Almond and Verba’swork has influenced both political science (e.g., Brady, Verba, and Schlozman, 1995) andsociology (e.g., Kamens, 1988), and our work can be seen as an elaboration of their ideasusing theoretical and empirical tools of economics.
A dramatic place to see the effect of education on political participation is student activ-ism. Students rioted against authority at Oxford, Bologna, and Paris even in the Middle Ages.Martin Luther found the most immediate intense support from the students in Wittenberg andother German universities. Students played key roles in liberal movements and revolutionsin Europe in the middle of the 19th century. “If the revolution had a core, it was the youngeducated elite” (Rander-Pehrson, 1999,p. 145). Student demonstrations played a role in theoverthrow of Peron in Argentina in 1955, the Hungarian Revolution in 1956, the downfallof Perez Jimenez in Venezuela in 1958, the resignation of the Kishi government in Japan in1960, the resistance to Diem in Vietnam in 1963, the anti-Sukarno movement in Indonesiaand the toppling of the Rhee government in Korea in 1966, the Prague Spring in 1968, andthe downfall of Ayub Khan in Pakistan in 1969. The Tianenmen student uprising of 1989failed to depose the Communist Party, perhaps because the students got little support ingenerally uneducated China and were crushed by the troops. Most recently, peaceful demon-strations in which students played a key part helped save democracy in Ukraine against theaggrandizement by the ex-President who stole the election.
It would be incorrect to conclude from these examples that students have a preference fordemocratic government—perhaps because they value freedom, information, or elections—rather than for political participation. The hep-hep anti-semitic riots in Bavaria in 1819 startedwhen during an academic ceremony an aged professor who had recently come out in favor ofcivic rights for Jews had to run for his life as angry students assaulted him. Mussolini enjoyedsubstantial support from students in the young fascist movement. Hitler likewise relied on theNazi students, who eventually seized control of the universities. In Latin America, studentsoffered strong support to the Che Guevara led communist guerilla movement, no friends ofdemocracy. The evidence that students organize to participate in collective action—demo-cratic or anti-democratic—is much more compelling than the evidence of their preferencefor democracy. Our goal, then, is to explore more deeply the consequences of what we taketo be the primitive connection between education and participation.
In Sect. 2 we briefly review the evidence on education and democracy. Although econo-metric controversies about this evidence still linger, the weight of recent research suggeststhat the Lipset hypothesis is valid, and that theories to explain it are indeed called for.
In Sect. 3, we motivate our basic assumption that education leads to higher participationin a whole range of social activities, including politics. This might be so for several reasons.In one view, schooling incorporates indoctrination about the virtues of political participation.A second view sees human capital as actually social capital: schools largely teach studentsto interact with one another. By improving interpersonal skills, education facilitates civicinvolvement. Using micro-evidence from both the US and other countries, we document therobust correlation between many forms of civic activity, including political participation, andeducation. This evidence is most naturally consistent with the second view.
Motivated by this evidence, we present a model of regime stability in Sect. 4. Unlike theliterature on regime change that typically focuses on the payoffs to citizens under alternativepolitical regimes (e.g., Bourguignon and Verdier, 2000), our model describes incentives toparticipate in the political activity itself. These include top-down incentives, such as pun-ishments meted out by political leaders to their presumed supporters who are shirking. But
123

J Econ Growth (2007) 12:77–99 79
these also include lateral incentives, provided by participants in politics who encourage orshame their friends and peers to join them. Democracies are more inclusive regimes thandictatorships, so, in the spirit of Olson, they deliver weaker top-down incentives. Large pop-ular movements cannot readily compel their members to vote or demonstrate. But our keyassumption is that education raises the benefits of political participation: better educatedpeers are better at persuading friends to join. As a consequence, although education raisesparticipation in both democratic and dictatorial regimes, the increase is greater for the moreinclusive (democratic) regime. When political success is determined by the raw number ofsupporters, education favors democracy relative to dictatorship.
In this model, the political success of a democracy hinges on having a large number ofsupporters whose benefits of political participation are sufficiently high that they fight forit even in the absence of direct rewards. Education supplies such supporters and stabilizesdemocracy. Conversely, in countries with low levels of education, dictatorship or oligarchy ismore stable than democracy, because only dictatorships offer the strong top-down incentivesneeded to induce people to defend them. In the model in Sect. 4, countries with higher levelsof education are more likely both to experience a transition from dictatorship to democ-racy, and to withstand anti-democratic challenges. Moreover, the size of the most successfulchallenger regime to an existing dictatorship rises with the level of education.
In addition to having some empirical support for its core assumption and delivering thebroad empirical predictions documented in Sect. 2, the model has several new implications.It predicts that, in general, education causes the more inclusive groups to dominate politics.In particular, as education increases, groups challenging existing regimes become progres-sively larger—small coups are replaced by large revolutions. Although they remain to beformally tested, these predictions are consistent with a broad outline of European transitionto democracy.
2 The empirical relationship between education and democracy
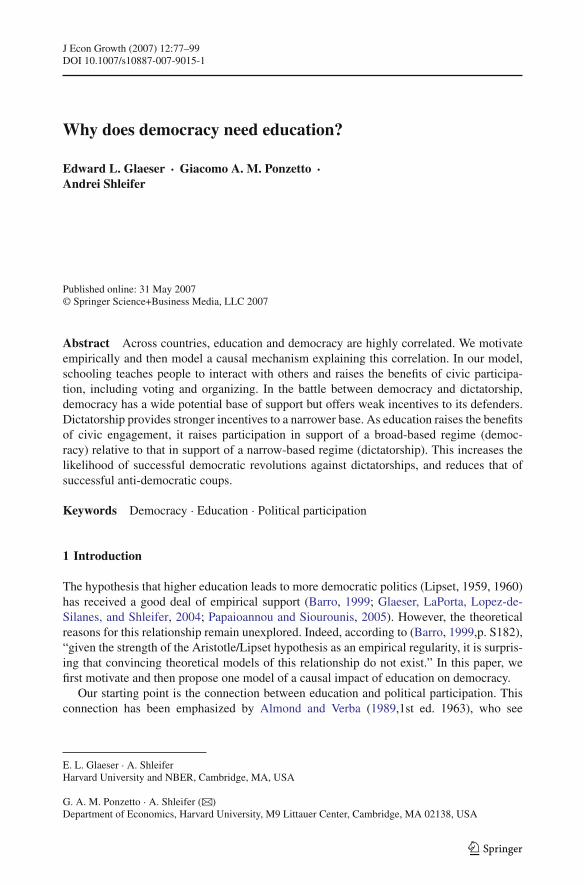
Across the world, the correlation between education and democracy is extremely high.1 Fig-ure 1 shows the relationship between the Polity IV index of democracy (Jaggers and Marshall,2003) and the years of schooling in the country in 1960 (Barro and Lee, 2001). Across 91countries, the correlation coefficient between these variables is 74%.
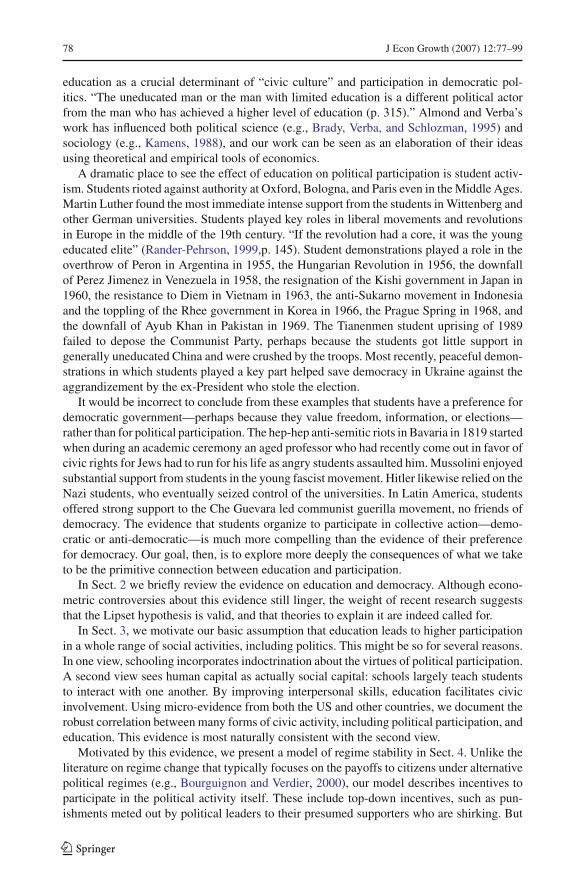
Of course, this correlation does not establish causality. Barro (1997, 1999) conducted theinitial research on the time-series relationship between education and democracy. In thatspirit, consider the evidence on transitions from dictatorship to democracy. Figure 2 showsthe raw correlation between the change in the Jaggers and Marshall (2003) democracy scoreand years of schooling in 1960 (from Barro and Lee) for countries that had low democracyratings (zero or one) in 1960. This correlation is 66%. If we take the entire sample of countriesand regress the change in democracy on initial democracy and initial years of education, weestimate:
Change in Democracy = 4.13(.48)
− .98(.09)
· Democracy in 1960 + .84(.15)
· Schooling in 1960
(1)
1 Przeworski, Alvarez, Cheibub, and Limongi (2000), Barro (1999), Boix and Stokes (2003), Glaeser, LaPorta,Lopez-de-Silanes, and Shleifer (2004), and Papaioannou and Siourounis (2005) also consider the relationshipbetween income and democracy. The conclusion emerging from the controversies is that income does causetransition to democracy, as well as its stability. Our focus, however, is on education not income. Nor do weconsider the consequences of democracy, see, e.g., Przeworski and Limongi (1993) and Mulligan, Gil, andSala-i-Martin (2004).
123
80 J Econ Growth (2007) 12:77–99
Fig. 1 Education and democracy in cross-section
Fig. 2 Schooling and the growth of democracy 1960–2000
There are 65 observations in this regression and the R2 is 67%. Initial schooling, evenin highly dictatorial regimes, strongly predicts becoming more democratic over time. Incontrast, democracy does not predict growth in schooling. We estimate:
Change in Schooling = 2.80(.28)
− .07(.05)
· Democracy in 1960 + .08(.09)
· Schooling in 1960
(2)
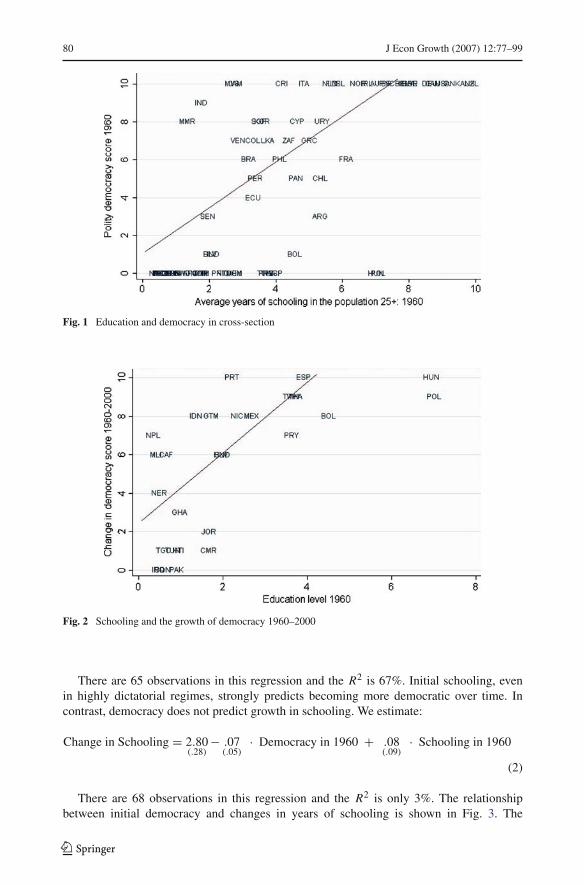
There are 68 observations in this regression and the R2 is only 3%. The relationshipbetween initial democracy and changes in years of schooling is shown in Fig. 3. The
123
J Econ Growth (2007) 12:77–99 81
Fig. 3 Democracy and the growth of schooling 1960–2000
evidence suggests that schooling leads to democracy, but there is no evidence that democracyleads to schooling.
This evidence is subjected to more formal specifications by Glaeser, LaPorta, Lopez-de-Silanes, and Shleifer (2004) and Papaioannou and Siourounis (2005). Both studies con-firm that education is a strong predictor of transition to democracy. The second studyin particular focuses on the third wave of democratization (Huntington, 1991) and showsthat education is a powerful predictor of permanent transitions from dictatorship todemocracy.
The most recent research in this area considered the possibility that some permanentcountry characteristics, such as geography or culture, are responsible for producing botheducation and democracy, and to this end estimated regressions with fixed effects. Ace-moglu, Johnson, Robinson, and Yared (2005) suggest that, with country fixed effects, thereis no remaining relationship between education and democracy. Their results, however, de-pend on a short time series and extreme persistence in the education data (Glaeser et al.,2004). Castello-Climent (2006) and Bobba and Coviello (2006) argue that, in this situa-tion, the appropriate technique is to use the Blundell–Bond (1998) system GMM estimatorrather than the Arellano–Bond (1991) first-difference GMM estimator. When they do so,they find that education indeed causes democracy even taking account of permanent countryeffects.
The overall findings thus seem quite favorable to Lipset’s (1960) hypothesis. Educationis highly correlated with democracy in both cross-section and most recently estimated panelregressions. The best econometric evidence suggests that this effect is causal.
3 Education and civic participation
Education may promote democracy because it raises the benefits (or reduces the costs) ofpolitical activity. In Sect. 4, we take this as an assumption and show how it explains the evi-dence. In this section, we describe some theories of why education raises civic participationand then present some empirical evidence bearing on them.
123
82 J Econ Growth (2007) 12:77–99
3.1 Why should education and civic participation be correlated?
Perhaps the simplest hypothesis explaining the link between education and civic participa-tion is that indoctrination about political participation is a major component of education.In democracies, schools teach their students that political participation is good. One “con-tent standard” listed by the State of California’s Department of Education advocates thatstudents “understand the obligations of civic-mindedness, including voting, being informedon civic issues, volunteering and performing public service, and serving in the military oralternative service.” The original public school movement in the US emphasized preparingstudents for participation in democracy. This emphasis is not unique to America. Holmes(1979) synthesizes the aims of schools systems around the world. Political aims are oftencited as an educational goal: “school work is organized so as to develop democracy in schooland consequently in society as a whole” (Sweden), “the Constitution states that a generalaim of education is to produce good citizens, a democratic way of living and human soli-darity” (Costa Rica), and “an education system that creates knowledgeable, democratic andpatriotic citizens is the aim of the Indonesian government.” Perhaps the key implication ofthe indoctrination hypothesis is that the positive impact of schooling should be particularlypronounced in political rather than all social participation.
A second hypothesis holds that schooling lowers the costs of social interactions moregenerally. According to this view, a primary aim of education is socialization—teachingpeople how to interact successfully and productively with others. “Education is one of themost important predictors—usually, in fact, the most important predictor—of many formsof social engagement—from voting to chairing a local committee to hosting a dinner partyto trusting others” (Helliwell and Putnam, 2007).
What are some of the possible microeconomic mechanisms behind this phenomenon?Social activities hinge on interpersonal exchange of information. The direct benefit of inter-action arises from coordination (Gradstein and Justman, 2002). Coordination requires mem-bers of a group to explain and to be able to understand what is to be done, how it will beaccomplished, and what the motivations for acting are. Social connection also provides indi-rect benefits in that, by communicating with others, group members acquire new informationthat is useful for their private purposes. On the other hand, miscommunication is costly toboth groups and individuals. Misunderstandings lead to coordination failures that may provefatal to a group’s mission. At the individual level, misunderstandings lead to hurt feelingsand arguments, not to mention poor decisions.
Education raises the benefit from social participation because it facilitates seamless infor-mation exchange. Educated people are better able to express what they know, to inform, andto persuade. They are also better able to acquire new information, to understand, and to learn.Schooling also teaches rules of behavior that make a discussion between educated peopleboth more informative and less likely to degenerate into a quarrel (Bowles and Gintis, 1976).These procedural benefits capture the fundamental value of education as socialization. Atevery level from primary school to university, education is the acquisition of skills helpfulfor operating with both knowledge and people, to be able to learn and to teach.
Education textbooks list socialization as a pillar of curriculum design. Driscoll and Nagel(2005) describe several curricular approaches to primary education. Many of these list socialoutcomes among the goals: “the children will develop cooperative relationships, reflectingboth social skills and understanding the perspectives of others” (the Kamii and DeVriesapproach); “socialization of children. Self-regulation of behavior is necessary to participa-tion in forms of society and in relationship with others” (the Bank Street approach); and“conditions that promote or strengthen relationships between children, and between children
123

J Econ Growth (2007) 12:77–99 83
and adults” (the Waldorf approach). Gordon and Browne (2004) write that “a major role forthe early childhood teacher is to see that children have enjoyable social contacts and to helpmotivate children toward a desire to be with others,” because “enhancing social intelligencebuilds a set of skills that may be among the most essential for life success of many kinds.”
Why do schools spend so much effort on socializing children? An altruistic view mightsuggest that the ability to work well in social settings is among the most important skillsneeded to function in society. A more cynical view sees socialized children as easier for theirteachers to manage. Whatever the reason, schools in all political and religious regimes devoteconsiderable resources to teaching social cooperation.2
The socialization hypothesis predicts that education should impact all forms of socialinvolvement. Its ability to predict political engagement should be no stronger than that forother forms of social participation. This theory also predicts no difference in the impact ofeducation on social activities in democracies or non-democracies.
These two hypotheses both assume that education causes civic participation. It is at leastpossible that the link between schooling and education represents selection, not treatment,and that exogenous characteristics that make people tolerant of education also enable themto sit through meetings or wait in line to vote. If this were true, then exogenous increases inschooling would have no impact on overall levels of civic participation. Furthermore, if innatecharacteristics vary more within than across areas, this view predicts a low (or non-existent)relationship between education and civic participation at the aggregate level.
3.2 Empirical evidence on education and civic participation
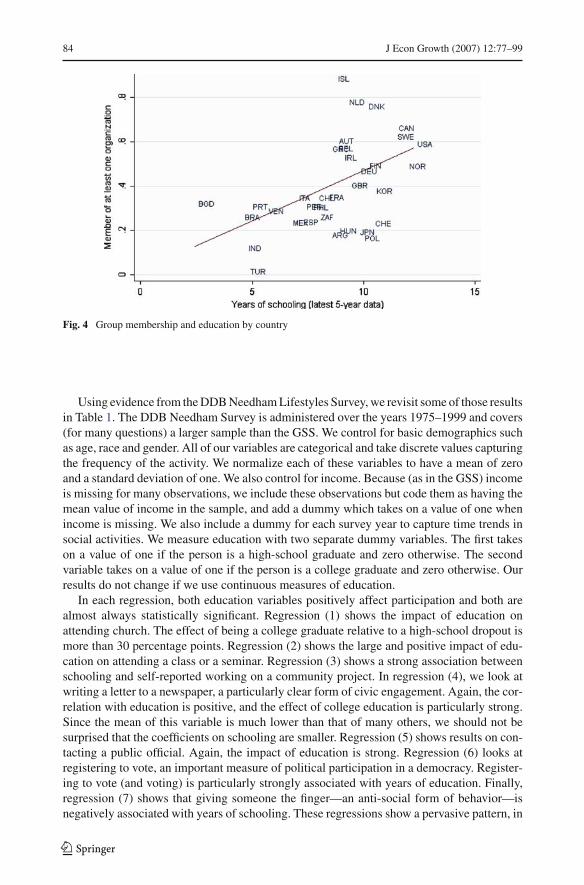
Using the World Values Survey (WVS), we begin with cross-country evidence on educa-tion and membership in social groups. We exclude countries with the Polity IV autocracyscore above 4 from the analysis because these countries force party and other participation.(For example, 25% of the Chinese respondents report membership in the Communist party).Figure 4 presents the results for the available 34 countries. It shows a sharply positive andstatistically significant (t = 3.31) relationship between education and participation in socialgroups. This evidence is broadly consistent with our theoretical perspective, but unfortunatelydoes not allow us to distinguish the various hypotheses.
We can do that better with individual-level evidence from the US. There are two primaryindividual-level sources for information on social activities: the General Social Survey (GSS)and the DDB Needham Lifestyles Survey. Using the GSS, DiPasquale and Glaeser (1999)document a strong positive relationship between education and a variety of social outcomes.College graduates are 27% more likely than high-school dropouts to say that they vote inlocal elections and 29% more likely to say that they help solve local problems.
College graduates are also more likely to join organizations. Glaeser and Sacerdote (2001)show this to be true for 15 out of 16 forms of group membership: the exception is trade-unionmembership. Using the WVS, they also find a significant positive relationship between yearsof education and group membership in almost every country. Education also positively pre-dicts church attendance in the GSS. Fifty percent of American college graduates say thatthey attend church more than several times per year; 36% of high-school graduates say theyattend that often.
2 By social cooperation we do not mean obedience to authority. Obedience to authority is of course somethingdifferent that schools also teach, although evidently not as successfully, as the evidence of student—and moregenerally educated people’s—activism against authority illustrates.
123
84 J Econ Growth (2007) 12:77–99
Fig. 4 Group membership and education by country
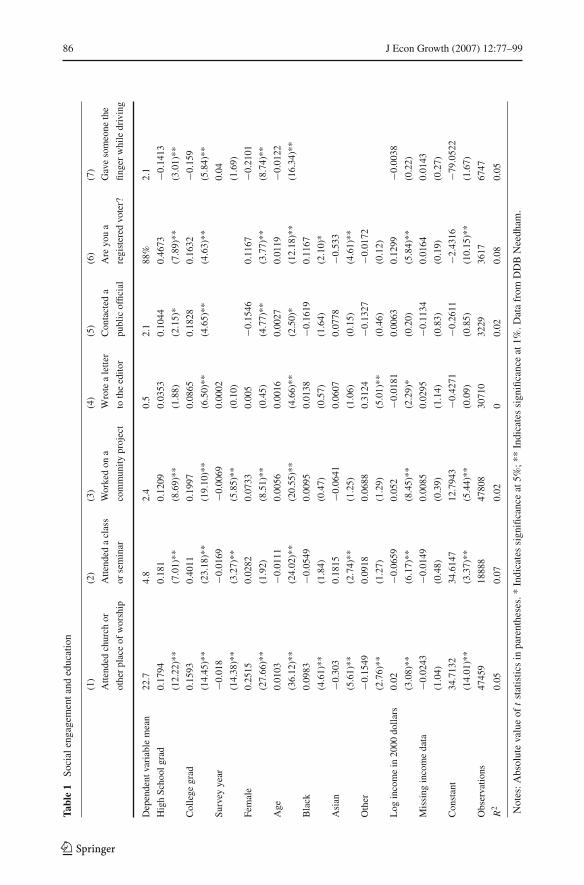
Using evidence from the DDB Needham Lifestyles Survey, we revisit some of those resultsin Table 1. The DDB Needham Survey is administered over the years 1975–1999 and covers(for many questions) a larger sample than the GSS. We control for basic demographics suchas age, race and gender. All of our variables are categorical and take discrete values capturingthe frequency of the activity. We normalize each of these variables to have a mean of zeroand a standard deviation of one. We also control for income. Because (as in the GSS) incomeis missing for many observations, we include these observations but code them as having themean value of income in the sample, and add a dummy which takes on a value of one whenincome is missing. We also include a dummy for each survey year to capture time trends insocial activities. We measure education with two separate dummy variables. The first takeson a value of one if the person is a high-school graduate and zero otherwise. The secondvariable takes on a value of one if the person is a college graduate and zero otherwise. Ourresults do not change if we use continuous measures of education.
In each regression, both education variables positively affect participation and both arealmost always statistically significant. Regression (1) shows the impact of education onattending church. The effect of being a college graduate relative to a high-school dropout ismore than 30 percentage points. Regression (2) shows the large and positive impact of edu-cation on attending a class or a seminar. Regression (3) shows a strong association betweenschooling and self-reported working on a community project. In regression (4), we look atwriting a letter to a newspaper, a particularly clear form of civic engagement. Again, the cor-relation with education is positive, and the effect of college education is particularly strong.Since the mean of this variable is much lower than that of many others, we should not besurprised that the coefficients on schooling are smaller. Regression (5) shows results on con-tacting a public official. Again, the impact of education is strong. Regression (6) looks atregistering to vote, an important measure of political participation in a democracy. Register-ing to vote (and voting) is particularly strongly associated with years of education. Finally,regression (7) shows that giving someone the finger—an anti-social form of behavior—isnegatively associated with years of schooling. These regressions show a pervasive pattern, in
123
J Econ Growth (2007) 12:77–99 85
which years of schooling are associated not only with political participation in a democracy,but also with many other forms of social engagement.
Because our model addresses political battles that are often violent outside the US, wenow turn to the evidence on more violent forms of group activity. Education and training areclosely linked to military discipline and group coherence under fire (Hanson, 2001). Follow-ing Keegan (1976) and many others, Hanson argues both that historically military success isprimarily the result of troops not fleeing under fire and that military discipline is itself theresult of culture and education. Costa and Kahn (2003) show that illiteracy strongly predictsdesertion among Union soldiers in the American Civil War.
Ferguson (1999) looks at the ratio of prisoners of war to total casualties across coun-tries during the First World War. This variable is described by some military historians as ameasure of soldiers’ willingness to surrender, as opposed to fight, under fire. Across majorcombatant countries, the ratio of prisoners to total casualties was the lowest for the UK,the US, and Germany (1.4%, 6.7% and 9%, respectively). These arguably were the besteducated combatants. The ratio of prisoners to total casualties was the highest among Rus-sians, Austro-Hungarians and Italians (51.8%, 31.8%, and 25.8%)—the least educated of themajor combatants. More standard forms of military history corroborate that these prisonerrates capture general failures of morale.
Finally, two recent studies address the view that the correlation between education andparticipation is selection. Milligan, Moretti, and Oreopoulous (2004) find that exogenousincreases in education due to compulsory schooling laws raise voter turnout. Dee (2004)finds that increases in education accounted for by availability of junior and community col-leges have a large effect on subsequent participation in voting. These results suggest that theeffect of education on political participation is causal, rather than just the consequence ofselection.
Can the evidence help us distinguish between the other hypotheses? The fact that educa-tion increases all forms of participation, many of which are deeply apolitical, goes against thepolitical indoctrination hypothesis. That hypothesis is also undermined by the peaceful anti-communist revolutions throughout Eastern Europe and the former Soviet Union, dominatedby educated people with years of pro-communist indoctrination under their belts. Given theseparation between church and state in the US and UK, and given the often anti-religioussentiment of the French educational establishment, the positive correlation between yearsof education and church attendance is hard to understand as reflecting political indoctrina-tion.
The theory that best explains all of the facts is the second hypothesis: education is social-ization. This theory predicts the universal relationship between education and participationacross activities and across countries. Of course, this does not mean that other mechanismsdo not also operate, but we are inclined to accept the view that acquiring social capital is acrucial part of acquiring human capital.
4 A model of education and democracy
In this section, we model a channel through which education encourages democracy, bothby increasing its stability and by increasing the probability of transition to democracy. Thecritical assumption, following the evidence in Sect. 3, is that education raises the benefits ofpolitical participation. The core insight of the model is that democracy requires support froma broad base of citizens who face only weak incentives to fight for it, while dictatorships offer
123
86 J Econ Growth (2007) 12:77–99
Tabl
e1
Soci
alen
gage
men
tand
educ
atio
n
(1)
(2)
(3)
(4)
(5)
(6)
(7)
Atte
nded
chur
chor
Atte
nded
acl
ass
Wor
ked
ona
Wro
tea
lette
rC
onta
cted
aA
reyo
ua
Gav
eso
meo
neth
e
othe
rpl
ace
ofw
orsh
ipor
sem
inar
com
mun
itypr
ojec
tto
the
edito
rpu
blic
offic
ial
regi
ster
edvo
ter?
finge
rw
hile
driv
ing
Dep
ende
ntva
riab
lem
ean
22.7
4.8
2.4
0.5
2.1
88%
2.1
Hig
hSc
hool
grad
0.17
940.
181
0.12
090.
0353
0.10
440.
4673
−0.1
413
(12.
22)*
*(7
.01)
**(8
.69)
**(1
.88)
(2.1
5)*
(7.8
9)**
(3.0
1)**
Col
lege
grad
0.15
930.
4011
0.19
970.
0865
0.18
280.
1632
−0.1
59
(14.
45)*
*(2
3.18
)**
(19.
10)*
*(6
.50)
**(4
.65)
**(4
.63)
**(5
.84)
**
Surv
eyye
ar−0
.018
−0.0
169
−0.0
069
0.00
020.
04
(14.
38)*
*(3
.27)
**(5
.85)
**(0
.10)
(1.6
9)
Fem
ale
0.25
150.
0282
0.07
330.
005
−0.1
546
0.11
67−0
.210
1
(27.
66)*
*(1
.92)
(8.5
1)**
(0.4
5)(4
.77)
**(3
.77)
**(8
.74)
**
Age
0.01
03−0
.011
10.
0056
0.00
160.
0027
0.01
19−0
.012
2
(36.
12)*
*(2
4.02
)**
(20.
55)*
*(4
.66)
**(2
.50)
*(1
2.18
)**
(16.
34)*
*
Bla
ck0.
0983
−0.0
549
0.00
950.
0138
−0.1
619
0.11
67
(4.6
1)**
(1.8
4)(0
.47)
(0.5
7)(1
.64)
(2.1
0)*
Asi
an−0
.303
0.18
15−0
.064
10.
0607
0.07
78−0
.533
(5.6
1)**
(2.7
4)**
(1.2
5)(1
.06)
(0.1
5)(4
.61)
**
Oth
er−0
.154
90.
0918
0.06
880.
3124
−0.1
327
−0.0
172
(2.7
6)**
(1.2
7)(1
.29)
(5.0
1)**
(0.4
6)(0
.12)
Log
inco
me
in20
00do
llars
0.02
−0.0
659
0.05
2−0
.018
10.
0063
0.12
99−0
.003
8
(3.0
8)**
(6.1
7)**
(8.4
5)**
(2.2
9)*
(0.2
0)(5
.84)
**(0
.22)
Mis
sing
inco
me
data
−0.0
243
−0.0
149
0.00
850.
0295
−0.1
134
0.01
640.
0143
(1.0
4)(0
.48)
(0.3
9)(1
.14)
(0.8
3)(0
.19)
(0.2
7)
Con
stan
t34
.713
234
.614
712
.794
3−0
.427
1−0
.261
1−2
.431
6−7
9.05
22
(14.
01)*
*(3
.37)
**(5
.44)
**(0
.09)
(0.8
5)(1
0.15
)**
(1.6
7)
Obs
erva
tions
4745
918
888
4780
830
710
3229
3617
6747
R2
0.05
0.07
0.02
00.
020.
080.
05
Not
es:A
bsol
ute
valu
eof
tst
atis
tics
inpa
rent
hese
s.*
Indi
cate
ssi
gnifi
canc
eat
5%;*
*In
dica
tes
sign
ifica
nce
at1%
.Dat
afr
omD
DB
Nee
dham
.
123
J Econ Growth (2007) 12:77–99 87
strong incentives to a narrow base of supporters. Education raises the benefits of politicalparticipation and draws relatively more people to support democracy.
4.1 Model setup
The country is populated by measure one of homogeneous citizens, each with a human cap-ital level of h ≥ 0.3 A regime is defined as a set Gi of insiders, with gi ∈ [0, 1] being themeasure of the set, or the size of the regime. We interpret a larger gi as a more democraticregime. We call a regime with gi = 1 a perfect democracy.
In period zero, there is an exogenous status quo regime G0 of size g0. In period one, analternative regime G1 of size g1 is proposed. Membership in each regime is exogenous. Inperiod two, each individual chooses whether to defend the existing regime, to fight for thenew regime, or to stay politically uninvolved. Individuals may not support both regimes. Inthis model, while each individual takes as given his membership in a particular regime (or inneither), he still chooses whether to participate in politics.
We let si ∈ [0, gi ] denote the endogenously determined mass of insiders who choose tosupport regime Gi . The challenger unseats the incumbent if and only if ε0s0 ≤ ε1s1, whereεi is a random shock to the effectiveness of each faction’s supporters. The ratio ρ = ε0/ε1
has a continuous probability distribution Z(ρ) on R+.
Each individual is of measure zero and so does not impact the probability that eitherregime succeeds. Individuals therefore do not base their political participation decisions ontheir impact on the outcome. Instead, participation in politics is based on three differentforces. First, regimes provide incentives to their members to participate. These incentivestake the form of punishing a regime’s insiders who do not fight for it (or, equivalently,rewarding regime insiders who do come out and fight). Second, regime insiders who partici-pate themselves motivate their fellow insiders to join them through persuasion, camaraderie,or peer pressure. We model this as a benefit from participation (equivalently, it can be a costof non-participation, if your friends shame you when you sit out). We also assume that thereare individual-specific costs of participation. In our model, what is crucial is the net benefitof participating in politics relative to not participating, so it does not matter whether eitherregime-level or peer-level incentives take the form of punishments or rewards.
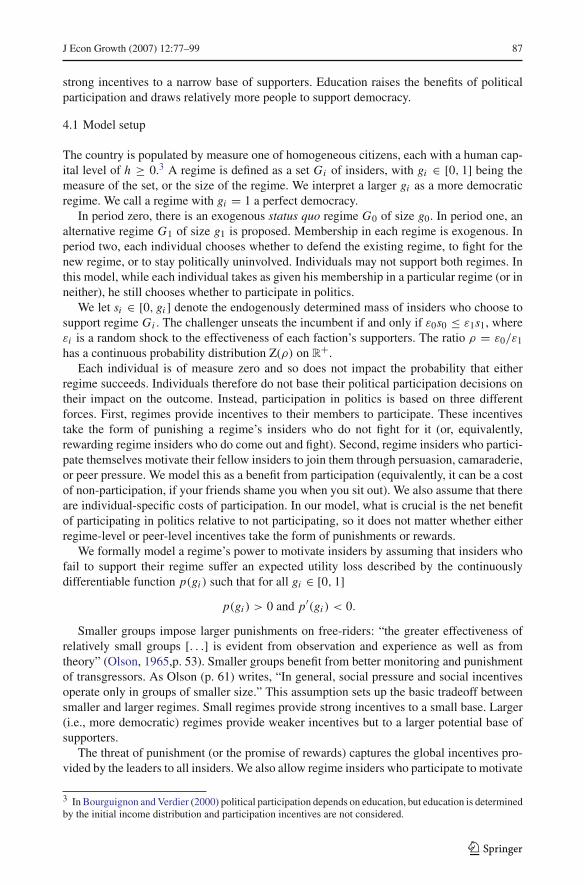
We formally model a regime’s power to motivate insiders by assuming that insiders whofail to support their regime suffer an expected utility loss described by the continuouslydifferentiable function p(gi ) such that for all gi ∈ [0, 1]
p(gi ) > 0 and p′(gi ) < 0.
Smaller groups impose larger punishments on free-riders: “the greater effectiveness ofrelatively small groups [. . .] is evident from observation and experience as well as fromtheory” (Olson, 1965,p. 53). Smaller groups benefit from better monitoring and punishmentof transgressors. As Olson (p. 61) writes, “In general, social pressure and social incentivesoperate only in groups of smaller size.” This assumption sets up the basic tradeoff betweensmaller and larger regimes. Small regimes provide strong incentives to a small base. Larger(i.e., more democratic) regimes provide weaker incentives but to a larger potential base ofsupporters.
The threat of punishment (or the promise of rewards) captures the global incentives pro-vided by the leaders to all insiders. We also allow regime insiders who participate to motivate
3 In Bourguignon and Verdier (2000) political participation depends on education, but education is determinedby the initial income distribution and participation incentives are not considered.
123

88 J Econ Growth (2007) 12:77–99
their peers to do likewise. While the regime-level motivation should be thought of as lead-ers threatening members, we think of this local motivation as friends convincing friends tocome out and fight. Precisely because of their local nature, these benefits depend not on theaggregate size of the regime, but on the rate of participation ai ∈ [0, 1], which captures theshare of friends who turn out to support a regime and provide motivation, or identically theprobability that each friend turns out.
We also assume that these benefits of participation are a function of the human capi-tal of regime members, and specifically that they are represented by a twice continuouslydifferentiable function b(ai h) such that b(0) = 0 and for all ai ∈ [0, 1] and h ≥ 0
b′(ai h) > 0 and b′′(ai h) < 0.
Higher levels of human capital make people better at inducing their peers to participatepolitically.4 As discussed in Sect. 3, this reflects the twofold role of education in creatingsocial skills. First, more educated people are better at cajoling, encouraging, motivating, orotherwise persuading others they interact with to join them. Second, more educated people arebetter able to reap the benefits of social interaction themselves, perhaps because they under-stand better why they are participating. Socialization covers the twin powers to persuade andto understand, both captured by b(.). It is more appealing to participate in a collective activitythe more educated a person is, and the more educated the other participants are.
Offsetting the global and local incentives is an effort cost c of political participation, whichis identically and independently distributed across all individuals with continuous distribu-tion F(c). This idiosyncratic cost is realized at the start of period two, after membership inthe two regimes has been defined.
4.2 Group equilibrium
Peer incentives for participation determine a social multiplier, which could be understood asa bandwagon effect. The more active members a group already has, the more likely to partic-ipate the remaining members are. The participation rate ai is then endogenously determinedas a function of the exogenous parameters gi and h. In a group equilibrium,
ai = F(p(gi ) + b(ai h)).
In principle, strategic complementarity could lead multiple equilibria, some of whichwould typically be Pareto ranked (Cooper and John, 1988). Although coordination failuresmay play a part in the empirical determination of turnout, they are not central to our analysis.Moreover, considering a scenario without coordination failures allows us to establish a morerobust link between education and participation, before taking into account the role of humancapital in resolving coordination failures.
Hence, we make two economically intuitive assumptions on the distribution of costs thatguarantee uniqueness of the group equilibrium:
Assumption 1 c has a connected support C that includes the range of p(gi ) + b(ai h).
Assumption 2 c has a continuously differentiable density f (c) that is monotonenon-increasing: f ′(c) ≤ 0 for every c ∈ C .
4 There is no loss of generality in having h enter linearly, because we choose how to measure h. We couldwrite b(ai h(H)), where h(.) is any monotone increasing function and H is another more natural measure ofhuman capital, such as years of schooling.
123
J Econ Growth (2007) 12:77–99 89
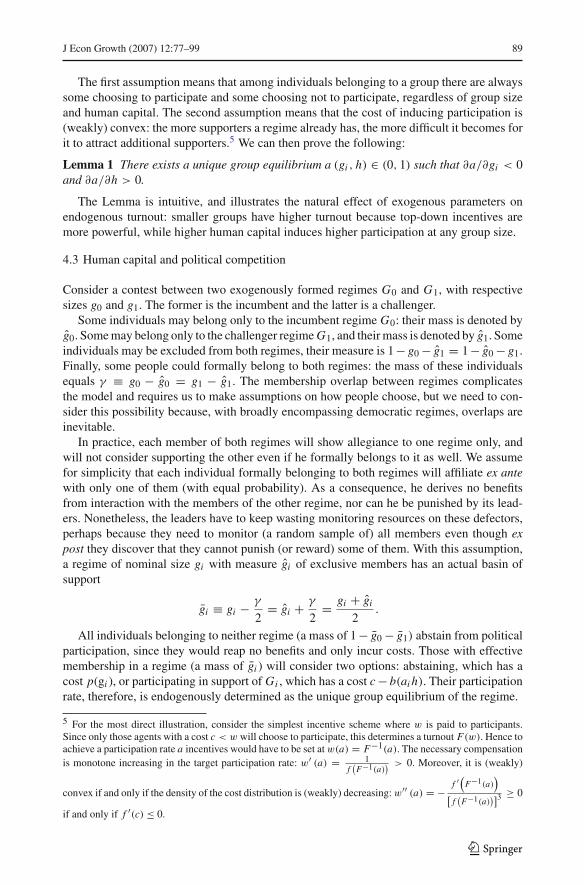
The first assumption means that among individuals belonging to a group there are alwayssome choosing to participate and some choosing not to participate, regardless of group sizeand human capital. The second assumption means that the cost of inducing participation is(weakly) convex: the more supporters a regime already has, the more difficult it becomes forit to attract additional supporters.5 We can then prove the following:
Lemma 1 There exists a unique group equilibrium a (gi , h) ∈ (0, 1) such that ∂a/∂gi < 0and ∂a/∂h > 0.
The Lemma is intuitive, and illustrates the natural effect of exogenous parameters onendogenous turnout: smaller groups have higher turnout because top-down incentives aremore powerful, while higher human capital induces higher participation at any group size.
4.3 Human capital and political competition
Consider a contest between two exogenously formed regimes G0 and G1, with respectivesizes g0 and g1. The former is the incumbent and the latter is a challenger.
Some individuals may belong only to the incumbent regime G0: their mass is denoted byg0. Some may belong only to the challenger regime G1, and their mass is denoted by g1. Someindividuals may be excluded from both regimes, their measure is 1 − g0 − g1 = 1 − g0 − g1.Finally, some people could formally belong to both regimes: the mass of these individualsequals γ ≡ g0 − g0 = g1 − g1. The membership overlap between regimes complicatesthe model and requires us to make assumptions on how people choose, but we need to con-sider this possibility because, with broadly encompassing democratic regimes, overlaps areinevitable.
In practice, each member of both regimes will show allegiance to one regime only, andwill not consider supporting the other even if he formally belongs to it as well. We assumefor simplicity that each individual formally belonging to both regimes will affiliate ex antewith only one of them (with equal probability). As a consequence, he derives no benefitsfrom interaction with the members of the other regime, nor can he be punished by its lead-ers. Nonetheless, the leaders have to keep wasting monitoring resources on these defectors,perhaps because they need to monitor (a random sample of) all members even though expost they discover that they cannot punish (or reward) some of them. With this assumption,a regime of nominal size gi with measure gi of exclusive members has an actual basin ofsupport
gi ≡ gi − γ
2= gi + γ
2= gi + gi
2.
All individuals belonging to neither regime (a mass of 1 − g0 − g1) abstain from politicalparticipation, since they would reap no benefits and only incur costs. Those with effectivemembership in a regime (a mass of gi ) will consider two options: abstaining, which has acost p(gi ), or participating in support of Gi , which has a cost c − b(ai h). Their participationrate, therefore, is endogenously determined as the unique group equilibrium of the regime.
5 For the most direct illustration, consider the simplest incentive scheme where w is paid to participants.Since only those agents with a cost c < w will choose to participate, this determines a turnout F(w). Hence toachieve a participation rate a incentives would have to be set at w(a) = F−1(a). The necessary compensationis monotone increasing in the target participation rate: w′ (a) = 1
f(F−1(a)
) > 0. Moreover, it is (weakly)
convex if and only if the density of the cost distribution is (weakly) decreasing: w′′ (a) = − f ′(F−1(a))
[f(F−1(a)
)]3 ≥ 0
if and only if f ′(c) ≤ 0.
123
90 J Econ Growth (2007) 12:77–99
0.8
0.6
g1 = 0.15
0.4
0.2
0.8
0.2
π
h
g1 = 1
10.60.4
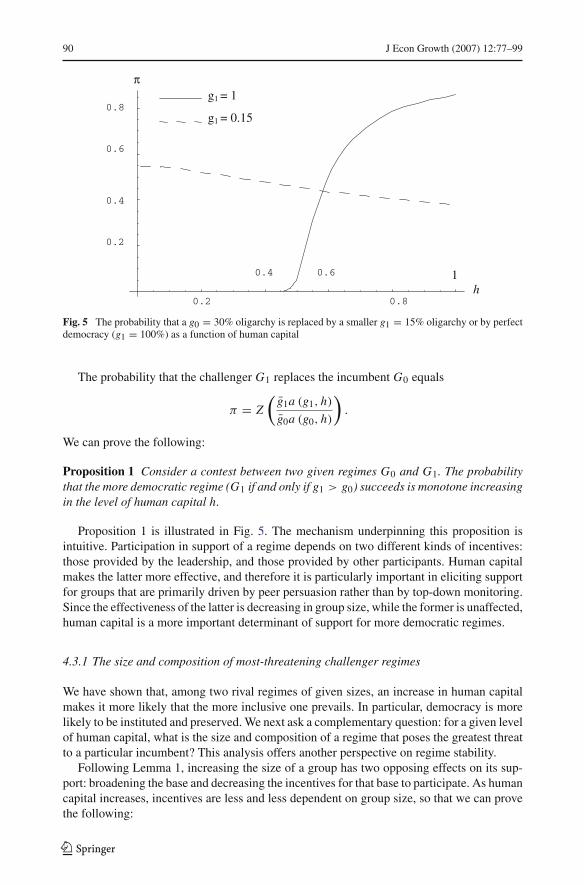
Fig. 5 The probability that a g0 = 30% oligarchy is replaced by a smaller g1 = 15% oligarchy or by perfectdemocracy (g1 = 100%) as a function of human capital
The probability that the challenger G1 replaces the incumbent G0 equals
π = Z
(g1a (g1, h)
g0a (g0, h)
).
We can prove the following:
Proposition 1 Consider a contest between two given regimes G0 and G1. The probabilitythat the more democratic regime (G1 if and only if g1 > g0) succeeds is monotone increasingin the level of human capital h.
Proposition 1 is illustrated in Fig. 5. The mechanism underpinning this proposition isintuitive. Participation in support of a regime depends on two different kinds of incentives:those provided by the leadership, and those provided by other participants. Human capitalmakes the latter more effective, and therefore it is particularly important in eliciting supportfor groups that are primarily driven by peer persuasion rather than by top-down monitoring.Since the effectiveness of the latter is decreasing in group size, while the former is unaffected,human capital is a more important determinant of support for more democratic regimes.
4.3.1 The size and composition of most-threatening challenger regimes
We have shown that, among two rival regimes of given sizes, an increase in human capitalmakes it more likely that the more inclusive one prevails. In particular, democracy is morelikely to be instituted and preserved. We next ask a complementary question: for a given levelof human capital, what is the size and composition of a regime that poses the greatest threatto a particular incumbent? This analysis offers another perspective on regime stability.
Following Lemma 1, increasing the size of a group has two opposing effects on its sup-port: broadening the base and decreasing the incentives for that base to participate. As humancapital increases, incentives are less and less dependent on group size, so that we can provethe following:
123
J Econ Growth (2007) 12:77–99 91
0.2
0.4
1
0.6
0.8
g1*
h0.40.2 10.6 0.8
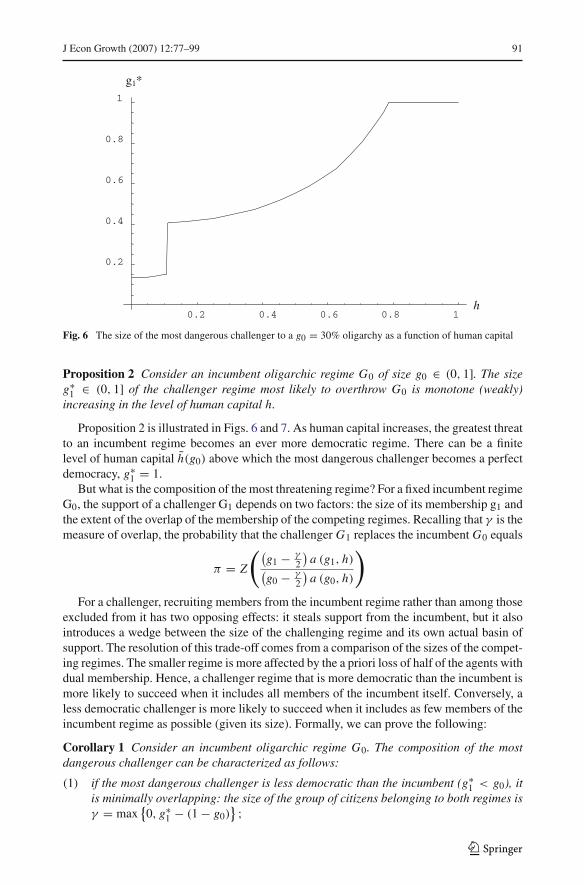
Fig. 6 The size of the most dangerous challenger to a g0 = 30% oligarchy as a function of human capital
Proposition 2 Consider an incumbent oligarchic regime G0 of size g0 ∈ (0, 1]. The sizeg∗
1 ∈ (0, 1] of the challenger regime most likely to overthrow G0 is monotone (weakly)increasing in the level of human capital h.
Proposition 2 is illustrated in Figs. 6 and 7. As human capital increases, the greatest threatto an incumbent regime becomes an ever more democratic regime. There can be a finitelevel of human capital h(g0) above which the most dangerous challenger becomes a perfectdemocracy, g∗
1 = 1.But what is the composition of the most threatening regime? For a fixed incumbent regime
G0, the support of a challenger G1 depends on two factors: the size of its membership g1 andthe extent of the overlap of the membership of the competing regimes. Recalling that γ is themeasure of overlap, the probability that the challenger G1 replaces the incumbent G0 equals
π = Z
((g1 − γ
2
)a (g1, h)
(g0 − γ
2
)a (g0, h)
)
For a challenger, recruiting members from the incumbent regime rather than among thoseexcluded from it has two opposing effects: it steals support from the incumbent, but it alsointroduces a wedge between the size of the challenging regime and its own actual basin ofsupport. The resolution of this trade-off comes from a comparison of the sizes of the compet-ing regimes. The smaller regime is more affected by the a priori loss of half of the agents withdual membership. Hence, a challenger regime that is more democratic than the incumbent ismore likely to succeed when it includes all members of the incumbent itself. Conversely, aless democratic challenger is more likely to succeed when it includes as few members of theincumbent regime as possible (given its size). Formally, we can prove the following:
Corollary 1 Consider an incumbent oligarchic regime G0. The composition of the mostdangerous challenger can be characterized as follows:
(1) if the most dangerous challenger is less democratic than the incumbent (g∗1 < g0), it
is minimally overlapping: the size of the group of citizens belonging to both regimes isγ = max
{0, g∗
1 − (1 − g0)} ;
123
92 J Econ Growth (2007) 12:77–99
0.2
0.2 0.4 0.6 0.8 1h
0.4
0.6
0.8
g1*
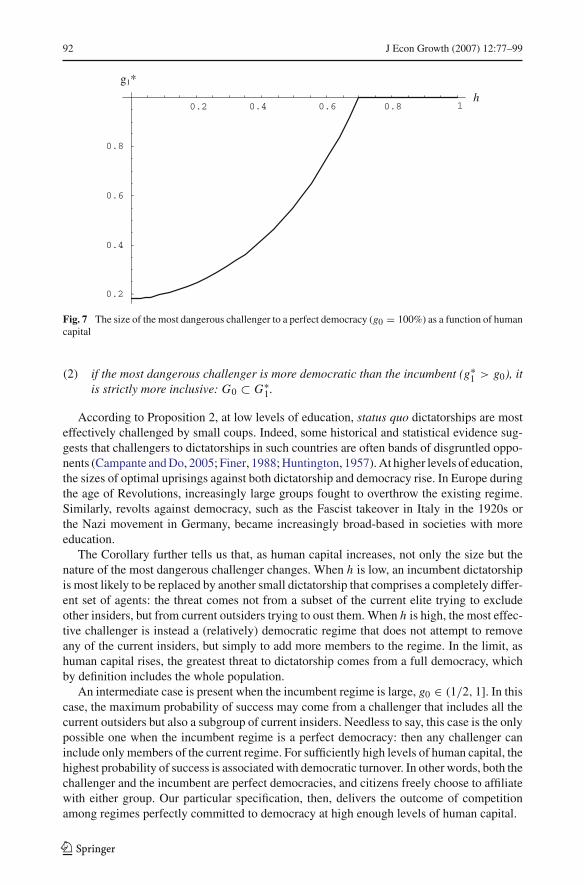
Fig. 7 The size of the most dangerous challenger to a perfect democracy (g0 = 100%) as a function of humancapital
(2) if the most dangerous challenger is more democratic than the incumbent (g∗1 > g0), it
is strictly more inclusive: G0 ⊂ G∗1.
According to Proposition 2, at low levels of education, status quo dictatorships are mosteffectively challenged by small coups. Indeed, some historical and statistical evidence sug-gests that challengers to dictatorships in such countries are often bands of disgruntled oppo-nents (Campante and Do, 2005; Finer, 1988; Huntington, 1957). At higher levels of education,the sizes of optimal uprisings against both dictatorship and democracy rise. In Europe duringthe age of Revolutions, increasingly large groups fought to overthrow the existing regime.Similarly, revolts against democracy, such as the Fascist takeover in Italy in the 1920s orthe Nazi movement in Germany, became increasingly broad-based in societies with moreeducation.
The Corollary further tells us that, as human capital increases, not only the size but thenature of the most dangerous challenger changes. When h is low, an incumbent dictatorshipis most likely to be replaced by another small dictatorship that comprises a completely differ-ent set of agents: the threat comes not from a subset of the current elite trying to excludeother insiders, but from current outsiders trying to oust them. When h is high, the most effec-tive challenger is instead a (relatively) democratic regime that does not attempt to removeany of the current insiders, but simply to add more members to the regime. In the limit, ashuman capital rises, the greatest threat to dictatorship comes from a full democracy, whichby definition includes the whole population.
An intermediate case is present when the incumbent regime is large, g0 ∈ (1/2, 1]. In thiscase, the maximum probability of success may come from a challenger that includes all thecurrent outsiders but also a subgroup of current insiders. Needless to say, this case is the onlypossible one when the incumbent regime is a perfect democracy: then any challenger caninclude only members of the current regime. For sufficiently high levels of human capital, thehighest probability of success is associated with democratic turnover. In other words, both thechallenger and the incumbent are perfect democracies, and citizens freely choose to affiliatewith either group. Our particular specification, then, delivers the outcome of competitionamong regimes perfectly committed to democracy at high enough levels of human capital.
123
J Econ Growth (2007) 12:77–99 93
4.3.2 Implications
The model provides one explanation for the empirical link between education and democracy,but also a further set of testable implications. It also suggests that, at low levels of educa-tion, the greatest threat to narrow regimes comes from other narrow regimes, such as smalluprisings and coups. In contrast, at higher levels of education, the greatest threat to narrowregimes comes from broader regimes, and democratic governments fall to other democraticgovernments. Some anecdotal evidence seems consistent with these implications.
Before 1600, European monarchies were relatively secure against broad-based uprising.Sporadic peasant revolts were generally crushed, and the real threat to a monarch usuallycame from a close relative offering an alternative monarchy. Starting with the Dutch revo-lution against Spain and the English revolution, monarchs were increasingly threatened bymore broadly based opposition groups. Notably, these two nations had unusually high levelsof education. In the late 18th and 19th centuries, France, Germany, and Italy all experiencedpopular uprisings as well, with large roles played by the more educated citizens. By 1920,monarchies had almost vanished in Europe, as the incumbency advantages of monarchs werewiped out in the aftermath of World War I. But it took another 25 years in Western Europeand another 70 years in Eastern Europe for democracy to become entrenched.
We can also look at history from the perspective of political stability. England was unstableuntil 1689, with often violent royal successions (De Long and Shleifer, 1993). Four Frenchregimes were toppled by popular revolts between 1789 and 1871, as the levels of educationwere growing. Similar instability was seen in Germany and elsewhere in the educated Europe.Once the transitions to democracy occurred, well educated democracies were themselves ini-tially unstable. At least at first glance, one sees similar patterns of instability of democracyin Latin America, the former Soviet Union, and other parts of the world.
Education also seems linked to the ability of democracies to defend themselves fromdictatorial coups. Popular uprisings during the less educated periods (England 1640, France1789, Russia 1917, and Germany 1920) were almost invariably followed by dictatorial take-overs. The educated supporters of democracy tried but failed to resist the dictators. As nationsbecame more educated, they also became more successful at defending democracy. In Francein the 1870s and 1880s, the Third Republic faced risks from both the monarchists and a pop-ular general such as Boulanger. However, unlike the coups of 1797 and 1851, when the twoNapoleons crushed their less organized opponents, in this later period a coalition of edu-cated democrats protected the republic. Such a defense of democracy was even more strikingin 1990, when educated Russians engaged in a remarkable campaign to stop an attemptedputsch.
In less educated times and places, coups are generally small affairs including only smallcadres of nobles or army officers (Campante and Do, 2005). As education grows, effectiveuprisings (like the American Revolution) became larger. Eventually, large swaths of societyare included in attempts to overthrow a regime. Even the Nazi takeover in Germany, whicheventually led to a dictatorship, succeeded only after the Nazis had built a broad coalition,including students and other educated Germans. Their earlier attempt at a narrow coup provedan embarrassing failure.
5 Conclusion
The correlation between education and democracy is clear. The reason for this correlation isnot. In this paper, we offer one explanation for the correlation.
123
94 J Econ Growth (2007) 12:77–99
Our explanation hinges on the connection between education and the costs and benefitsof political engagement. Schools socialize young people and political involvement is oneform of socialization; a variety of evidence shows a positive connection between educationand civic engagement. We model education as raising the benefits of political action whenindividuals choose to support a more or less democratic regime. In this model, democraticregimes offer weak incentives to a wide base of potential supporters, while dictatorshipsoffer strong incentives to a narrower base. Education increases the society-wide support fordemocracy because democracy relies on people with high participation benefits for its sup-port. We show that better educated nations are more likely both to preserve democracy andto protect it from coups.
The analysis raises three broader questions that are worth mentioning in conclusion. First,while our model has focused on the effects of education on participation, the analysis appliesto all social glue that encourages collective action. For example, the analysis might suggestthat ethnic homogeneity is good for democracy (although in cross-country or panel regres-sions with education controls, ethnic heterogeneity does not matter for democracy). Thissurely seems plausible, and remains to be explored. Perhaps as interestingly, the analysissuggests a solution of Olson’s free-rider problem in all organizations, and not just in politicalregimes, namely human capital or other social glue as a motivation to participate.
Second, our analysis runs into the old puzzle, namely why do some dictators invest ineducation if they know that doing so eventually dooms them? The examples of fallen dicta-tors in East Asia, Eastern Europe, and the former Soviet Union are telling reminders of thisrisk. There are several possible answers. One is that many dictators face an external threat,and therefore must grow their economies and their armies (including investing in humancapital) to counter these threats even if this raises the risk of democratization. A second isthat even selfish dictators unconcerned with external threats might derive income from eco-nomic growth, and therefore promote education to get richer. A third idea is that all dictatorsface significant ouster risks, and that it is much better for the dictator’s life for him to bereplaced by a democracy in an educated country than by another dictator in an uneducatedone. A symmetrical point, of course, is that democracies have an extra incentive to invest ineducation in order to secure and stabilize themselves against oligarchic coups.
Third, our analysis deals with the size of the most productive coalitions in politics, butLemma 1 applies to organizations and groups more broadly. The results suggest, then, thathigher human capital societies can more efficiently maintain larger organizations in whichboth top-down and peer-provided incentives play a role. Whether this prediction is true aboutfirms and other institutions and groups remains a question for further research.
Acknowledgements Glaeser thanks the Taubman Center for State and Local Government. Ponzetto thanksthe Marco Fanno and the Mario Gasbarri Foundations. We are grateful to Timothy Besley, Filipe Campante,Ruben Enikolopov, Oded Galor, Nicola Gennaioli, Elhanan Helpman, Elias Papaiouannou, Richard Posner,Joshua Schwartzstein, Sidney Verba, and two anonymous referees for comments, and to Joshua Gottlieb foroutstanding research assistance.
Appendix: Proofs
A. 1 Proof of Lemma 1
For ease of notation, we omit the subscript i denoting group-specific parameters in the anal-ysis of group equilibrium. A group equilibrium is a root of the auxiliary function
Q (a; g, h) ≡ F (p (g) + b (ah)) − a
123
J Econ Growth (2007) 12:77–99 95
which is twice continuously differentiable with respect to a, because so are b and F . Omittingarguments for the sake of brevity, the first derivative is
Qa = h f b′ − 1
and the second is
Qaa = h2[
f ′ (b′)2 + f b′′] < 0
whose sign follows from Assumption 2.Assumption 1 implies furthermore that
Q (0; g, h) = F (p (g)) > 0
Q (1; g, h) = F (p (g) + b (h)) − 1 < 0
and therefore by continuity there exists at least one root a ∈ (0, 1).Moreover, Q (0; g, h) > 0 implies that at the first root Qa
(a; g, h
)< 0. Concavity then
implies Qa (a; g, h) < 0∀a ≥ a, which implies that the root a is unique. The condition
Q(a; g, h
) = 0 ⇒ Qa(a; g, h
)< 0
can also be interpreted as showing the stability of the group equilibrium.By the implicit-function theorem, equilibrium participation is a differentiable function
a (g, h) such that Q (a (g, h) ; g, h) = 0. Since
Qg = f p′ < 0
Qh = a f b′ > 0
its gradient is
∂a
∂g= − Qg
Qa= f p′
1 − h f b′ < 0
∂a
∂h= − Qh
Qa= a f b′
1 − h f b′ > 0
recalling that Qa < 0 in equilibrium.
A. 2 Proof of Proposition 1
The implicit-function theorem also allows us to compute higher-order derivatives, and amongthese
∂2a
∂g∂h= − Q2
a Qgh − Qh Qa Qga − Qg Qa Qha + Qg Qh Qaa
Q3a
where
Qgh = a f ′ p′b′ ≥ 0
Qga = h f ′ p′b′ ≥ 0
Qha = f b′ + ah f ′ (b′)2 + ah f b′′
123
96 J Econ Growth (2007) 12:77–99
Therefore,
∂2 log a
∂g∂h= 1
a2
(a
∂2a
∂g∂h− ∂a
∂g
∂a
∂h
)
= − 1
a2 Q3a
[a
(Q2
a Qgh − Qh Qa Qga − Qg Qa Qha + Qg Qh Qaa) + Qg Qh Qa
]
= − 1
a2 Q3a
{aQa
(Qa Qgh − Qh Qga
) + Qg [a (Qh Qaa − Qa Qha) + Qh Qa]}
= 1
a2 (1 − h f b′)3
{(1 − h f b′) a2 f ′ p′b′ + a2h f p′ [ f ′ (b′)2 + f b′′]}
= p′ ( f ′b′ + h f 2b′′)
(1 − h f b′)3 > 0
Let ai = a (gi , h): the probability of victory for regime G1 over regime G0 is
π = Z
(g1a1
g0a0
)= Z (exp {log g1 − log g0 + log a1 − log a0})
so that
∂π
∂h= z
(g1a1
g0a0
)elog g1−log g0+log a1−log a0
(∂ log a1
∂h− ∂ log a0
∂h
)
and thus
dπ
dh> 0 ⇔ g1 > g0
A. 3 Proof of Proposition 2 and Corollary 1
Recall that the probability of success of a challenger is
π = Z
((g1 − γ
2
)a (g1, h)
(g0 − γ
2
)a (g0, h)
)
so that the challenger that is most likely to succeed is the maximizer of
M (g1, γ ; g0, h) ≡ log a (g1, h) + log(
g1 − γ
2
)− log
(g0 − γ
2
)
subject to
g1 ∈ [0, 1] and γ ∈ [max {0, g1 − (1 − g0)} , min {g0, g1}]To begin with, since
∂ M
∂γ� 0 ⇔ g1 � g0
the optimal value of γ is indefinite if g1 = g0 and it lies in a corner if g1 �= g0.Hence the optimal regime size is
g∗1 (g0, h) = arg max
g1∈[0,1]{log a (g1, h) + λ (g1, g0)}
where λ (g1, g0) is defined by the jointly optimal choice of overlap γ .
123
J Econ Growth (2007) 12:77–99 97
There are two different cases based on the size of the incumbent G0: small g0 ∈ (0, 1
2
]or
large g0 ∈ ( 12 , 1
]. The first will only have two potential corner solutions for optimal overlap:
γ = 0 and γ = g0; the latter will also have the possibility of γ = g1 − (1 − g0) > 0.
1. If g0 ∈ (0, 1
2
]the optimal overlap is
γ (g1) =⎧⎨
⎩
0 g1 ∈ [0, g0)
[0, g0] g1 = g0
g0 g1 ∈ (g0, 1]
and therefore
λ (g1, g0) ={
log g1 − log g0 g1 ∈ [0, g0]log
(g1 − g0
2
) − log g02 g1 ∈ [g0, 1]
a continuous function that is monotone increasing in g1 and piecewise concave in g1 forg1 ∈ [0, g0] and g1 ∈ [g0, 1], but with a convex kink at g1 = g0
2. If g0 ∈ ( 12 , 1
]the optimal overlap is
γ (g1) =
⎧⎪⎪⎨
⎪⎪⎩
0 g1 ∈ [0, 1 − g0]g1 − (1 − g0) g1 ∈ [1 − g0, g0)
[2g0 − 1, g0] g1 = g0
g0 g1 ∈ (g0, 1]
and therefore
λ (g1, g0) =⎧⎨
⎩
log g1 − log g0 g1 ∈ [0, 1 − g0]log g1−g0+1
2 − log g0−g1+12 g1 ∈ [1 − g0, g0]
log(g1 − g0
2
) − log g02 g1 ∈ [g0, 1]
a continuous function that is monotone increasing in g1 and piecewise concave in g1 forg1 ∈ [0, g0] and g1 ∈ [g0, 1], but with a convex kink at g1 = g0 and a concave kink atg1 = 1 − g0.
Given any g0 ∈ (0, 1], g∗1 (g0, h) ∈ (0, 1] is well-defined as the maximand of a continuous
function on a compact. Consider two levels of human capital hL < h H . Suppose that
g∗L ≡ g∗
1 (g0, hL) > g∗1 (g0, h H ) ≡ g∗
H
This implies by definition that{
log a(g∗
L , hL) + λ
(g∗
L , g0) ≥ log a
(g∗
H , hL) + λ
(g∗
H , g0)
log a(g∗
H , h H) + λ
(g∗
H , g0) ≥ log a
(g∗
L , h H) + λ
(g∗
L , g0)
and therefore rearranging
log a(g∗
L , hL)−log a
(g∗
H , hL)≥λ
(g∗
H , g0)−λ
(g∗
L , g0)≥ log a
(g∗
L , h H)−log a
(g∗
H , h H)
and finally
log a(g∗
H , h H) − log a
(g∗
H , hL) ≥ log a
(g∗
L , h H) − log a
(g∗
L , hL)
But in the proof of Proposition 1 we established that
∂2 log a
∂g∂h> 0
which proves by contradiction that
hL < h H ⇒ g∗1 (g0, hL) ≤ g∗
1 (g0, h H )
123
98 J Econ Growth (2007) 12:77–99
References
Acemoglu, D., Johnson, S., Robinson, J., & Yared, P. (2005). From education to democracy. AmericanEconomic Review Papers and Proceedings, 95, 44–49.
Almond, G., & Verba, S. (1989, 1st ed. 1963). The civic culture: Political attitudes and democracy in fivenations. London: Sage Publications.
Arellano, M., & Bond, S. (1991). Some tests of specification for panel data: Monte Carlo evidence and anapplication to employment equations. The Review of Economic Studies, 58, 277–297.
Barro, R. (1997). Determinants of economic growth. Cambridge, MA: MIT Press.Barro, R. (1999). Determinants of democracy. Journal of Political Economy, 107, 158–183.Barro, R., & Lee, J.-W. (2001). International data on educational attainment: Updates and implications. Oxford
Economic Papers, 53, 541–563.Blundell, R., & Bond, S. (1998). Initial conditions and moment restrictions in dynamic panel data models.
Journal of Econometrics, 87, 115–143.Bobba, M., & Coviello, D. (2006). Weak instruments and weak identification in estimating the effects of
education on democracy. Economics Letters (forthcoming).Boix, C., & Stokes, S. (2003), Endogenous democratization. World Politics, 55, 517–549.Bourguignon, F., & Verdier, T. (2000). Oligarchy, democracy, inequality, and growth. Journal of Development
Economics, 62, 285–313.Bowles, S., & Gintis, H. (1976). Schooling in capitalist America: Educational reform and the contradictions
of capitalist life. New York: Basic Books.Brady, H., Verba, S., & Schlozman, K. L. (1995). Beyond SES: A resource model of political participation.
American Political Science Review, 89, 271–294.Campante, F., & Do, Q.-A. (2005). Inequality, redistribution, and population. Mimeo, Harvard University.Castello-Climent, A. (2006). On the distribution of education and democracy. Working Paper 0602, Institute
of International Economics, University of Valencia.Cooper, R., & John, A. (1988). Coordinating coordination failures in Keynesian models. Quarterly Journal
of Economics, 103, 441–465.Costa, D., & Kahn, M. (2003). Cowards and heroes: Group loyalty in the American civil war. Quarterly
Journal of Economics, 118, 519–548.Dee, T. (2004). Are there civic returns to education? Journal of Public Economics, 88, 1697–1720.De Long, B., & Shleifer, A. (1993). Princes and merchants: European city growth before the industrial revo-
lution. Journal of Law and Economics, 36, 671–702.DiPasquale, D., & Glaeser, E. (1999). Incentive and social capital: Are homeowners better citizens? Journal
of Urban Economics, 45, 354–384.Driscoll, A., & Nagel, N. (2005). Early childhood education birth to 8: The world of children, families and
educators (3rd ed.). Boston: Pearson Education.Ferguson, N. (1999). The pity of war. New York: Basic Books.Finer, S. (1988). The man on horseback: The role of the military in politics. Boulder, Colorado: Westview
Press.Glaeser, E., LaPorta, R., Lopez-de-Silanes, F., and Shleifer, A. (2004). Do institutions cause growth? Journal
of Economic Growth, 9, 271–303.Glaeser, E., & Sacerdote, B. (2001). Education and religion, NBER Working Paper.Gordon, A., & Browne, K. (2004). Beginnings and beyond: Foundations in early childhood education (6th
ed.). Clifton Park, NY: Thomson Delmar Learning.Gradstein, M., & Justman, M. (2002). Education, social cohesion, and economic growth. American Economic
Review, 92, 1192–1204.Hanson, V. (2001). Carnage and Culture: Landmark battles in the rise of Western power. New York: Double-
day.Helliwell, J., & Putnam, R. (2007). Education and social capital. Eastern Economics Journal (forthcoming).Holmes, B. (1979). International guide to education systems. Paris: UNESCO.Huntington, S. (1957). The soldier and the state: The theory and politics of civil–military relations. Cambridge,
Massachusetts: Harvard University Press.Huntington, S. (1991). The third wave: Democratization in the late twentieth century. Norman, OK: University
of Oklahoma Press.Jaggers, K., & Marshall, M. (2003). Polity IV project. Center for International Development and Conflict
Management, University of Maryland.Kamens, D. (1988). Education and democracy: A comparative institutional analysis. Sociology of Education,
61, 114–127.Keegan, J. (1976). The face of battle. New York: Viking Press.
123
J Econ Growth (2007) 12:77–99 99
Lipset, S. M. (1959). Some social requisites for democracy: Economic development and political legitimacy.American Political Science Review, 53, 69–105.
Lipset, S. M. (1960). Political man: The social basis of modern politics. New York: Doubleday.Milligan, K., Moretti, E., & Oreopoulous, P. (2004). Does education improve citizenship? Evidence from the
U.S. and the U.K. Journal of Public Economics, 88, 1667–1695.Mulligan, C., Gil, R., & Sala-i-Martin, X. (2004). Do democracies have different public policies than non-
democracies? Journal of Economic Perspectives, 18, 51–74.Mulligan, C., & Shleifer, A. (2005). The extent of the market and the supply of regulation. Quarterly Journal
of Economics, 120, 1445–1473.Olson, M. (1965). The logic of collective action: Public goods and the theory of groups. Cambridge, Massa-
chusetts: Harvard University Press.Papaioannou, E., & Siourounis, G. (2005). Economic and social factors driving the third wave of democrati-
zation. Mimeo, London Business School.Przeworski, A., & Limongi, F. (1993). Political regimes and economic growth. Journal of Economic Perspec-
tives, 7, 51–70.Przeworski, A., Alvarez, M., Cheibub, J., & Limongi, F. (2000). Democracy and development: Political insti-
tutions and well-being in the world, 1950–1990. Cambridge: Cambridge University Press.Rander-Pehrson, J. D. (1999). Germany and the revolution of 1848–1849. New York: Peter Lang.
123