why do we make mistakes in morphological diagnosis how … burthem am 2014... · why do we make...
TRANSCRIPT

Why do we make mistakes in morphological diagnosis – how can
we improve?
Michelle Brereton & John Burthem Manchester, UK

UK NEQAS(H) DM scheme
1. Select up to 5 significant morphological features from a defined list 2. Place these in priority order 1-5 3. Answer multiple choice question : “what would I do next?” 4. Offer free text opinion generally: “what is your preferred diagnosis?”
But some people get the answers wrong!
Are we really helping this group sufficiently? Do we really know why they get things wrong?

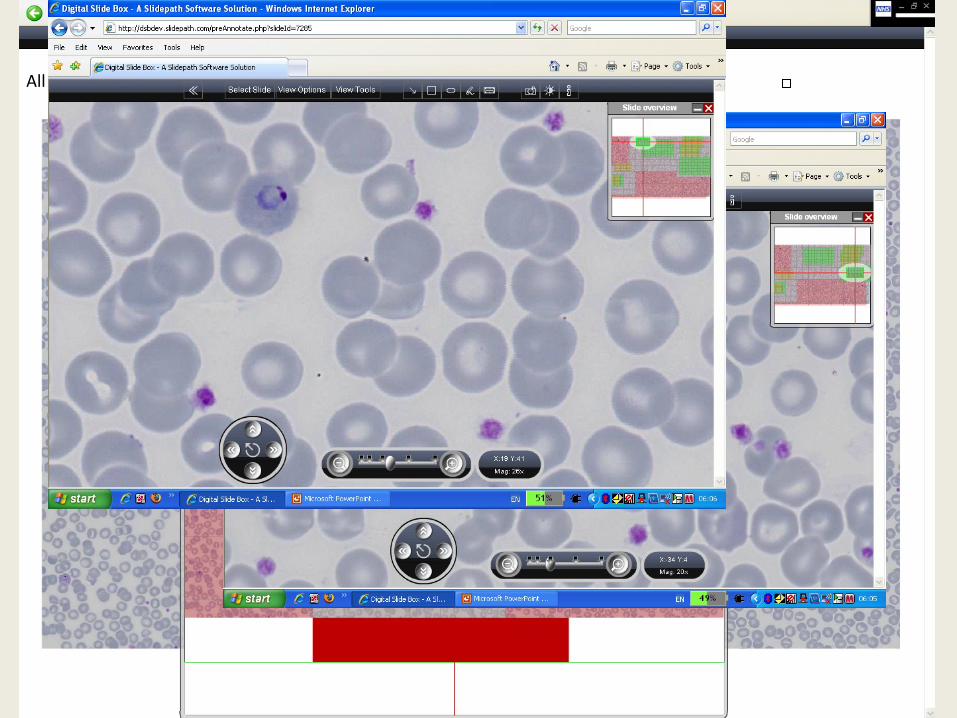
Analysing morphology is more complex than we think
14/320
4000
20000
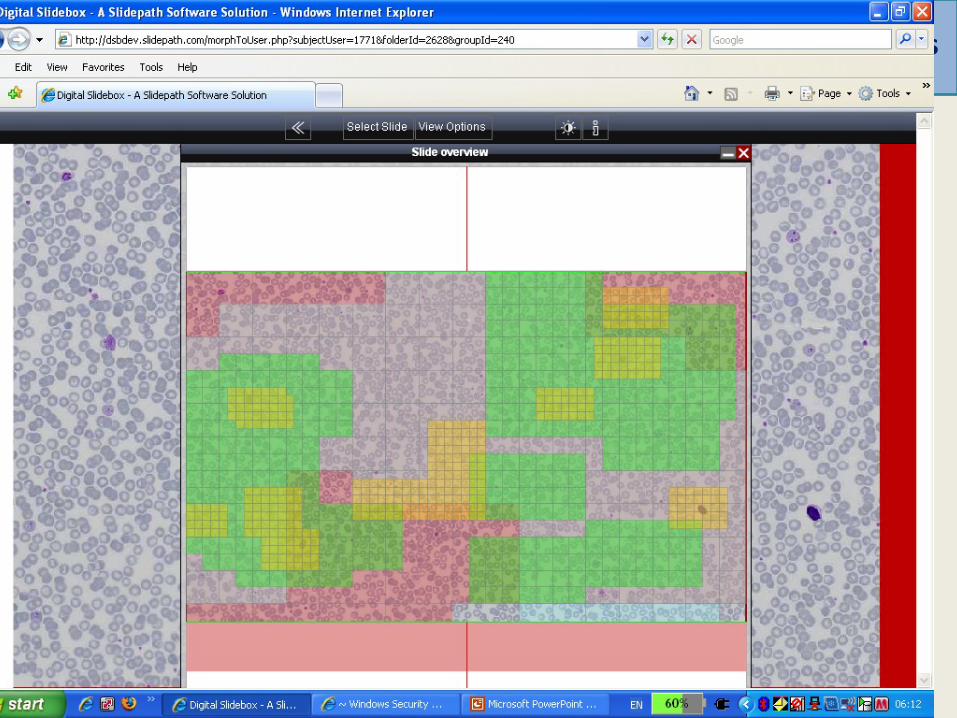
To understand why this is we need to look at the process of diagnosis
All parasite forms seen, diagnosis: P.vivax
1.
2.

Can we analyse our data to see why we arrive at incorrect answers?

The Heuristic Approach: “Fast and Frugal”
A model to understand how people arrive at a morphological opinion
1. Familiarity/unfamiliarity 2. Recognition 3. Classification 4. Reinforcement 5. Priority assignment 6. Interpretation 7. Action

We all use these approaches (1) .......
Familiarity Recognition Classification
Reinforcement Priority assignment Interpretation
A simple case
Action
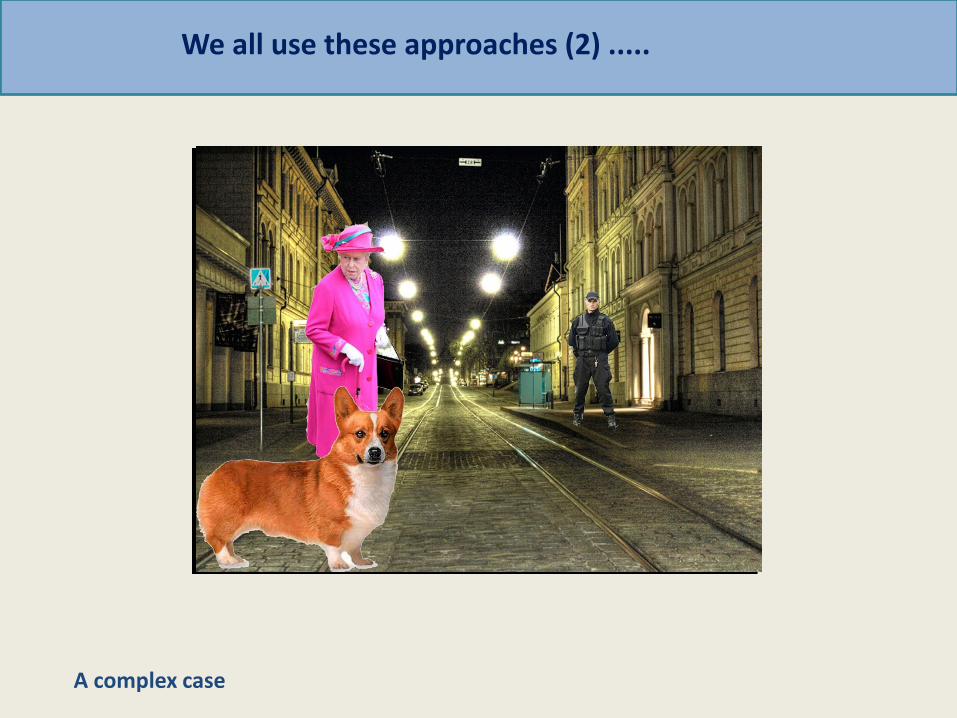
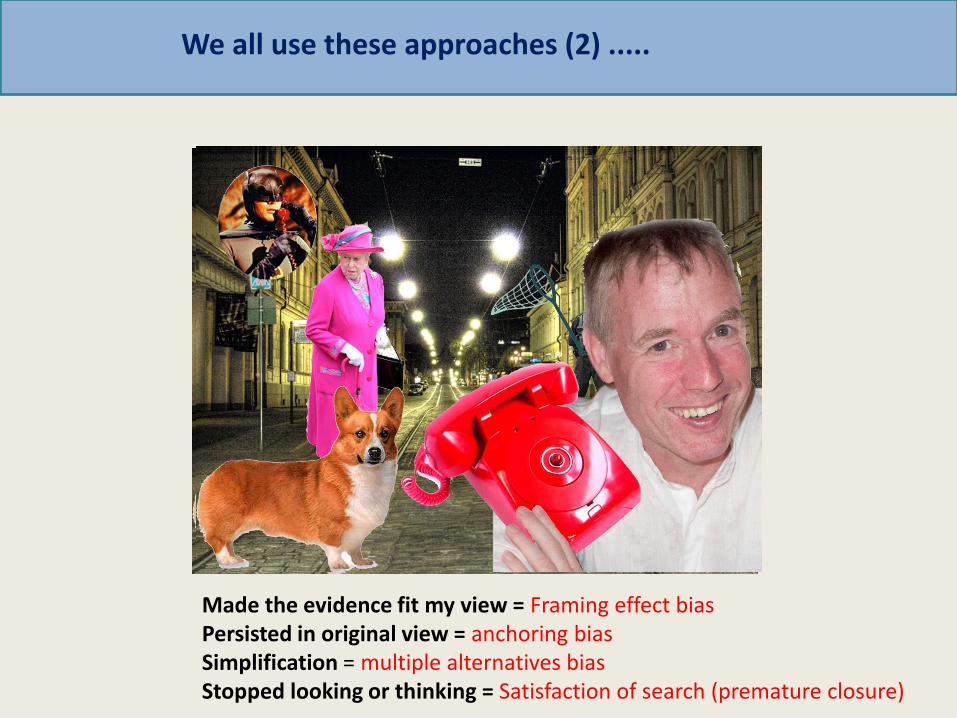
We all use these approaches (2) .....
Familiarity Recognition Classification Reinforcement Prioritisation 1
Reinforcement Prioritisation 2 Interpretation
Action
A complex case
We all use these approaches (2) .....
Familiarity Recognition Classification Reinforcement Prioritisation 1
Reinforcement Prioritisation 2
Made the evidence fit my view = Framing effect bias Persisted in original view = anchoring bias Simplification = multiple alternatives bias Stopped looking or thinking = Satisfaction of search (premature closure)

Heuristic approaches can introduce major sources of bias!
CASE 1 and 2 Simple cases

CASE 1 Inherited Pelger Huet anomaly Overview of features
A routine pre-operative blood sample reveals these features on the film.
Preferred answer: 1. Pelger cells +/- other normal features 2. Pelger cells ranked most important 3. Action: low priority action 4. Diagnosis: Pelger Huet anomaly
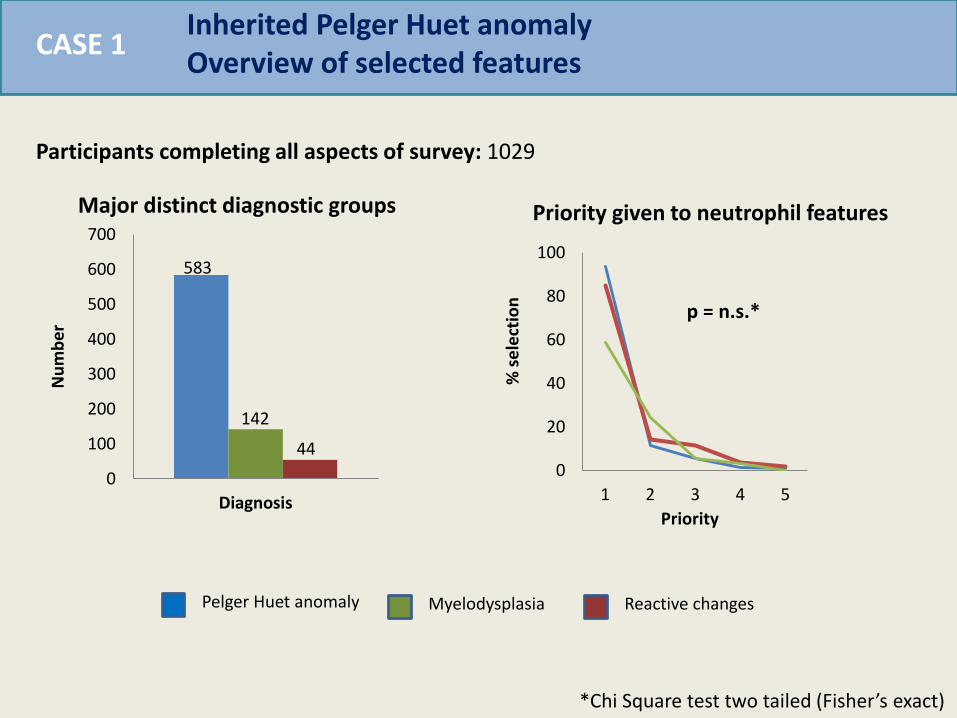
CASE 1 Inherited Pelger Huet anomaly Overview of selected features
Participants completing all aspects of survey: 1029
Pelger Huet anomaly Myelodysplasia Reactive changes
0
100
200
300
400
500
600
700
Diagnosis
Nu
mb
er
Major distinct diagnostic groups
583
142
44
*Chi Square test two tailed (Fisher’s exact)
0
20
40
60
80
100
1 2 3 4 5
Priority %
se
lect
ion
Priority given to neutrophil features
p = n.s.*
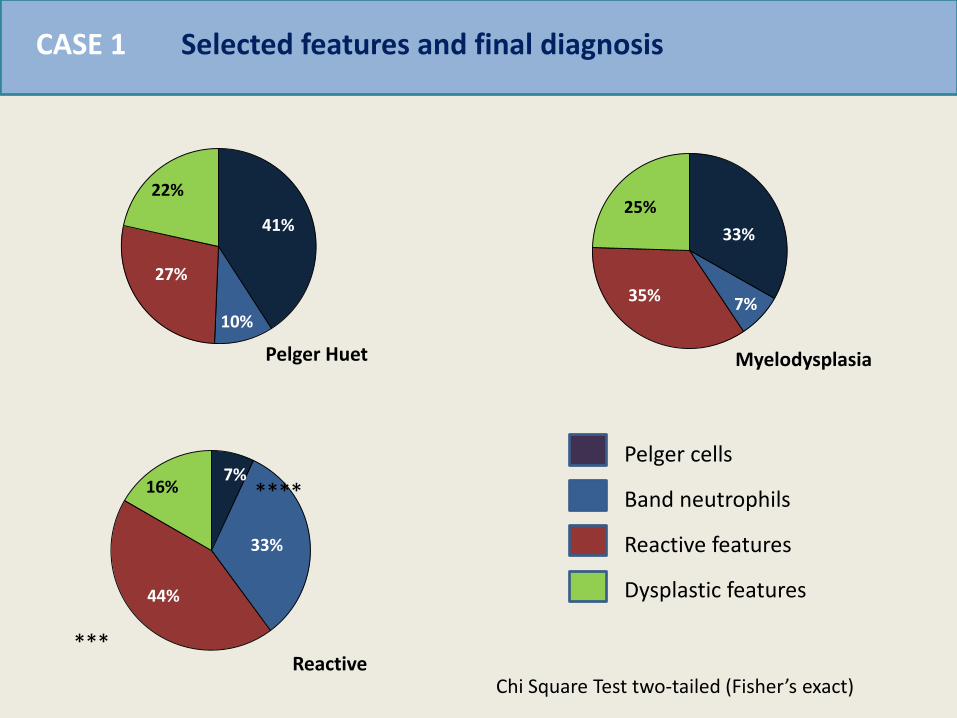
Selected features and final diagnosis CASE 1
33%
7% 35%
25% 41%
10%
27%
22%
7%
33%
44%
16%
Pelger Huet Myelodysplasia
Reactive
Pelger cells
Band neutrophils
Reactive features
Dysplastic features
****
Chi Square Test two-tailed (Fisher’s exact)
***
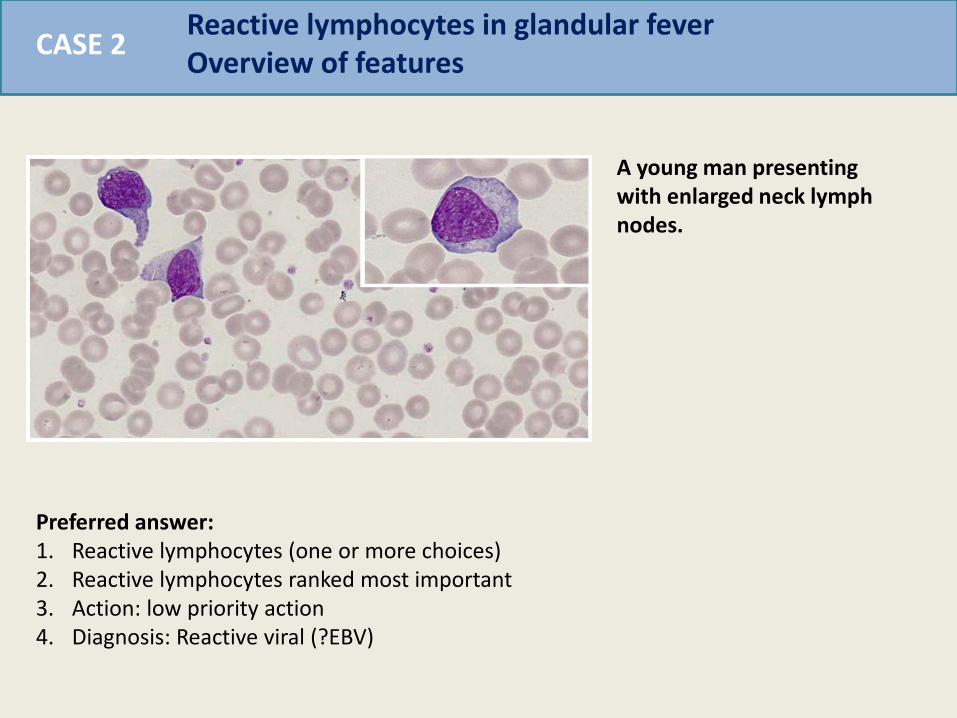
CASE 2 Reactive lymphocytes in glandular fever Overview of features
A young man presenting with enlarged neck lymph nodes.
Preferred answer: 1. Reactive lymphocytes (one or more choices) 2. Reactive lymphocytes ranked most important 3. Action: low priority action 4. Diagnosis: Reactive viral (?EBV)
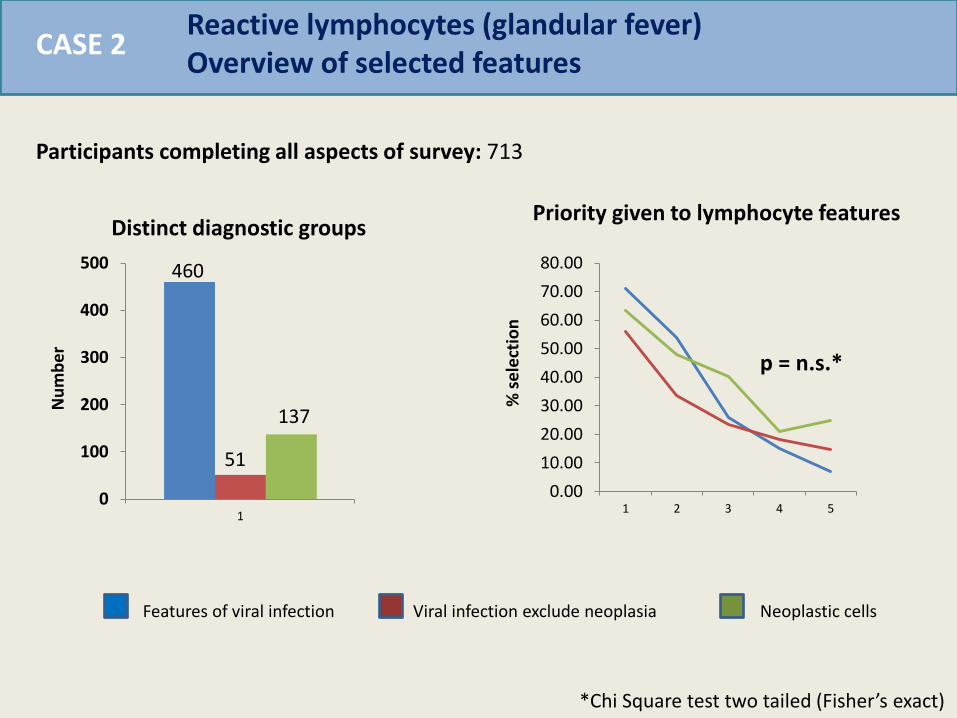
CASE 2 Reactive lymphocytes (glandular fever) Overview of selected features
Participants completing all aspects of survey: 713
Features of viral infection Viral infection exclude neoplasia Neoplastic cells
0
100
200
300
400
500
1
Distinct diagnostic groups
460
51
137
0.00
10.00
20.00
30.00
40.00
50.00
60.00
70.00
80.00
1 2 3 4 5
Nu
mb
er
% s
ele
ctio
n
p = n.s.*
*Chi Square test two tailed (Fisher’s exact)
Priority given to lymphocyte features
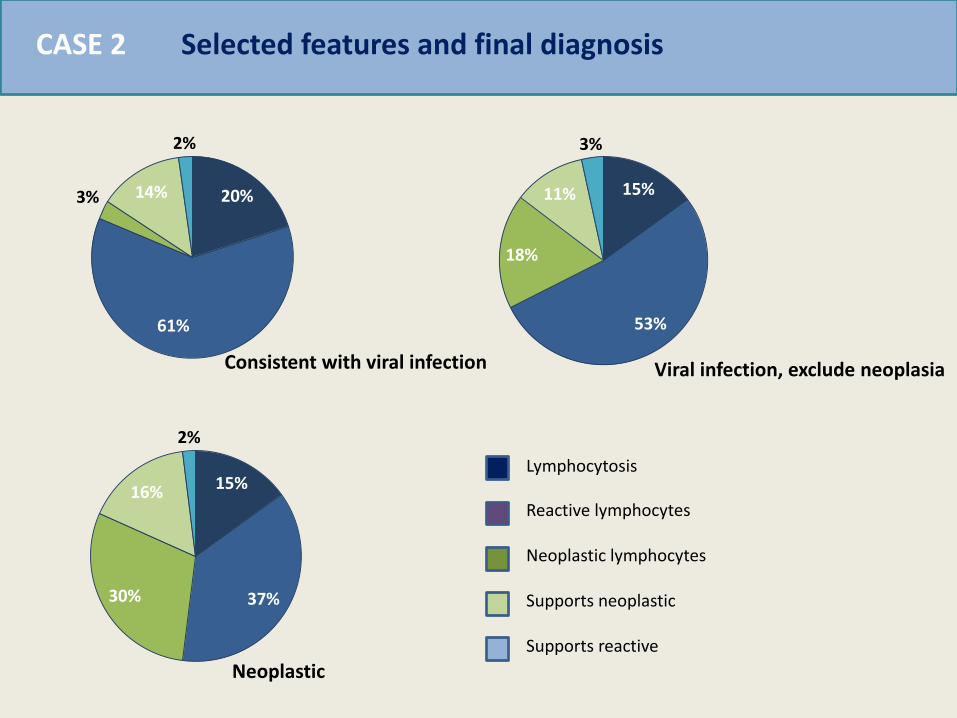
CASE 2 Selected features and final diagnosis
20%
61%
3% 14%
2%
15%
53%
18%
11%
3%
15%
37% 30%
16%
2%
Lymphocytosis
Reactive lymphocytes
Neoplastic lymphocytes
Supports neoplastic
Supports reactive
Consistent with viral infection Viral infection, exclude neoplasia
Neoplastic
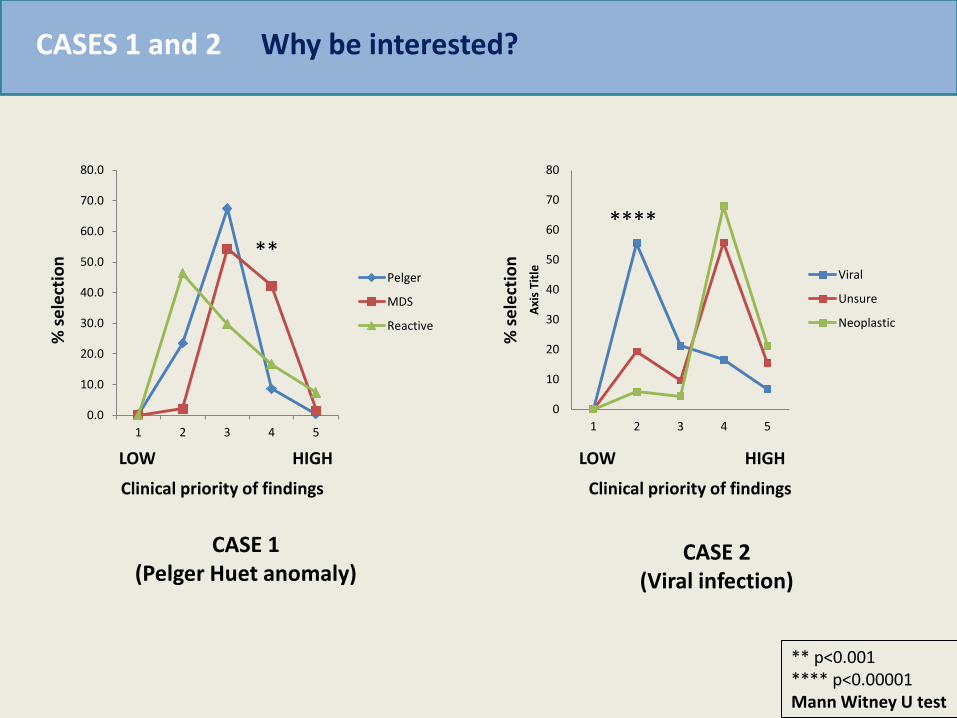
Why be interested? CASES 1 and 2 %
se
lect
ion
Clinical priority of findings
HIGH LOW
CASE 1 (Pelger Huet anomaly)
CASE 2 (Viral infection)
Clinical priority of findings
HIGH LOW
% s
ele
ctio
n
0
10
20
30
40
50
60
70
80
1 2 3 4 5
Axi
s Ti
tle
Viral
Unsure
Neoplastic
****
**
** p<0.001 **** p<0.00001 Mann Witney U test
0.0
10.0
20.0
30.0
40.0
50.0
60.0
70.0
80.0
1 2 3 4 5
Pelger
MDS
Reactive

Principle sources of error CASES 1 and 2
Analysis Familiarity, recognition and prioritisation: well completed irrespective of diagnosis MAJOR ERROR SOURCE: Classification: recognising the abnormal cell Substantial contributions: Framing effect (overstating supportive features) Anchorage (ignoring lack of support)
In these cases interpretation depended predominantly on accurate assessment of a single abnormal cell
NOTE The highly significant effect on action/outcome

CASE 3 Complex morphology unifying diagnosis

CASE 3 Microangiopathic haemolysis (TTP) with acute viral infection (HIV)
A patient attending an evening clinic is unwell
Preferred answer: 1. Thrombocytopenia, Fragmentation features, general haemolyisis features 2. Thrombocytopenia and fragmentation ranked most important, reactive lymphocytes
recorded 3. Action: High priority action 4. Diagnosis: Microangiopathic haemolysis +/- viral infection

Feature choice Feature priority
0.00
1.00
2.00
3.00
4.00
5.00
6.00
Lowplatelets
Fragments Haemolysis Reactivelymphs
Thrombotic thrombocytopenic purpura with acute HIV Overview of selected features
19%
19%
32%
11%
19% Thrombocytopenia
Fragmentation
Other haemolytic features
Reactive lymphocytes
Other selections
Preferred diagnosis: Microangiopathic haemolysis (MAHA) 381 (51%)
MAHA and viral illness 125 (16%)
Haemolysis unspecified 155 (21%)
CASE 3
Participants completing all aspects of survey: 751
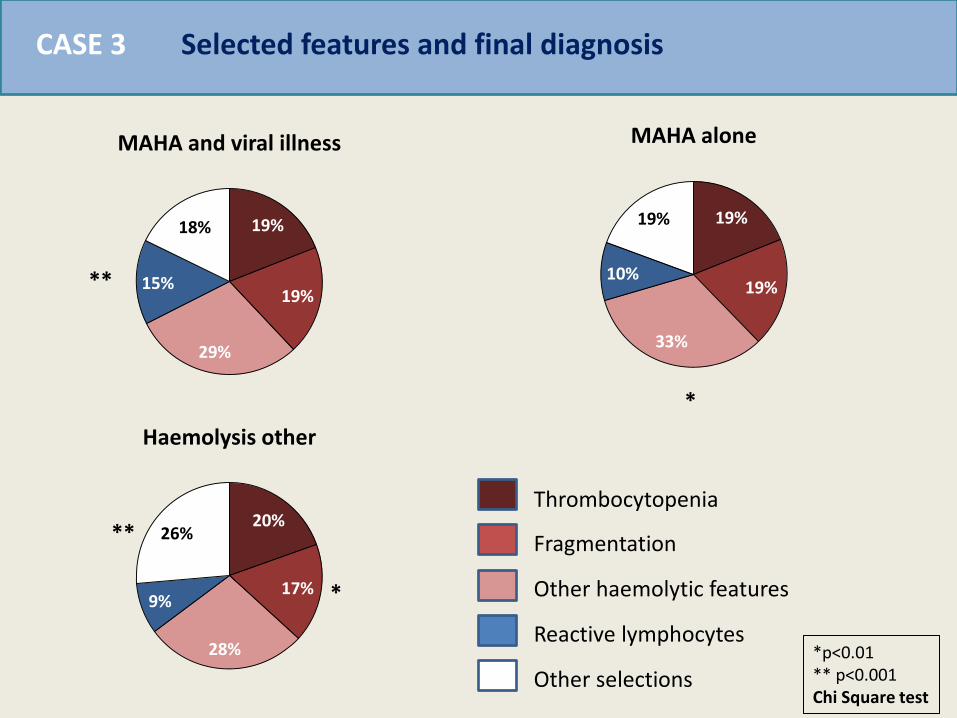
19%
19%
29%
15%
18%
MAHA and viral illness
19%
19%
33%
10%
19%
MAHA alone
20%
17%
28%
9%
26%
Haemolysis other
Thrombocytopenia
Fragmentation
Other haemolytic features
Reactive lymphocytes
Other selections
Selected features and final diagnosis
*
*
**
**
*p<0.01 ** p<0.001 Chi Square test
CASE 3
0.0
10.0
20.0
30.0
40.0
50.0
60.0
70.0
1 2 3 4 5
Axi
s Ti
tle
0.0
10.0
20.0
30.0
40.0
50.0
60.0
70.0
1 2 3 4 5
Axi
s Ti
tle
0.0
10.0
20.0
30.0
40.0
50.0
60.0
70.0
1 2 3 4 5
Axi
s Ti
tle
0.0
10.0
20.0
30.0
40.0
50.0
60.0
70.0
1 2 3 4 5
Axi
s Ti
tle
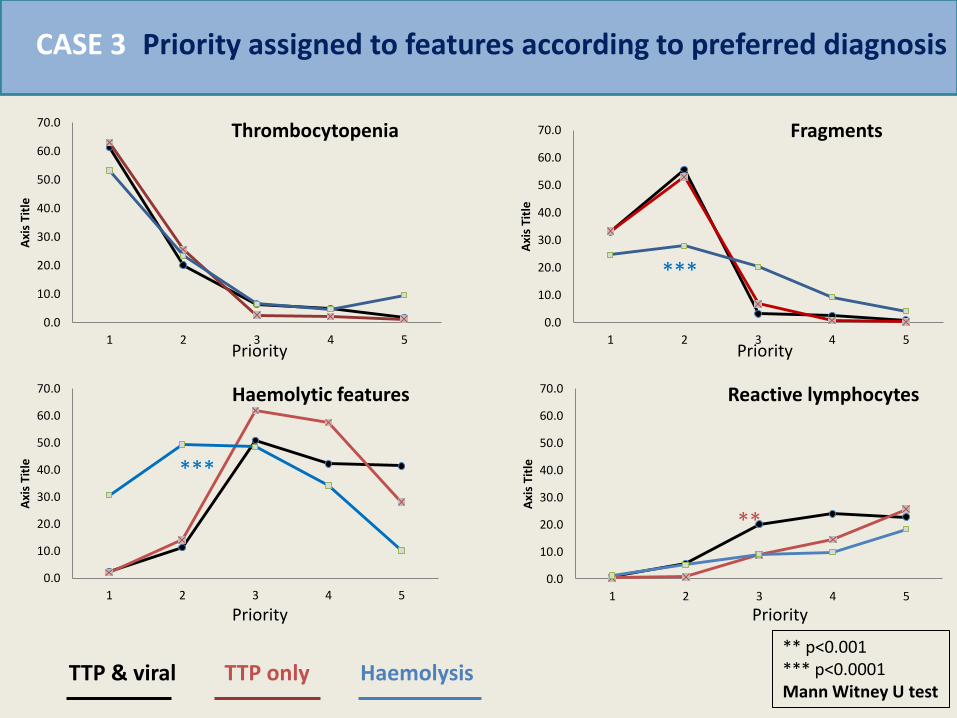
***
***
**
** p<0.001 *** p<0.0001 Mann Witney U test
Priority assigned to features according to preferred diagnosis
Priority Priority
Priority Priority
TTP & viral TTP only Haemolysis
Thrombocytopenia Fragments
Haemolytic features Reactive lymphocytes
CASE 3
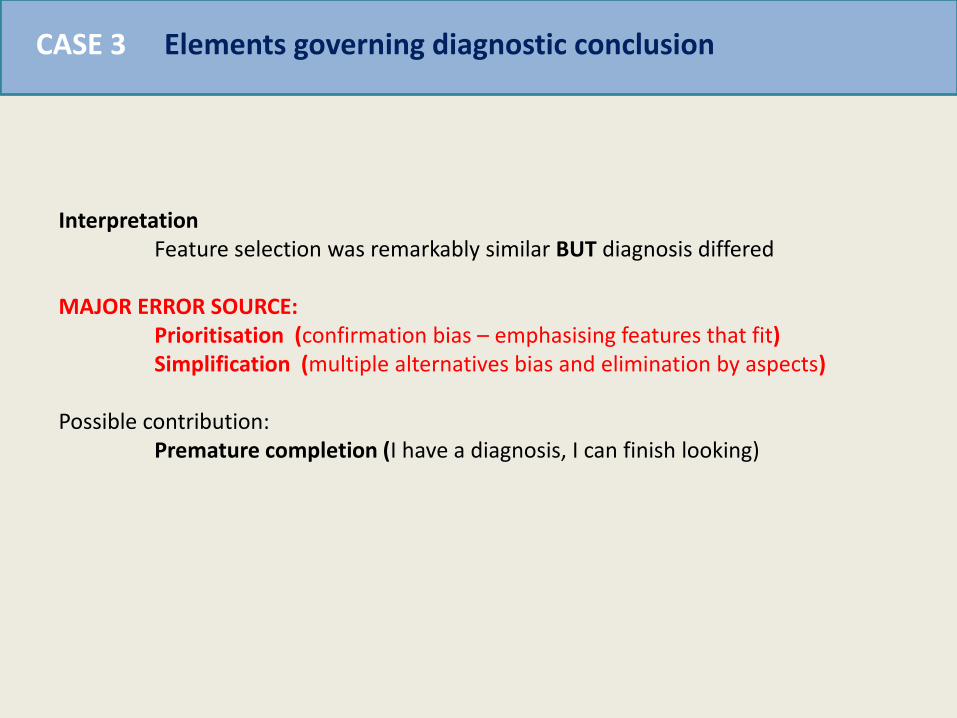
Elements governing diagnostic conclusion CASE 3
Interpretation Feature selection was remarkably similar BUT diagnosis differed MAJOR ERROR SOURCE: Prioritisation (confirmation bias – emphasising features that fit) Simplification (multiple alternatives bias and elimination by aspects) Possible contribution: Premature completion (I have a diagnosis, I can finish looking)

CASE 4 Complex case – dual pathology
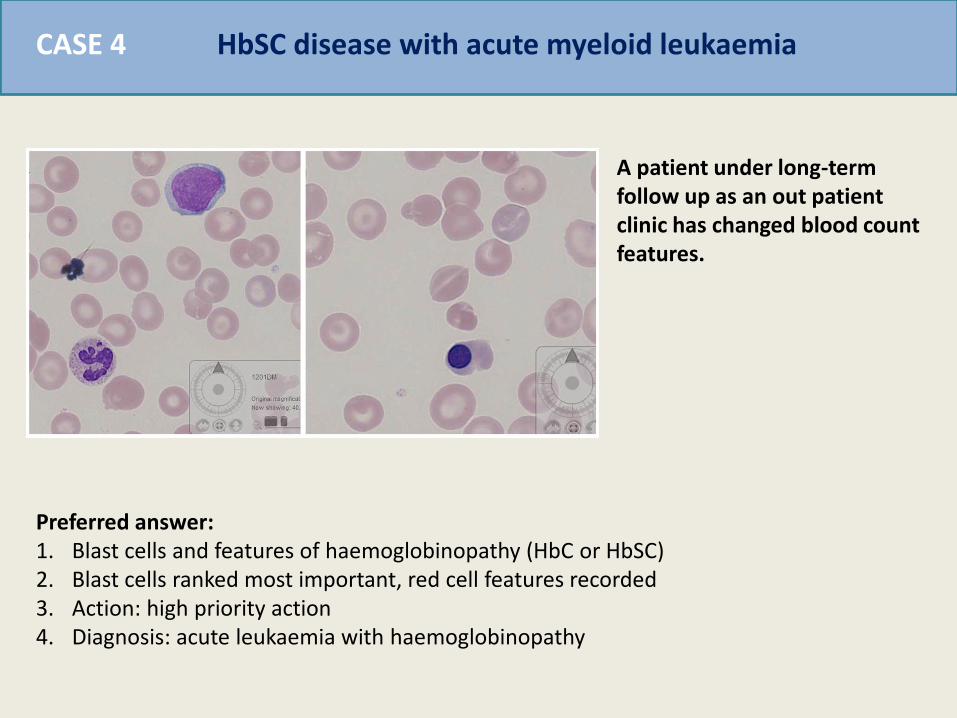
HbSC disease with acute myeloid leukaemia CASE 4
A patient under long-term follow up as an out patient clinic has changed blood count features.
Preferred answer: 1. Blast cells and features of haemoglobinopathy (HbC or HbSC) 2. Blast cells ranked most important, red cell features recorded 3. Action: high priority action 4. Diagnosis: acute leukaemia with haemoglobinopathy
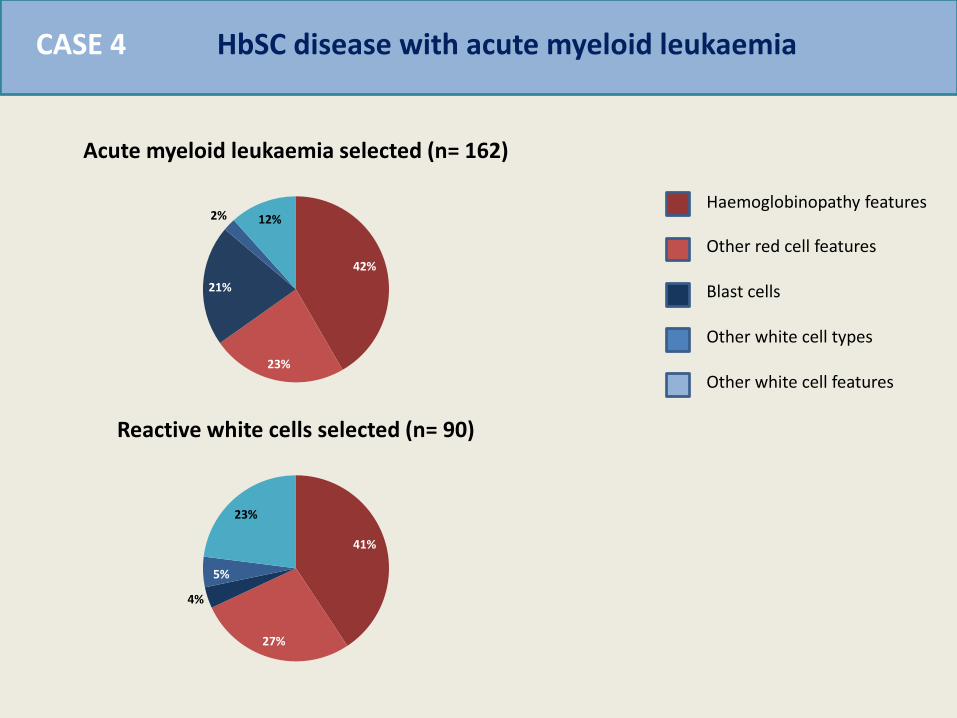
HbSC disease with acute myeloid leukaemia CASE 4
42%
23%
21%
2% 12%
Acute myeloid leukaemia selected (n= 162)
41%
27%
4%
5%
23%
Reactive white cells selected (n= 90)
Haemoglobinopathy features
Other red cell features
Blast cells
Other white cell types
Other white cell features
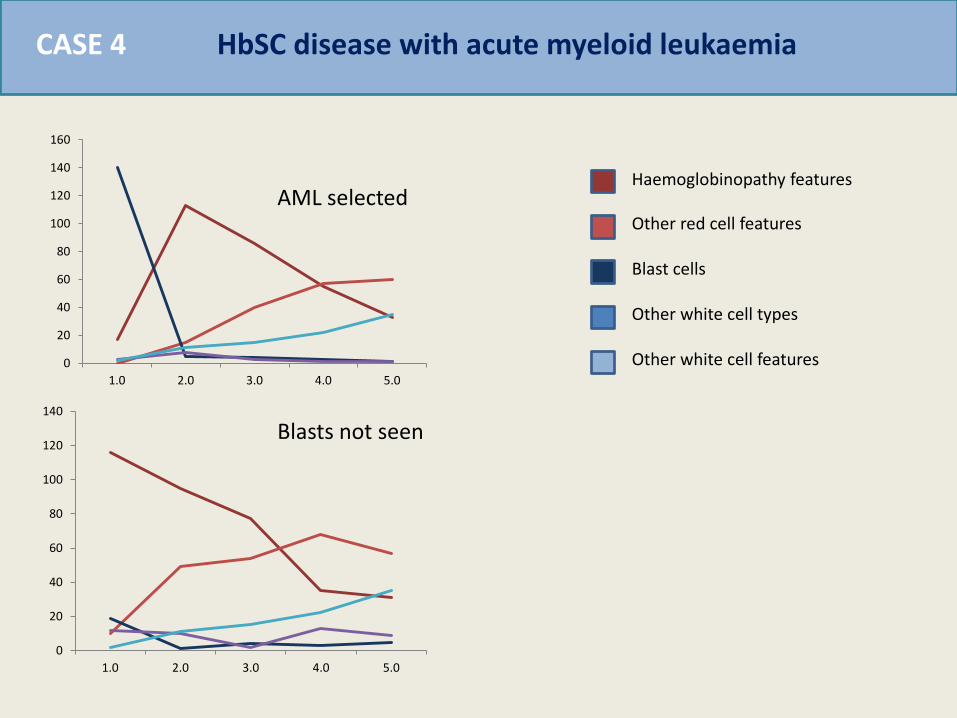
HbSC disease with acute myeloid leukaemia CASE 4
Haemoglobinopathy features
Other red cell features
Blast cells
Other white cell types
Other white cell features 0
20
40
60
80
100
120
140
160
1.0 2.0 3.0 4.0 5.0
0
20
40
60
80
100
120
140
1.0 2.0 3.0 4.0 5.0
AML selected
Blasts not seen
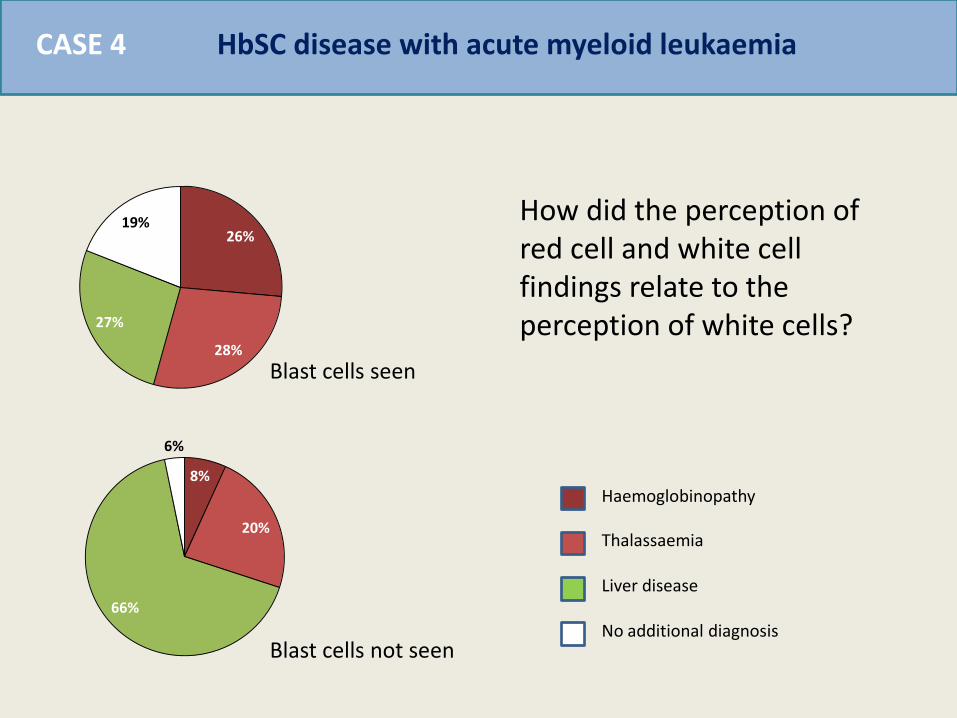
HbSC disease with acute myeloid leukaemia CASE 4
26%
28%
27%
19%
8%
20%
66%
6%
Haemoglobinopathy
Thalassaemia
Liver disease
No additional diagnosis
How did the perception of red cell and white cell findings relate to the perception of white cells?
Blast cells seen
Blast cells not seen
Elements governing diagnostic conclusion CASE 4
Interpretation This did not appear to be a classification error or prioritisation error, those making an incorrect diagnosis simply failed to see the blast cells! MAJOR ERROR SOURCE: Multiple alternatives bias (simplified to exclude other important features) Framing effect (substantial influence of other features) Premature closure (arriving at a single diagnosis and stopped)
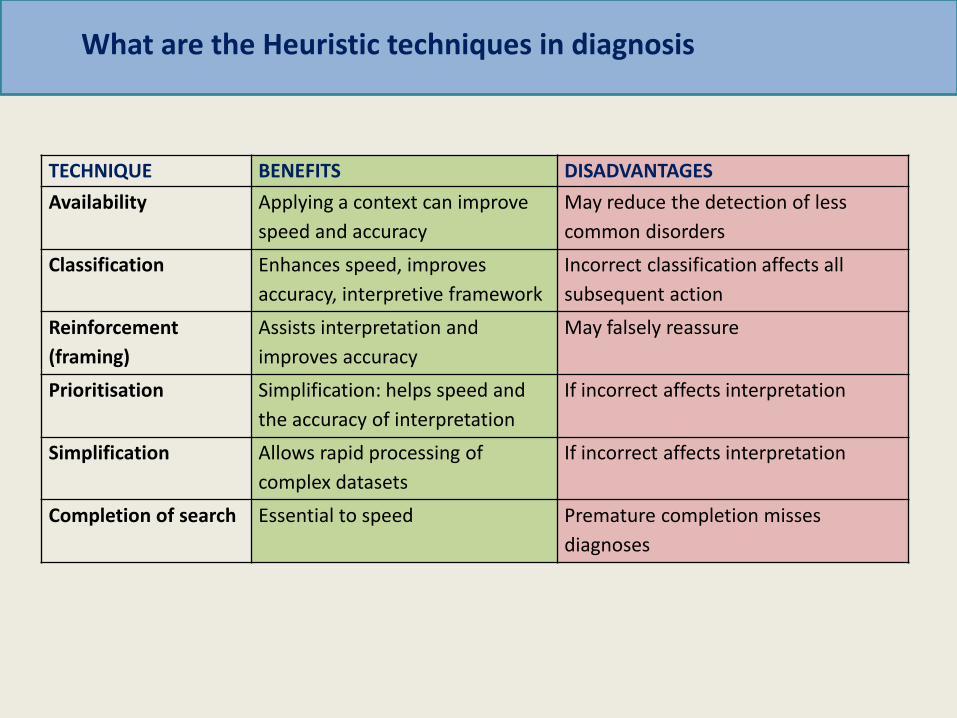
TECHNIQUE BENEFITS DISADVANTAGES
Availability Applying a context can improve
speed and accuracy
May reduce the detection of less
common disorders
Classification Enhances speed, improves
accuracy, interpretive framework
Incorrect classification affects all
subsequent action
Reinforcement
(framing)
Assists interpretation and
improves accuracy
May falsely reassure
Prioritisation Simplification: helps speed and
the accuracy of interpretation
If incorrect affects interpretation
Simplification Allows rapid processing of
complex datasets
If incorrect affects interpretation
Completion of search Essential to speed Premature completion misses
diagnoses
What are the Heuristic techniques in diagnosis
CASE 5 Does experience help?

Oxidative haemolysis and Adult T-cell Leukaemia Lymphoma CASE 5
An man receiving medical treatment becomes unwell.
Preferred answer: 1. Oxidative haemolysis with neoplastic lymphocytes 2. Oxidative haemolysis ranked most important 3. Action: high priority action 4. Diagnosis: Oxidative haemolysis (G6PD def) plus neoplastic lymphocytes or blasts
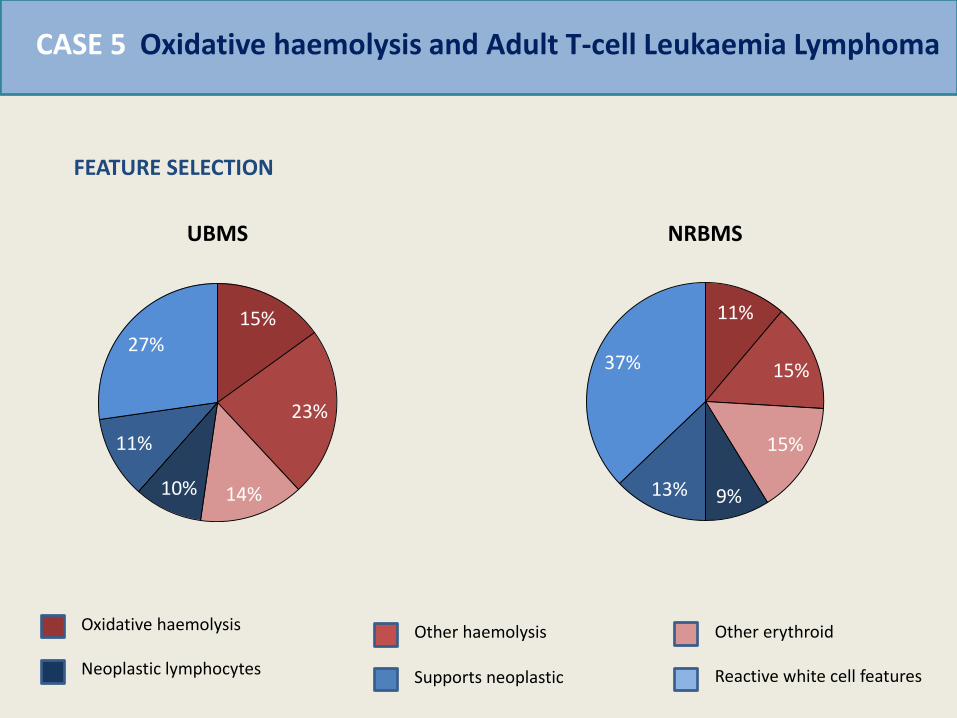
Oxidative haemolysis and Adult T-cell Leukaemia Lymphoma CASE 5
15%
23%
14% 10%
11%
27%
UBMS
11%
15%
15%
9% 13%
37%
NRBMS
Oxidative haemolysis
Neoplastic lymphocytes Supports neoplastic
Other haemolysis Other erythroid
Reactive white cell features
FEATURE SELECTION
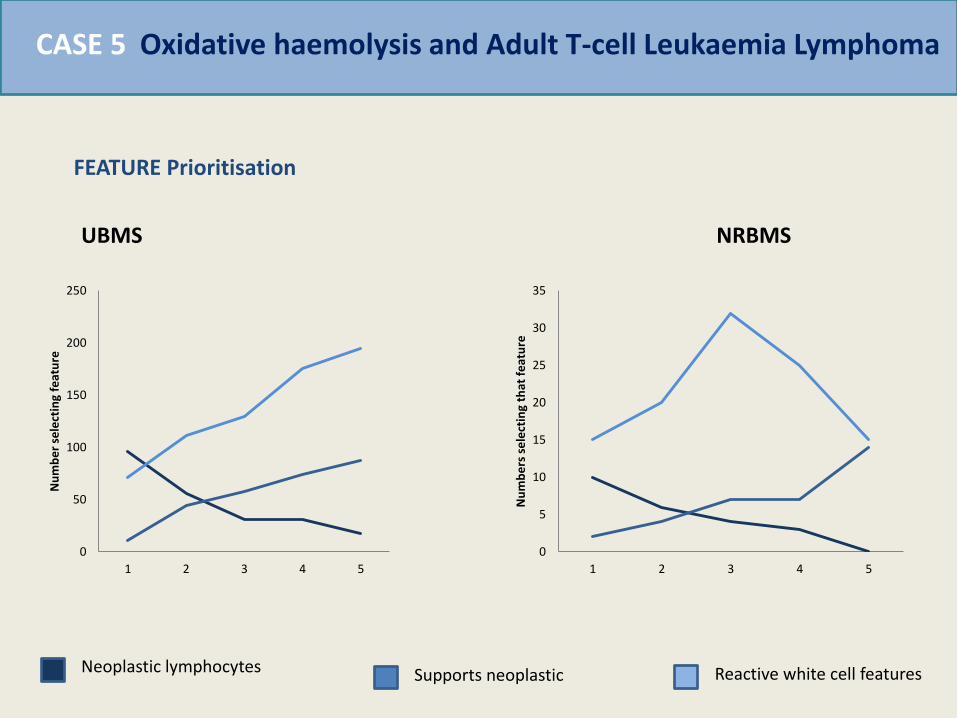
Oxidative haemolysis and Adult T-cell Leukaemia Lymphoma CASE 5
0
50
100
150
200
250
1 2 3 4 5
Nu
mb
er
sele
ctin
g fe
atu
re
0
5
10
15
20
25
30
35
1 2 3 4 5
Nu
mb
ers
se
lect
ing
that
fe
atu
re
Neoplastic lymphocytes Supports neoplastic Reactive white cell features
FEATURE Prioritisation
UBMS NRBMS

Oxidative haemolysis and Adult T-cell Leukaemia Lymphoma CASE 5
29%
56%
9% 6%
12%
33%
29%
26%
Correct No selectiobn Oidative haemolysis Other haemolysis
UBMS NRBMS
DIAGNOSIS CHOICE
Conclusions
1. The nature of errors depends significantly on the complexity of morphological features
2. In “simple” cases, where there is a single feature diagnosis depends mainly on the classification of that feature
3. As cases become more complex, heuristic techniques play a much greater role in interpretation but also produce specific patters of errors
4. Experience improves the application of these techniques (but does not eliminate errors)
5. Action may be very strongly influenced by the choices made

• AWARENESS OF SOURCES OF ERROR
• STANDARDISATION (ICSH)
• GUIDANCE ON REPORT STYLE
• ASSESSMENT: competency
• DECISION SUPPORT: tools
Strategies to improve interpretation
Keith Hyde, Barbara De la Salle, Dan Pelling, UK NEQAS
UK NEQAS(H) DM participants
John Ardern and Central Manchester Hospitals
Manchester University
Leica-SlidePath
Acknowledgements