why do we create visualizations? - university of washington · 2 why do we create visualizations?...
TRANSCRIPT

1
The Purpose of Visualization
Maneesh Agrawala
CS 558: VisualizationWinter 2005
Why do we create visualizations?

2
Why do we create visualizations?
Answer a questionMake decisionsSee data in contextAnalyze and discoverPresent an argumentTell a storyInspire
Three functions of visualizations
Record informationPhotographs, blueprints,
Explore information (analyze)Process and calculateReason about dataFeedback and interaction
Explain information (present)Share and persuadeCollaborate and reviseEmphasize important aspects of data
3
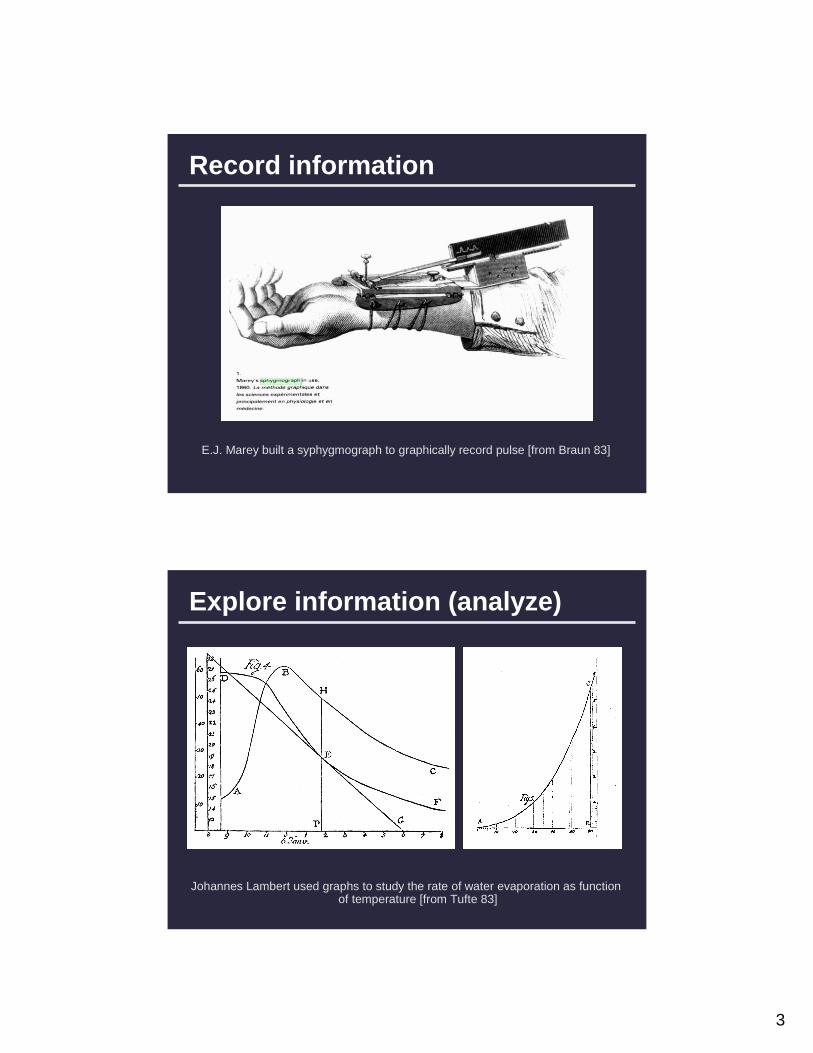
Record information
E.J. Marey built a syphygmograph to graphically record pulse [from Braun 83]
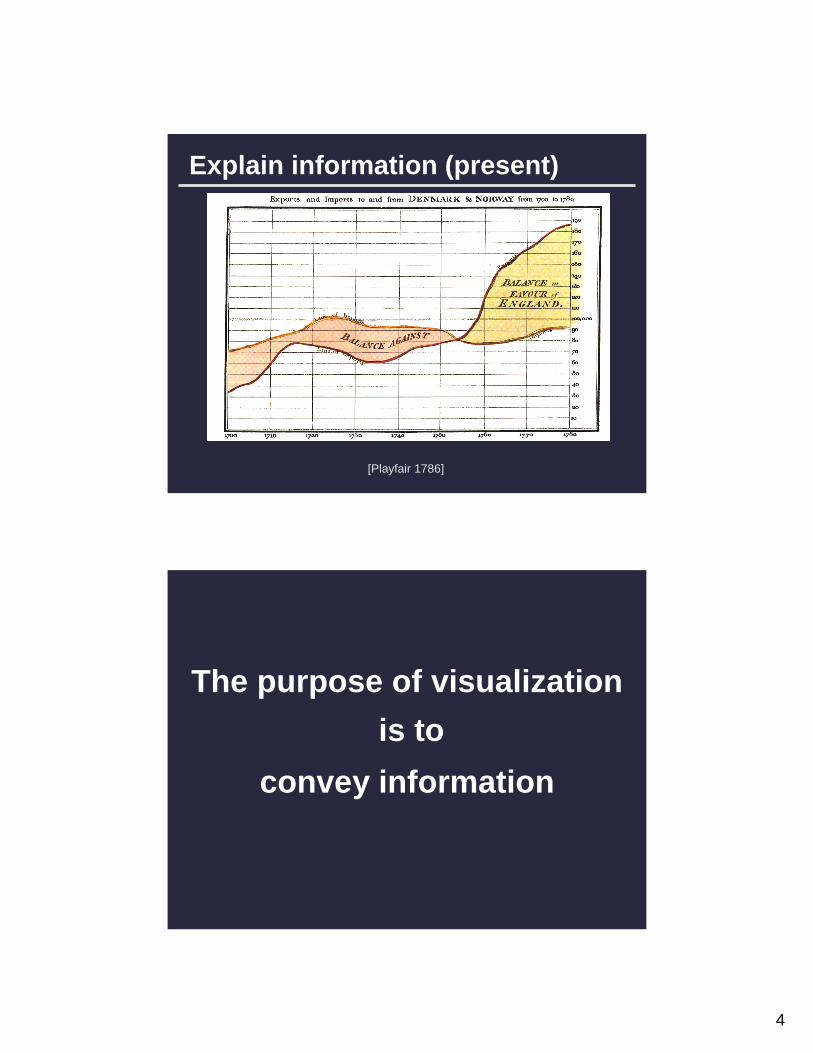
Explore information (analyze)
Johannes Lambert used graphs to study the rate of water evaporation as function of temperature [from Tufte 83]
4
Explain information (present)
[Playfair 1786]
The purpose of visualization
is to
convey information

5
The most powerful brain?
The most powerful brain?
The Dragons of Eden [Carl Sagan]

6
The most powerful brain?
The Elements of Graping Data [Cleveland]
0
20
40
60
80
100
120
Mental Paper & Pencil
Tim
e (S
ec.)
Expand working memory
34x 72
6823802448

7
Cholera outbreak in 1864, London
John Snow plotted the position of each case on a map. Used mapto hypothesize that pump on Broad St. was the cause. [from Tufte 83]
Challenger disaster
2 of 13 pages of material faxed to NASA by Morton Thiokol

8
Challenger disaster
Visualizations drawn by Tufte show how low temperatures damage O-rings [Tufte 97]
Visual proofsSum of odd numbers:1 + 3 + 5 + 7 + 9 = 52
Pythagorean theorem:Chinese proof by dissection

9
Amplifies perception & cognition1. Expand working memory2. Reduce search time3. Pattern detection and recognition4. Perceptual inference5. Perceptual monitoring & controlling attention6. Interaction to aid cognition
Using vision to think
Readings in Information Visualization, Chapter 1 [Card 99]
Visualization Research
10
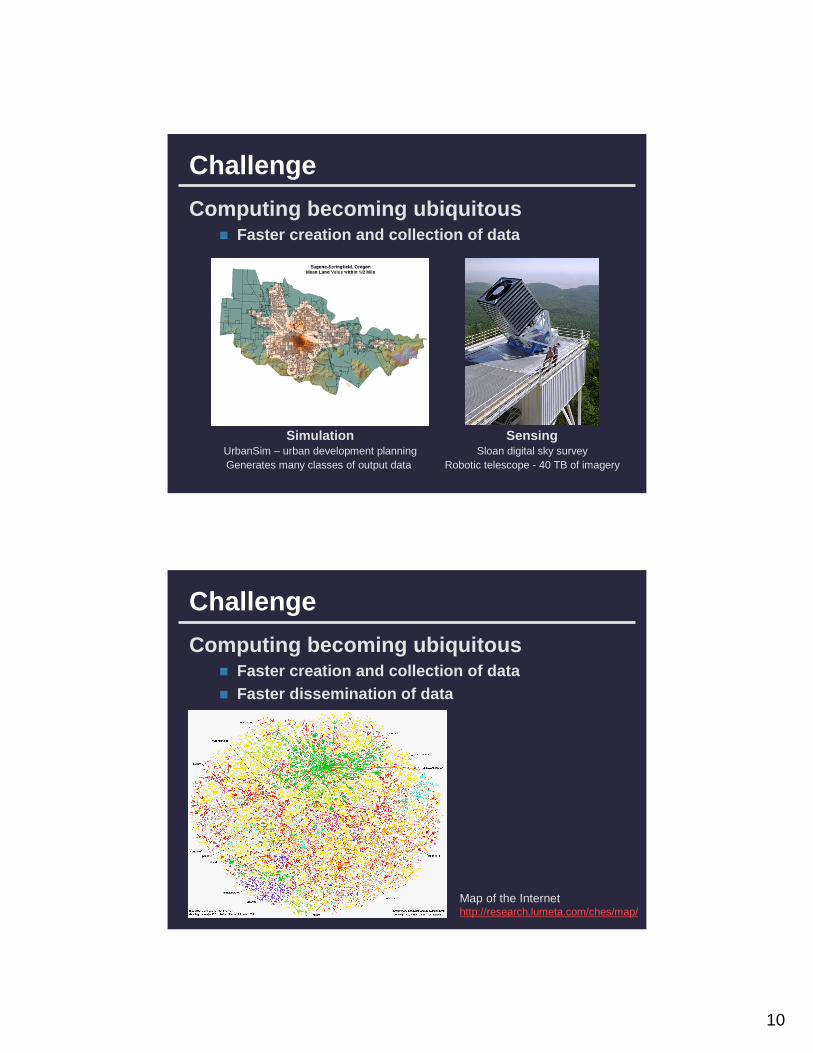
Challenge
Computing becoming ubiquitousFaster creation and collection of data
SimulationUrbanSim – urban development planningGenerates many classes of output data
SensingSloan digital sky survey
Robotic telescope - 40 TB of imagery
Challenge
Computing becoming ubiquitousFaster creation and collection of dataFaster dissemination of data
Map of the Internet http://research.lumeta.com/ches/map/

11
Challenge
Computing becoming ubiquitousFaster creation and collection of dataFaster dissemination of data
Need better tools to produce visualizations
Goals of visualization research
1. Understand how visualizations convey information to people
What do people perceive/comprehend ?How do visualizations correspond with mental models of data?
2. Develop principles and techniques for creating effective visualizations
Amplify perception and cognitionStrengthen connection between visualization and mental model of data

12
Topics
1. Data and image models
[Bertin, Graphics and Graphic Information Processing 1981]http://www.sciences-po.fr/cartographie/cartographie_html/5_page5theorie/graphique_bertin2001/03_%20propietes_en_z/03_1_proprietes_du_z.html

13
2. Perception
The psychophysics of sensory function [Stevens 61]
3. Spatial Layout
London underground [Beck 33]

14
4. Database visualization
Guest lecture: Chris Stolte from Tableau software
5. Color
[from Cynthia Brewer http://www.personal.psu.edu/faculty/c/a/cab38/ ]
Guest lecture: Maureen Stone

15
6. Interaction
FilmFinder [Ahlberg 94]
7. Usability and evaluation
Testing effectiveness of 3 types of assembly instructions [Heiser 04]

16
8. Conveying shape and structure
Principal Organs & Vascular System[Leonardo da Vinci ca. 1490]
Strange Immersion of Torus in 3-Space [Curtis 92]
9. Abstraction, emphasis & LODSelection
Simplification
Exaggeration
Regularization
Displacement
Aggregation
Cartographic generalization techniques [Monmonier 96] [MacEachren 94] [DiBiase 91]

17
10. Depicting processes & actions
Wearing a sari [from Mijksenaar 99] Visualizing dance steps [from Tufte 90]
Course Mechanics
18
Structure
LecturesIn general I’ll present one lecture each weekYou’ll lead the other presentation/discussionMaterial in class will be loosely based on readings
RequirementsPresentationAssignment 1: Find good and bad visualizationsAssignment 2: Create a visualizationFinal project
Class home pagehttp://abstract.cs.washington.edu/~maneesh/cs558/
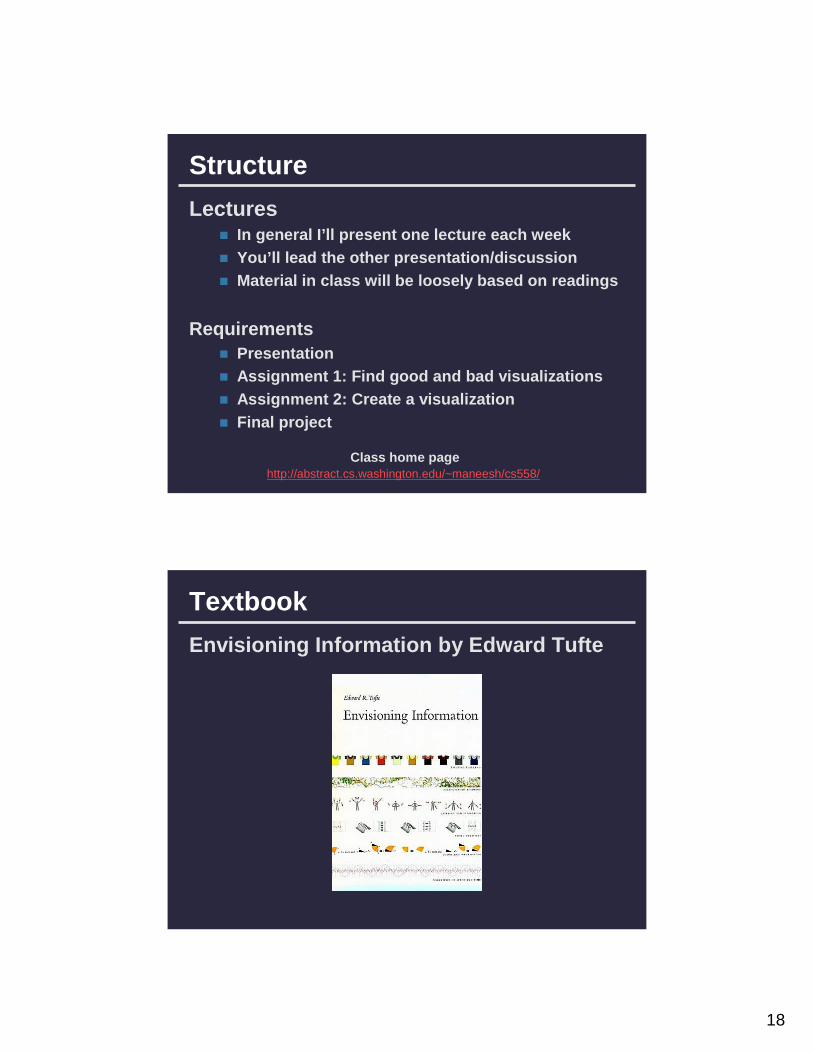
Textbook
Envisioning Information by Edward Tufte

19
PresentationsDescribe visualization problems and techniques
for a specific domainCartographic visualization Molecular visualization Tree and graph layout Software visualization Flow visualization Medical imaging Anatomical illustration Video-game visualization Visualization of sporting events Social network visualization Financial visualization Music visualization
Signup for topic on Jan 11. Groups of 2 ok. First group Jan 18.http://abstract.cs.washington.edu/~maneesh/cs558/presentations.html
Assignment 1Find two visualizations one bad
and one good
Use original sourcesJournalsScience magazinesNewspapersTextbooks
Make webpage explaining the images and critiquing them
Due Jan 11. Mail me URL by 10am.http://abstract.cs.washington.edu/~maneesh/cs558/assignment1.html
20
HistoryPat Hanrahan taught visualization class in 2002He revised it in 2004
http://www.graphics.stanford.edu/courses/cs448b-04-winter/
Many lectures will be adapted from Pat’s classes
Other visualization classes:Tamara Munzner (UBC)John Stasko (Georgia Tech.)Marti Hearst (Berkeley)