why didn’t the pavement distress quality assurance … frith.pdf · 2020-04-17 · qes began...
TRANSCRIPT
WHY DIDN’T THE PAVEMENT DISTRESS QUALITY ASSURANCE PLAN WORK?
Douglas Frith, P.E.
Dennis Morian, P.E.
Luis Ramirez, M.Sc.
Quality Engineering Solutions, Inc.
Presentation for RPUG 2017

KEY STEPS IN DATA QUALITY MANAGEMENT
1. Identify key data elements for control
2. Identify sources and range of variability
3. Define control items and limits
4. Control site evaluations
5. Levels of control
6. Production level quality assurance
7. Lessons learned
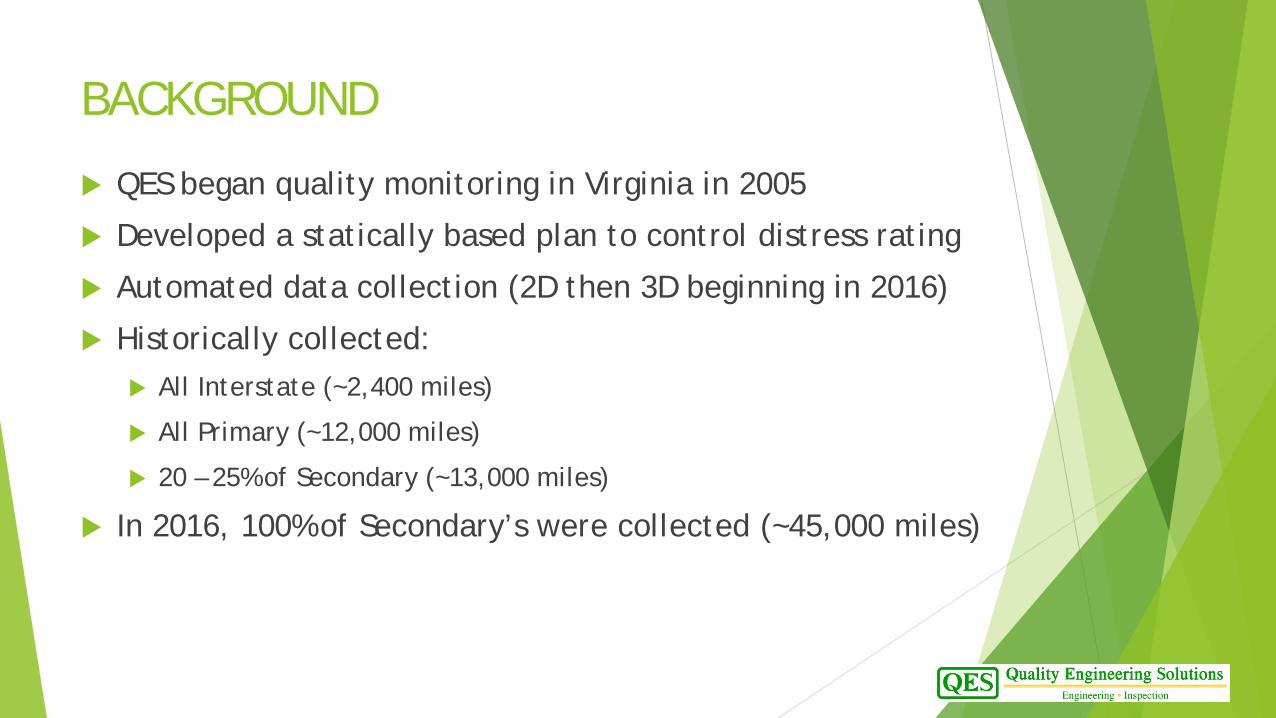
BACKGROUND
QES began quality monitoring in Virginia in 2005
Developed a statically based plan to control distress rating
Automated data collection (2D then 3D beginning in 2016)
Historically collected: All Interstate (~2,400 miles)
All Primary (~12,000 miles)
20 – 25% of Secondary (~13,000 miles)
In 2016, 100% of Secondary’s were collected (~45,000 miles)

BACKGROUND
Deliverables submitted by route type and/or district Interstates
Primary Districts 1-9
Secondary Districts 1-9
Other routes

DEFINE CONTROL ITEMS AND VALUES Control the data that affects the pavement management decisions
Identification of the key data elements to be controlled
Determine the criticality of each element and expected variability
Establish control data
Develop tolerance limits and variability measures
Practical Statistically based Distress
Individual distress types and/or severities
Index values
Range and completeness checks
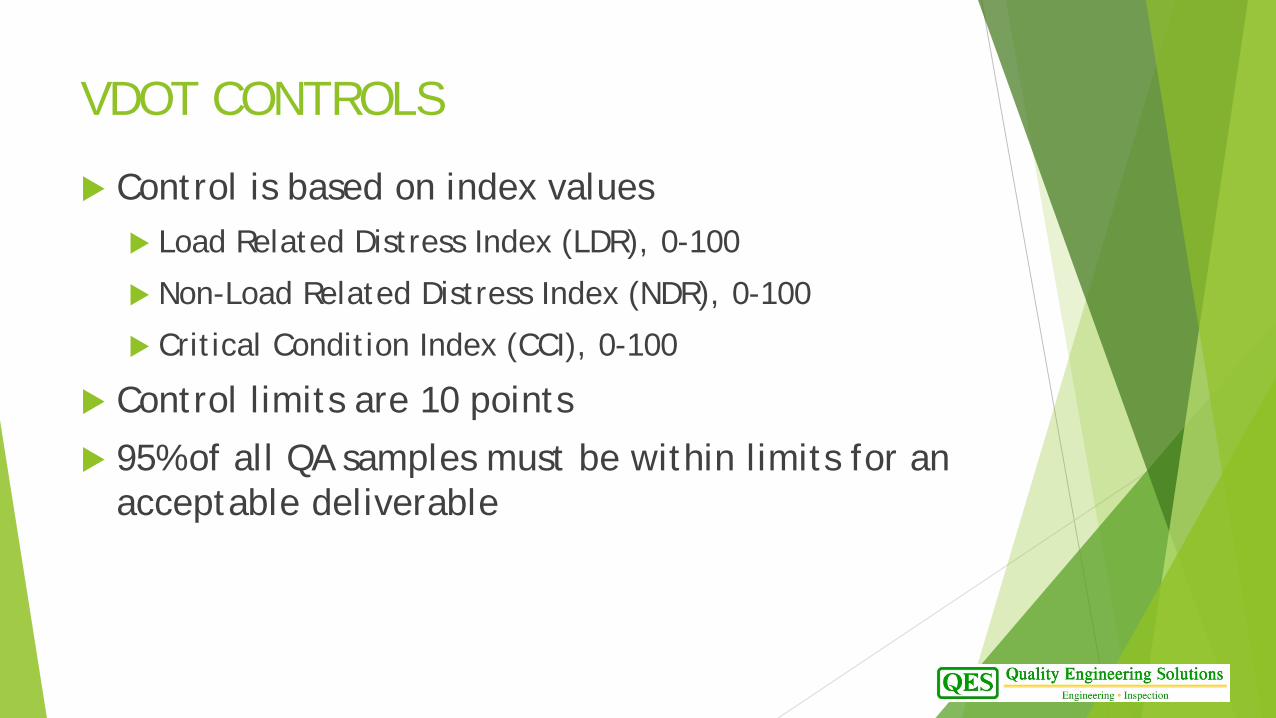
VDOT CONTROLS
Control is based on index values Load Related Distress Index (LDR), 0-100
Non-Load Related Distress Index (NDR), 0-100
Critical Condition Index (CCI), 0-100
Control limits are 10 points
95% of all QA samples must be within limits for an acceptable deliverable


Production Level Quality Assurance
Control key data elements
Independent distress evaluations
High level data range checks Quantities do not exceed section limits or reasonable boundaries
Year-to-year consistency checks Pavement does not improve without reason
Pavement does not deteriorate at unreasonable rate
Can be affected by time of year and/or weather

VDOT Process
Compare LDR & NDR Index Values
Within 10 index points for 95% of the samples
► 5% random sample per deliverable
► Independent distress rating

2016 Secondary District 2 LDR► 5% random sample per deliverable (292 samples)
► 95.5% passing LDR Check

2016 Secondary District 2 NDR► 5% random sample per deliverable (292 samples)
► 96.2% passing NDR Check

ISSUES?
Data appeared to have passed both LDR & NDR checks
When Year-to-Year comparisons were made with 2015 data, something was wrong
Much less longitudinal and transverse cracking and level 1 alligator cracking was reported on average than previous year
Vendor determined a setting was missed during a processing step, so much of the cracking was not being reported
WHY DID THE SAMPLE CHECKS PASS THE COMPARISON?

2016 Secondary District 2 LDRREDELIVERY
95.5% 96.0%

2016 Secondary District 2 NDRREDELIVERY
96.2% 99.3%

POSSIBLE REASONS/SOLUTIONS
QES independent ratings were processed with the same missing setting Modify the processing steps to allow QES to process our own ratings
Incorrect Limits Consider adjustable limits, more distress = more variability?
Original limits developed based upon rater pool and D2S limits
Different means to define limits (COV, Quartile, Tukey Limits)
Outlier analysis (Theta Parameter)
Categorical Bias
Stratified Sampling
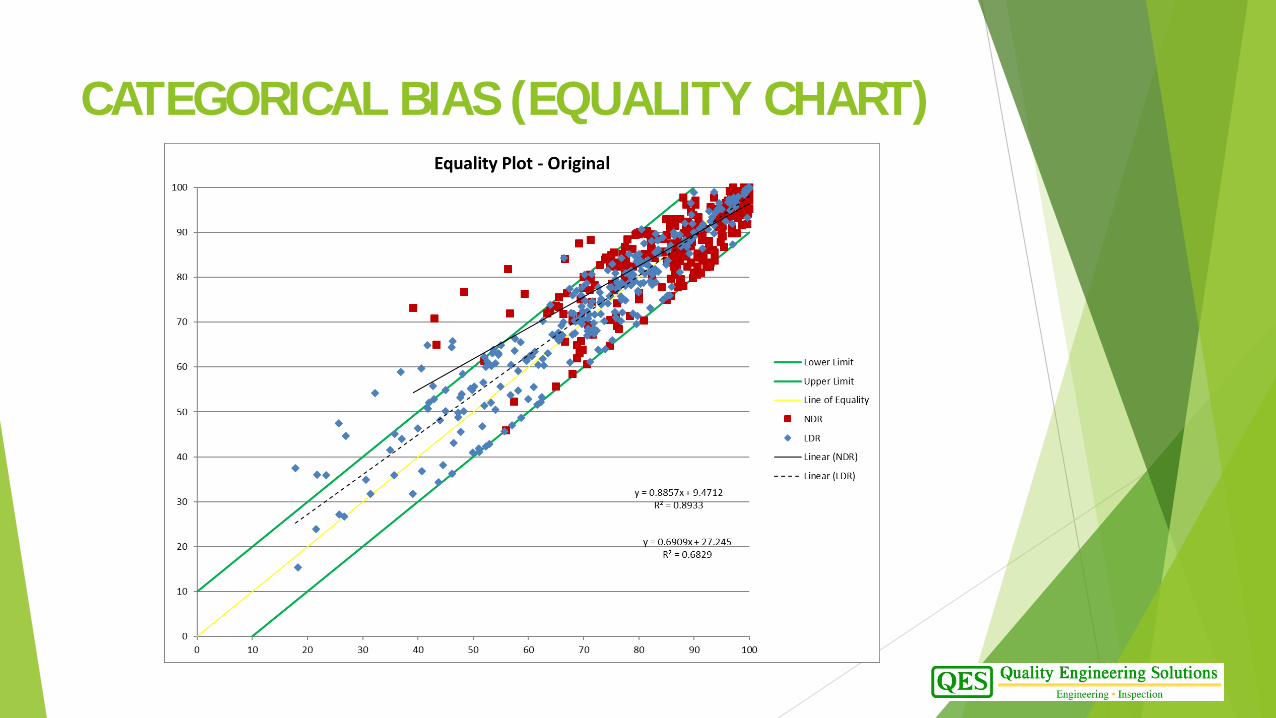
CATEGORICAL BIAS (EQUALITY CHART)
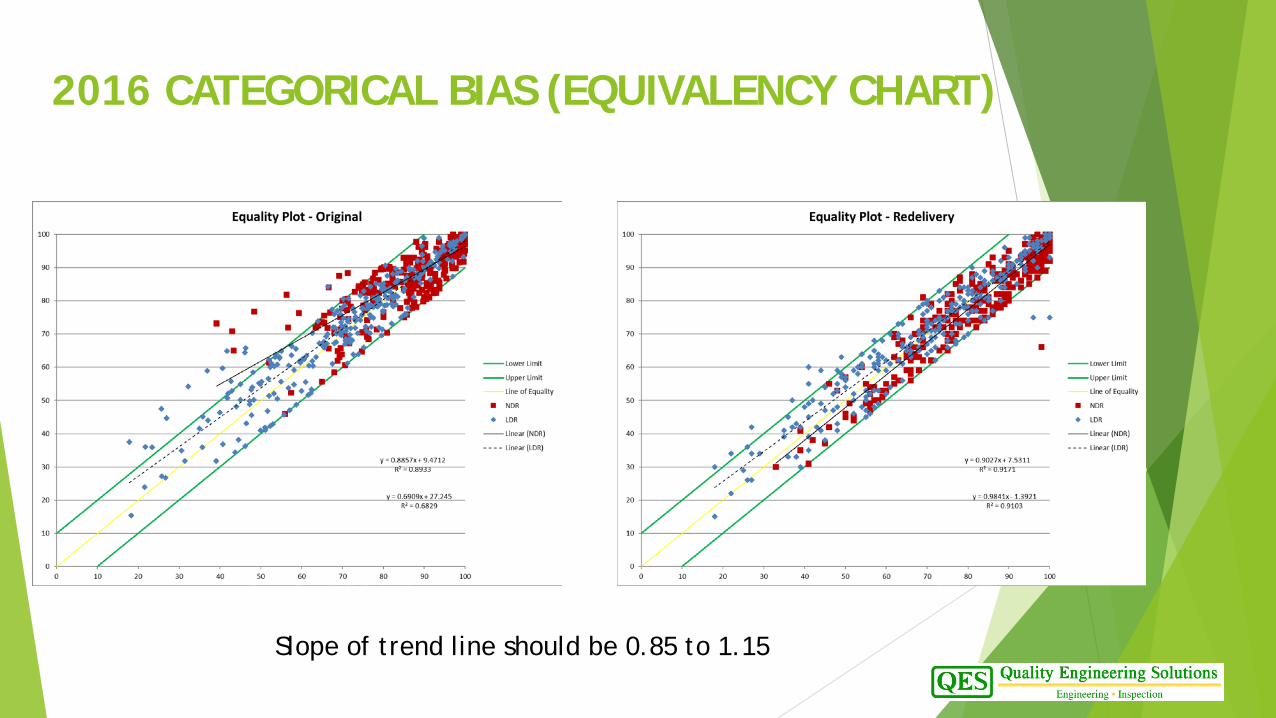
2016 CATEGORICAL BIAS (EQUIVALENCY CHART)
Slope of trend line should be 0.85 to 1.15

2017 Secondary District 2 LDR► 5% random sample per deliverable (86 samples)
► 95.3% passing LDR Check, 98.8% passing NDR Check

2017 Secondary District 2

PROCESS IMPROVEMENTS
Implemented the Categorical Bias Plot Allowable slope is between 0.85 and 1.15
Perform an outlier analysis (Theta Parameter)
Addition of Stratified Sampling Increase sampling in the CCI range of 45 to 80 based on
previous years data
Enhanced Year-to-Year checks Summarize total distress reported for all samples for Vendor
and QA team and compare
Look at multi-year trends in index values and individual distresses
Allow QES to process our own ratings
SUMMARY
Consider dividing large deliveries Sample size is important Continually look for ways to improve the quality
monitoring process Be willing to make adjustments
THANK YOU!