why can’t i get a contract? - executive war · pdf filewhy can’t i get a contract?...
TRANSCRIPT

Why Can’t I Get a Contract?
The Executive War College
May 1, 2013
1

DISCLAIMER!
I am NOT a Wizard!!
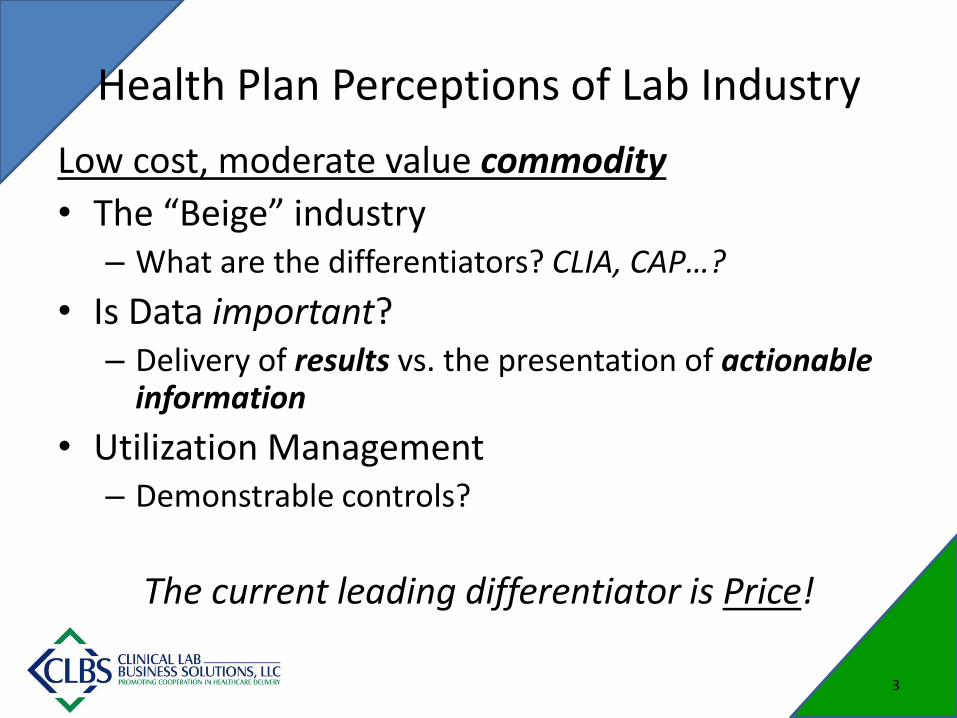
Health Plan Perceptions of Lab Industry
Low cost, moderate value commodity
• The “Beige” industry – What are the differentiators? CLIA, CAP…?
• Is Data important? – Delivery of results vs. the presentation of actionable
information
• Utilization Management – Demonstrable controls?
The current leading differentiator is Price!
3
Fewer Contracts: Key Drivers
• Employer demand for cost reductions
• Healthcare “Reform”
• Economy
• Impact of Consumerism
• Plan Tactics
4

Employer Pressure for Cost Containment
• 25% shift to ‘High Performance’ networks
• 22% demand for cost ‘transparency’
• 1/3 require that health plans provide data that exposes high cost providers
5
Towers Watson 2012 Employer Survey
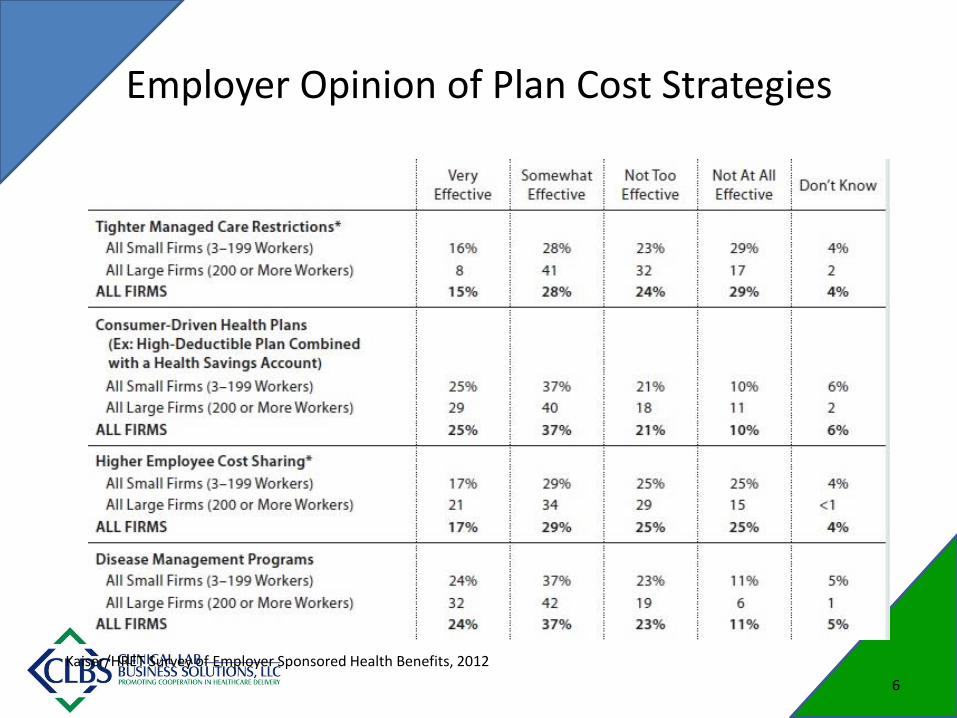
Employer Opinion of Plan Cost Strategies
Kaiser/HRET Survey of Employer Sponsored Health Benefits, 2012
6
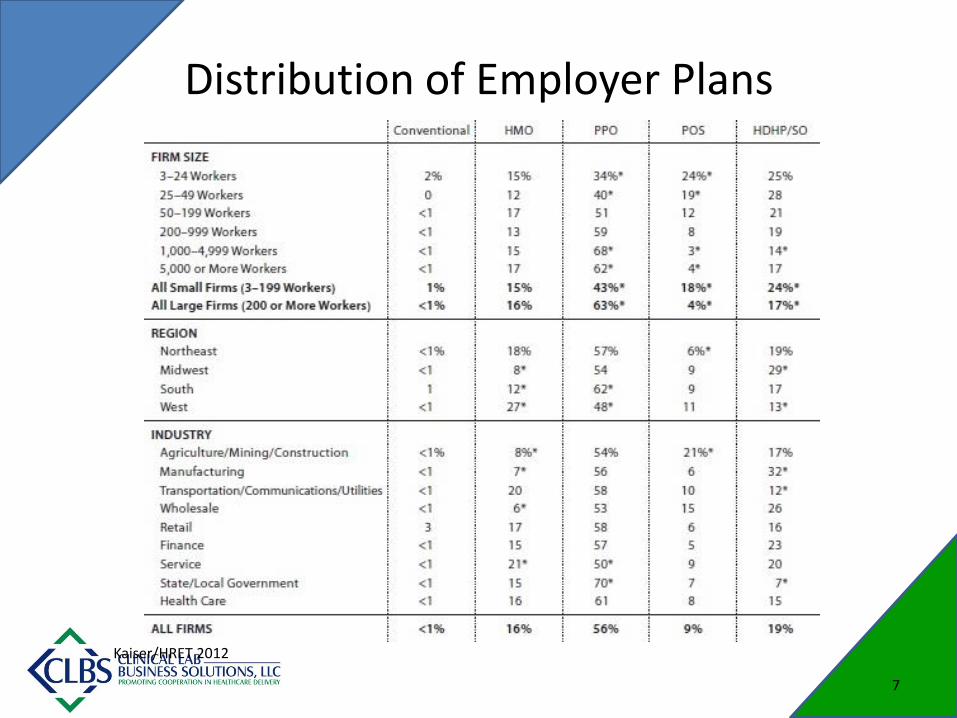
Distribution of Employer Plans
Kaiser/HRET 2012
7

Medical Loss Ratio (MLR)
• ACA impact: Minimum spend of insurance premium on medical expenses
– 80% for individual and small group markets
– 85% for large group markets
• Impact on health plans:
– Large capital cost for compliance
– Reduced ability to make administrative ‘investments’
8

ACO Impact
• What kinds of organizations may form ACOs?
– Physicians and other professionals in a group
– Physicians and other professional in a network
– Partnership/JV’s between hospitals and physicians
– Hospitals employing physicians/professionals
• Model Penetration
– 428 (mixed ‘Care & private) as of Feb 1, 2013
– Micro Networks?
9

ACO Progress 2013
HealthAffairs Blog, 2/19/2013
10

Medicaid: Is there an Opportunity?
2011 Medicaid statistics (Medicaid.gov)
• Total enrollment (covered lives) 57 M
• Managed Care enrollment 42 M
• 2011 Managed Care enrollment 75%
• 2005 Managed Care enrollment 63%
• Trend to Managed Care 2%/year
• Commercial/Proprietary Plans 28 M or
50%
Will 50% of newly covered lives be covered under exclusive lab contracts?
11

Medicaid Expansion
• Under ACA, 21.3 M new enrollees by 2022
• W/O ACA, 5.7 M new enrollees
Given previous enrollment stat’s:
• Total enrollment by 2022 78 M
• Trend to MCO @ 2%/yr 18%
• Managed Care enrollment 72.5 M
93%!!!
12

Medicare Advantage Growth
13

Medicare Advantage
• Traditional Medicare shift to MA plans:
– > ¼ of all beneficiaries
– 60% participation in MCO
– Current trend rate is 10%
– Employers driving trend; requiring retirees to MA
• CBO predicts a decline in enrollment by 2019
This is a shift to commercial insurance!!
14

Current Health Plan Cost Controls
• Pricing – Greater discounting? – Capitation: more to come?
• Steerage (Control OON Leakage) – Push to low cost provider – Restriction in OON payment (MNRP) – Limit access to contracted providers – Panel size is decreasing
• Cost Shifting – Higher deductibles and co-insurance – Reduced OON cost share
• Enforcement of Medical Policies – Non-covered services: DENIALS! – New MoPath codes have enabled these policies
15

Benefit Design Drives Network
Goal: Reduce cost while preserving care • Member Incentives
– Wellness: Cash or reduced benefit cost – Choice of provider: Tiered coinsurance / deductibles
• Cost Sharing – Mutual benchmarks for plan and employer group – Narrow, preferred provider network is key to savings
• Account-based Plans – Contains HSA or HRA – High deductible: promotes consumerism – Changes focus from ‘spend’ to ‘save’
• Value-based structure – Bundling – Episode of Care – ACOs
16

Payors: Contracting ‘Constants’
• Trend and Leakage – Trend rises due to new technology and utilization
increases – Out of Network or non-contracted providers
• Lowest costs – Competitive bidding:
• Price • Services
• Preferred agreements (perception of value) • New services, same price
– HIE participation
17

WHERE’S THE VALUE? Can the Industry move from Volume to Value?
18

Current Business Model
• ‘Classic’ Lab Model: Volume is Value!
– Can you afford further discounting?
– Are the plans even interested?
• ‘Specialty’ Lab
– How many does the plan really need?
• Proprietary Testing
– How long before a competing assay?
– What is the reimbursement?
19
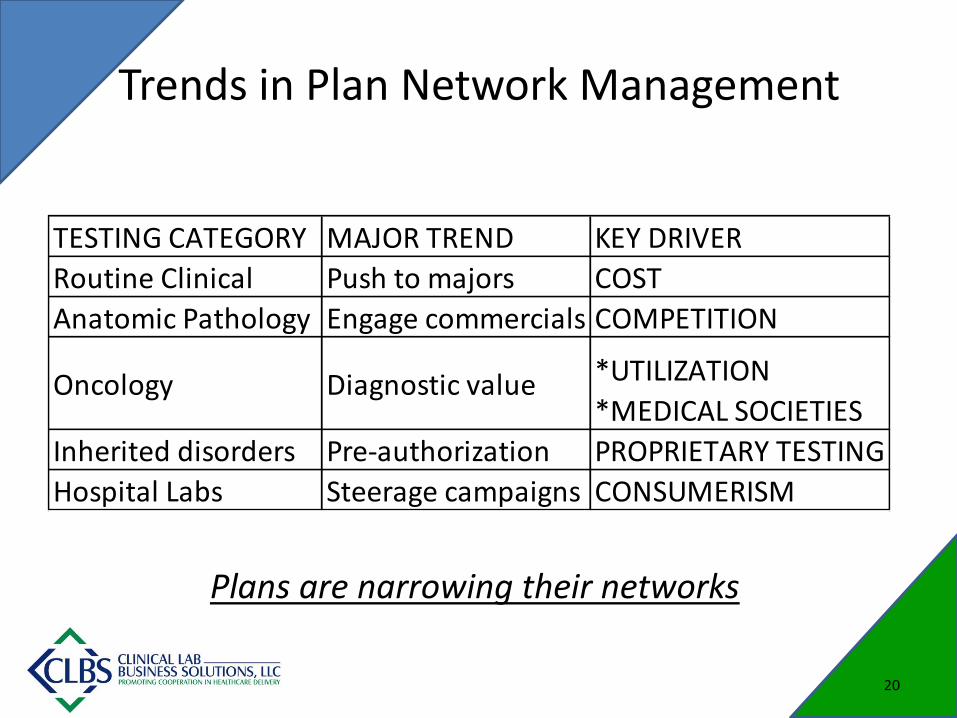
Trends in Plan Network Management
20
TESTING CATEGORY MAJOR TREND KEY DRIVER
Routine Clinical Push to majors COST
Anatomic Pathology Engage commercials vs. privateCOMPETITION
Oncology Diagnostic value *UTILIZATION
*MEDICAL SOCIETIES
Inherited disorders Pre-authorization PROPRIETARY TESTING
Hospital Labs Steerage campaigns CONSUMERISM
Plans are narrowing their networks

Top Priorities for Health Plans
1. Contain Admin costs
2. Enhance provider communications to improve care
a) Case Management
b) HIE interoperability
3. Support ACO efforts
4. Retain members and grow market share
Porter Research: Healthcare Payers, Top HIT Investment (April 2012)
21

Health Plan ‘Values’
• Participation in Utilization Management
• Synchronization of Test Menu to Medical Policy
• Provide technical assessment that proves clinical utility and economic value
• Expanded Credentialing: demonstrate proficiency of testing against standards
• Ability to meet employer demands for member transparency to healthcare costs
• Lab Networks
22

Opportunities for Enhanced Value
• Demonstrable cost savings
– Guarantees vs. programs
• New Service Lines
– Solutions to medical management issues
– Total solution: must include technology
– Demo as a pilot
– Cost-based pricing vs. ROI basis
23

REIMBURSEMENT Is there a Silver Lining in the current bad news?
24

Clinical Lab Fee Schedule 2013
• Consumer Price Index (CPI): +1.7%
• Productivity adjustment: -0.9%
• Reduction from reform: -1.75%
• Reduction from SGR fix: -2.0%
• Total (eff. Jan. 1, 2013) -2.95
• Sequestration: -2.0%
• Updated Total: -4.95 Jondavid Klipp, G2 Path 2013
25

Reimbursement Summary for 2013
• Pathology reimbursement cut by weighted average of about 14%
• Clinical lab fee schedule cut by 3-5%
• Molecular diagnostic codes cut 20-30%
• Netted out, overall pathology revenue will decrease an estimated 10% in 2013. Previously revenue growth had averaged 7% per year (2007-2012)
Jondavid Klipp, G2 Path 2013
26
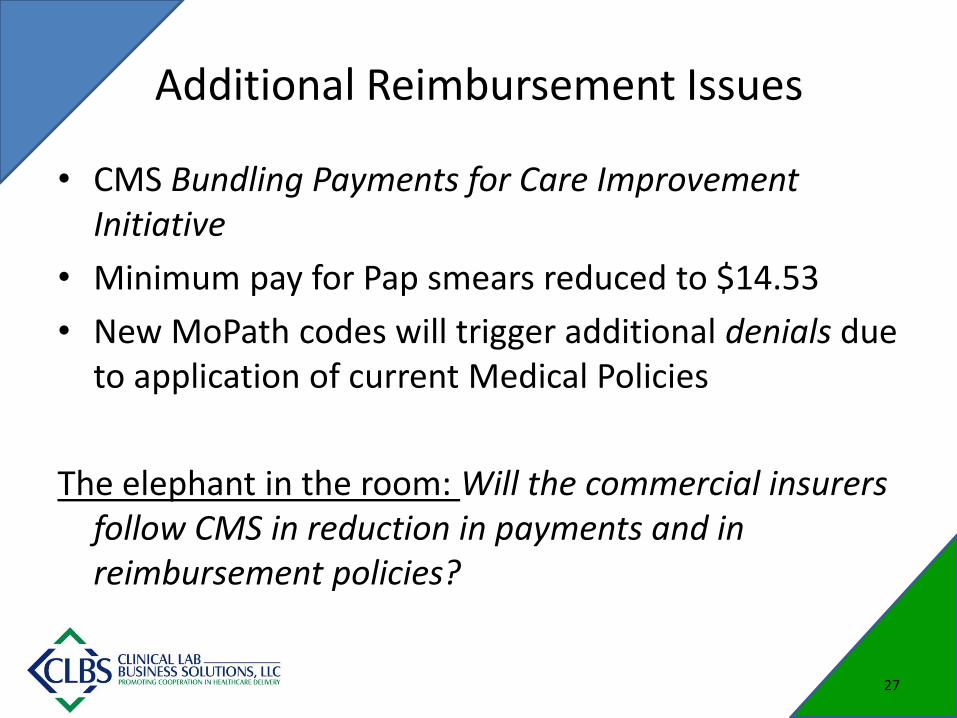
Additional Reimbursement Issues
• CMS Bundling Payments for Care Improvement Initiative
• Minimum pay for Pap smears reduced to $14.53
• New MoPath codes will trigger additional denials due to application of current Medical Policies
The elephant in the room: Will the commercial insurers follow CMS in reduction in payments and in reimbursement policies?
27

From Volume to Value: Can We Make the Jump?
• Embrace At Risk reimbursement
– Need good financial models
– Partner with the plans
• Implement Utilization Management
• Add new value to current services:
– Provide intelligence, not just data
• Create new Service Lines
– Medical economic approach vs. new testing
28

Doing Business in the “New World”
• Evaluate your business model – Construct a whitepaper: Why is your lab unique?
• Embrace new reimbursement methods – Develop benchmark data sets
• Collaborate with the plans to determine new value – Added value and new service lines
• Be prepared to invest!
• Find opportunities for collaboration/partners
29

Survival Tactics
• Develop ‘Campaigns’:
– Educate physicians, patients and employers as to your value to the medical process
– Ask for advocates; send letters to the plan medical directors
• Do NOT:
– Make the contract manager look bad!
– Become threatening or attempt intimidation
– ‘Work’ for free
30
