whole-of-landform erosion assessment using unmanned aerial
TRANSCRIPT

Whole-of-landform erosion assessment using unmanned aerial vehicle data
M Braimbridge Mine Earth, Australia
S Mackenzie Mine Earth, Australia
M Lyons Regis Resources Limited, Australia
T Clarke Regis Resources Limited, Australia
B Bow Atlas Iron Pty Ltd, Australia
Abstract Erosion of constructed landforms remains one of the key challenges to mine rehabilitation and closure in Western Australia. Accurate assessment of erosion across large landforms, monitoring of erosion rate of change, development of, and comparison against applicable, realistic assessment criteria, are essential to demonstrate rehabilitation performance and facilitate regulatory acceptance.
Recent improvements in unmanned aerial vehicle (UAV) based data capture and analysis have facilitated the use of orthophoto and digital elevation model (DEM) data for a ‘whole-of-landform’ approach to erosion monitoring.
UAV survey data can be used to characterise and monitor the location and dimensions of erosion features (gullies) on landforms. Temporal comparison of this data facilitates evaluation of individual gully characteristics over time, the extent of sediment movement and development of appropriate closure criteria and standards for assessment of long-term erosion performance. UAV survey data can also facilitate identification of the causes of erosion and potential future problem areas where surface water is concentrating, allowing effective remediation strategies to be developed where required.
Capturing and analysing UAV survey data is efficient, cost-effective and negates the requirement for manual measurement of erosion features on landforms.
This paper describes the process that has been developed and implemented across several mine sites in Western Australia to monitor erosion and associated rehabilitation parameters on constructed landforms.
Keywords: erosion assessment, UAV data capture, digital elevation model, rehabilitation and closure monitoring
1 Background This paper presents an erosion assessment method for constructed landforms that utilises unmanned aerial vehicle (UAV) based data to characterise individual gullies and summarise all erosion features at a whole-of-landform scale. Examples of the assessment method from various mine sites in the Goldfields and Pilbara Regions of Western Australia (WA) are provided, along with a framework which has been developed for the classification of individual gullies.
There are several methods commonly used in the WA mining industry to assess and monitor surface erosion on constructed landforms, all of which have advantages and disadvantages. The most common erosion assessment methods employed include:
1. Physical measurement of gully dimensions using transects perpendicular to landform slopes.
2. Sediment traps to capture eroded material moving off the slopes.
3. Erosion pins to obtain a point measure of soil loss and/or accumulation of sediment.
Mine Closure 2019 - AB Fourie & M Tibbett (eds)© 2019 Australian Centre for Geomechanics, Perth, ISBN 978-0-9876389-3-9
Mine Closure 2019, Perth, Australia 397
doi:10.36487/ACG_rep/1915_32_Braimbridge

These methods typically only assess a small area of the landform, which is often not representative of overall erosion performance, require traversing of slopes to physically measure gully dimensions (which has safety implications and often causes erosion) and, in the case of sediment traps, can be expensive to install and require regular maintenance.
Recent advances in the use of aerial surveys to generate orthophoto and digital elevation model (DEM) data has facilitated a ‘whole-of-landform’ assessment of erosion. Such a method enables all erosion features on a landform to be assessed and a comparison of this data over time to provide a temporal assessment of the overall erosion rate of change. The benefits of this method have accelerated with recent improvements to UAVs, the advancement of smart ground control points to replace traditional survey methods and user-friendly photogrammetry analysis software.
This whole-of-landform assessment method has the benefits of removing the need to traverse landform slopes on foot and being able to quickly assess whole landforms and multiple areas with different rehabilitation prescriptions. DEM data can also be rapidly analysed to identify catchment areas on the landform which may be contributing to erosion, or areas of high potential erosion risk. DEM data can also be quickly analysed to identify other potential failure areas such as precursors to tunnelling or slumping which are unlikely to be detected with other assessment methods.
A set of gully classification criteria has been developed to identify the status of individual gullies and track changes in their severity over time. The criteria are designed to be flexible, taking the landform characteristics and construction materials into account to calibrate appropriate management responses.
2 Methods The whole-of-landform erosion assessment method utilises UAV-based survey to generate orthophoto and DEM data to measure and track erosion on landforms over time. The initial data collected can be used to establish a baseline DEM surface against which future surveys can be compared on a periodic basis and/or following severe rainfall events to identify erosion rate of change.
The process for identification and assessment of erosion features and surface elevation for a landform involves the following:
• Logging of all visible erosion features on the landform:
○ Record coordinates of gully head position.
○ Aerial image of individual gully status.
• Record a description of individual gully position and features (e.g. position on landform, width and depth, catchment area).
• Visual assessment of sediment movement (i.e. sediment contained within troughs in rip lines or berms on landform, or sediment movement beyond toe of landform).
• Measurement of the volume of gullies using the DEM data.
• Measurement of horizontal length of gully (i.e. horizontal distance from head to toe of gully).
• Assessment of landform upper surface and berm elevation to identify surface drainage and catchment characteristics.
Traditional measurements of gully dimensions, i.e. gully depth and width, which are often highly variable along the length of a gully, are superseded by a quantifiable assessment of gully volume. The maximum depth of a gully could also be included as an assessment criterion, if required, particularly in situations where a certain depth of cover is required over physically or chemically problematic materials.
The gully head position, horizontal length and gully volume data can be compared to data derived from subsequent assessments, to identify changes in gully characteristics over time. Gullies formed on freshly
Whole-of-landform erosion assessment using unmanned aerial vehicle data M Braimbridge et al.
398 Mine Closure 2019, Perth, Australia

rehabilitated landforms will often ‘self-armour’ over time as the fine fraction is removed and the coarse component remains. An assessment of the erosion rate of change is therefore considered a critical measure of erosion performance and for lease relinquishment.
The measured data for individual gullies can be saved as digital files that can be uploaded onto future DEM datasets for comparison over time.
The measured gully data described above is summarised in an ‘erosion inventory’ for a given rehabilitation area, or entire landform, and can be compared to future DEM data to provide an ongoing, temporal assessment of erosion features. The frequency of gullies (e.g. gullies per hectare) and total gully volume can be calculated for individual landform batters, different ages of rehabilitation or entire landforms for comparison of erosion performance as m3/ha p.a.
The erosion inventory also details a simple, three-tiered classification for each gully (Table 1). The individual criteria upon which the overall gully classification is based are detailed in Table 2. The gully classification criteria have been developed around five measurable gully features (length, volume, sediment movement, catchment area and changeover time) to provide a quantifiable assessment of gully geometry and sediment movement between measurements. The criteria are designed to be flexible and take the landform characteristics including batter slope length and construction materials into account. It is important that the criteria are considered collectively for the classification of each gully, not in isolation, and that they also consider the characteristics of the landform, to identify the need for potential remediation activities.
Table 1 Three-tier erosion gully classification
Gully classification
Green – rill or minor gully, no immediate threat to landform erosion stability and/or surface drainage control, to be monitored over time Amber – substantial gully to be closely monitored over time, potential threat to landform erosion stability and/or surface drainage control Red – severe gully, current threat to landform erosion stability and/or surface drainage control, remediation required
Table 2 Example of individual erosion gully classification criteria
Gully length <5 m (Score 1) >5 m and <20 m, but less than full length of batter (Score 2) >20 m or greater than length of batter (i.e. from crest to toe of batter) (Score 3)
Gully volume
Volume unable to be determined or volume <5 m3 (Score 1) Volume between 5 and 20 m3 (with minimal sediment impact to berm or surrounding environment) (Score 2) Volume >20 m3 (Substantial sediment impact to berms or surrounding environment) (Score 3)
Sediment movement
Sediment movement restricted to rip lines on batter (Score 1) Minor sediment movement onto berm or minor sediment movement beyond toe of landform (Score 2) Unacceptable1 sediment movement onto berms or into surrounding environment (Score 3)
Gully catchment
Single gully originating from water concentration in single rip line (Score 1) Complex gully derived from water concentration at multiple points (Score 2) Gully derived from water concentration on upper flat surface (berm or upper surface) (Score 3)
Gully changeover time
Gully characteristics have not changed (Score 1) <10% increase in length or volume (Score 2) >10% increase in length or volume since last assessment (Score 3)
1 – ‘Unacceptable’ defined as sediment movement which is impacting the capacity of the berm to function as intended, or is negatively impacting the environment surrounding the landform.
Landforms
Mine Closure 2019, Perth, Australia 399

An important gully classification criterion is gully changeover time. Comparative assessment of gully features over subsequent monitoring events (or following severe rainfall events), will indicate whether erosion in an individual gully is accelerating or is beginning to stabilise. The evaluation of gully changes over time should also consider the local rainfall data since the preceding assessment.
Each gully identified on the landform is allocated a score of 1, 2 or 3 for each criterion listed in Table 2. The average of the individual gully criteria scores is then calculated to provide an overall classification for each gully. The average score ranges for the three-tiered classification for each gully (i.e. green, amber or red) are detailed in Table 3. These score ranges have been based on the analysis of gully data from multiple waste landforms in the Goldfields and Pilbara Regions of WA and are designed to be flexible, taking landform and waste material characteristics into consideration.
Table 3 Overall gully classification score categories based on average of individual scores for each criterion
Gully classification category Average score range
Green <1.66
Amber 1.67 to 2.33
Red >2.34
3 Results Examples of data derived from the whole-of-landform erosion assessment method are presented in the following sections.
3.1 Visual representation of gully erosion Analysis of the orthophoto and DEM data provides a visual representation of the location and extent of all measurable gullies on the landform. Examples from recent assessments of waste landforms in the Goldfields and Pilbara Regions of WA are presented in Figure 1.
Figure 1 Examples of erosion feature measurements over entire landforms. Yellow polygons represent
spatial extent of individual gullies
Whole-of-landform erosion assessment using unmanned aerial vehicle data M Braimbridge et al.
400 Mine Closure 2019, Perth, Australia
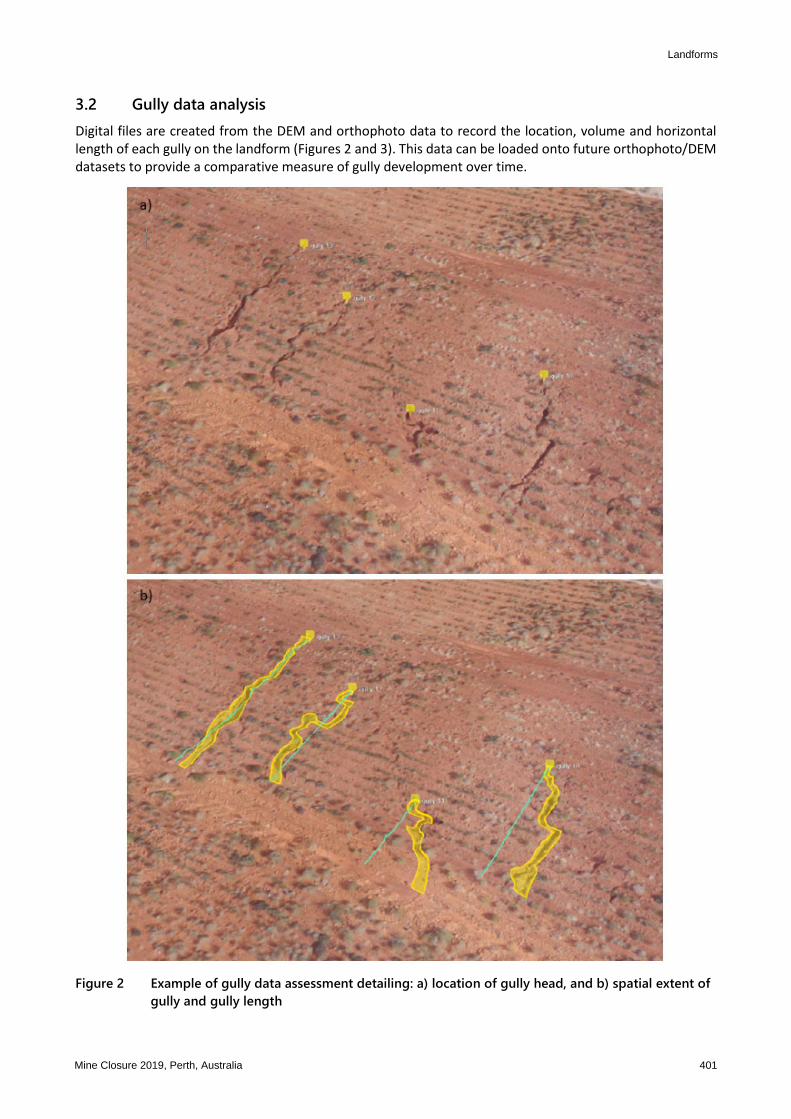
3.2 Gully data analysis Digital files are created from the DEM and orthophoto data to record the location, volume and horizontal length of each gully on the landform (Figures 2 and 3). This data can be loaded onto future orthophoto/DEM datasets to provide a comparative measure of gully development over time.
Figure 2 Example of gully data assessment detailing: a) location of gully head, and b) spatial extent of
gully and gully length
Landforms
Mine Closure 2019, Perth, Australia 401

Figure 3 Example of erosion feature measurements: a) aerial image, b) spatial extent of gully, c) calculation
of gully volume, and d) delineation of gully catchment on berm above landform batter
3.3 Erosion inventory and gully classification Individual gully data are recorded in an erosion inventory for each landform and this details the location, extent of sediment movement, gully volume, horizontal length, gully catchment details and other relevant information pertaining to each gully (Table 4). The gully classification criteria described in Section 2 and the overall classification of each gully (based on the average of the individual criteria scores) are also recorded in the erosion inventory.
3.4 Erosion summary statistics Analysis of the gully erosion data generated for each landform provides a range of information which can be utilised to compare different rehabilitation treatments, compare performance of different cover materials, and monitor the evolution of rehabilitated landform surfaces over time. Relevant summary statistics include:
• Mean gully length.
• Mean gully volume.
• Gully count per hectare.
• Gully length per hectare.
• Gully volume per hectare.
Whole-of-landform erosion assessment using unmanned aerial vehicle data M Braimbridge et al.
402 Mine Closure 2019, Perth, Australia

Tabl
e 4
Exam
ple o
f ero
sion i
nven
tory
dat
a coll
ecte
d fro
m an
alysis
of o
rthop
hoto
/DEM
(dig
ital e
levat
ion m
odel)
dat
a
Gully
ref #
Gully head
position
Lift
Extent of
sedim
ent
move
ment
Sedim
ent
move
ment
score
1
Volume
of gu
lly
(m3)
Gully
volume
score
1
Horizontal
length (m)
Gully
length
score
1
Catchment
score
1
Comments
Ove
rall gu
lly
classification
(based on
average
score)2
1
6835864
mN
417519 m
E
1
Sedim
ent
movemen
t restricted
to
rip lines
within 1
st lift
batter
1
0.7
1
1.8
1
1
Minor gu
lly through
2 rip lines m
id‐slope
of 1st lift batter
1.0
2
6835866
mN
417370 m
E
1
Minor
sedim
ent
movemen
t beyond toe
of landform
2
5.5
2
5.3
1
1
Gully through
3 rip
lines at base of 1st lift
batter
1.75
3
6835889
mN
417313 m
E
1
Sedim
ent
movemen
t restricted
to
rip lines
within 1
st lift
batter
1
2.3
1
9.5
1
3
Long narrow gully
through
6 rip lines
originating at crest of
batter. Catchmen
t comprises area
of
berm above
1.75
4
6835879
mN
417353 m
E
1
Substan
tial
sedim
ent
plume
beyond toe
of landform
3
21.6
3
22.1
3
2
Large complex gu
lly
derived
from
multiple catchmen
t area
s on batter slope
2.75
1 – Three‐tier classification based
upon in
dividual gully criteria detailed in
Tab
le 2.
2 – Overall classification for ea
ch gully based
on average
of individual criteria scores an
d classification ran
ges defined
in Tab
le 3.
Landforms
Mine Closure 2019, Perth, Australia 403

The analysed data and summarised statistics for the whole-of-landform erosion assessment can be utilised to develop realistic and measurable, site specific closure criteria and associated standards for landform surface stability, and to demonstrate rehabilitation performance against those criteria.
3.5 Analysis of landform surface elevation In addition to analysis of existing erosion features, the survey data can be utilised to assess the elevation of landform surfaces (upper surfaces and berms) (Figures 4 and 5). The identification of catchment areas on the landform can provide valuable information regarding areas of potential surface water accumulation which may be contributing to erosion or areas of high potential erosion risk. Conformance to landform design parameters (e.g. slope geometry, berm capacity) can also be assessed using the DEM data.
Figure 4 Example of landform upper surface elevation assessment and slope cross-section using
orthophoto/DEM (digital elevation model) based data
Whole-of-landform erosion assessment using unmanned aerial vehicle data M Braimbridge et al.
404 Mine Closure 2019, Perth, Australia

Figure 5 Example of landform berm surface elevation assessment and slope cross-section using
orthophoto/DEM (digital elevation model) based data
4 Conclusion Analysis of UAV-based orthophoto and DEM survey data to assess erosion at a whole-of-landform scale provides a superior alternative to traditional erosion assessment techniques on constructed landforms. The method provides a quantifiable, efficient and cost-effective measure of the erosion status of the entire landform, and a baseline against which future data can be compared. The gully head position, aerial imagery, horizontal length and volume data collected for each gully can be compared with subsequent assessments to determine erosion changeover time for individual gullies, with summary statistics for the landform used to demonstrate performance against relevant closure criteria.
The collected data can also provide valuable information on the landform surface drainage characteristics to identify existing causes of erosion and potential high-risk areas where surface water is concentrating, allowing effective remediation strategies to be developed where required.
Acknowledgement The authors would like to thank Regis Resources Ltd and Atlas Iron Pty Ltd for their assistance in the preparation of this paper.
Landforms
Mine Closure 2019, Perth, Australia 405

406 Mine Closure 2019, Perth, Australia