whole genome phylogeny for 21 drosophila species … · whole genome phylogeny for 21 drosophila...
TRANSCRIPT
Submitted 26 September 2013Accepted 28 November 2013Published 23 December 2013
Corresponding authorArun S. Seetharam,[email protected]
Academic editorKeith Crandall
Additional Information andDeclarations can be found onpage 11
DOI 10.7717/peerj.226
Copyright2013 Seetharam and Stuart
Distributed underCreative Commons CC-BY 3.0
OPEN ACCESS
Whole genome phylogeny for 21Drosophila species using predicted2b-RAD fragmentsArun S. Seetharam1 and Gary W. Stuart2
1 Bioinformatics Core, Purdue University, West Lafayette, IN, USA2 Department of Biology, Indiana State University, Terre Haute, IN, USA
ABSTRACTType IIB restriction endonucleases are site-specific endonucleases that cut bothstrands of double-stranded DNA upstream and downstream of their recognitionsequences. These restriction enzymes have recognition sequences that are generallyinterrupted and range from 5 to 7 bases long. They produce DNA fragments whichare uniformly small, ranging from 21 to 33 base pairs in length (without cohesiveends). The fragments are generated from throughout the entire length of a genomicDNA providing an excellent fractional representation of the genome. In this studywe simulated restriction enzyme digestions on 21 sequenced genomes of variousDrosophila species using the predicted targets of 16 Type IIB restriction enzymesto effectively produce a large and arbitrary selection of loci from these genomes.The fragments were then used to compare organisms and to calculate the distancebetween genomes in pair-wise combination by counting the number of shared frag-ments between the two genomes. Phylogenetic trees were then generated for eachenzyme using this distance measure and the consensus was calculated. The consensustree obtained agrees well with the currently accepted tree for the Drosophila species.We conclude that multi-locus sub-genomic representation combined with next gen-eration sequencing, especially for individuals and species without previous genomecharacterization, can accelerate studies of comparative genomics and the building ofaccurate phylogenetic trees.
Subjects Bioinformatics, Evolutionary StudiesKeywords Type IIB restriction enzymes, Phylogenomics, Restriction-site associated DNA (RAD)tags, Reduced genomic representation
INTRODUCTIONEvolutionary relationships of species derived by comparing single orthologous genes or
groups of genes can be negatively affected by potential horizontal gene transfers, incom-
plete lineage-sorting, introgression, and the unrecognized comparison of paralogous genes
(Delsuc, Brinkmann & Philippe, 2005). However, with the advent of the genomic era, it is
now possible for researchers to use the complete genomes of fully sequenced organisms
for building trees. Though such trees offer robustness for analysis, it becomes impractical
to use traditional methods for constructing large scale alignments and for generating trees
from these alignments, mainly because of their large size and their highly heterogeneous
How to cite this article Seetharam and Stuart (2013), Whole genome phylogeny for 21 Drosophila species using predicted 2b-RADfragments. PeerJ 1:e226; DOI 10.7717/peerj.226
nature. As a result, there are now sophisticated methods that don’t rely on alignment and
are optimized for large scale data. These methods generally use vector representation of
genes (Qi, Luo & Hao, 2004; Stuart, Moffett & Leader, 2002) or features such as gene content
(Huson & Steel, 2004; Snel, Bork & Huynen, 1999; Tekaia, Lazcano & Dujon, 1999), gene
order (Bourque & Pevzner, 2002; Korbel et al., 2002), intron positions (Roy & Gilbert, 2005),
or protein domain structure (Lin & Gerstein, 2000; Yang, Doolittle & Bourne, 2005).
Despite a strong recent interest in the various large-scale non-alignment methods,
they are often viewed as somewhat less rigorous and less reliable. In addition, even
with the dramatic decrease in the cost of genome sequencing, it is still not attractive to
sequence the genomes of those organisms that have little economical value, especially
if their genomes are extremely large. On the other hand, the possibility of obtaining a
large and representative set of fragments, instead of the whole genome sequence, can
be economically feasible even for the lesser known species and can provide a valuable
alternative for many types of genomic scale studies, including phylogenomics.
Recently, several approaches have been developed to represent the genome by randomly
sampling the entire genome. These approaches give a good reduced representation of
the genome and are based on restriction sites on the genome combined with the next
generation sequencing methods. Some popular methods include Complexity Reduction of
Polymorphic Sequences (CRoPS) (van Orsouw et al., 2007); restriction site-associated
DNA sequencing (RAD-seq) (Baird et al., 2008; Etter et al., 2011); Genotyping by
Sequencing method (GBS); double-digest RAD-seq (Peterson et al., 2012), and 2bRAD
(Wang et al., 2012). All these methods provides good subsamples from homologous
locations within genomes and are widely used to study population genetics (Baxter et
al., 2011; Hohenlohe et al., 2010). These methods have the potential to uncover detailed
information about a wealth of genomic markers. Complex interactions among markers
can also be extracted at the population level (Baird et al., 2008; Davey & Blaxter, 2010).
Recently, these fragments have also been used for evolutionary studies (Emerson et al.,
2010; Rubin, Ree & Moreau, 2012; Yi & Jin, 2013).
A novel class of enzymes, known as Type IIB restriction endonucleases (Roberts et al.,
2003b), are site-specific endonucleases that cut both strands of double-stranded DNA
upstream and downstream of their recognition sequences. These restriction enzymes
have recognition sequences that are generally interrupted and range from 5 to 7 bases
long. They produce DNA fragments which are of uniform length, ranging from 21 to 33
base pairs in length (without cohesive ends) (Roberts et al., 2003a). The fragments are
generated from throughout the entire length of a genomic DNA providing an excellent
fractional representation of the genome. This method of generating fragments using
Type IIB enzymes is termed 2bRAD (Wang et al., 2012) and these fragments have been
used for various purposes including population studies, digital karyotyping (Stebbins,
1950), for pathogen identification by computational subtraction (Tengs et al., 2004) and
genomic profiling to identify and quantitatively analyze genomic DNAs (Dunn et al., 2002).
In this study, we show that these fragments can be used for efficient phylogenetic study
for determining evolutionary relationships between distinct species. We have tested this
Seetharam and Stuart (2013), PeerJ, DOI 10.7717/peerj.226 2/15
method in silico and shown that 13 different types of IIB restriction enzymes can be used
to accurately reconstruct the phylogeny of a diverse set of 21 Drosophila species that are
currently available.
MATERIALS AND METHODSObtaining datasetsWhole genome, nucleotide sequences for the 21 Drosophila species were downloaded
from the FlyBase (McQuilton, St Pierre & Thurmond, 2012), NCBI databases and from the
Princeton University website (Rebeiz et al., 2009) on July 10, 2010.
Simulated restriction digestionThe PERL program “Phyper” was used to simulate restriction digestion for all 16 Type IIB
endonuclease enzymes and for processing the obtained fragments. This program generated
a representative list of unique fragments i.e., single-copy fragments (most abundant) and
fragments that are present as multiple identical copies (less frequent). The remaining
fragments belong to divergent fragment families within a given genome that display one or
a few mutations relative to each other and were identified and removed from the analysis.
The representative list of fragments were generated for each genome, for each enzyme
separately.
Fragment comparisonsThe representative lists of fragments were then used with another PERL program “Phyppa”
for comparative analyses. This program compares each fragment of a genome with every
fragment of another genome in order to find identical fragments and similar fragments
(fragments with up to 5 mismatches for ensuring more than 80% similarity among
sequences). A total of 210 such comparisons were done in order to generate the full list
of shared fragments (identical fragments and similar fragments) for every pair of genomes
(both PERL scripts are available upon request). Analyses was performed on a standard
laptop with a quad core processor (1.73 GHz Intel Core i7) and with 6 GB RAM. For
each enzyme, the scripts required about 6 h to finish for both fragment generation and
comparison between all genomes.
Distance calculationsThe number of shared fragments between a pair of genomes was then used to calculate the
evolutionary distance by calculating the ratio of shared fragment to the total fragments and
converting them to negative natural log (Eq. (1)). Conversion to negative natural log was
essential to ensure that the distances computed were always positive.
Distance=−ln
(Identical fragments+ Similiar fragments
Total fragments of both species
). (1)
Building treesDistance measures for all the pairwise comparisons for a particular enzyme were used
to build trees using the neighbor program from the Phylip (Felsenstein, 2005) package.
Seetharam and Stuart (2013), PeerJ, DOI 10.7717/peerj.226 3/15
A consensus tree was them produced by combining trees for all the enzymes with the
consensus program from Phylip. The flowchart for the entire process is given in Fig. 1.
RESULTS AND DISCUSSIONDatasetsThe full nucleotide sequences for 21 Drosophila species downloaded from various
sources are listed in Table 1. The genome size ranged from 137.82 mb for D. simulans to
235.52 mb for D. willistoni. D. willistoni had the lowest GC content of all with 37.89% and
D. pseudoobscura had the highest GC content (45.43%).
Type IIB restriction enzymesThe 16 Type IIB restriction endonucleases that could be used for simulating the restriction
digestion of Drosophila genomes along with their recognition sites, average distance
between the restriction sites assuming random distribution of nucleotides and without
any compositional bias, and the size of fragment (blunt) that the enzymes leaves behind
are given in Table 2 (Tengs et al., 2004). Unlike traditional Type II enzymes, Type IIB
enzymes cleave on both sides of the recognition sequence (about 7–15 bases upstream and
downstream, depending on enzyme) generating a fragment of uniform length. Also, the
recognition site is usually split into two parts by some fixed number of random bases. They
normally leave 2–3 base overhangs on the generated fragment.
Fragment analysesThe numbers of representative fragments obtained from each genome for each enzyme
are listed in Table 3. The most frequent cutting enzymes such as BslFI had generally
higher numbers of fragments within all genomes compared to other enzymes. Also,
D. pseudoobscura and D. persimilis had relatively higher numbers of fragments compared
to other genomes with most of the enzymes. Following fragment extraction, the original
genomic sequences downloaded from various source databases were represented as a
collection of fragments of uniform length. For each genome a total of 16 fragment sets were
generated by using 16 different type IIB enzymes. The number of fragments generated by
each genome was not closely related to the size of their genomes but they were related to the
GC content. Most of the enzymes used in the analysis recognized a GC rich recognition
site which is reflected in the number of fragments generated with GC rich genomes.
The genomes that were GC rich such as D. pseudoobscura and D. persimilis had higher
numbers of fragments compared to other genomes. Similarly the genomes that had lower
GC content such as D. willistoni and D. grimshawi generated fewer fragments. Overall,
the number of fragments obtained for each species were within the range of expected
fragments based on their genome size and estimated distance between restriction cut sites
(assuming random sequence without GC content bias). Most enzymes predicted to be
frequent cutters generated large number of fragments like BslFI. Predicted rare cutters like
PsrI, PpiI, AloI and CspCI generated fewer fragments than other enzymes.
Seetharam and Stuart (2013), PeerJ, DOI 10.7717/peerj.226 4/15
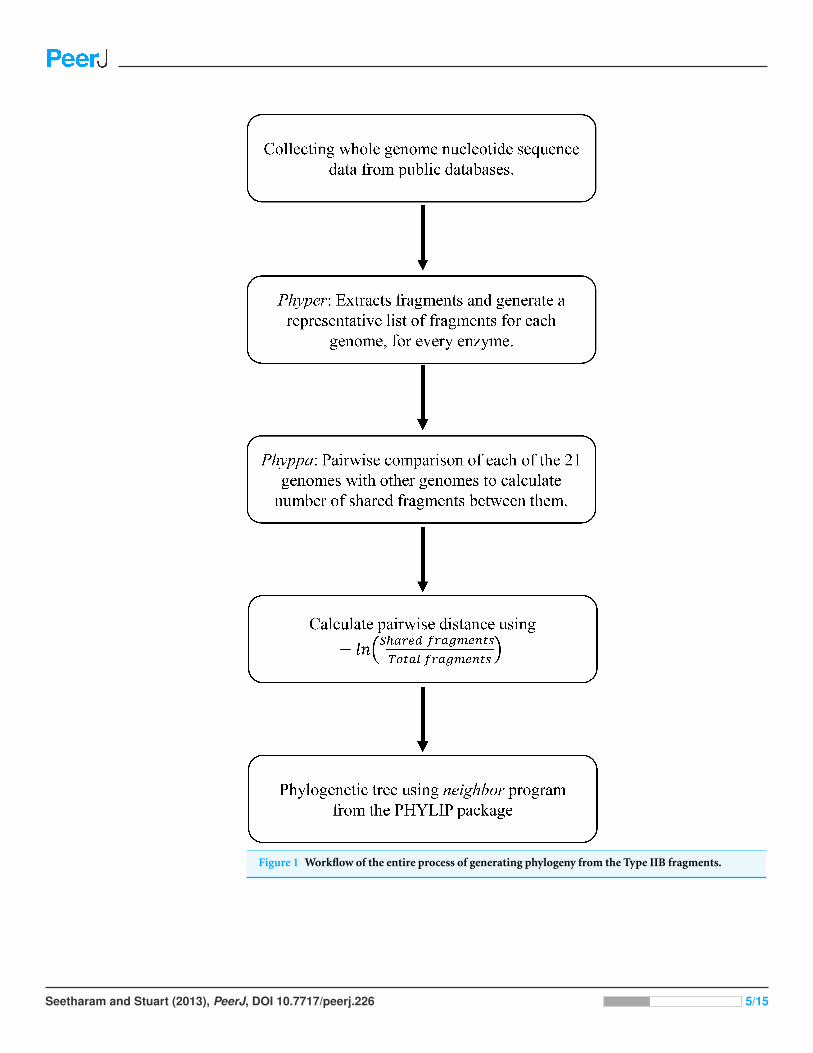
Figure 1 Workflow of the entire process of generating phylogeny from the Type IIB fragments.
Seetharam and Stuart (2013), PeerJ, DOI 10.7717/peerj.226 5/15
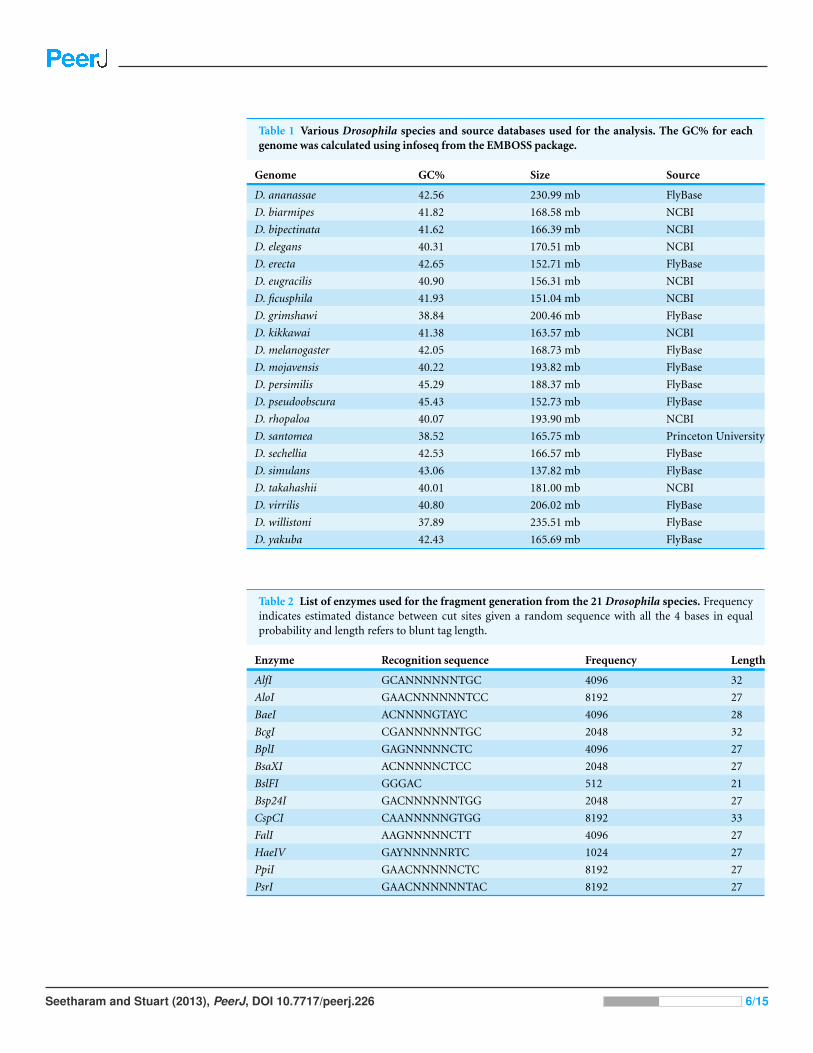
Table 1 Various Drosophila species and source databases used for the analysis. The GC% for eachgenome was calculated using infoseq from the EMBOSS package.
Genome GC% Size Source
D. ananassae 42.56 230.99 mb FlyBase
D. biarmipes 41.82 168.58 mb NCBI
D. bipectinata 41.62 166.39 mb NCBI
D. elegans 40.31 170.51 mb NCBI
D. erecta 42.65 152.71 mb FlyBase
D. eugracilis 40.90 156.31 mb NCBI
D. ficusphila 41.93 151.04 mb NCBI
D. grimshawi 38.84 200.46 mb FlyBase
D. kikkawai 41.38 163.57 mb NCBI
D. melanogaster 42.05 168.73 mb FlyBase
D. mojavensis 40.22 193.82 mb FlyBase
D. persimilis 45.29 188.37 mb FlyBase
D. pseudoobscura 45.43 152.73 mb FlyBase
D. rhopaloa 40.07 193.90 mb NCBI
D. santomea 38.52 165.75 mb Princeton University
D. sechellia 42.53 166.57 mb FlyBase
D. simulans 43.06 137.82 mb FlyBase
D. takahashii 40.01 181.00 mb NCBI
D. virrilis 40.80 206.02 mb FlyBase
D. willistoni 37.89 235.51 mb FlyBase
D. yakuba 42.43 165.69 mb FlyBase
Table 2 List of enzymes used for the fragment generation from the 21 Drosophila species. Frequencyindicates estimated distance between cut sites given a random sequence with all the 4 bases in equalprobability and length refers to blunt tag length.
Enzyme Recognition sequence Frequency Length
AlfI GCANNNNNNTGC 4096 32
AloI GAACNNNNNNTCC 8192 27
BaeI ACNNNNGTAYC 4096 28
BcgI CGANNNNNNTGC 2048 32
BplI GAGNNNNNCTC 4096 27
BsaXI ACNNNNNCTCC 2048 27
BslFI GGGAC 512 21
Bsp24I GACNNNNNNTGG 2048 27
CspCI CAANNNNNGTGG 8192 33
FalI AAGNNNNNCTT 4096 27
HaeIV GAYNNNNNRTC 1024 27
PpiI GAACNNNNNCTC 8192 27
PsrI GAACNNNNNNTAC 8192 27
Seetharam and Stuart (2013), PeerJ, DOI 10.7717/peerj.226 6/15
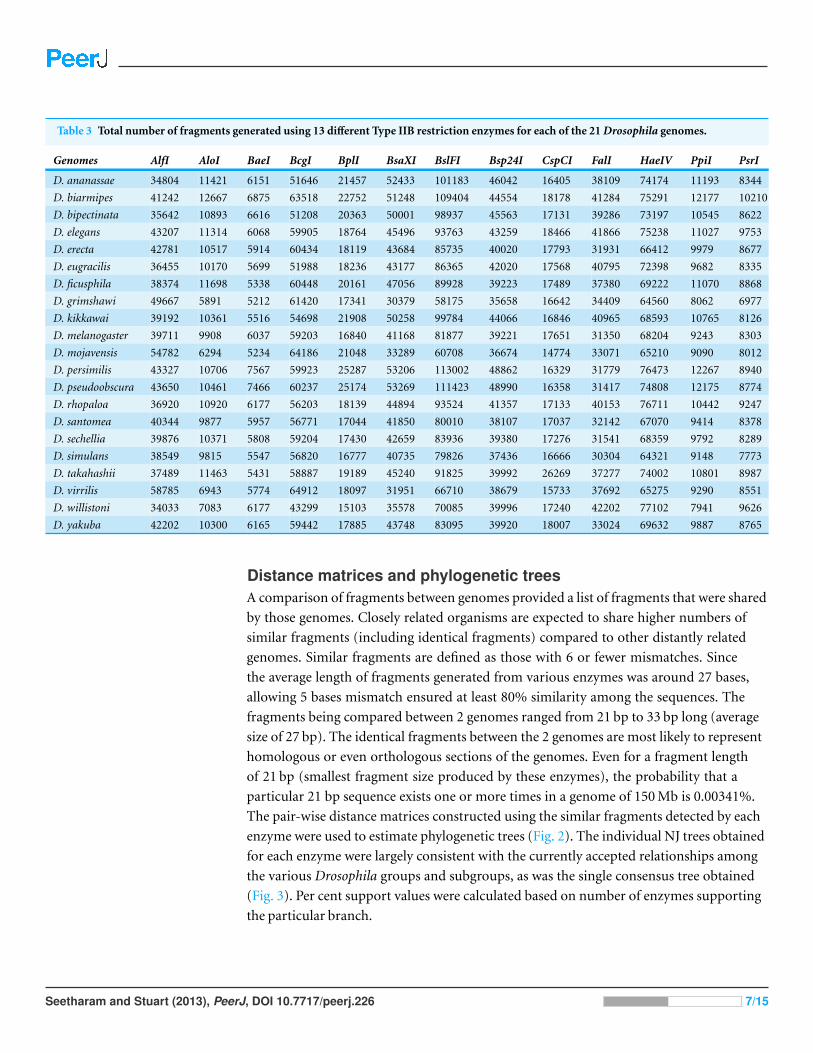
Table 3 Total number of fragments generated using 13 different Type IIB restriction enzymes for each of the 21 Drosophila genomes.
Genomes AlfI AloI BaeI BcgI BplI BsaXI BslFI Bsp24I CspCI FalI HaeIV PpiI PsrI
D. ananassae 34804 11421 6151 51646 21457 52433 101183 46042 16405 38109 74174 11193 8344
D. biarmipes 41242 12667 6875 63518 22752 51248 109404 44554 18178 41284 75291 12177 10210
D. bipectinata 35642 10893 6616 51208 20363 50001 98937 45563 17131 39286 73197 10545 8622
D. elegans 43207 11314 6068 59905 18764 45496 93763 43259 18466 41866 75238 11027 9753
D. erecta 42781 10517 5914 60434 18119 43684 85735 40020 17793 31931 66412 9979 8677
D. eugracilis 36455 10170 5699 51988 18236 43177 86365 42020 17568 40795 72398 9682 8335
D. ficusphila 38374 11698 5338 60448 20161 47056 89928 39223 17489 37380 69222 11070 8868
D. grimshawi 49667 5891 5212 61420 17341 30379 58175 35658 16642 34409 64560 8062 6977
D. kikkawai 39192 10361 5516 54698 21908 50258 99784 44066 16846 40965 68593 10765 8126
D. melanogaster 39711 9908 6037 59203 16840 41168 81877 39221 17651 31350 68204 9243 8303
D. mojavensis 54782 6294 5234 64186 21048 33289 60708 36674 14774 33071 65210 9090 8012
D. persimilis 43327 10706 7567 59923 25287 53206 113002 48862 16329 31779 76473 12267 8940
D. pseudoobscura 43650 10461 7466 60237 25174 53269 111423 48990 16358 31417 74808 12175 8774
D. rhopaloa 36920 10920 6177 56203 18139 44894 93524 41357 17133 40153 76711 10442 9247
D. santomea 40344 9877 5957 56771 17044 41850 80010 38107 17037 32142 67070 9414 8378
D. sechellia 39876 10371 5808 59204 17430 42659 83936 39380 17276 31541 68359 9792 8289
D. simulans 38549 9815 5547 56820 16777 40735 79826 37436 16666 30304 64321 9148 7773
D. takahashii 37489 11463 5431 58887 19189 45240 91825 39992 26269 37277 74002 10801 8987
D. virrilis 58785 6943 5774 64912 18097 31951 66710 38679 15733 37692 65275 9290 8551
D. willistoni 34033 7083 6177 43299 15103 35578 70085 39996 17240 42202 77102 7941 9626
D. yakuba 42202 10300 6165 59442 17885 43748 83095 39920 18007 33024 69632 9887 8765
Distance matrices and phylogenetic treesA comparison of fragments between genomes provided a list of fragments that were shared
by those genomes. Closely related organisms are expected to share higher numbers of
similar fragments (including identical fragments) compared to other distantly related
genomes. Similar fragments are defined as those with 6 or fewer mismatches. Since
the average length of fragments generated from various enzymes was around 27 bases,
allowing 5 bases mismatch ensured at least 80% similarity among the sequences. The
fragments being compared between 2 genomes ranged from 21 bp to 33 bp long (average
size of 27 bp). The identical fragments between the 2 genomes are most likely to represent
homologous or even orthologous sections of the genomes. Even for a fragment length
of 21 bp (smallest fragment size produced by these enzymes), the probability that a
particular 21 bp sequence exists one or more times in a genome of 150 Mb is 0.00341%.
The pair-wise distance matrices constructed using the similar fragments detected by each
enzyme were used to estimate phylogenetic trees (Fig. 2). The individual NJ trees obtained
for each enzyme were largely consistent with the currently accepted relationships among
the various Drosophila groups and subgroups, as was the single consensus tree obtained
(Fig. 3). Per cent support values were calculated based on number of enzymes supporting
the particular branch.
Seetharam and Stuart (2013), PeerJ, DOI 10.7717/peerj.226 7/15
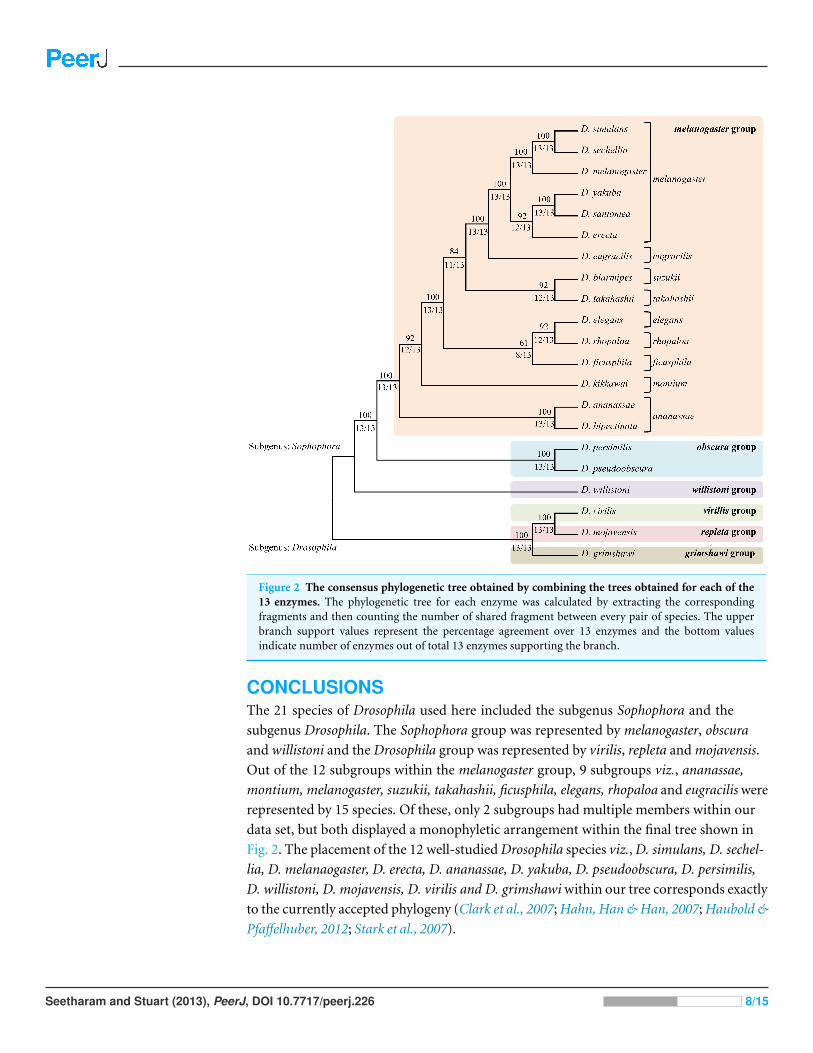
Figure 2 The consensus phylogenetic tree obtained by combining the trees obtained for each of the13 enzymes. The phylogenetic tree for each enzyme was calculated by extracting the correspondingfragments and then counting the number of shared fragment between every pair of species. The upperbranch support values represent the percentage agreement over 13 enzymes and the bottom valuesindicate number of enzymes out of total 13 enzymes supporting the branch.
CONCLUSIONSThe 21 species of Drosophila used here included the subgenus Sophophora and the
subgenus Drosophila. The Sophophora group was represented by melanogaster, obscura
and willistoni and the Drosophila group was represented by virilis, repleta and mojavensis.
Out of the 12 subgroups within the melanogaster group, 9 subgroups viz., ananassae,
montium, melanogaster, suzukii, takahashii, ficusphila, elegans, rhopaloa and eugracilis were
represented by 15 species. Of these, only 2 subgroups had multiple members within our
data set, but both displayed a monophyletic arrangement within the final tree shown in
Fig. 2. The placement of the 12 well-studied Drosophila species viz., D. simulans, D. sechel-
lia, D. melanaogaster, D. erecta, D. ananassae, D. yakuba, D. pseudoobscura, D. persimilis,
D. willistoni, D. mojavensis, D. virilis and D. grimshawi within our tree corresponds exactly
to the currently accepted phylogeny (Clark et al., 2007; Hahn, Han & Han, 2007; Haubold &
Pfaffelhuber, 2012; Stark et al., 2007).
Seetharam and Stuart (2013), PeerJ, DOI 10.7717/peerj.226 8/15
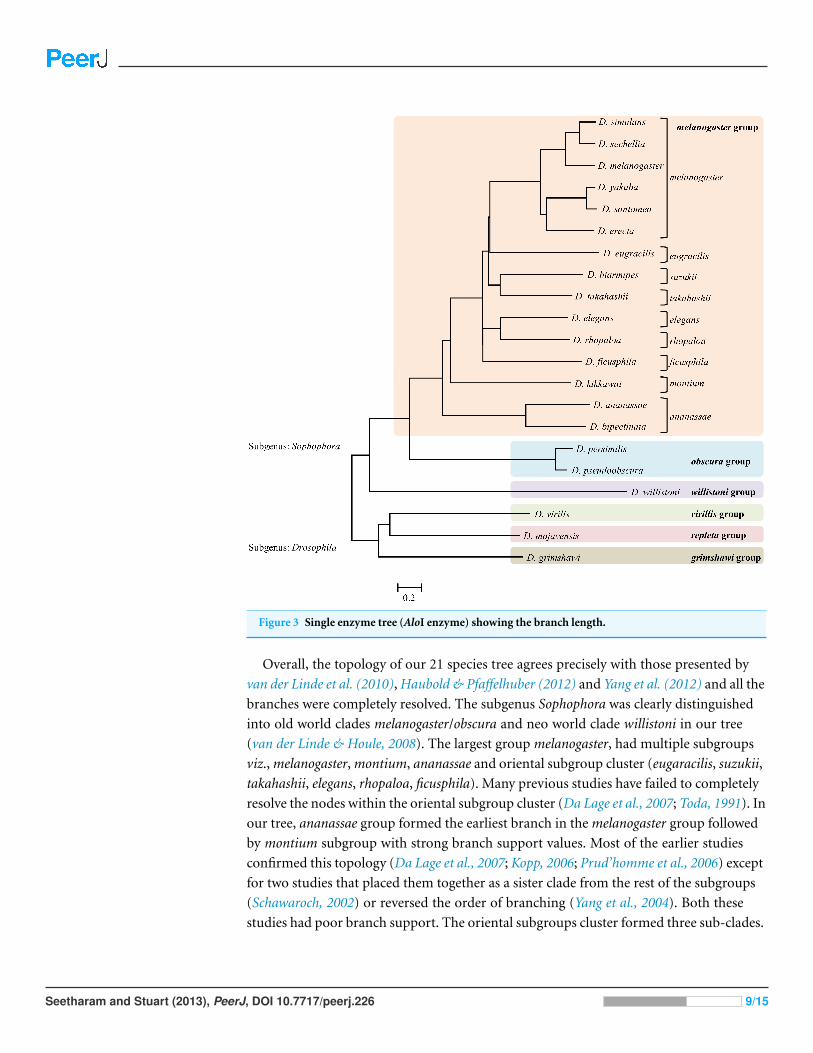
Figure 3 Single enzyme tree (AloI enzyme) showing the branch length.
Overall, the topology of our 21 species tree agrees precisely with those presented by
van der Linde et al. (2010), Haubold & Pfaffelhuber (2012) and Yang et al. (2012) and all the
branches were completely resolved. The subgenus Sophophora was clearly distinguished
into old world clades melanogaster/obscura and neo world clade willistoni in our tree
(van der Linde & Houle, 2008). The largest group melanogaster, had multiple subgroups
viz., melanogaster, montium, ananassae and oriental subgroup cluster (eugaracilis, suzukii,
takahashii, elegans, rhopaloa, ficusphila). Many previous studies have failed to completely
resolve the nodes within the oriental subgroup cluster (Da Lage et al., 2007; Toda, 1991). In
our tree, ananassae group formed the earliest branch in the melanogaster group followed
by montium subgroup with strong branch support values. Most of the earlier studies
confirmed this topology (Da Lage et al., 2007; Kopp, 2006; Prud’homme et al., 2006) except
for two studies that placed them together as a sister clade from the rest of the subgroups
(Schawaroch, 2002) or reversed the order of branching (Yang et al., 2004). Both these
studies had poor branch support. The oriental subgroups cluster formed three sub-clades.
Seetharam and Stuart (2013), PeerJ, DOI 10.7717/peerj.226 9/15

The first sub-clade included elegans and rhopaloa with ficusphila as the sister sub-group,
the second sub-clade included suzukii and takahashii and the third sub-clade included
the eugracilis sub-group. The placements of these sub-clades were controversial among
the literature surveyed and was attributed to the explosive radiation of these oriental
groups (van der Linde & Houle, 2008). The eugracilis clade consisting of D. eugracilis is
most inconsistently placed clade and it is either placed as sister species of melanogaster sub
group, as in our tree (Haubold & Pfaffelhuber, 2012; Pelandakis & Solignac, 1993; van der
Linde et al., 2010) or as sister species of the sub clade formed by suzukii and takahashii
(Yang et al., 2004) or as sister species of elegans and rhopaloa within the elegans — rhopaloa
— ficusphila clade (Yang et al., 2012). The placements of the other two clades, suzukii —
takahashii and elegans — rhopaloa — ficusphila within the melanogaster group in our tree is
in agreement with other published studies (Kopp, 2006; Kopp & True, 2002). The sub-clade
formed by suzukii and takahashii is well supported by most studies including ours with the
strong branch support (Da Lage et al., 2007; Kopp & True, 2002; Schawaroch, 2002; Yang et
al., 2004). Most studies have confirmed that the rhopaloa subgroup is the sister group of
the elegans subgroup but the ficusphila sub group is considered to be polytomic branching
clade in the melanogaster group (van der Linde & Houle, 2008). However, in our tree
ficusphila sub group is presented as the sister species of rhopaloa — elegans subgroups,
albeit with low branch support. Within the Drosophila subgenus, all three groups
(virilis, repleta and grimshawi) exhibited a topology frequently observed in other studies
(van der Linde & Houle, 2008).
A variety of sub-genomic sampling methods have been used previously for population
studies and are especially effective on non-model organisms, but are rarely used for
generating phylogenies for a diverse set of distinct species. We show here that multi-locus
data obtained from short sub-genomic fragment sets, essentially 2b-RAD, provides good
phylogenetic signal and produces a well resolved and well-supported species phylogeny.
The wide adoption of various RAD-like methods is due to the fact that deep sequencing
of the fragments produced can be easily accomplished following two simple steps: adapter
ligation, and then PCR. These methods are applicable to any organism irrespective of
its genome size. The 2b-RAD approach to fragment generation and characterization
in particular is simple, quick and cost effective (Wang et al., 2012). This method also
shares some similarity with the recently described, alignment free multi-locus “co-phylog”
method (Yi & Jin, 2013). Both use a large number of short homologous fragments and,
consequently, both can be profitably applied to short sequence reads derived via next
generation sequencing, even prior to assembly. However, the co-phylog method is distinct
in that it makes use of standard alignment algorithms applied to each locus to generate
estimates of relatedness for building phylogenies. Effective application of the co-phylog
method generally requires that the genomes being compared be closely related, and
this would be expected to be true for our method as well, since effective matching of
homologous short fragments in either case requires a significant degree of local sequence
similarity. Despite this expected limitation, we note that the Drosophila species compared
herein are relatively diverse, spanning approximately 40–50 million years of evolution.
Seetharam and Stuart (2013), PeerJ, DOI 10.7717/peerj.226 10/15

ADDITIONAL INFORMATION AND DECLARATIONS
FundingThis work was supported by the Graduate Student Assistantship from the Biology
Department and School of Graduate Studies, Indiana State University, held by Arun
Seetharam. The funders had no role in study design, data collection and analysis, decision
to publish, or preparation of the manuscript.
Grant DisclosuresThe following grant information was disclosed by the authors:
Graduate Student Assistantship from the Biology Department and School of Graduate
Studies, Indiana State University.
Competing InterestsThe authors declare they have no competing interests.
Author Contributions• Arun S. Seetharam performed the experiments, analyzed the data, wrote the paper.
• Gary W. Stuart conceived and designed the experiments, contributed
reagents/materials/analysis tools, wrote the paper.
REFERENCESBaird NA, Etter PD, Atwood TS, Currey MC, Shiver AL, Lewis ZA, Selker EU, Cresko WA,
Johnson EA. 2008. Rapid SNP discovery and genetic mapping using sequenced RAD markers.PLoS ONE 3:e3376 DOI 10.1371/journal.pone.0003376.
Baxter SW, Davey JW, Johnston JS, Shelton AM, Heckel DG, Jiggins CD, Blaxter ML. 2011.Linkage mapping and comparative genomics using next-generation RAD sequencing of anon-model organism. PLoS ONE 6:e19315 DOI 10.1371/journal.pone.0019315.
Bourque G, Pevzner PA. 2002. Genome-scale evolution: reconstructing gene orders in theancestral species. Genome Research 12:26–36.
Clark A, Eisen M, Smith D, Bergman C, Oliver B, Markow T, Kaufman T, Kellis M, Gelbart W,Iyer V, Pollard D, Sackton T, Larracuente A, Singh N, Abad J, Abt D, Adryan B, Aguade M,Akashi H, Anderson W, Aquadro C, Ardell D, Arguello R, Artieri C, Barbash D, Barker D,Barsanti P, Batterham P, Batzoglou S, Begun D, Bhutkar A, Blanco E, Bosak S, Bradley R,Brand A, Brent M, Brooks A, Brown R, Butlin R, Caggese C, Calvi B, Bernardo deCarvalho A, Caspi A, Castrezana S, Celniker S, Chang J, Chapple C, Chatterji S, Chinwalla A,Civetta A, Clifton S, Comeron J, Costello J, Coyne J, Daub J, David R, Delcher A,Delehaunty K, Do C, Ebling H, Edwards K, Eickbush T, Evans J, Filipski A, Findeiss S,Freyhult E, Fulton L, Fulton R, Garcia A, Gardiner A, Garfield D, Garvin B, Gibson G,Gilbert D, Gnerre S, Godfrey J, Good R, Gotea V, Gravely B, Greenberg A, Griffiths-Jones S,Gross S, Guigo R, Gustafson E, Haerty W, Hahn M, Halligan D, Halpern A, Halter G, Han M,Heger A, Hillier L, Hinrichs A, Holmes I, Hoskins R, Hubisz M, Hultmark D, Huntley M,Jaffe D, Jagadeeshan S, Jeck W, Johnson J, Jones C, Jordan W, Karpen G, Kataoka E,Keightley P, Kheradpour P, Kirkness E, Koerich L, Kristiansen K, Kudrna D, Kulathinal R,
Seetharam and Stuart (2013), PeerJ, DOI 10.7717/peerj.226 11/15

Kumar S, Kwok R, Lander E, Langley C, Lapoint R, Lazzaro B, Lee S, Levesque L, Li R, Lin C,Lin M, Lindblad-Toh K, Llopart A, Long M, Low L, Lozovsky E, Lu J, Luo M, Machado C,Makalowski W, Marzo M, Matsuda M, Matzkin L, McAllister B, McBride C, McKernan B,McKernan K, Mendez-Lago M, Minx P, Mollenhauer M, Montooth K, Mount S, Mu X,Myers E, Negre B, Newfeld S, Nielsen R, Noor M, O’Grady P, Pachter L, Papaceit M, Parisi M,Parisi M, Parts L, Pedersen J, Pesole G, Phillippy A, Ponting C, Pop M, Porcelli D, Powell J,Prohaska S, Pruitt K, Puig M, Quesneville H, Ram K, Rand D, Rasmussen M, Reed L,Reenan R, Reily A, Remington K, Rieger T, Ritchie M, Robin C, Rogers Y, Rohde C, Rozas J,Rubenfield M, Ruiz A, Russo S, Salzberg S, Sanchez-Gracia A, Saranga D, Sato H, Schaeffer S,Schatz M, Schlenke T, Schwartz R, Segarra C, Singh R, Sirot L, Sirota M, Sisneros N,Smith C, Smith T, Spieth J, Stage D, Stark A, Stephan W, Strausberg R, Strempel S,Sturgill D, Sutton G, Sutton G, Tao W, Teichmann S, Tobari Y, Tomimura Y, Tsolas J,Valente V, Venter E, Venter J, Vicario S, Vieira F, Vilella A, Villasante A, Walenz B, Wang J,Wasserman M, Watts T, Wilson D, Wilson R, Wing R, Wolfner M, Wong A, Wong G, Wu C,Wu G, Yamamoto D, Yang H, Yang S, Yorke J, Yoshida K, Zdobnov E, Zhang P, Zhang Y,Zimin A, Baldwin J, Abdouelleil A, Abdulkadir J, Abebe A, Abera B, Abreu J, Acer S,Aftuck L, Alexander A, An P, Anderson E, Anderson S, Arachi H, Azer M, Bachantsang P,Barry A, Bayul T, Berlin A, Bessette D, Bloom T, Blye J, Boguslavskiy L, Bonnet C,Boukhgalter B, Bourzgui I, Brown A, Cahill P, Channer S, Cheshatsang Y, Chuda L,Citroen M, Collymore A, Cooke P, Costello M, D’Aco K, Daza R, De Haan G, DeGray S,DeMaso C, Dhargay N, Dooley K, Dooley E, Doricent M, Dorje P, Dorjee K, Dupes A,Elong R, Falk J, Farina A, Faro S, Ferguson D, Fisher S, Foley C, Franke A, Friedrich D,Gadbois L, Gearin G, Gearin C, Giannoukos G, Goode T, Graham J, Grandbois E,Grewal S, Gyaltsen K, Hafez N, Hagos B, Hall J, Henson C, Hollinger A, Honan T, Huard M,Hughes L, Hurhula B, Husby M, Kamat A, Kanga B, Kashin S, Khazanovich D, Kisner P,Lance K, Lara M, Lee W, Lennon N, Letendre F, LeVine R, Lipovsky A, Liu X, Liu J, Liu S,Lokyitsang T, Lokyitsang Y, Lubonja R, Lui A, MacDonald P, Magnisalis V, Maru K,Matthews C, McCusker W, McDonough S, Mehta T, Meldrim J, Meneus L, Mihai O,Mihalev A, Mihova T, Mittelman R, Mlenga V, Montmayeur A, Mulrain L, Navidi A,Naylor J, Negash T, Nguyen T, Nguyen N, Nicol R, Norbu C, Norbu N, Novod N, O’Neill B,Osman S, Markiewicz E, Oyono O, Patti C, Phunkhang P, Pierre F, Priest M, Raghuraman S,Rege F, Reyes R, Rise C, Rogov P, Ross K, Ryan E, Settipalli S, Shea T, Sherpa N, Shi L,Shih D, Sparrow T, Spaulding J, Stalker J, Stange-Thomann N, Stavropoulos S, Stone C,Strader C, Tesfaye S, Thomson T, Thoulutsang Y, Thoulutsang D, Topham K, Topping I,Tsamla T, Vassiliev H, Vo A, Wangchuk T, Wangdi T, Weiand M, Wilkinson J, Wilson A,Yadav S, Young G, Yu Q, Zembek L, Zhong D, Zimmer A, Zwirko Z, Alvarez P, Brockman W,Butler J, Chin C, Grabherr M, Kleber M, Mauceli E, MacCallum I. 2007. Evolution of genesand genomes on the Drosophila phylogeny. Nature 450:203–218 DOI 10.1038/nature06341.
Da Lage JL, Kergoat GJ, Maczkowiak F, Silvain JF, Cariou ML, Lachaise D. 2007. A phylogeny ofDrosophilidae using the Amyrel gene: questioning the Drosophila melanogaster species groupboundaries [Une phylogenie des Drosophilidae avec le gene Amyrel: remise en question deslimites du groupe d’especes Drosophila melanogaster]. Journal of Zoological Systematics andEvolutionary Research 45:47–63 DOI 10.1111/j.1439-0469.2006.00389.x.
Davey JW, Blaxter ML. 2010. RADSeq: next-generation population genetics. Briefings inFunctional Genomics 9:416–423 DOI 10.1093/bfgp/elq031.
Delsuc F, Brinkmann H, Philippe H. 2005. Phylogenomics and the reconstruction of the tree oflife. Nature Reviews Genetics 6:361–375 DOI 10.1038/nrg1603.
Seetharam and Stuart (2013), PeerJ, DOI 10.7717/peerj.226 12/15
Dunn JJ, McCorkle SR, Praissman LA, Hind G, Van Der Lelie D, Bahou WF, Gnatenko DV,Krause MK. 2002. Genomic signature tags (GSTs): a system for profiling genomic DNA.Genome Research 12:1756–1765 DOI 10.1101/gr.306102.
Emerson KJ, Merz CR, Catchen JM, Hohenlohe PA, Cresko WA, Bradshaw WE, Holzapfel CM.2010. Resolving postglacial phylogeography using high-throughput sequencing. Proceedingsof the National Academy of Sciences of the United States of America 107:16196–16200DOI 10.1073/pnas.1006538107.
Etter PD, Bassham S, Hohenlohe PA, Johnson EA, Cresko WA. 2011. SNP discovery andgenotyping for evolutionary genetics using RAD sequencing. Methods in Molecular Biology772:157–178.
Felsenstein J. 2005. PHYLIP (Phylogeny Inference Package) In: author Db, editor. 3.6. ed.
Hahn MW, Han MV, Han SG. 2007. Gene family evolution across 12 Drosophila genomes. PLoSGenetics 3:e197 DOI 10.1371/journal.pgen.0030197.
Haubold B, Pfaffelhuber P. 2012. Alignment-free population genomics: an efficient estimator ofsequence diversity. G3 2:883–889 DOI 10.1534/g3.112.002527.
Hohenlohe PA, Bassham S, Etter PD, Stiffler N, Johnson EA, Cresko WA. 2010. Populationgenomics of parallel adaptation in threespine stickleback using sequenced RAD tags. PLoSGenetics 6:e1000862 DOI 10.1371/journal.pgen.1000862.
Huson DH, Steel M. 2004. Phylogenetic trees based on gene content. Bioinformatics 20:2044–2049DOI 10.1093/bioinformatics/bth198.
Kopp A. 2006. Basal relationships in the Drosophila melanogaster species group. MolecularPhylogenetics and Evolution 39:787–798 DOI 10.1016/j.ympev.2006.01.029.
Kopp A, True JR. 2002. Phylogeny of the Oriental Drosophila melanogaster species group: amultilocus reconstruction. Systematic Biology 51:786–805 DOI 10.1080/10635150290102410.
Korbel JO, Snel B, Huynen MA, Bork P. 2002. SHOT: a web server for the construction of genomephylogenies. Trends in Genetics 18:158–162 DOI 10.1016/S0168-9525(01)02597-5.
Lin J, Gerstein M. 2000. Whole-genome trees based on the occurrence of folds and orthologs:implications for comparing genomes on different levels. Genome Research 10:808–818DOI 10.1101/gr.10.6.808.
McQuilton P, St Pierre SE, Thurmond J. 2012. FlyBase 101-the basics of navigating FlyBase.Nucleic Acids Research 40:D706–D714 DOI 10.1093/nar/gkr1030.
Pelandakis M, Solignac M. 1993. Molecular phylogeny of Drosophila based on ribosomal RNAsequences. Journal of Molecular Evolution 37:525–543 DOI 10.1007/BF00160433.
Peterson BK, Weber JN, Kay EH, Fisher HS, Hoekstra HE. 2012. Double digest RADseq: aninexpensive method for de novo SNP discovery and genotyping in model and non-modelspecies. PLoS ONE 7:e37135 DOI 10.1371/journal.pone.0037135.
Prud’homme B, Gompel N, Rokas A, Kassner VA, Williams TM, Yeh S-D, True JR, Carroll SB.2006. Repeated morphological evolution through cis-regulatory changes in a pleiotropic gene.Nature 440:1050–1053 DOI 10.1038/nature04597.
Qi J, Luo H, Hao B. 2004. CVTree: a phylogenetic tree reconstruction tool based on wholegenomes. Nucleic Acids Research 32:45–47 DOI 10.1093/nar/gkh362.
Rebeiz M, Ramos-Womack M, Jeong S, Andolfatto P, Werner T, True J, Stern DL, Carroll SB.2009. Evolution of the tan locus contributed to pigment loss in Drosophila santomea: a responseto Matute et al. Cell 139:1189–1196 DOI 10.1016/j.cell.2009.11.004.
Seetharam and Stuart (2013), PeerJ, DOI 10.7717/peerj.226 13/15
Roberts RJ, Belfort M, Bestor T, Bhagwat AS, Bickle TA, Bitinaite J, Blumenthal RM,Degtyarev S, Dryden DT, Dybvig K, Firman K, Gromova ES, Gumport RI, Halford SE,Hattman S, Heitman J, Hornby DP, Janulaitis A, Jeltsch A, Josephsen J, Kiss A,Klaenhammer TR, Kobayashi I, Kong H, Kruger DH, Lacks S, Marinus MG, Miyahara M,Morgan RD, Murray NE, Nagaraja V, Piekarowicz A, Pingoud A, Raleigh E, Rao DN,Reich N, Repin VE, Selker EU, Shaw PC, Stein DC, Stoddard BL, Szybalski W, Trautner TA,Van Etten JL, Vitor JM, Wilson GG, Xu SY. 2003a. A nomenclature for restriction enzymes,DNA methyltransferases, homing endonucleases and their genes. Nucleic Acids Research31:1805–1812 DOI 10.1093/nar/gkg274.
Roberts RJ, Belfort M, Bestor T, Bhagwat AS, Bickle TA, Bitinaite J, Blumenthal RM,Degtyarev S, Dryden DT, Dybvig K, Firman K, Gromova ES, Gumport RI, Halford SE,Hattman S, Heitman J, Hornby DP, Janulaitis A, Jeltsch A, Josephsen J, Kiss A,Klaenhammer TR, Kobayashi I, Kong H, Kruger DH, Lacks S, Marinus MG, Miyahara M,Morgan RD, Murray NE, Nagaraja V, Piekarowicz A, Pingoud A, Raleigh E, Rao DN,Reich N, Repin VE, Selker EU, Shaw PC, Stein DC, Stoddard BL, Szybalski W, Trautner TA,Van Etten JL, Vitor JM, Wilson GG, Xu SY. 2003b. A nomenclature for restriction enzymes,DNA methyltransferases, homing endonucleases and their genes. Nucleic Acids Research31:1805–1812 DOI 10.1093/nar/gkg274.
Roy SW, Gilbert W. 2005. Resolution of a deep animal divergence by the pattern of intronconservation. Proceedings of the National Academy of Sciences of the United States of America102:4403–4408 DOI 10.1073/pnas.0409891102.
Rubin BE, Ree RH, Moreau CS. 2012. Inferring phylogenies from RAD sequence data. PLoS ONE7:e33394 DOI 10.1371/journal.pone.0033394.
Schawaroch V. 2002. Phylogeny of a paradigm lineage: the Drosophila melanogaster species group(Diptera: Drosophilidae). Biological Journal of the Linnean Society 76:21–37DOI 10.1111/j.1095-8312.2002.tb01711.x.
Snel B, Bork P, Huynen MA. 1999. Genome phylogeny based on gene content. Nature Genetics21:108–110 DOI 10.1038/5052.
Stark A, Lin MF, Kheradpour P, Pedersen JS, Parts L, Carlson JW, Crosby MA, Rasmussen MD,Roy S, Deoras AN, Ruby JG, Brennecke J, Hodges E, Hinrichs AS, Caspi A, Paten B, Park SW,Han MV, Maeder ML, Polansky BJ, Robson BE, Aerts S, van Helden J, Hassan B, Gilbert DG,Eastman DA, Rice M, Weir M, Hahn MW, Park Y, Dewey CN, Pachter L, Kent WJ,Haussler D, Lai EC, Bartel DP, Hannon GJ, Kaufman TC, Eisen MB, Clark AG, Smith D,Celniker SE, Gelbart WM, Kellis M. 2007. Discovery of functional elements in 12 Drosophilagenomes using evolutionary signatures. Nature 450:219–232 DOI 10.1038/nature06340.
Stebbins GL. 1950. Variation and evolution in plants. NY: Columbia University Press.
Stuart GW, Moffett K, Leader JJ. 2002. A comprehensive vertebrate phylogeny using vectorrepresentations of protein sequences from whole genomes. Molecular Biology and Evolution19:554–562 DOI 10.1093/oxfordjournals.molbev.a004111.
Tekaia F, Lazcano A, Dujon B. 1999. The genomic tree as revealed from whole proteomecomparisons. Genome Research 9:550–557.
Tengs T, LaFramboise T, Den RB, Hayes DN, Zhang J, DebRoy S, Gentleman RC, O’Neill K,Birren B, Meyerson M. 2004. Genomic representations using concatenates of TypeIIB restriction endonuclease digestion fragments. Nucleic Acids Research 32:e121DOI 10.1093/nar/gnh120.
Seetharam and Stuart (2013), PeerJ, DOI 10.7717/peerj.226 14/15
Toda MJ. 1991. Drosophilidae (Diptera) in Myanmar (Burma) VII. The Drosophila melanogasterspecies-group, excepting the D. montium species-subgroup. Oriental Insects 25:69–94DOI 10.1080/00305316.1991.10432216.
van der Linde K, Houle D. 2008. A supertree analysis and literature review of the genus Drosophilaand closely related genera (Diptera, Drosophilidae). Insect Systematics & Evolution 39:241–267DOI 10.1163/187631208788784237.
van der Linde K, Houle D, Spicer GS, Steppan SJ. 2010. A supermatrix-based molecularphylogeny of the family Drosophilidae. Genome Research 92:25–38.
van Orsouw NJ, Hogers RC, Janssen A, Yalcin F, Snoeijers S, Verstege E, Schneiders H,van der Poel H, van Oeveren J, Verstegen H, van Eijk MJ. 2007. Complexity reduction ofpolymorphic sequences (CRoPS): a novel approach for large-scale polymorphism discoveryin complex genomes. PLoS ONE 2:e1172 DOI 10.1371/journal.pone.0001172.
Wang S, Meyer E, McKay JK, Matz MV. 2012. 2b-RAD: a simple and flexible method forgenome-wide genotyping. Nature Methods 9:808–810 DOI 10.1038/nmeth.2023.
Yang S, Doolittle RF, Bourne PE. 2005. Phylogeny determined by protein domain content.Proceedings of the National Academy of Sciences of the United States of America 102:373–378DOI 10.1073/pnas.0408810102.
Yang Y, Hou ZC, Qian YH, Kang H, Zeng QT. 2012. Increasing the data size to accuratelyreconstruct the phylogenetic relationships between nine subgroups of the Drosophilamelanogaster species group (Drosophilidae, Diptera). Molecular Phylogenetics and Evolution62:214–223 DOI 10.1016/j.ympev.2011.09.018.
Yang Y, Zhang YP, Qian YH, Zeng QT. 2004. Phylogenetic relationships of Drosophilamelanogaster species group deduced from spacer regions of histone gene H2A-H2B. MolecularPhylogenetics and Evolution 30:336–343 DOI 10.1016/S1055-7903(03)00212-4.
Yi H, Jin L. 2013. Co-phylog: an assembly-free phylogenomic approach for closely relatedorganisms. Nucleic Acids Research 41:e75 DOI 10.1093/nar/gkt003.
Seetharam and Stuart (2013), PeerJ, DOI 10.7717/peerj.226 15/15