whole-body gene expression pattern registration - springer · research open access whole-body gene...
TRANSCRIPT
Whole-body gene expression pattern registrationin Platynereis larvaeAsadulina et al.
Asadulina et al. EvoDevo 2012, 3:27http://www.evodevojournal.com/content/3/1/27

Asadulina et al. EvoDevo 2012, 3:27http://www.evodevojournal.com/content/3/1/27
RESEARCH Open Access
Whole-body gene expression pattern registrationin Platynereis larvaeAlbina Asadulina, Aurora Panzera, Csaba Verasztó, Christian Liebig and Gáspár Jékely*
Abstract
Background: Digital anatomical atlases are increasingly used in order to depict different gene expression patternsand neuronal morphologies within a standardized reference template. In evo-devo, a discipline in which thecomparison of gene expression patterns is a widely used approach, such standardized anatomical atlases wouldallow a more rigorous assessment of the conservation of and changes in gene expression patterns during micro-and macroevolutionary time scales. Due to its small size and invariant early development, the annelid Platynereisdumerilii is particularly well suited for such studies. Recently a reference template with registered gene expressionpatterns has been generated for the anterior part (episphere) of the Platynereis trochophore larva and used for thedetailed study of neuronal development.
Results: Here we introduce and evaluate a method for whole-body gene expression pattern registration forPlatynereis trochophore and nectochaete larvae based on whole-mount in situ hybridization, confocal microscopy,and image registration. We achieved high-resolution whole-body scanning using the mounting medium2,2’-thiodiethanol (TDE), which allows the matching of the refractive index of the sample to that of glass andimmersion oil thereby reducing spherical aberration and improving depth penetration. This approach allowed us toscan entire whole-mount larvae stained with nitroblue tetrazolium/5-bromo-4-chloro-3-indolyl phosphate(NBT/BCIP) in situ hybridization and counterstained fluorescently with an acetylated-tubulin antibody and thenuclear stain 4’6-diamidino-2-phenylindole (DAPI). Due to the submicron isotropic voxel size whole-mount larvaecould be scanned in any orientation. Based on the whole-body scans, we generated four different referencetemplates by the iterative registration and averaging of 40 individual image stacks using either the acetylated-tubulin or the nuclear-stain signal for each developmental stage. We then registered to these templates theexpression patterns of cell-type specific genes. In order to evaluate the gene expression pattern registration, weanalyzed the absolute deviation of cell-center positions. Both the acetylated-tubulin- and the nuclear-stain-basedtemplates allowed near-cellular-resolution gene expression registration. Nuclear-stain-based templates oftenperformed significantly better than acetylated-tubulin-based templates. We provide detailed guidelines and scriptsfor the use and further expansion of the Platynereis gene expression atlas.
Conclusions: We established whole-body reference templates for the generation of gene expression atlases forPlatynereis trochophore and nectochaete larvae. We anticipate that nuclear-staining-based image registration will beapplicable for whole-body alignment of the embryonic and larval stages of other organisms in a similar size range.
* Correspondence: [email protected] Planck Institute for Developmental Biology, Spemannstrasse 35,Tübingen 72076, Germany
© 2012 Asadulina et al.; licensee BioMed Central Ltd. This is an Open Access article distributed under the terms of the CreativeCommons Attribution License (http://creativecommons.org/licenses/by/2.0), which permits unrestricted use, distribution, andreproduction in any medium, provided the original work is properly cited.
Asadulina et al. EvoDevo 2012, 3:27 Page 2 of 12http://www.evodevojournal.com/content/3/1/27
BackgroundThree-dimensional digital anatomical atlases represent bio-logical structures within a reference space, and can providemorphological, molecular and functional information forthe components of these structures. Atlases are used torepresent specimens that possess the same set of morpho-logical features, such as embryos of the same developmen-tal stage or adult brains with stereotypic morphology [1,2].Such atlases can visualize complex anatomical relations orprovide a reference for inter-individual and inter-speciescomparisons (for example, sexual dimorphism) [3,4]. Thegeneration of atlases requires volume imaging using a mar-ker that visualizes the entire structure of a specimen (forexample, DNA stains, immunostaining of all synapses).Atlases show their full potential when data can be
compiled across several individuals labeled or manipu-lated in various ways. The mapping of additional featuresto the reference template requires co-labeling of thespecimens with the reference marker and the markers ofinterest. Markers can include neuron-filling dyes labelingindividual neurons [5-7], fluorescent proteins expressedin a subset of cells by transgenic techniques [8], or geneexpression patterns visualized by in situ hybridization[9-11], immunostaining [10], or transgenic techniques[1]. Digital atlases overcome the limitations of traditionalsingle- or multicolor labeling light microscopy methodsthat are often restricted in the number of channels(genes, cells) that can be simultaneously detected (an ex-ception is the Brainbow technology [12]).When the morphology of individual neurons is pro-
jected onto a reference template, such a representationcan give insights into the organization of neural circuitsand their influence on behavior [3,5,6,8]. The representa-tion of multiple gene expression patterns in a commonreference can elucidate gene regulatory interactions [10],inter-individual variation in gene expression [1], or re-veal the ‘molecular fingerprint’ of neuron types, allowingevolutionary comparisons [11]. Such gene expression at-lases have been generated for Drosophila [10], mouse[9], chicken [13], zebrafish [14] and the marine annelidPlatynereis [11].The integration of imaging data acquired across
multiple individuals and experiments requires sophisti-cated image registration techniques. Simple superimpos-ition would be insufficient due to variations inmorphology and experimental conditions. The imageregistration methods can be classified as ‘voxel value-based’ [9,11,15] or ‘segmentation-based’ [1-3,7,10]. Inthe voxel value-based methods, the registration proced-ure relies on a metric calculated from pixel intensities(for example, mutual information [16]). For the registra-tion procedure, the stained axonal scaffold or neuropil[8,11], nuclear stain [14], or differential interference con-trast (DIC) images [9] can be used as a reference signal.
Segmentation-based registration methods require theprior segmentation and annotation of objects [17]. Thecorresponding segmented objects from the individualimages then determine the transformations that shouldbe applied. For segmentation, either cells expressing amarker gene [10], stained nuclei combined with a trans-genic muscle label [2], or other anatomical structures [3]can serve as a reference.Image registration protocols usually start with coarse,
rigid registration that is further refined by non-rigidregistration. For example, the virtual insect brain (VIB)protocol [1] begins with global and local rigid registra-tion, refined by non-rigid registration. This protocol wasused to generate brain atlases for the fruit fly (Drosophilamelanogaster) [1], the sphinx moth (Manduca sexta) [3],the flour beetle (Tribolium castaneum) [4], and the des-ert locust (Schistocerca gregaria) [6]. Another imageregistration protocol, the iterative shape-averagingmethod (ISO) [5], starts with affine registration followedby iterative non-rigid registration. This protocol was usedto generate atlases for the honeybee (Apis mellifera) [5],the desert locust (S. gregaria) [6] and the tobaccobudworm (Heliothis virescens) [7].A similar protocol was applied for the registration
of the gene expression patterns in Platynereis [11,15].This voxel value-based method applied rigid and af-fine transformations followed by B-Spline deformabletransformation, as implemented in the Insight Toolkit(ITK), an open-source tool for image analysis [18].The reference signal used in this protocol was thelarval axonal scaffold and ciliary bands stained withan acetylated-tubulin antibody.In Platynereis, image registration has to date been res-
tricted to the trochophore (48 hours post fertilization, hpf)larval episphere, due to the limited depth-penetrationachieved by using imaging setups with refractive indexmismatches (for example, glycerol mounting with an oilimmersion objective). Here we push confocal microscopycloser to its depth-limit by using the mounting medium2,2′-thiodiethanol (TDE) with a refractive index matchedto that of glass and immersion oil [19]. The use of TDEenabled us to perform high-quality whole-body scans onPlatynereis trochophore (48 hpf) and nectochaete (72 hpf)larvae using isotropic voxel size. Isotropic voxel size alsoalleviated the need for precise body orientation, allowingus to scan and register larvae in any orientation. Thesewhole-body scans were first oriented along their antero-posterior (AP) and dorso-ventral (DV) axes based onanatomical landmarks using a problem-specific algorithmdeveloped in ImageJ [20]. The oriented larval images werethen registered with ITK using either the nuclear stainDAPI, or acetylated tubulin, as the reference signal.We developed reference templates for 48 and 72 hpflarvae and demonstrated, using several marker genes,

Asadulina et al. EvoDevo 2012, 3:27 Page 3 of 12http://www.evodevojournal.com/content/3/1/27
that the registration method allows near-cellular-reso-lution registration. We also compared the accuracy ofthe different templates, finding that the nuclear-staintemplate often outperforms the tubulin template. Weprovide detailed instructions and scripts to allow theuse of our registration protocol in Platynereis, and tofacilitate its transfer to other organisms. This workprovides the foundation for the development of anear-cellular-resolution whole-body gene expressionatlas for Platynereis larvae.
MethodsIn situ hybridization and mounting procedureIn situ hybridization using nitroblue tetrazolium (NBT)/5-bromo-4-chloro-3-indolyl phosphate (BCIP) stainingcombined with anti-acetylated-tubulin and DAPI stain-ing was performed as previously described [21], withslight modifications ([see Additional file 1] and [22]).Following in situ hybridization, larvae were transferredinto 97% TDE diluted with PBS plus 0.2% Tween. Larvaewere placed on a glass slide with several layers (three tofive) of adhesive tape on both sides, forming a chamberwith the coverslip.
MicroscopyImaging was performed with an Olympus FV1000 con-focal system on an IX81 inverted microscope using anUPlanSApo 60× Oil objective with 1.35 N.A. and 0.15mm working distance (Olympus Deutschland GmbH,Hamburg, Germany). For excitation we used 405, 559and 635 nm diode lasers. Three-channel excitation wasperformed simultaneously and emission light passedthrough a 405/488/559/635 main dichroic beam splitterand through a pinhole of diameter 120 μm before goingto the detection module. Fluorescent light was split intothree beams directed to three PMTs by the secondary di-chroic filters 490 and 640. Channel 1 for DAPI detectionhad a further 425 to 475 band-pass filter, channel 2 forTRITC detection had a 570 to 625 band-pass filter andchannel 3 for the detection of NBT/BCIP had a 780long-pass filter. Images were scanned with 1.0× zoomand recorded as 512 × 512 pixels corresponding to apixel size of 0.414 μm × 0.414 μm. The entire volume ofthe larvae was scanned with a z-step size of 0.41 μm, inorder to have an isotropic voxel size. This pixel size isabove the X-Y optical resolution (approximately 0.23 μmfor our system), but is small enough to provide goodresolution, tolerable scanning times and minimal bleach-ing. We chose to use an isotropic voxel size to allow thescanning of larvae in any orientation. Using a Z-step of0.41 μm (the Z-resolution is approximately 1 μm), alllarvae in all orientations have the same pixel size for allthree axes.
All average image stacks are available for download[22]. Raw image stacks are available upon request.
Image registrationFor image registration we used a voxel value-based proto-col that sequentially applies rigid, affine and deformabletransformations. The method extends the published proto-col used for the registration of the genes expressed in theepisphere of 48 hours post fertilization (hpf) larvae ofPlatynereis [11]. The protocol presented here utilizes eitherstaining of the larval axonal scaffold with acetylated tubu-lin, or DAPI-stained nuclei, as a reference marker for regis-tration. The protocol was implemented using ImageJ [20]and the Insight Toolkit (ITK) [18].
Rigid orientation (Step 1)Since larvae were scanned in random orientations, wedeveloped two ImageJ algorithms for the rapid coarseorientation of whole-body scans. The scans were orientedbased on the features provided by the acetylated-tubulinsignal and DAPI stained nuclei. For 48 hpf larvae, wedefined the AP orientation based on the prominentacetylated-tubulin signal of the prototroch ciliary band. Wesubsequently found the position of the ventral nerve cordin the acetylated-tubulin signal to define the DV axis. For72 hpf larvae, we defined the AP axis by finding the bodymajor axis based on the DAPI signal. For DV orientationwe then used the position of the nerve cord. The algo-rithms were implemented in ImageJ using the ParticleAnalyzer, the TransformJ [23], and the Orientation plugins(Additional file 2). The rigid orientation of one image stacktakes approximately 50 sec on a PC with 32 Gb RAM andan IntelW Core™ i5-2500 CPU 3.3 GHz x 4 processor.
Fine registration (Step 2 and 3)The initial coarse orientation was refined using affineand deformable transformations (for detailed instruc-tions and scripts [see Additional file 3]) as implementedin ITK. The following are the components of the imageregistration procedure in ITK: two input images(template image and sample image), the optimizer, thatsearches for the optimal transformation for the regis-tration (we used the ITK class RegularStepGradient-DescentOptimizer for both affine and deformable imageregistration steps), the interpolator, that estimates theintensity of the pixels at non-grid positions aftertransformation (we used the ITK class LinearInterpolate-ImageFunction for both affine and deformable imageregistration steps), and the metric, that evaluates thealignment at each optimizer step (we used the ITK classMattesMutualInformationImageToImageMetric for bothaffine and deformable image registration steps). TheMattes mutual information metric [24] is a form ofmutual information metric that is evaluated from a

Asadulina et al. EvoDevo 2012, 3:27 Page 4 of 12http://www.evodevojournal.com/content/3/1/27
subset of pixels uniformly sampled from the image. Themain difference to the other mutual information metricis that in the Mattes metric the subset of pixels sampledat the first iteration is reused in the subsequentoptimizer iterations.We used the multi-resolution approach (MultiResolution-
ImageRegistrationMethod class) for both affine and deform-able image registration steps. This method first performsregistration at low resolution and then stepwise registra-tions at higher resolution levels. This approach helps toavoid local minima. Fine registration takes approximately50 min on a PC with 32 Gb RAM and an IntelW Core™i5-2500 CPU 3.3 GHz × 4 processor.
Generation of the nuclear-stain and acetylated-tubulintemplatesTo generate the templates, we used an iterative proced-ure similar to those described in [5,11]. We selected 50scans for both developmental stages and for bothreference markers. The images were first registered to amanually selected high quality image. The registeredimages were sorted according to the metric (Mattesmutual information metric), and the top 40 scans werethen used to generate an average image that served asthe reference for the next iteration step.After each iteration step we calculated the metric
between each registered image and the average to whichit was registered to determine the number of iterationsnecessary to generate a template. The value of the simi-larity metric reduces considerably after the second iter-ation, whereas the reduction after the third iteration isless substantial. Therefore we performed three iterationsto generate a representative template for Platynereis.
Registration of the gene expression patternsTo register gene expression patterns to a template, wefirst registered the corresponding reference marker(nuclear stain or acetylated tubulin) to the template andthen applied the obtained transformations to the geneexpression channel. We scanned up to ten samples foreach gene in both developmental stages and averagedthem to avoid bias towards one sample and compensatefor natural and technical variation.
Evaluation procedureTo evaluate the precision of the registration, we intro-duced a metric that provides information about the spatialprecision of the registration, which cannot be determinedbased on the Mattes mutual information metric. First wedetermined the center positions of corresponding cellsmarked by the same gene expressed in single cells usingImageJ. We thresholded the signal in the image stacks anddetermined the X and Y coordinates in a Z-projection ofthe expressing cell. The Z coordinate was defined as the
middle of the Z-span of the cell. We first calculated theaverage cell center coordinates for each group of corre-sponding cells from the individual registered samples andthen calculated the distances of the individual cells to thisaverage coordinate (absolute deviation).
Visualization pluginTo visualize registered gene expression patterns, wedeveloped a ChannelMerger plugin for ImageJ thatallows merging multiple channels in one RGB stack. Thenumber of channels that can be merged is not restrictedby the plugin. The plugin provides basic options such ascolor change and visibility setting. The merged image iscompatible with ImageJ functionality (that is, saving astif stack, adjusting brightness/contrast, viewing in3DViewer, etcetera). The ChannelMerger plugin can bedownloaded from [25].
Sequence dataThe sequence of the TrpC cDNA for Platynereis hasbeen submitted to GenBank [GenBank: JX916288].
ResultsWhole-body confocal scans of Platynereis larvaeIn confocal microscopy, the absorption and scatter oflight, as well as spherical and chromatic aberration, limitthe attainable scanning depth. These aberrations areparticularly damaging for signal intensity and resolutionif the stimulus and emitted light has to pass throughmedia with different refractive indices. The use of 97%TDE as a mounting medium with a refractive index of1.515, closely matched to that of glass and oil, cangreatly increase depth penetration when using an oilobjective. TDE is miscible with water, easily penetratesacross cell membranes, and is compatible with mostfluorophores [19].We tested TDE for use as a mounting medium for
whole-mount in situ hybridization samples of Platynereislarvae. We counterstained the samples with the nuclearmarker DAPI and an antibody against acetylated-tubulinlabeled with a TRITC secondary antibody, to label neur-ites and cilia. We then performed three-channel confocalimaging of DAPI and TRITC fluorescence and the NBT/BCIP in situ hybridization signal. To scan the NBT/BCIP signal, we used a 635 nm excitation laser and a780 nm long-pass filter, taking advantage of the far-redfluorescent emission of NBT/BCIP [21,26]. We foundthat the far red signal is less prone to artifacts thanreflection imaging, a method that takes advantage of re-flection from the NBT/BCIP precipitate [21]. Usingreflection imaging, the cover glass, dirt particles, and thechaetae emit a strong background signal. Using far-redfluorescence, the glass and dirt particles have no signal,

Asadulina et al. EvoDevo 2012, 3:27 Page 5 of 12http://www.evodevojournal.com/content/3/1/27
and only the spinning glands and the chaetae contributeto a background signal.To compare depth penetration in samples mounted in
glycerol or TDE, we fully scanned larvae in the two mediausing a 60× high-numerical aperture immersion oilobjective (Figure 1A,B,C,E,F,G). We plotted the change ofintensity in the DAPI channel along the Z-axis. The dropin signal intensity was considerably higher for glycerol-mounted specimens than for TDE-mounted specimens(Figure 1I). Signal loss was only to a small extent due tobleaching, since exposing the specimen at one Z-layer to
Figure 1 Whole-body confocal scans of Platynereis larvae mounted inacetylated-tubulin and DAPI, mounted in glycerol. (E-H) Lateral scan of a 4(D, H) Edges detected with FeatureJ Edges are shown in an orthogonal slicventral views. (I) Decay of the maximum intensity value in the DAPI channthe average DAPI edge signal detected with FeatureJ Edges along the depintensity due to bleaching in one optical slice throughout exposure time in= 3 larvae. Arrow in (H) indicates the direction of scan for (A-H). Scale bar: 5TDE, 2,2’-thiodiethanol.
405 nm light only led to a minimal decrease in signalintensity over time (Figure 1K). Bleaching was slightlymore pronounced in glycerol than in TDE. Such anti-bleaching effect of TDE was also observed for otherfluorophores [19]. Greater signal loss for glycerol-mounted specimen is probably a consequence of morepronounced optical aberration due to the imperfectmatch of the refractive indices. For TDE-mounted sam-ples we routinely compensated for the intensity loss inthe DAPI channel by progressively increasing laser in-tensity with depth.
glycerol or TDE. (A-D) Lateral scan of a 48 hpf larva stained for8 hpf larva stained for acetylated-tubulin and DAPI, mounted in TDE.e of the DAPI channel. (A and E) are anterior views, (B-D, F-H) areel along the depth of the image stack in glycerol and TDE. (J) Decay ofth of the image stack in glycerol and TDE. (K) Decay of DAPI signalglycerol and TDE. For (I-K) mean and standard deviation are shown, n0 μm. hpf, hours post fertilization; DAPI, 4’,6-diamidino-2-phenylindole;

Asadulina et al. EvoDevo 2012, 3:27 Page 6 of 12http://www.evodevojournal.com/content/3/1/27
Spherical aberration also leads to the deterioration ofoptical resolution and image sharpness as a function ofdepth. To quantify the difference in image sharpness ofglycerol- versus TDE-mounted samples, we used an edgedetection filter (FeatureJ Edges implemented in Fiji [27])on the DAPI channel (Figure 1D,H). We plotted the meanedge-filtered signal as a function of imaging depth. Thisanalysis showed a more pronounced loss in signal qualitywith depth for glycerol- than for TDE-mounted specimens(Figure 1D,H and [see Additional file 4]). TDE mountingthus allows the high-resolution confocal microscopicimaging of the entire volume of a Platynereis larva.
Generation of whole-body reference templatesBased on the whole-body confocal scans we developedaveraged anatomical reference templates (Figure 2). Wegenerated four separate templates, for both trochophore(48 hpf) and nectochaete (72 hpf) larvae using either theacetylated-tubulin antibody staining (tubulin templates) or
Figure 2 Schematic of whole-body template generation and gene expfrom 40 scanned larvae stained with a reference marker (DAPI or acetylatedused to register gene expression patterns. We scanned several in situ hybrireference marker. We first rotated the images rigidly and registered them nthe registered expression patterns for each gene to obtain a representativewere integrated into the atlas. DAPI, 4’,6-diamidino-2-phenylindole.
the DAPI stained nuclear signal (nuclear-stain templates;Figure 3A,B,C,F,G,H and [see Additional files 5,6,7 and 8]).For image registration, we extended the protocol used
in previous studies [11,15]. Given the random orienta-tion of our scans, we introduced an initial automaticrigid orientation step using a custom ImageJ script [seeAdditional file 2]. This procedure performed the roughAP and DV orientation of the larvae based on landmarksin the DAPI and acetylated-tubulin channels. Theoriented stacks were further processed using affine anddeformable transformations as implemented in ITK [seeAdditional file 3].Using this procedure we progressively aligned and
averaged 40 individual scans from both 48 and 72 hpflarvae (Figure 3A,B,C,F,G,H). Each channel was alignedand averaged separately. Using an iterative procedure fortemplate refinement we obtained high quality templatesafter three iterations (Figure 3B,C,G,H and [see Additionalfiles 5,6,7 and 8]).
ression registration in Platynereis. We generated each templatetubulin) by iterative alignment and averaging. The templates were
dization samples (five to ten) for each gene, co-stained with theon-rigidly to the templates using the reference signal. We averagedaverage expression pattern. These average gene expression patterns

Figure 3 Average templates with aligned gene expression patterns in 48 hpf and 72 hpf Platynereis larvae. Scanning electronmicroscopic image of a 48 hpf trochophore (A) and a 72 hpf nectochaete (F) Platynereis larva. Average nuclear-stain templates for 48 hpf (B) and72 hpf (G) larvae and tubulin templates for 48 hpf (C) and 72 hpf (H) larvae. Average gene expression patterns and acetylated tubulin wereregistered to the nuclear-stain templates for 48 hpf (D, E) and 72 hpf (I, J) larvae. (A-D, F-I) are ventral views, (E, J) are anterior views. The cellsthat were used for the quantifications are labeled. White asterisks in D and I indicate the autofluorescent spinning glands in the trunk. Scale bar:30 μm. hpf, hours post fertilization.
Asadulina et al. EvoDevo 2012, 3:27 Page 7 of 12http://www.evodevojournal.com/content/3/1/27
Registration of gene expression patterns to the templatesWe next registered the expression patterns of test genes tothe nuclear-stain and tubulin templates. We used fiveneuropeptide precursor genes (FMRFamide, SPY, L11,RGWamide and WLD) [15,28], rhabdomeric-opsin-1(r-opsin-1) [29], and a C-type transient receptor potentialchannel (TrpC). All of these genes show expression in arestricted number of neurons in the episphere and thetrunk, allowing quantitative analyses [see Additional file 9].The NBT/BCIP precipitate is known to block the path
of light [21], therefore it was also important to test themethod for a gene with a broader coherent expressiondomain. We chose prohormone convertase 2 (phc2), agene with broad expression in the Platynereis nervoussystem ([see Additional file 10] and [30]). We scannedup to ten whole-mount in situ hybridization samples foreach gene for both 48 and 72 hpf larvae and registeredthem independently to the nuclear-stain and the tubulintemplates. We ran both the affine and the deformableregistration steps until convergence of the metric ormaximum 100 iterations [see Additional file 11]. Visualinspection of the aligned image stacks and thedeformation field showed that the individual samplesshowed good overlap with the template [see Additionalfile 11], even for the broadly expressed phc2 gene [seeAdditional file 10]. We then averaged each gene’sexpression and projected the averages onto the
respective templates (Figure 3D,E,I,J and [see Additionalfiles 12,13,14 and 15]).To quantitatively evaluate the gene expression pattern
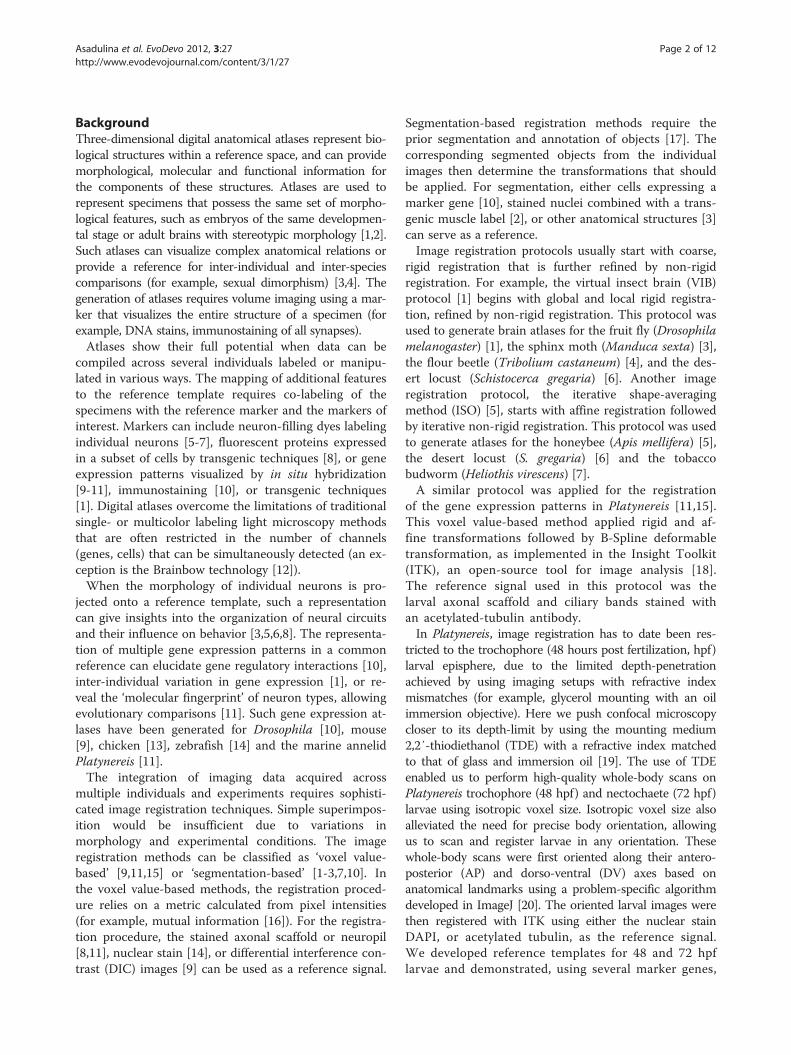
registrations, we determined the center positions of cor-responding cells in ten different larval scans for eachgene. We selected 14 single cells expressed in differentparts of the episphere and the trunk from the fiveneuropeptide patterns for each developmental stage(Figure 3D,E,I,J). We measured the absolute deviation ofcenter positions for these cells (that is, the distances ofthe individual cell center positions to their averagecoordinate; Figure 4).The average absolute deviation for all cells was lower
than the average cell body diameter (10.2 μm, s.d. = 2.3 μm,n = 100 along the X-axis, defined from the thresholded insitu signal). We also found that the nuclear-stain templatesperformed equally well or significantly better than the tubu-lin templates. We therefore used the nuclear-stain tem-plates for further analyses. These results show that it ispossible to register gene expression patterns in both thehead and the trunk of Platynereis larvae with near-cellularresolution using the whole-body templates.
Analysis of colocalization of gene expression patterns inthe atlasTaking advantage of such whole-body near-cellular reso-lution image registration, we next developed image analysis
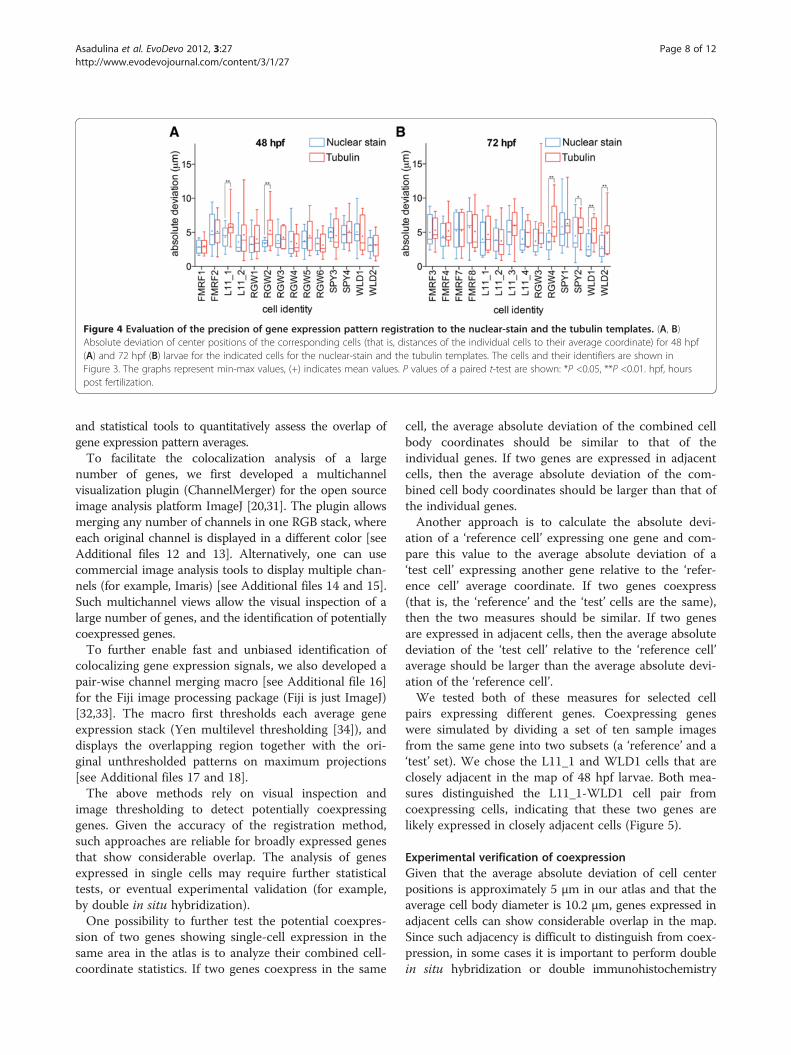
Figure 4 Evaluation of the precision of gene expression pattern registration to the nuclear-stain and the tubulin templates. (A, B)Absolute deviation of center positions of the corresponding cells (that is, distances of the individual cells to their average coordinate) for 48 hpf(A) and 72 hpf (B) larvae for the indicated cells for the nuclear-stain and the tubulin templates. The cells and their identifiers are shown inFigure 3. The graphs represent min-max values, (+) indicates mean values. P values of a paired t-test are shown: *P <0.05, **P <0.01. hpf, hourspost fertilization.
Asadulina et al. EvoDevo 2012, 3:27 Page 8 of 12http://www.evodevojournal.com/content/3/1/27
and statistical tools to quantitatively assess the overlap ofgene expression pattern averages.To facilitate the colocalization analysis of a large
number of genes, we first developed a multichannelvisualization plugin (ChannelMerger) for the open sourceimage analysis platform ImageJ [20,31]. The plugin allowsmerging any number of channels in one RGB stack, whereeach original channel is displayed in a different color [seeAdditional files 12 and 13]. Alternatively, one can usecommercial image analysis tools to display multiple chan-nels (for example, Imaris) [see Additional files 14 and 15].Such multichannel views allow the visual inspection of alarge number of genes, and the identification of potentiallycoexpressed genes.To further enable fast and unbiased identification of
colocalizing gene expression signals, we also developed apair-wise channel merging macro [see Additional file 16]for the Fiji image processing package (Fiji is just ImageJ)[32,33]. The macro first thresholds each average geneexpression stack (Yen multilevel thresholding [34]), anddisplays the overlapping region together with the ori-ginal unthresholded patterns on maximum projections[see Additional files 17 and 18].The above methods rely on visual inspection and
image thresholding to detect potentially coexpressinggenes. Given the accuracy of the registration method,such approaches are reliable for broadly expressed genesthat show considerable overlap. The analysis of genesexpressed in single cells may require further statisticaltests, or eventual experimental validation (for example,by double in situ hybridization).One possibility to further test the potential coexpres-
sion of two genes showing single-cell expression in thesame area in the atlas is to analyze their combined cell-coordinate statistics. If two genes coexpress in the same
cell, the average absolute deviation of the combined cellbody coordinates should be similar to that of theindividual genes. If two genes are expressed in adjacentcells, then the average absolute deviation of the com-bined cell body coordinates should be larger than that ofthe individual genes.Another approach is to calculate the absolute devi-
ation of a ‘reference cell’ expressing one gene and com-pare this value to the average absolute deviation of a‘test cell’ expressing another gene relative to the ‘refer-ence cell’ average coordinate. If two genes coexpress(that is, the ‘reference’ and the ‘test’ cells are the same),then the two measures should be similar. If two genesare expressed in adjacent cells, then the average absolutedeviation of the ‘test cell’ relative to the ‘reference cell’average should be larger than the average absolute devi-ation of the ‘reference cell’.We tested both of these measures for selected cell
pairs expressing different genes. Coexpressing geneswere simulated by dividing a set of ten sample imagesfrom the same gene into two subsets (a ‘reference’ and a‘test’ set). We chose the L11_1 and WLD1 cells that areclosely adjacent in the map of 48 hpf larvae. Both mea-sures distinguished the L11_1-WLD1 cell pair fromcoexpressing cells, indicating that these two genes arelikely expressed in closely adjacent cells (Figure 5).
Experimental verification of coexpressionGiven that the average absolute deviation of cell centerpositions is approximately 5 μm in our atlas and that theaverage cell body diameter is 10.2 μm, genes expressed inadjacent cells can show considerable overlap in the map.Since such adjacency is difficult to distinguish from coex-pression, in some cases it is important to perform doublein situ hybridization or double immunohistochemistry
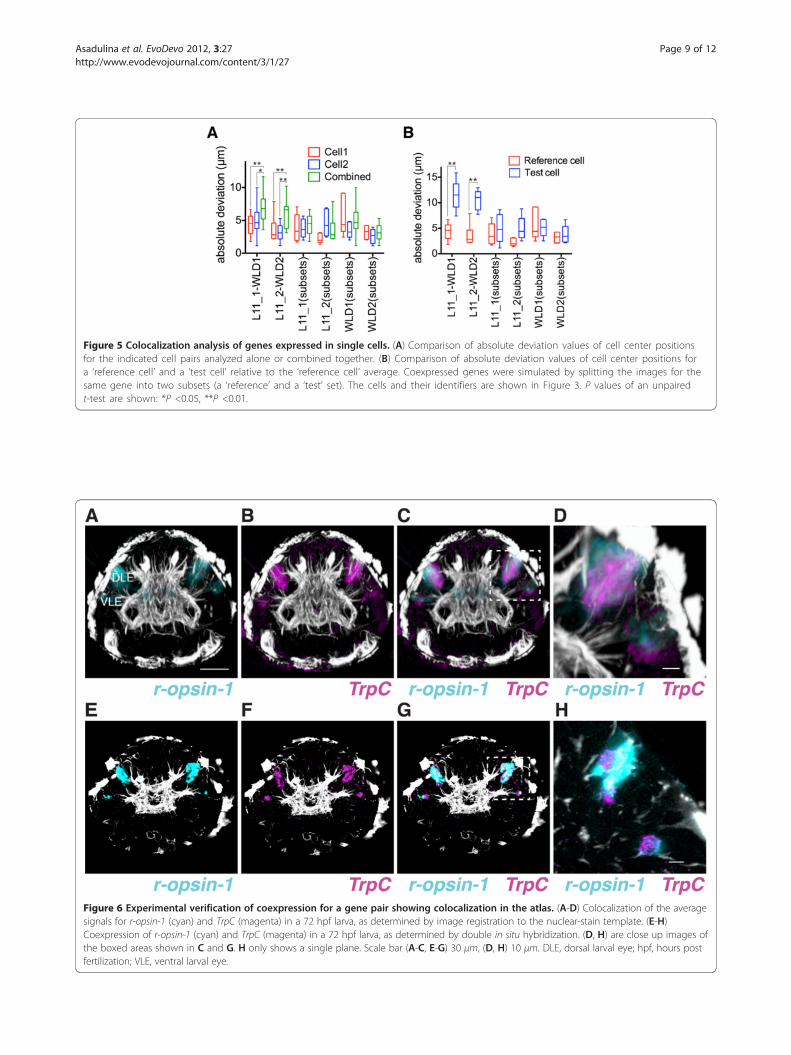
Figure 5 Colocalization analysis of genes expressed in single cells. (A) Comparison of absolute deviation values of cell center positionsfor the indicated cell pairs analyzed alone or combined together. (B) Comparison of absolute deviation values of cell center positions fora ‘reference cell’ and a ‘test cell’ relative to the ‘reference cell’ average. Coexpressed genes were simulated by splitting the images for thesame gene into two subsets (a ‘reference’ and a ‘test’ set). The cells and their identifiers are shown in Figure 3. P values of an unpairedt-test are shown: *P <0.05, **P <0.01.
Figure 6 Experimental verification of coexpression for a gene pair showing colocalization in the atlas. (A-D) Colocalization of the averagesignals for r-opsin-1 (cyan) and TrpC (magenta) in a 72 hpf larva, as determined by image registration to the nuclear-stain template. (E-H)Coexpression of r-opsin-1 (cyan) and TrpC (magenta) in a 72 hpf larva, as determined by double in situ hybridization. (D, H) are close up images ofthe boxed areas shown in C and G. H only shows a single plane. Scale bar (A-C, E-G) 30 μm, (D, H) 10 μm. DLE, dorsal larval eye; hpf, hours postfertilization; VLE, ventral larval eye.
Asadulina et al. EvoDevo 2012, 3:27 Page 9 of 12http://www.evodevojournal.com/content/3/1/27

Asadulina et al. EvoDevo 2012, 3:27 Page 10 of 12http://www.evodevojournal.com/content/3/1/27
experiments. For example, the gene expression maprevealed broad colocalization in 72 hpf larvae of r-opsin-1and TrpC in several cells of the dorsal larval eyes (the adulteye precursors; [see Additional file 18]). r-opsin-1 and TrpCalso showed partial overlap in the map in single cells in theventral larval eyes (Figure 6A,B,C,D). Given the coherentand broadly overlapping expression domains, coexpressioncan be reliably established for the dorsal eyes. The two genescould potentially coexpress also in the ventral eyes, however,this is less clear from the map (Figure 6D). We tested coex-pression of r-opsin-1 and TrpC using double in situhybridization (Figure 6E,F,G,H). Double in situ hybridizationconfirmed coexpression of the two genes in the two pairs ofdorsal larval eyes, as well as the ventral larval eyes. Theseresults show that the gene expression atlas can be used forthe efficient identification of coexpressed genes.
Estimating the number of scans needed per geneWe next analyzed how the number of scans per geneinfluences the position of the average cell body coordinate.From all cells in Figure 3 with gene expression, weselected four cells from each stage, two with the highestand two with the lowest absolute deviation. We deter-mined the coordinates of the corresponding cell bodiesmarked by the same gene in all individual samples(complete set). We sampled random subsets of differentsizes (one to nine, 1000 subsets for each size) from thecomplete set and calculated the distance between the sub-set average coordinate and the complete set average co-ordinate (Figure 7). This analysis showed that the averagecoordinate of subsets of three to five is 1 to 2 μm close tothe complete set average coordinate. Taking into accountthat the average cell body diameter is 10 μm, three to fivescans can thus be sufficient for the high accuracy registra-tion of a gene. Given that some of the scans may be dis-carded during image processing (for example, damagedmorphology or weak in situ signal), as a rule of thumb werecommend five scans per gene.
Figure 7 Effect of sample size on the absolute deviation of cell centeindicated cells from ten scans each. We sampled random subsets of one todeviation of cell center positions of the different subsets relative to the comcells and their identifiers are shown in Figure 3. We chose the two best anmin-max values, (+) indicates mean values. hpf, hours post fertilization.
DiscussionA whole-body gene expression atlas for PlatynereisHere we extended the gene expression registration protocolthat was originally applicable to the episphere of Platynereistrochophores [11] to the whole-body of 48 and 72 hpf lar-vae. Cellular resolution whole-body registration will allowthe development of a Platynereis gene expression atlas con-taining expression information for a large number of genesat different stages. Such an atlas will provide an overview ofthe spatial distribution of gene expression patterns, givinginsights into the dynamics of gene interactions during de-velopment, and will provide a catalog of cell types, provid-ing the foundation for understanding physiology.A particularly important aspect of the Platynereis atlas is
to identify genes that coexpress in particular cells, allowingthe characterization of the molecular fingerprint andfunction of cells. Our quantitative analyses showed that theaverage absolute deviation for any registered cell isapproximately half a cell diameter, meaning that gene ex-pression patterns could be registered at or close to cellularresolution. The convincing demonstration of coexpressionmay nevertheless require experimental validation in somecases. For example, the atlas revealed a strong colocaliza-tion in the average signals of r-opsin-1 and TrpC in the eyephotoreceptors, which we subsequently verified experimen-tally. The coexpression of r-opsin-1 and TrpC indicates thatPlatynereis rhabdomeric photoreceptors may also employ aphototransduction cascade similar to insect rhabdomericphotoreceptors [35] and intrinsically photosensitive retinalganglion cells [36], strengthening the idea that these photo-receptors represent a homologous cell type [37].
Nuclear stain as a universal reference markerSeveral different reference markers have been used for thegeneration of anatomical templates [2,3,8-11]. In Platyner-eis, the sharp and invariant acetylated-tubulin signal wasused for the generation of the first gene expression map[11]. Our results show that besides acetylated tubulin,
r positions. We determined the average cell body coordinates of thenine (1000 each) from the complete set of each cell. The absoluteplete set average are shown for 48 hpf (A) and 72 hpf (B) larvae. The
d the two worst registered cells for both stages. The graphs represent

Asadulina et al. EvoDevo 2012, 3:27 Page 11 of 12http://www.evodevojournal.com/content/3/1/27
nuclear stain can also be used as a reliable reference mar-ker for Platynereis larvae. Nuclear stains (TOTO™-3 andSytox™ green) have also been used in the recently estab-lished registration protocol for zebrafish larvae [14]. Giventhat acetylated tubulin is not universally applicable (for ex-ample, it does not work in brachiopod larvae following insitu hybridization; A Hejnol, personal communication),nuclear stains may also be more suitable as reference mar-kers in other animals. Nuclear stains have several otheradvantages over antibody markers. By labeling every cell,such stains give the broadest possible label of the anatomy.In contrast, tubulin is absent from large parts of the body,as in Platynereis larvae, and consequently provides lessinformation for the registration. As our templates clearlyshow, nuclear stain gives a fuller representation of the anat-omy, yet it is not a homogeneous label and reveals detailedinternal structure (for example, is absent from neuropiland muscle fibers). Additionally, nuclear stain is cheap andeasy to perform, and is compatible with standard in situhybridization protocols (although a protocol with a sodiumdodecyl sulfate (SDS)-containing hybridization solutionyielded poor DAPI signal in Platynereis in our hands). Wetherefore propose nuclear stains as the first markers ofchoice for future image registration projects.
ConclusionsHere we introduced whole-body gene expression regis-tration for Platynereis larvae, imaged by confocalmicroscopy. We hope that the reference templates anddetailed instructions and scripts we provide will facilitatethe building of a community resource for Platynereis.The possibility of near-cellular-resolution coexpressionanalysis makes Platynereis a powerful experimentalmodel for the detailed characterization of cell types. Weanticipate that by using optimized confocal imaging andwhole-body scans it will be possible to develop referencetemplates for other developmental stages in Platynereisas well as other animals of a similar size range.
Additional files
Additional file 1: In situ hybridization protocol for Platynereislarvae. The protocol allows the combination of in situ hybridization withanti-acetylated-tubulin immunostaining and DAPI nuclear staining.
Additional file 2: Compressed scripts and instructions for the rigidorientation step in ImageJ. The archive contains an instruction fileimagej_instructions.txt and a folder with the scripts.
Additional file 3: Compressed scripts and instructions for the non-rigid registration step using ITK. The archive contains an instructionfile itk_instructions.txt and a folder with the scripts.
Additional file 4: Loss of DAPI signal intensity and sharpness withscanning depth in TDE versus glycerol mounted specimen. Whole-body confocal stacks of a 48 hpf larva scanned in TDE and subsequentlyin glycerol. The edges detected by FeatureJ Edges in Fiji are also shown.
Additional file 5: Acetylated-tubulin whole-body referencetemplate for 48 hpf Platynereis larvae (QuickTime movie). Image
stack with the whole-body acetylated-tubulin reference template for 48hpf larvae generated by the iterative registration of 40 individual scans.
Additional file 6: Nuclear-stain whole-body reference template for48 hpf Platynereis larvae (QuickTime movie). Image stack with thewhole-body DAPI reference template for 48 hpf larvae generated by theiterative registration of 40 individual scans.
Additional file 7: Acetylated-tubulin whole-body reference templatefor 72 hpf Platynereis larvae (QuickTime movie). Image stack with thewhole-body acetylated-tubulin reference template for 72 hpf larvaegenerated by the iterative registration of 40 individual scans.
Additional file 8: Nuclear-stain whole-body reference template for72 hpf Platynereis larvae (QuickTime movie). Image stack with thewhole-body nuclear-stain reference template for 72 hpf larvae generatedby the iterative registration of 40 individual scans.
Additional file 9: Maximum projections of raw in situ hybridizationdata. In situ hybridization (red) for the analyzed neuropeptide precursorgenes, counter-stained for acetylated tubulin (white) in 48 (A-E) and 72hpf (F-J) larvae. Maximum projections of anterior (top rows) and ventral(bottom rows) views are shown. The anterior views only show amaximum projection of the episphere. Scale bar 30 μm.
Additional file 10: Shadowing effect and registration of a broadlyexpressed gene. (A, B) Average expression pattern (red) of phc2, counter-stained for acetylated tubulin (white) in a 72 hpf larva. (C, D) Shadowing of theDAPI signal (grey, circled areas) due to the broad expression of phc2 in situhybridization signal (red). Superimposed template (green) and sample images(red) before (C) and after (D) deformable registration. (A, E, F) are lateral views,(B) is an anterior view, (C, D) are ventral views. Scale bar 30 μm.
Additional file 11: Affine and deformable registration. (A, B)Evolution of the Mattes mutual information metric during the affine (A) anddeformable (B) registration steps. The minimization metric converges afterapproximately 50 steps. (C,D) A slice of the superimposed template (red) andthe sample images (green) before (C) and after (D) deformable registration. (E)Representation of the 3D deformation field corresponding to thetransformation from (C) to (D) visualized in Paraview http://www.paraview.org/. Scale bar: 30 μm.
Additional file 12: Image stack of registered expression patterns offive genes in 48 hpf Platynereis larvae (QuickTime movie). The image wasgenerated using the ChannelMerger plugin. Color code as shown in Figure 4.
Additional file 13: Image stack of registered expression patterns ofseven genes in 72 hpf Platynereis larvae (QuickTime movie). Theimage was generated using the ChannelMerger plugin. Color code asshown in Figure 4.
Additional file 14: 3D view of registered expression patterns of fivegenes in 48 hpf Platynereis larvae (QuickTime movie). The movie wasgenerated using Imaris. Color code as shown in Figure 4.
Additional file 15: 3D view of registered expression patterns of fivegenes in 72 hpf Platynereis larvae (QuickTime movie). The movie wasgenerated using Imaris. Color code as shown in Figure 4.
Additional file 16: Fiji macro for generating an all-against-allcoexpression montage for several genes. To use this macro,download and install Fiji (http://fiji.sc/). Open the macro in Fiji and run iton a set of image stacks of gene expression averages aligned to thereferences provided in Additional files 4 and 6.
Additional file 17: All-against-all coexpression analysis for five genesin 48 hpf Platynereis larvae. The image montage of gene coexpressionswas generated with the custom Fiji macro (Additional file 16).
Additional file 18: All-against-all coexpression analysis for sevengenes in 72 hpf Platynereis larvae. The image montage of genecoexpressions was generated with the custom Fiji macro (Additional file 16).
AbbreviationsAP: Antero-posterior; DIC: Differential interference contrast; DAPI: 4’,6-diamidino-2-phenylindole; DV: Dorso-ventral; hpf: Hours post fertilization;ISO: Iterative shape-averaging method; ITK: Insight toolkit; NBT/BCIP: Nitroblue tetrazolium/5-bromo-4-chloro-3-indolyl phosphate;SDS: Sodium dodecyl sulfate; TDE: 2,2’-thiodiethanol; VIB: Virtual insect brain.

Asadulina et al. EvoDevo 2012, 3:27 Page 12 of 12http://www.evodevojournal.com/content/3/1/27
Competing interestsThe authors declare that they have no competing interests.
Authors’ contributionsAA developed the image registration protocol, performed image registration,performed confocal microscopy and wrote the paper. AP and CV performedconfocal microscopy. CL advised on microscopy and suggested the use ofTDE. GJ designed the project and wrote the paper. All authors read andapproved the final manuscript.
AcknowledgementsWe thank Steffen Schmidt, Thomas Holder and Andre Noll for IT support. Wethank Elizabeth Williams for her comments on the manuscript and MarkusConzelmann and Timea Keller for the initial characterization of TrpC. Theresearch leading to these results received funding from the EuropeanResearch Council under the European Union's Seventh FrameworkProgramme (FP7/2007-2013)/European Research Council Grant Agreement260821.
Received: 1 August 2012 Accepted: 23 October 2012Published: 3 December 2012
References1. Jenett A, Schindelin JE, Heisenberg M: The Virtual Insect Brain protocol:
creating and comparing standardized neuroanatomy. BMC Bioinforma2006, 7:544.
2. Long F, Peng H, Liu X, Kim SK, Myers E: A 3D digital atlas of C. elegansand its application to single-cell analyses. Nat Methods 2009, 6:667–672.
3. Jundi El B, Huetteroth W, Kurylas AE, Schachtner J: Anisometric braindimorphism revisited: Implementation of a volumetric 3D standardbrain in Manduca sexta. J Comp Neuro 2009, 517:210–225.
4. Dreyer D, Vitt H, Dippel S, Goetz B, Jundi El B, Kollmann M, Huetteroth W,Schachtner J: 3D Standard Brain of the Red Flour Beetle TriboliumCastaneum: A Tool to Study Metamorphic Development and AdultPlasticity. Front Syst Neurosci 2010, 4:3.
5. Brandt R, Rohlfing T, Rybak J, Krofczik S, Maye A, Westerhoff M, Hege H-C,Menzel R: Three dimensional average-shape atlas of the honeybeebrain and its applications. J Comp Neurol 2005, 492:1–19.
6. Kurylas AE, Rohlfing T, Krofczik S, Jenett A, Homberg U: Standardizedatlas of the brain of the desert locust, Schistocerca gregaria. Cell TissueRes 2008, 333:125–145.
7. Kvello P, Løfaldli BB, Rybak J, Menzel R, Mustaparta H: Digital,three-dimensional average shaped atlas of the heliothis virescensbrain with integrated gustatory and olfactory neurons. Front SystNeurosci 2009, 3:14.
8. Chiang A-S, Lin C-Y, Chuang C-C, Chang H-M, Hsieh C-H, Yeh C-W,Shih C-T, Wu J-J, Wang G-T, Chen Y-C, Wu C-C, Chen G-Y, Ching Y-T,Lee P-C, Lin C-Y, Lin H-H, Wu C-C, Hsu H-W, Huang Y-A, Chen J-Y, ChiangH-J, Lu C-F, Ni R-F, Yeh C-Y, Hwang J-K: Three-dimensional reconstructionof brain-wide wiring networks in Drosophila at single-cell resolution.Curr Biol 2011, 21:1–11.
9. Lein ES, Hawrylycz MJ, Ao N, Ayres M, Bensinger A, Bernard A, Boe AF,Boguski MS, Brockway KS, Byrnes EJ, Chen L, Chen L, Chen T-M, Chin MC,Chong J, Crook BE, Czaplinska A, Dang CN, Datta S, Dee NR, Desaki AL,Desta T, Diep E, Dolbeare TA, Donelan MJ, Dong H-W, Dougherty JG,Duncan BJ, Ebbert AJ, Eichele G, et al: Genome-wide atlas of geneexpression in the adult mouse brain. Nature 2007, 445:168–176.
10. Fowlkes CC, Hendriks CLL, Keränen SVE, Weber GH, Rübel O, Huang M-Y,Chatoor S, DePace AH, Simirenko L, Henriquez C, Beaton A, Weiszmann R,Celniker S, Hamann B, Knowles DW, Biggin MD, Eisen MB, Malik J:A quantitative spatiotemporal atlas of gene expression in theDrosophila blastoderm. Cell 2008, 133:364–374.
11. Tomer R, Denes AS, Tessmar-Raible K, Arendt D: Profiling by ImageRegistration Reveals Common Origin of Annelid Mushroom Bodies andVertebrate Pallium. Cell 2010, 142:800–809.
12. Livet J, Weissman TA, Kang H, Draft RW, Lu J, Bennis RA, Sanes JR,Lichtman JW: Transgenic strategies for combinatorial expression offluorescent proteins in the nervous system. Nature 2007, 450:56–62.
13. Fisher ME, Clelland AK, Bain A, Baldock RA, Murphy P, Downie H, Tickle C,Davidson DR, Buckland RA: Integrating technologies for comparing 3D geneexpression domains in the developing chick limb. Dev Biol 2008, 317:13–23.
14. Ronneberger O, Liu K, Rath M, Rueβ D, Mueller T, Skibbe H, Drayer B,Schmidt T, Filippi A, Nitschke R, Brox T, Burkhardt H, Driever W: ViBE-Z: aframework for 3D virtual colocalization analysis in zebrafish larval brains.Nat Methods 2012, 9:735–742.
15. Conzelmann M, Offenburger S-L, Asadulina A, Keller T, Münch TA, Jékely G:Neuropeptides regulate swimming depth of Platynereis larvae. Proc NatlAcad Sci USA 2011, 108:E1174–E1183.
16. Pluim JPW, Maintz JBA, Viergever MA: Mutual-information-basedregistration of medical images: a survey. IEEE Trans Med Imaging 2003,22:986–1004.
17. Maintz JBA, Viergever MA: A survey of medical image registration.Medical Image Analysis 1998, 2:1–36.
18. Yoo T, Ackerman M, Lorensen W, Schroeder S, Chalana V, Aylwald S,Metaxas D, Whitaker R: Engineering and Algorithm Design for an ImageProcessing API: A Technical Report on ITK - the Insight Toolkit. Studiesin Health Technology and Informatics 2002, 85:586–592.
19. Staudt T, Lang MC, Medda R, Engelhardt J, Hell SW: 2,20-Thiodiethanol: Anew water soluble mounting medium for high resolution opticalmicroscopy. Microsc Res Tech 2006, 70:1–9.
20. Schneider CA, Rasband WS, Eliceiri KW: NIH Image to ImageJ: 25 years ofimage analysis. Nat Methods 2012, 9:671–675.
21. Jékely G, Arendt D: Cellular resolution expression profiling using confocaldetection of NBT/BCIP precipitate by reflection microscopy. Biotechniques2007, 42:751–755.
22. Jékely Lab Resources Page. [http://jekely-lab.tuebingen.mpg.de/]23. Meijering EH, Niessen WJ, Viergever MA: Quantitative evaluation of
convolution-based methods for medical image interpolation. MedicalImage Analysis 2001, 5:111–126.
24. Mattes D, Haynor DR, Vesselle H, Lewellyn TK, Eubank W: Nonrigidmultimodality image registration. In SPIE Proceedings. Edited by Mun SK,Antonuk LE, Chen C-T, Sonka M, Krupinski EA, Insana MF, Siegel EL,Huang HK, Shung KK, Hanson KM, Chakraborty DP, Clough AV, Yaffe MJ.San Diego: SPIE; 2012:1609–1620.
25. ChannelMerger plugin. [http://imagejdocu.tudor.lu/doku.php?id=plugin:color:channel_merger_:start]
26. Trinh LA, McCutchen MD, Bonner-Fraser M, Fraser SE, Bumm LA,McCauley DW: Fluorescent in situ hybridization employing theconventional NBT/BCIP chromogenic stain. Biotechniques 2007,42:756–759.
27. FeatureJ Edges. [http://imagescience.org/meijering/software/featurej/edges.html]28. Conzelmann M, Jékely G: Antibodies against conserved amidated
neuropeptide epitopes enrich the comparative neurobiology toolbox.EvoDevo 2012, 3:23.
29. Arendt D, Tessmar K, de Campos-Baptista M-IM, Dorresteijn A, Wittbrodt J:Development of pigment-cup eyes in the polychaete Platynereisdumerilii and evolutionary conservation of larval eyes in Bilateria.Development 2002, 129:1143–1154.
30. Tessmar-Raible K, Raible F, Christodoulou F, Guy K, Rembold M, Hausen H,Arendt D: Conserved sensory-neurosecretory cell types in annelid and fishforebrain: insights into hypothalamus evolution. Cell 2007,129:1389–1400.
31. ImageJ. [http://rsbweb.nih.gov/ij/]32. Fiji. [http://fiji.sc/]33. Schindelin J, Arganda-Carreras I, Frise E, Kaynig V, Longair M, Pietzsch T,
Preibisch S, Rueden C, Saalfeld S, Schmid B, Tinevez J-Y, White DJ,Hartenstein V, Eliceiri K, Tomancak P, Cardona A: Fiji: an open-sourceplatform for biological image analysis. Nat Methods 2012,9:676–682.
34. Yen JC, Chang FJ, Chang S: A new criterion for automatic multilevelthresholding. IEEE Trans Image Process 1995, 4:370–378.
35. Montell C: Drosophila visual transduction. Trends Neurosci 2012, 35:356–363.36. Berson DM: Phototransduction in ganglion-cell photoreceptors. Pflugers
Arch 2007, 454:849–855.37. Arendt D: Evolution of eyes and photoreceptor cell types. Int J Dev Biol
2003, 47:563–571.
doi:10.1186/2041-9139-3-27Cite this article as: Asadulina et al.: Whole-body gene expression patternregistration in Platynereis larvae. EvoDevo 2012 3:27.