who/fao dietary recommendations - curiosoando · pdf filedietary recommendations in the report...
TRANSCRIPT

Dietary Recommendations in the Report of a Joint WHO/FAO
Expert Consultation on Diet, Nutrition and the Prevention of
Chronic Diseases (WHO Technical Report Series 916, 2003):
Potential Impact on
Consumption, Production and Trade of Selected Food Products
Dr Xavier Irz, Dr Bhavani Shankar and Dr C.S.Srinivasan*
November 2003
*The authors are lecturers in the Department of Agricultural and Food Economics, School of
Agriculture, Policy and Development, The University of Reading, UK

i
Table of Contents
Executive Summary .................................................................................................................. v
Introduction ............................................................................................................................... 1
WHO/FAO Dietary Intake Goals.............................................................................................. 1
Objectives of the Study ............................................................................................................. 3
Methodology Overview............................................................................................................. 4
Review of Current Levels of Fat Consumption ........................................................................ 6
Consumption Impacts................................................................................................................ 8
Data ....................................................................................................................................... 8
Methodology ......................................................................................................................... 9
Results ................................................................................................................................. 13
Dairy & Animal Fat Products............................................................................. 13
Meats ................................................................................................................... 16
Vegetable Oils ..................................................................................................... 18
Cereals ................................................................................................................ 20
Consumption Impacts: Saturated Fat Concerns .................................................................. 22
Consumption Impacts: Distributional Concerns ................................................................. 23
Production and Trade Impacts................................................................................................. 24
Methodology ....................................................................................................................... 24
Results ................................................................................................................................. 26
Meat................................................................................................................................. 26
Bovine Meat......................................................................................................... 26
Pig meat............................................................................................................... 26
Mutton and Goat Meat ........................................................................................ 29
Poultry Meat........................................................................................................ 31
Dairy Products, Animal Fat and Eggs............................................................................. 32
Butter & Ghee ..................................................................................................... 32
Cream.................................................................................................................. 34
Animal Fats ......................................................................................................... 36
Eggs..................................................................................................................... 38

ii
Vegetable Oils ................................................................................................................. 40
Soybean Oil ......................................................................................................... 40
Rapeseed Oil ....................................................................................................... 42
Palm Oil .............................................................................................................. 44
Conclusions ............................................................................................................................. 46
References ............................................................................................................................... 48
Appendix-1: Share of Fat in Energy Intake, All Countries, 2000.......................................... 49

iii
List of Figures
Figure 1: Share of Fat in Total Energy Intake, All Countries 2000.......................................... 7
Figure 2: Changes in Milk Consumption (35 Countries)........................................................ 14
Figure 3: Changes in Consumption of Dairy Products & Animal Fats................................... 14
Figure 4: Reduction in Consumption of Animal Fats ............................................................. 15
Figure 5: Reduction in Consumption of Dairy Products......................................................... 16
Figure 6. Changes in Consumption of Meats (35 Countries).................................................. 17
Figure 7: Reduction in Mutton, Pig and Poultry Meat Consumption ..................................... 18
Figure 8. Changes in Consumption of Vegetable Oils............................................................ 19
Figure 9: Reduction in Consumption of Vegetable Oils ......................................................... 20

iv
List of Tables
Table-1: Ranges of Population Dietary Intake Goals................................................................ 2
Table-2: Decrease in Pig Meat Production - Top 20 Countries and World ............................ 27
Table-3: Pig Meat – Trade Impact .......................................................................................... 28
Table-4: Decrease in Mutton and Goat Meat Production - Top 20 Countries and World ...... 29
Table-5: Trade Impact on Mutton and Goat Meat .................................................................. 30
Table-6: Decrease in Poultry Meat Production – Top 20 Countries and World ..................... 31
Table-7: Poultry Meat – Trade Impact.................................................................................... 32
Table-8: Decrease in Butter & Ghee Production - Top 20 Countries and World ................... 33
Table-9: Butter & Ghee – Trade Impacts................................................................................ 34
Table-10: Decrease in Cream Production - Top 20 Countries and World .............................. 35
Table 11. Cream – Trade Impact............................................................................................. 36
Table-12: Decrease in Animal Fats Production - Top 20 Countries and World ..................... 37
Table-13: Animal Fats – Trade Impact Top 20 Countries and World .................................... 38
Table-14: Decrease in Egg Production - Top 20 Countries and World .................................. 39
Table-15: Eggs – Trade Impact.............................................................................................. 39
Table-16: Decrease in Soybean Oil Production - Top 20 Countries and World..................... 40
Table-17: Soybean Oil: Trade Impact..................................................................................... 41
Table-18: Decrease in Rapeseed Oil Production - Top 20 Countries and World ................... 43
Table-19: Rapeseed Oil - Trade Impact .................................................................................. 44
Table-20: Decrease in Palm Oil Production - Top 20 Countries and World .......................... 45
Table-21: Palm Oil – Trade Impact......................................................................................... 46

v
Dietary Recommendations in the Report of a Joint WHO/FAO Expert Consultation on Diet,
Nutrition and the Prevention of Chronic Diseases (WHO Technical Report Series 916, 2003):
Potential Impact on Consumption, Production and Trade of Selected Food Products*
Dr Xavier Irz, Dr Bhavani Shankar and Dr C.S.Srinivasan**
Executive Summary
• The report investigates the potential impact of WHO/FAO norms with respect to fat, protein and sugar
intake on the consumption, production and trade of selected food products – meats, dairy products &
eggs, vegetable oils & animal fats and cereals. A programming approach is used to predict how
country-level food consumption, as described by the FAO’s nutritional balance sheets, would have to
adjust in order to meet the WHO/FAO norms.
• A similar study on the potential impact of WHO/FAO norms on the sugar economy was previously
done by the same authors.***
• The results demonstrate that forty-nine countries are in excess of the thirty percent upper limit set by
the WHO/FAO for the share of total energy intake from fat, while the norm on protein intake is rarely
violated. Most of the countries violating the norm with respect to fat energy intake are either developed
countries of the Western hemisphere and Oceania, or Eastern European countries.
• The analysis of consumption impacts in this study is based on average national food intakes. However,
even in countries which are currently in conformity with the norms on average, large segments of the
population might be consuming fats in excess of the recommended norms. The study does not take into
account the adjustment in consumption patterns required for these segments of the population.
• Analysis of the consumption impacts reveals that the adjustments necessary to adhere to the norms are
substantial. The general direction of the change is a shift away from human consumption of meats,
vegetable oils, eggs and dairy products towards consumption of more cereal-based products, pulses,
fruits and vegetables.
o The aggregate impact on meat consumption is a decrease of almost six million tons due
primarily to reductions in demand for meat in the US, France and Germany. However, all
meats are not affected equally: the negative impact on pig meat consumption is largest at five
million tons representing more than sixteen percent of current consumption in the group of
countries violating the WHO/FAO norms. The negative impact on consumption of mutton and
goat meats is also substantial in relative terms, while the estimated impacts on poultry and
beef consumption are small.
o The model suggests that adherence to the WHO/FAO norms would depress demand for dairy
products. While milk consumption would be marginally affected, butter and cream
consumption would decline by thirty-five and twenty-five percent of their current levels in the
group of countries violating the norms, with North America and the EU accounting for the
bulk of the decline.
o The estimate of the consumption impact for animal fat is a decrease of 1.3 million tons
representing thirty-one percent of current consumption in the group of countries violating the
WHO/FAO norms, with the US, France and Germany accounting for most of the reduction.
o The calculated consumption impacts of the norms for all oils are negative and range from
thirty to thirty-five percent of their original levels for the group of countries violating the
___________________________________________________________________________ * The authors are lecturers in the Department of Agricultural and Food Economics, School of Agriculture, Policy and
Development, The University of Reading, UK. ** The Study was sponsored by the International Federation of Agricultural Producers and the Institute of European Food
Studies. *** Irz, X (2003). Impact of WHO Dietary Recommendations on World Sugar Consumption, Production and Trade. Report
prepared for the World Sugar Research Organisation.

vi
norms. The contraction in volume is largest for soybean oil at 2.7 million tons, followed by
rapeseed oil and sunflower oil. Almost half of the total reduction would come from the US,
with Germany, France and Italy also reducing their consumptions of vegetable oils sharply.
o The calculated increase in human consumption of cereals following the introduction of the
norms amounts to 30 million tons. However, once the reduction in demand for feeds related to
the decrease in meat consumption is netted out, the growth in demand for cereals due to the
WHO/FAO norms becomes marginal (five million tons).
• The production and trade impacts differ across products but in some cases are found to be large; hence,
in many countries, the WHO/FAO norms have significant implications for farm incomes and farmers'
livelihoods.
• Large decreases in production and trade of vegetable oils would result from implementation of the
WHO/FAO norms but the impacts vary greatly for different types of oils:
o Production of soybean oil would decrease by almost three million tons or eleven percent
worldwide, with US producers bearing the bulk of the adjustment, but international trade in
soybean oil would only be marginally affected by the WHO/FAO norms.
o Production of rapeseed oil would shrink by one million tons or seven percent worldwide, and
EU producers would be the most adversely affected. International trade in rapeseed oil would
decrease by fourteen percent.
o Palm oil production would only be marginally affected with Malaysia and Indonesia
accounting for most of the 220,000 tons worldwide reduction.
• The analysis concludes that some meat producers would be negatively affected by the WHO/FAO
norms:
o The largest decline in production would occur in the case of pig meat at five million tons,
which represents only a modest share of world production (five percent). However, the impact
on individual countries would be large, with ten countries likely to incur reductions in
production of more than twenty percent as a result of the norms. International trade in pig
meat would also be affected negatively with a decline of nearly twenty percent. Countries like
Brazil, Poland, Vietnam, Chile, Belarus, Ukraine, Thailand, Swaziland and Zimbabwe stand
to lose a quarter to one-third of their exports of pig meat.
o The calculated decrease in mutton and goat meat production is small at less than 400,000 tons
or less than four percent of world production but here again the trade impact is much larger
(seventeen percent).
o Production of poultry meat would decline marginally (less than one percent) worldwide while
production of beef would increase slightly (by less than four percent).
• The potential effect of the norms on dairy producers around the world is substantial:
o The estimated impact on production of butter and ghee is a decrease of almost one million
tons or thirteen percent of world production. Most affected are New Zealand, which loses
almost half of its export market, the USA and the EU. Altogether, the volume of international
trade in these products contracts by more than a third.
o Cream production would shrink by half a million tons or eighteen percent of world
production, mostly in the EU and North America. International trade in cream would decline
by a third due to the implementation of the norms.
• Besides the effects of the WHO/FAO population nutrient goals evaluated in this report, consumer
preferences for specific food products are also likely to be influenced by the references in the
WHO/FAO report to the harmful effects of the intake of these products. These additional effects,
however, are difficult to quantify. Yet, it is clear that these specific references to individual food items
will be of great importance when countries set food-based (as opposed to nutrient-based) dietary
guidelines. The potential impact of the WHO/FAO report on consumer preferences for individual food
products could be large.
1
Introduction
In April 2003, The UN Food and Agriculture Organization (FAO) and the World Health
Organization (WHO) launched an independent expert report on diet and nutrition, which is
expected to serve as the basis for developing a global strategy to combat the growing burden
of chronic diseases. Diet, Nutrition and the Prevention of Chronic Diseases (WHO: 2003),
the report on a two-year-long Joint WHO/FAO Expert Consultation, reviews the currently
available scientific evidence on the relationship of diet, nutrition and physical activity to
chronic diseases. The report concludes that a diet low in saturated fats, sugars and salt, and
high in vegetables and fruits, together with regular physical activity, will have a major impact
on combating the high toll of death and ill health caused by cardiovascular diseases, several
forms of cancer, diabetes, obesity, osteoporosis and dental disease. The dietary
recommendations contained in the report are expected to play an important role in WHO’s
global strategy to combat chronic diseases. The report notes that chronic diseases are no
longer rich country problems, but are increasingly occurring in the developing world.
WHO/FAO Dietary Intake Goals
The WHO/FAO dietary recommendations for combating chronic diseases specify the share of
energy (calorie) intake that should be contributed by fats (and their various components),
proteins and sugars. In addition they also prescribe certain absolute consumption levels for
cholesterol, sodium chloride (salt), fruit and vegetables and dietary fibre. The range of
population dietary intake goals contained in the WHO/FAO recommendations are
summarised in Table-1 below. The norms recommended by the WHO/FAO have emerged
after a wide-ranging consultation. However, these recommendations have led to a vigorous
debate on the appropriateness of these norms for a wide range of populations in different
countries and the extent to which these recommendations are based on definitive/conclusive
scientific evidence.

2
Table-1: Ranges of Population Dietary Intake Goals
Dietary factor
Goals
Total fat 15-30% energy
Saturated fatty acids <10% energy
Polyunsaturated fatty acids (PUFAs) 6-10% energy
n-6 Polyunsaturated fatty acids (PUFAs) 5-8% energy
n-3 Polyunsaturated fatty acids (PUFAs) 1-2% energy
Transfatty acids <1% energy
Monosaturated fatty acids (MUFAs)
By difference a
Total carbohydrate b
55-75% energy
Free sugars c
<10% energy
Protein 10-15% energy
Cholestrol <300 mg/day
Sodium chloride (sodium) <5 g/day
Fruits and vegetables >= 400 g/day
Total dietary fibre From foods
Non-starch polysaccharides (NSP)
a This means “total fat – (saturated fatty acids + polyunsaturated fatty acids + trans fatty acids)”
b The percentage of total energy available after taking into account that consumed as protein and fat,
hence the wide range. c The term “free sugars” refers to all monosaccharides and disaccharides added to foods by the
manufacturer, cook or consumer, plus sugars naturally present in honey syrups and fruit juices.
Source: (WHO: 2003)
The key recommendations relate to the share of total energy intake that should be obtained
from fat, sugars and proteins. In the case of total fat, the norms are intended to prevent
obesity and unhealthy weight gain and reduce the risk of certain chronic diseases. WHO/FAO
reckon that highly active groups with diets rich in vegetables, legumes, fruits and whole grain
cereals may sustain a total fat intake of up to 35% without the risk of unhealthy weight gain.
The recommendations for total fat are formulated to include countries where the usual fat
intake is typically above 30% as well as those where the usual intake may be very low, for
example less than 15%. Total fat energy of at least 20% is consistent with good health.
However, for countries where the usual fat intake is between 15% and 20% of energy, there is

3
no direct evidence for men that raising fat intake to 20% will be beneficial. For women of
reproductive age at least 20% has been recommended by the Joint WHO/FAO Expert
Consultation on Fats and Oils in Human Nutrition that met in 1993. The key reasons
advanced for recommendation relating to sugar intake are (1) free sugars threaten the nutrient
quality of diets by providing significant energy without specific nutrients (2) free sugars
contribute to the overall energy density of diets and induce higher levels of energy intake and
(3) increased consumption of free sugars is associated with increased problems of oral health,
especially dental caries. The report, however, acknowledges that a goal for free sugars of less
than 10% of total energy is controversial.
Objectives of the Study
The adherence to the WHO/FAO norms is likely to involve major changes in the dietary and
food habits for the population in almost all the countries of the world. The precise nature and
magnitude of the dietary adjustments will depend on how the recommendations of the
WHO/FAO are taken forward through legislative, regulatory or information measures in
different countries. While enforcement of dietary norms is generally difficult, consumer
choice can be influenced through recommendations of health authorities and labelling
requirements that may be put in place, e.g., labelling requirements related to sugar/fat content
of processed foods. Major changes in consumption patterns are likely to have significant
implications for the production and trade of food products, for the pattern of land use in
agriculture and the environmental sustainability of food production. Policies designed to
promote adherence to these norms will have to take into account the impact of these norms on
agricultural producers worldwide.
This study, undertaken for the International Federation of Agricultural Producers, France,
attempts to assess the potential impact of the implementation of the WHO/FAO norms on the
consumption, production and trade of certain important food products, viz, cereals, meat,
dairy products and vegetable oils. The study will mainly focus on the impact of the norms

4
relating to total fat consumption, though adherence to norms relating to protein and sugars
will also be taken into account in assessing the impact on consumption of different food
products. The key objectives of the study are the following:
1) Assessment of the current situation of developed and developing countries with
respect to these norms. Our analysis will quantify the extent of excess consumption of
fat in these countries.
2) Quantitative assessment of the impact of adherence to WHO/FAO norms on the
consumption of the selected food products by country and region.
3) Qualitative assessment of the impact of WHO/FAO norms on production and trade of
the selected food products following from the changes in consumption predicted in
the second step of the analysis.
Methodology Overview
The assessment of the current situation of countries with respect to the WHO/FAO norms
will be attempted using food balance sheet data contained in the FAOSTAT Nutrition
database (FAO: 2001). In countries where the current consumption of fat exceeds the
recommended norm, we will estimate the dietary changes required to adhere to the norms for
fat, sugar and proteins1. Fats are derived from a large number of food products and, therefore,
a large number of diets that conform to the norms are theoretically possible. We propose to
use a programming approach to predict the changes in consumption of selected food products
most likely to occur if consumers were to adhere to the WHO/FAO norms. Given the
persistence of dietary patterns and preferences, our analysis will assume that in adjusting their
consumption of food products to adhere to these norms, consumers will prefer to modify their
current diet as little as possible.
___________________________________________________________________________ 1 The norms related to various sub-components of fats (e.g. saturated and unsaturated fats) are not explicitly
considered in our programming model. However, we do check whether the recommended dietary patterns that
result from our model are in conformity with the norms for different subcomponents of fats.

5
The production and trade impacts of consumption changes will depend on the policy
responses of different countries relating to imports and support for domestic production.
Faced with large changes in consumer demand for certain products (say for instance, a sharp
decline in consumption), countries could choose policies that protect domestic production and
only reduce imports. Alternatively, they could choose a policy mix that affects both domestic
production and imports. We will evaluate the production impact under the assumptions that
(1) when net importing countries are faced with a decline in consumption, they will first
reduce imports and attempt to protect domestic production to the extent possible (2) when net
exporting countries are faced with a decline in consumption, there will be corresponding
decline in their production (i.e., it will not be possible for net exporting countries to increase
their exports in a situation of declining international trade). While these assumptions are not
entirely realistic, especially in the context of the provisions of the WTO Agreement on
Agriculture for liberalisation of agricultural trade, these assumptions are likely to give us the
“upper bound” estimates of trade impacts.
This study is based on average food consumption data aggregated at the national level.
Changes in dietary patterns required for conforming to WHO/FAO norms are estimated only
for those countries, which are currently exceeding the fat consumption norms, on average. As
we shall see later these countries are mainly developed countries. Diets and energy/nutrient
intake in these countries could vary significantly across different socio-economic and
demographic groups. The estimates of changes in consumption required, based on average
intakes, could be biased downward if there are large groups in the population whose intake is
considerably higher than the average. Using consumption data for the United Kingdom for
different income groups, we will assess whether this downward bias is likely to be
significant.
It must be noted that even in countries that are currently in conformity with the norms on
average, there may be large sections of the population whose consumption patterns are not in
conformity with the recommended norms. Our study does not attempt to estimate the

6
adjustment in consumption required by these sections of the population in “conforming”
countries. However, the “double burden of malnutrition” in developing countries, where
malnutrition co-exists with excess consumption of nutrients and resulting obesity is now
recognised in the literature (Gillespie and Haddad: 2003).
Our objective in the study in the study is to produce “quick” estimates of the consumption,
production and trade impacts and indicate the direction of change and broad orders of
magnitude. We have, therefore, not attempted an econometric estimation of the impacts,
owing to constraints of time and data availability.
Review of Current Levels of Fat Consumption
The principal WHO dietary norm of relevance to this study concerns the share of fat in total
energy intake – the fat to energy ratio (FER). The norm requires this to be in the 15% to 30%
range. Using the FBS dataset for 2000, we calculated the current status in each of the 173
countries in the dataset. This information is presented in regional format in Figure 1 below,
and in detail in Appendix 1, in descending order of FER. Appendix 1 shows forty-nine
countries (in red) are in excess of the 30% upper limit, while 20 countries (in blue) are below
the 15% lower limit. There is a clear and unsurprising pattern in the ordering of the list. Most
of the 49 countries with Fat Energy Ratios greater than 30% are either developed nations of
the western hemisphere and Oceania, or East European countries2.
Clearly, although the fat composition of diets in several developing countries has been
increasing over time as per the WHO/FAO report, most developing countries are still below
the 30% benchmark3. Developing countries with relatively large populations and large
economies, such as India, China and Brazil, are in the ‘acceptable’ 15 to 30% range. The 20
___________________________________________________________________________ 2 There are also a number of small island-states (Bermuda, French Polynesia, Fiji, etc.) in this group of 49,
possibly reflecting their inability to produce diversified items for their diets given their land and natural resource
constraints, and their limited capacity to import.
3 Of course, there are the occasional exceptions such as Mongolia and Paraguay, where dietary preferences,
climatic factors and resource endowments cause local diets to be centred on animal products. Diets in these
countries are therefore relatively high in fat composition in spite of the underdeveloped status of these countries.

7
countries below the minimum 15% mark are predominantly poor countries with relatively
small economies.
Figure 1: Share of Fat in Total Energy Intake, All Countries 2000
Our ultimate objective in this study is to analyze the potential production and trade impacts of
adherence to the new WHO norms, and the analysis of consumption changes is a first step
towards that goal. Since the countries below the 15% mark are mostly relatively small
economies that are small players in the world market, we ignore the changes implied by these
countries raising their fat intakes to the recommended 15%. In other words, we focus
exclusively on the changes implied by countries above the norm adjusting their dietary
patterns to meet the recommendations. From this list of countries (red in Appendix 1), we
also drop very small nations (such as Bermuda, Kiribati, Seychelles, etc - red but non-bold in
appendix 1) that are unlikely to have a major impact on global production and trade patterns.
The remaining 35 countries (red and bold in Appendix 1) are retained for analysis. They
comprise mostly West European and North American countries, but also include a number of
0%
5%
10%
15%
20%
25%
30%
35%
40%
45%
Euro
pean
Unio
n
Nort
h A
merica
Oceania
Easte
rn
Euro
pe
South
Am
erica
Centr
al A
sia
Centr
al
Am
erica
East/S
outh
East A
sia
South
Asia
Afr
ica
World
Fat Energy Ratio, 2000

8
middle-eastern and East European countries. Since many of the largest economies in the
world are represented in this list, significant changes in their consumption patterns to meet
the WHO norms are also likely to have significant implications for international trade as well
as producers around the world.
Consumption Impacts
Data
The assessment of changes in consumption across the world in response to the hypothetical
implementation of new WHO guidelines requires cross-country consumption data that are
recent and consistently defined across countries. Ideally, data collected from dietary surveys,
such as the National Diet and Nutrition Survey in the UK, and the National Health and
Nutrition Examination Survey in the US, would form the basis of such analysis. However,
such surveys are only available for a limited number of countries, and even those are subject
to wide differences in definitions and data collection methodologies. Hence, we adopt FAO’s
Food Balance Sheet (FBS) dataset as the basis for this work.
The FBS dataset records the sources of supply of major foods in each country and their
utilization. On the supply side, it accounts for production, imports and changes in stock
during the year. On the utilization side, it records exports, livestock and feed uses, use in
manufacture for food use and non-food uses and losses during storage and transportation,
thereby arriving at estimates of food supplies available for human consumption4. Thus, it
provides estimates of ‘supplies available for per-capita consumption’ rather than registering
actual household consumption itself. Its prime advantages from the point of view of this
study are its international coverage, its consistency of definitions, categories and data across
countries, and its ready availability. In addition to food balances itself, the FBS also provides
estimates of per capita calorie, fat and protein intake deriving from each food category, which
is of considerable help to this study. On the other hand, a major disadvantage in using the
FBS dataset for our exercise is that food supplies available for per-capita consumption do not
___________________________________________________________________________ 4 FAO (2001): Food Balance Sheet Explanatory Notes: http://www.fao.org/waicent/faostat/agricult/fbs-e.htm
9
always reflect actual consumption accurately. For example, household waste and spoilage is
not accounted for in these data, and the nutrient calculations do not take account of the
transformation of nutrient composition during the process of cooking. Another disadvantage
is that the FBS data only present an average picture, not capturing the heterogeneity inherent
in diets within a country. When we extrapolate from these average figures for a country to the
entire country, some inaccuracies can arise. For instance, using the average per capita food
supplies in a country one may find that a dietary norm is not violated, and proceed to apply
this result for the entire country. However, it may well be that certain sections of the
population (for example, people in certain income groups or belonging to a certain ethnic
classes) have diets that violate the norms, but this is not reflected when extrapolations are
made from the average.
In spite of these drawbacks, it is our opinion that the FBS data do provide a good basis for
rough and ready ‘big picture’ international comparisons. It has been put to such use
previously in the WHO/FAO report under consideration, previous FAO documents (FAO:
1994), as well as academic research5. We make note of the inherent deficiencies, and move
on to discussion of methodology.
Methodology
While the existing baseline consumption and nutrition patterns are available for each country
from the FBS, we need to simulate the changes that would occur if countries around the
world were to adhere to the new WHO/FAO guidelines. Mathematical programming is one
way to estimate plausible reformulations in diets in response to nutritional constraints, and is
the approach adopted here.
___________________________________________________________________________ 5 For example, Guo, X, et al. (2000).
10
Mathematical programming has a long history in the analysis of human diets6. Linear
programming (LP) models, typically involving minimization of costs while meeting specific
nutritional requirements, have been constructed for several countries. A variety of approaches
have been taken, based on various underlying assumptions. For instance, some studies restrict
themselves to the problem of providing adequate nutrition at minimum cost, with no
palatability considerations, while others build in extensive information on palatability and
substitutability between specific foods.
Alternatives to LP models include multiple-objective programming and goal programming,
where several considerations relating to diets are optimized simultaneously. Another
approach is that of quadratic programming (QP), where deviations from actual consumption
levels are minimised while satisfying nutritional considerations7. This approach is based on
the paradigm that consumer preference and palatability considerations are manifested in the
observed food choice. Radical changes from the observed choices are unrealistic, and hence
deviations from the original diet are made as small as possible when estimating the new diet
that meets the nutritional constraints.
QP is the technique used in this study. One reason for adopting this specification is its
intuitive appeal, described above. Another consideration is the lack of availability of detailed
cross-country price information to cost diets, due to which model specifications based on diet
costs are ruled out. Whilst recent food price data are readily available for some countries,
such as the USA and the UK, they are far more difficult to obtain for many other countries
under consideration. Given the QP model formulated here completely abstracts from prices,
there is some comfort to be taken in knowing that, since the new diet is chosen to deviate
___________________________________________________________________________ 6 In fact, diet optimization was one of the early uses to which linear programming techniques were applied,
when the US Army attempted to formulate diets that would meet nutritional requirements of GIs at minimum
cost.
7 This was the basis for the United States Department of Agriculture’s ‘Thrifty Food Plan’, which informs the
Food Stamp Program.

11
minimally from observed diets, the cost of the new diet is unlikely to stray radically from the
observed one.
The QP model constructed can be informally described as below:
Objective function: Minimise the weighted sum of squared deviations between the
components of the new diet and the observed one (the weights being the contributions of the
food products to the total energy intake).
Choice variables: The new diet, i.e., new per-capita consumption quantities for each food
item in the FBS.
Constraints:
(a) Total fat to energy ratio (share of energy derived from fat in the total supply of energy in
kcal) does not exceed 30%.
(b) Total protein to energy ratio (share of energy derived from protein to the total supply of
energy in kcal) does not exceed 15%.
(c) Total sugar to energy ratio (share of energy derived from sugars and sweeteners to the
total supply of energy in kcal) does not exceed 10%.
(d) Consumption of alcoholic beverages should not increase compared to the observed
baseline.
(e) Total energy in kcal should not decline relative to the observed baseline.
The following points are worth noting:
(i) As is usual in quadratic programming, the sum of squared deviations is minimised
instead of the sum of the deviations themselves, in order to prevent a ‘cancelling out’
effect. Deviations are expressed in percentage terms. This prevents an unnatural
situation where items that are consumed in relatively small amounts at the baseline
expand or contract in large percentage terms when the diet is reformulated.
(ii) Constraints (a), (b), and (c) are the principal dietary guidelines contained in the
WHO/FAO report.
(iii) Constraint (d), although not formally a part of the WHO guidelines, is included in
order to prevent the obviously undesirable new diet outcomes that may emerge if

12
alcoholic beverages are allowed to freely expand within new diets. Such expansion is
particularly likely if alcoholic items are unconstrained, since they typically are a
source of calories with relatively modest fat content.
(iv) Constraint (e) appears so that the changes in the diet can be solely attributed to the
imposition of the WHO/FAO guidelines. In the absence of this constraint, i.e. if
calorific reductions are allowed, it would become harder to attribute changes in diets
solely to the guidelines. Additionally, changed diet scenarios involving significant
reductions in energy intake are also unrealistic.
(v) Some sub guidelines included in the FAO report are not explicitly included in the
optimization model here. The most important among these is the requirement that
saturated fats provide no more than 10% of the total energy intake. The primary
reason for the omission of a saturated fat constraint here is data non-availability. The
FBS dataset provides estimates of energy, total fat, protein and carbohydrate contents
of each food item, but does not break those figures down into sub-categories such as
saturated fat. Of course, nutrient content databases, such as the USDA’s nutrient
calculator are available, listing the nutritional composition (including saturated fat
content) of individual food items. However, the FBS dataset is composed of food
categories that are aggregated from individual food items. It does not provide break-
ups of the categories into individual food items, thus making it impossible to
accurately match FBS and nutrient content databases8.
Nevertheless, it is recognized here that the saturated fat guideline is an important one. Hence,
although an explicit constraint is not included in the QP model for saturated fat, we perform
informal checks for estimated saturated fat content of the revised diets produced by the QP
model. We do this by matching each FBS food category with a representative food item in
USDA’s nutrition database, and using the saturated fat levels given by the latter. Although
___________________________________________________________________________ 8 For instance, the FBS dataset includes an item called ‘Bovine Meat’ and provides information on consumption,
calories, fats, etc derived from this category. However, there are hundreds of individual food products that make
up ‘bovine meat’ and the breakdown used to construct the aggregate is not available. These individual food
products vary widely with regard to saturated fat content.

13
our derived saturated fat estimates for each FBS food category are too approximate and
informally derived to be worthy of inclusion in our formal modelling, they are still viewed as
useful in making ex-post informal checks.
Results
Dairy & Animal Fat Products
9
An aggregated summary of the consumption impacts on dairy and animal fat products is
presented in Figures 2 and 3. Milk is by far the most important dairy item in terms of volume
of consumption, with more than 200 million metric tons of milk currently being consumed
across the 35 countries studied. Somewhat surprisingly, the reduction in milk consumption
predicted by the model is small enough to be negligible, 0.02% of current levels in the set of
countries analysed10
.
There are several good reasons for this. Firstly, note that the fat content of milk is typically
small compared to the fat content of other dairy products such as butter, ghee and cream11
.
Increasing proportions of globally consumed milk volumes are low fat or skimmed.
Secondly, while our modelling predicts significant consumption reductions for some large
consumers of milk, such as France and Italy (consumption reductions of 1.2 million tons
each), it also predicts increases in milk consumption in some countries such as Argentina,
Australia and Belgium. Thirdly, note that our estimates refer only to the consumption of milk
itself, and not products based on milk. If other dairy products were converted into their milk
equivalents, the impacts on milk would be more pronounced. However, we analyse other
dairy products separately from milk in this document.
___________________________________________________________________________ 9 Raw animal fats have been grouped together with dairy products here for convenience.
10
Note that the percentage reductions referred to here are relative to the baseline consumption in the 35
countries above the total fat benchmark, not relative to world consumption.
11
The fat content per unit of butter can typically be expected to exceed the fat content of an equivalent unit of
milk (in weight) by a factor of 20 to 30.

14
Figure 2: Changes in Milk Consumption (35 Countries)
Figure 3: Changes in Consumption of Dairy Products & Animal Fats
0
5 0 0 0 0
1 0 0 0 0 0
1 5 0 0 0 0
2 0 0 0 0 0
2 5 0 0 0 0
In it ia l c o n s u m p tio n F in a l c o n s u m p tio n
Th
ou
sa
nd
s o
f M
etr
ic T
on
s
0 . 0 0
5 0 0 . 0 0
1 0 0 0 . 0 0
1 5 0 0 . 0 0
2 0 0 0 . 0 0
2 5 0 0 . 0 0
3 0 0 0 . 0 0
3 5 0 0 . 0 0
4 0 0 0 . 0 0
4 5 0 0 . 0 0
R a w A n i m a l
F a t s
B u t t e r & G h e e C r e a m
Th
ou
sa
nd
s o
f m
etr
ic t
on
s
In i t ia l c o n s u m p t io n F in a l c o n s u m p t io n
15
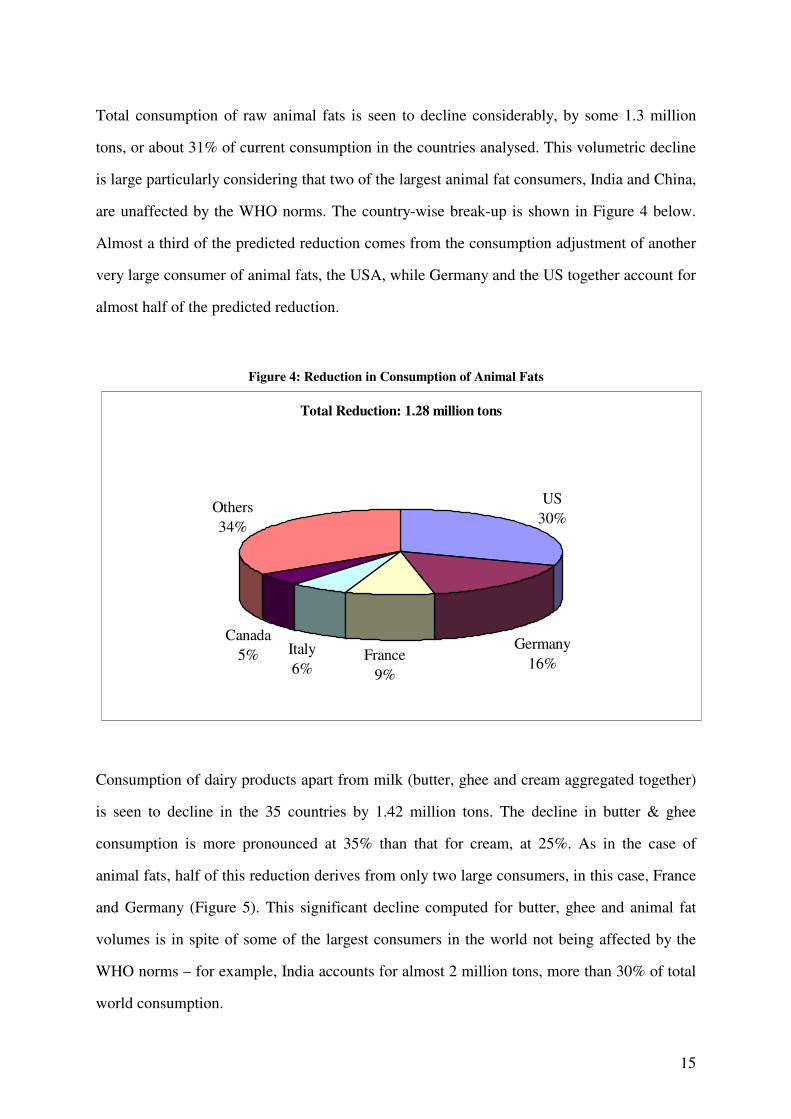
Total consumption of raw animal fats is seen to decline considerably, by some 1.3 million
tons, or about 31% of current consumption in the countries analysed. This volumetric decline
is large particularly considering that two of the largest animal fat consumers, India and China,
are unaffected by the WHO norms. The country-wise break-up is shown in Figure 4 below.
Almost a third of the predicted reduction comes from the consumption adjustment of another
very large consumer of animal fats, the USA, while Germany and the US together account for
almost half of the predicted reduction.
Figure 4: Reduction in Consumption of Animal Fats
Consumption of dairy products apart from milk (butter, ghee and cream aggregated together)
is seen to decline in the 35 countries by 1.42 million tons. The decline in butter & ghee
consumption is more pronounced at 35% than that for cream, at 25%. As in the case of
animal fats, half of this reduction derives from only two large consumers, in this case, France
and Germany (Figure 5). This significant decline computed for butter, ghee and animal fat
volumes is in spite of some of the largest consumers in the world not being affected by the
WHO norms – for example, India accounts for almost 2 million tons, more than 30% of total
world consumption.
Total Reduction: 1.28 million tons
US
30%
Germany
16%France
9%
Italy
6%
Canada
5%
Others
34%

16
Figure 5: Reduction in Consumption of Dairy Products
Meats
About 85 million tons of meat were consumed across these countries in the year 2000. Pig
meat was the largest constituent, at 29 million tons of consumption, while poultry and bovine
meats were almost as important, at 26 and 25 million tons each. Mutton, goat and other meats
were relatively minor, making up the remaining 4 million tons. Our modelling revealed an
asymmetric consumption change across these categories, however (Figure 6 below). Pig meat
consumption registered a significant drop in response to adherence to the WHO norms,
declining by a little less than 5 million tons, or 16.3%. Mutton and goat similarly declined by
about 16% of their original, relatively modest levels. However, there was only a small effect
on world poultry consumption, with consumption shrinking by 646,000 tons, or 2.4% of
original intake in the 35 countries. Surprisingly, meat from bovine sources was predicted to
increase in consumption by 916,000 tons.
Total Reduction: 1.42 million tons
US
14%
Germany
25%
France
24%
Italy
7%
Canada
5%
Others
25%

17
Figure 6. Changes in Consumption of Meats (35 Countries)
This seemingly curious result is explained by the fact that the fat content per (weight) unit of
bovine meats, is on average, significantly lower than that for pig meat. Thus, although certain
individual items under bovine meat may contain high levels of fat, the average of all the
consumed bovine meat items has lower total fat content than the average for pig meat and
mutton/goat items. Since meats are substitutes for each other, and are all significant providers
of total energy and protein, the model predicts that many countries attempting to adhere to the
WHO norms would substitute lower fat meats for higher fat meats in their diets. To take one
example, our model predicts that Australia’s pig meat consumption would contract by 84,000
tons, while its bovine meat consumption would expand by 8,000 tons
We now restrict our attention to the meat products that are predicted to experience reduced
consumption, i.e., pig, poultry and mutton/goat meat, and consider them in an aggregated
fashion. The total reduction in the consumption of these meats is about 5.8 million tons. The
Meat Consumption
0.00
5000.00
10000.00
15000.00
20000.00
25000.00
30000.00
35000.00
Bovine Meat Mutton &
Goat Meat
Pigmeat Poultry Meat Meat, Other
Th
ou
san
ds
of
Met
ric
To
ns
Initial Consumption Final Consumption
18
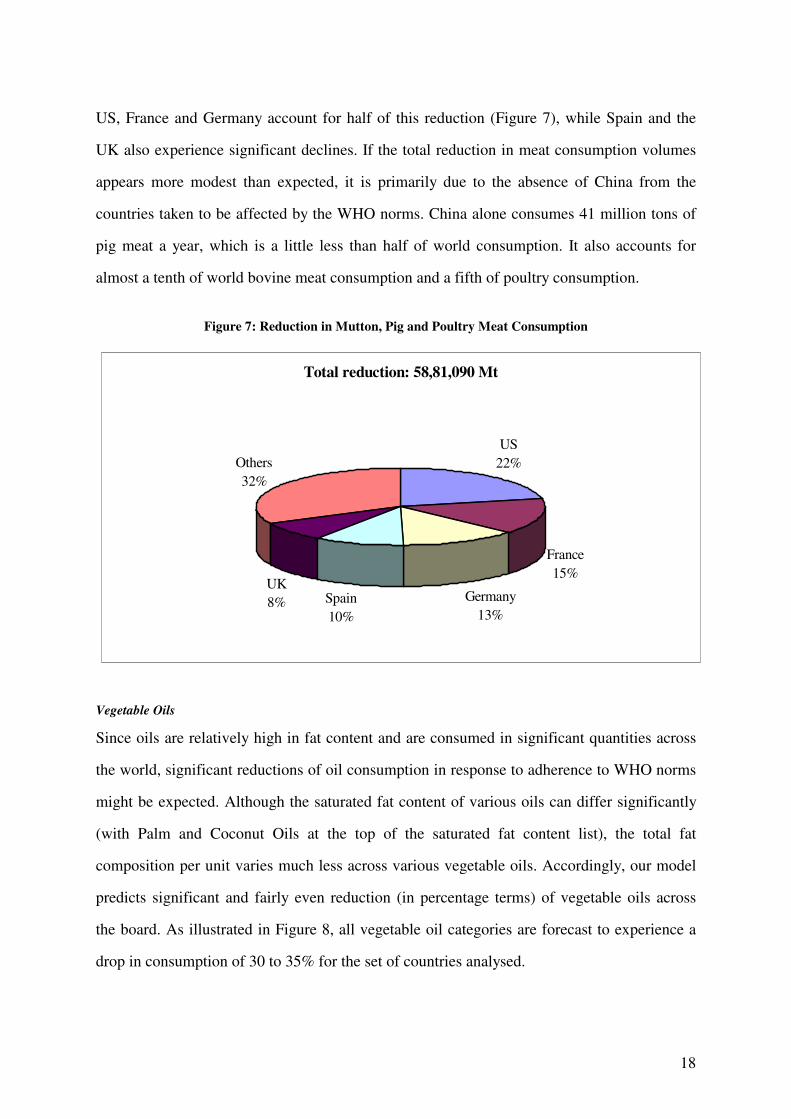
US, France and Germany account for half of this reduction (Figure 7), while Spain and the
UK also experience significant declines. If the total reduction in meat consumption volumes
appears more modest than expected, it is primarily due to the absence of China from the
countries taken to be affected by the WHO norms. China alone consumes 41 million tons of
pig meat a year, which is a little less than half of world consumption. It also accounts for
almost a tenth of world bovine meat consumption and a fifth of poultry consumption.
Figure 7: Reduction in Mutton, Pig and Poultry Meat Consumption
Vegetable Oils
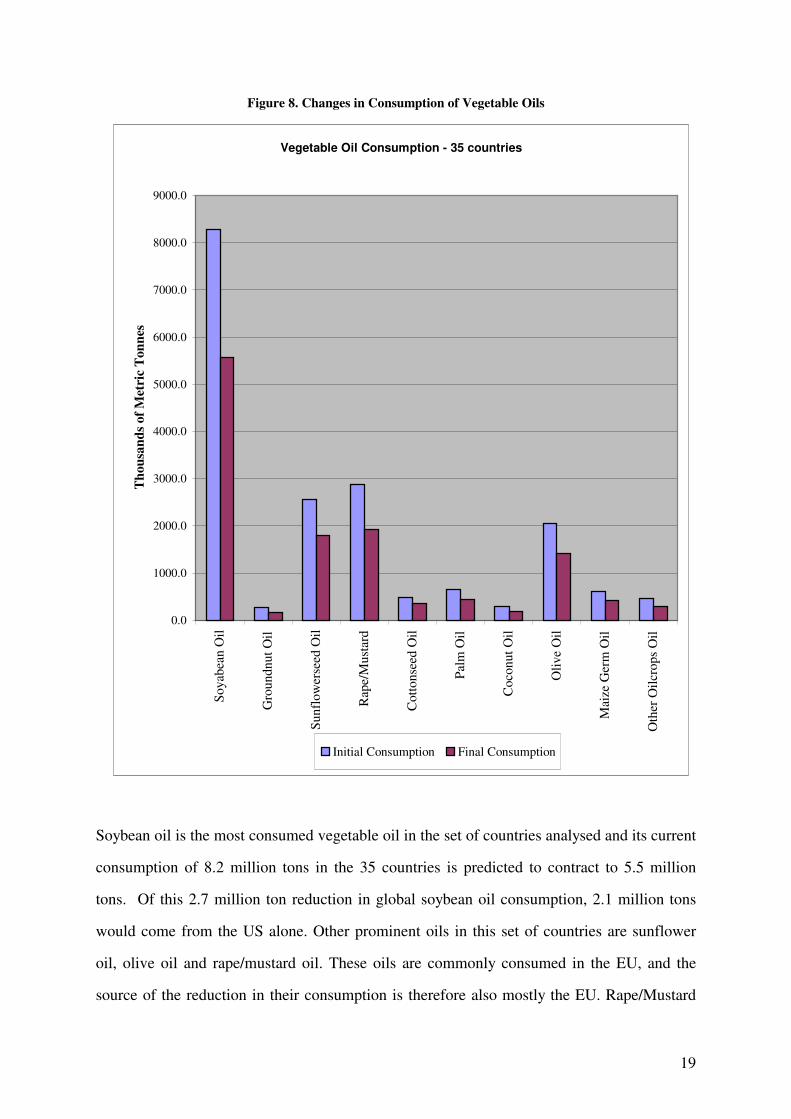
Since oils are relatively high in fat content and are consumed in significant quantities across
the world, significant reductions of oil consumption in response to adherence to WHO norms
might be expected. Although the saturated fat content of various oils can differ significantly
(with Palm and Coconut Oils at the top of the saturated fat content list), the total fat
composition per unit varies much less across various vegetable oils. Accordingly, our model
predicts significant and fairly even reduction (in percentage terms) of vegetable oils across
the board. As illustrated in Figure 8, all vegetable oil categories are forecast to experience a
drop in consumption of 30 to 35% for the set of countries analysed.
Total reduction: 58,81,090 Mt
US
22%
France
15%
Germany
13%
Spain
10%
UK
8%
Others
32%
19
Figure 8. Changes in Consumption of Vegetable Oils
Soybean oil is the most consumed vegetable oil in the set of countries analysed and its current
consumption of 8.2 million tons in the 35 countries is predicted to contract to 5.5 million
tons. Of this 2.7 million ton reduction in global soybean oil consumption, 2.1 million tons
would come from the US alone. Other prominent oils in this set of countries are sunflower
oil, olive oil and rape/mustard oil. These oils are commonly consumed in the EU, and the
source of the reduction in their consumption is therefore also mostly the EU. Rape/Mustard
Vegetable Oil Consumption - 35 countries
0.0
1000.0
2000.0
3000.0
4000.0
5000.0
6000.0
7000.0
8000.0
9000.0
Soyab
ean O
il
Gro
un
dn
ut
Oil
Sunfl
ow
erse
ed O
il
Rap
e/M
ust
ard
Cott
onse
ed O
il
Pal
m O
il
Coco
nut
Oil
Oli
ve
Oil
Mai
ze G
erm
Oil
Oth
er O
ilcr
ops
Oil
Th
ou
san
ds
of
Met
ric
Ton
nes
Initial Consumption Final Consumption
20
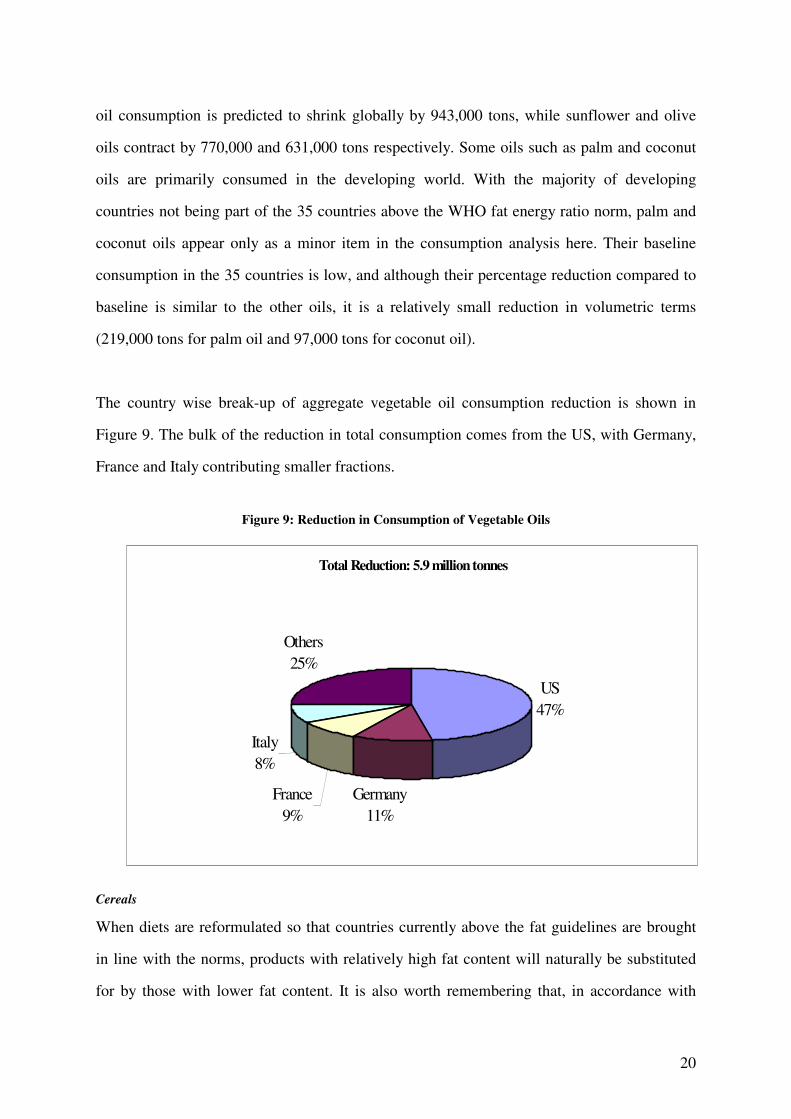
oil consumption is predicted to shrink globally by 943,000 tons, while sunflower and olive
oils contract by 770,000 and 631,000 tons respectively. Some oils such as palm and coconut
oils are primarily consumed in the developing world. With the majority of developing
countries not being part of the 35 countries above the WHO fat energy ratio norm, palm and
coconut oils appear only as a minor item in the consumption analysis here. Their baseline
consumption in the 35 countries is low, and although their percentage reduction compared to
baseline is similar to the other oils, it is a relatively small reduction in volumetric terms
(219,000 tons for palm oil and 97,000 tons for coconut oil).
The country wise break-up of aggregate vegetable oil consumption reduction is shown in
Figure 9. The bulk of the reduction in total consumption comes from the US, with Germany,
France and Italy contributing smaller fractions.
Figure 9: Reduction in Consumption of Vegetable Oils
Cereals
When diets are reformulated so that countries currently above the fat guidelines are brought
in line with the norms, products with relatively high fat content will naturally be substituted
for by those with lower fat content. It is also worth remembering that, in accordance with
Total Reduction: 5.9 million tonnes
US
47%
Germany
11%
France
9%
Italy
8%
Others
25%

21
intuition, our model is formulated to minimise deviations in percentage terms from existing
diets. Cereals, as good providers of energy at low fat content, and already constituting
significant portions of existing diets in the analysed countries, are obvious candidates to
replace the declining dairy, oils and meat product demand described above.
The model does indeed predict very significant gains to the cereal sector. Global wheat
consumption alone is predicted to increase by 25 million tons. Maize, barley, rye, oats, millet
and sorghum jointly contribute another 4 million tons to bring the global increase in cereal
demand predicted by the model to 29 million tons.
A 29 million ton increase in cereal consumption would appear to constitute a very significant
boost for this sector. However, it is important to note one aspect that shows this increase to be
illusory: changes in final demand for some products may also generate changes in
intermediate demand for some other commodities. For instance, the calculated decrease in
meat consumption would result in a decrease in demand for animal feeds (mainly cereals).
This effect is likely to be large because about half of world cereal production is consumed by
non-food uses (FAOSTAT). It is important to calculate such effects and adjust the demand
change figures for cereals accordingly.
In order to measure the final effect of the WHO norms on demand for cereals, we applied a
methodology previously used by FAO (Bouwman: 1997). First, the change in demand for
animal products was converted into a change in ‘feed intensity weighted livestock
production’, denoted ∆LP, by applying the following formula: ∆LP=0.3(∆beef+∆mutton) +
0.1(∆milk)+1.0(∆pork+∆poultry+∆egg) where ∆x represents a change in final demand for
livestock product x12
. This change in demand for livestock products was then converted into a
change in demand for cereals by using an appropriate feed intensity coefficient. Because
almost all of the countries where final demand for livestock products decreases as a result of
___________________________________________________________________________ 12
The total decrease in demand for milk was computed by first converting variations in demand for cream and
butter into their milk equivalents.

22
the WHO norms are high-income countries, we used the feed intensity coefficients reported
by Bouwman (1997) for developed countries13
.
The calculated decline in feed demand for cereals is large and equal to 25 million tons for the
world. This decrease almost nullifies the calculated increase in human consumption of cereal
of 29 million tons. Hence, the analysis demonstrates that implementation of the WHO norms
would have a large negative effect on total demand for livestock products in many countries
while total demand for cereals would remain relatively unaffected. A similar quantitative
exercise was carried out for roots & tubers as well as oilseeds. It revealed that the ‘feed
effects’ of the WHO norms were relatively small for these products and we therefore choose
not to report them.
Consumption Impacts: Saturated Fat Concerns
In the preceding analysis of consumption impacts, our QP model’s constraints related to
energy, total fat, protein, sugar and alcohol. The new WHO guidelines include a specific
saturated fat component, specifically that saturated fats should provide no more than 10% of
total energy intake. As discussed before, the main reason for omitting an explicit saturated fat
constraint has been data non-availability, specifically the unavailability of information on
what individual food items in what quantities comprise FAO’s aggregate food category
consumption figures in each country.
Without the disaggregated data, it is impossible to ascribe saturated fat estimates for inclusion
in the model. However, in recognition of the importance of the saturated fat constraint, we do
an ex-post, informal check of approximate saturated fat composition of the reformulated diets
produced by the model. We do this by matching the aggregate food category with one
particular disaggregated food item belonging to that category, and using the saturated fat
estimate for that disaggregated item. Obviously, the reliability of this method is far better
when there are not too many items that fit under a particular aggregate category. For instance,
___________________________________________________________________________ 13
The feed intensity coefficients reported are 3.6 for cereals, 0.6 for roots and tubers and 14 for oilseeds.

23
the category of eggs has limited variants, but a category such as bovine meat involves
numerous constituents.
Using these proxy saturated fat numbers, we calculated the saturated fat to energy ratios for
the reformulated diets of 5 countries with relative fat-intensive diets. The results were as
follows: France: 9%, US: 9%, UK: 10%, Spain 8%, Germany, 10%. Thus, there is at least
weak evidence available to suggest that the reformulated diets estimated by our QP models
for each country do broadly meet the WHO saturated fat constraints.
Consumption Impacts: Distributional Concerns
One remaining concern is that we are using population average dietary figures to make
extrapolations to changes in aggregate consumption, production and trade in countries.
Where these mean figures disguise substantial variation within the population, there is scope
for extrapolations from the mean to be misleading. For instance, the average household in a
certain country may have a diet that already conforms to the WHO guidelines. If we
extrapolate from this average household to the entire country, we would conclude that no
consumption changes need take place in that country in response to WHO guidelines.
However, households in lower or higher income categories (the tails of the distribution) may
indeed have diets that do not conform to the guidelines. Extrapolations from the mean would
miss out the needed consumption changes for these households.
This issue cannot be tackled without detailed dietary survey data for each country, broken
down into various categories. This is simply not available on an international basis, and thus
this concern cannot be tackled here. We did check survey results from one country for which
such detailed results are indeed available: the UK. Results from the National Food Survey
2000, documents from which are archived at the UK Department of Environment, Food and
Rural Affairs website, show that there is little evidence to indicate that the fat composition of
diets varies by income groups in the UK. Thus, although there is little we can do about
addressing these distributional issues here, they may equally not be a significant concern for
many countries.

24
Production and Trade Impacts
The analysis of the consumption impact of the WHO/FAO norms demonstrated that these
norms would, in many instances, have a profound effect on final demand for agricultural
commodities. These changes in demand are bound to affect agricultural production and trade
as well as farm income throughout the world and it is these effects that we now aim to
quantify.
Methodology
The assessment of the production and trade impacts of the WHO guidelines is to some extent
more complex than that of the consumption impacts because markets for primary agricultural
commodities are, as a rule, strongly distorted. Almost all developed countries protect their
agricultural producers while many developing countries, in the contrary, tax agricultural
production as a way of raising revenue. This is relevant because it means that a change in
food consumption in a particular country can affect producing countries in a variety of ways,
depending on the policy response that this change in demand is likely to induce. Hence, both
the competitive position of countries and the process by which they formulate agricultural
policies should ideally be taken into account when quantifying the production and trade
impacts of the WHO norms. One can illustrate this idea by considering the policy options that
would be available to the EU following a sharp decline in domestic consumption of dairy
products. Reducing production quotas would restore the equilibrium but that measure would
harm EU producers and therefore generate political opposition. The EU could also consider
increasing its export subsidies to the dairy sector, which would limit the impact of the
demand change on domestic producers at the expense of non-EU producers exporting their
dairy products to the world market or competing domestically with EU dairy products. The
EU could even decide to administratively reduce imports of dairy products in order to adjust
total supply to the depressed level of demand, which would again have a negative effect on
non-EU exporters.
As our study considers a large number of countries and a large number of commodities,
however, it is not realistically possible to capture accurately the endogenous nature of

25
agricultural policies. Simplifications are therefore necessary and our simulations are based on
the following assumptions:
a. If demand for a particular agricultural commodity decreases in a net exporting
country, domestic production in that country adjusts by the same amount.
b. If demand for a particular agricultural commodity declines in a net importing
country, the country responds solely by reducing imports. However, if the decline
in demand exceeds total imports, the difference is accounted for by a decrease in
domestic production.
c. The total decrease in imports calculated from application of assumption (b) above
is then allocated to exporting countries based on their shares of world exports of
that particular commodity.
Assumption (a) is based on the idea that exporting countries facing a decrease in domestic
demand for their products would also struggle to find new export markets given that the
WHO/FAO norms would reduce global demand for the commodity considered. In importing
countries, however, it is likely that a decrease in demand for a product would result in
increased protectionist pressure originating from domestic producers seeing their livelihoods
threatened and, ultimately, in a decline in imports achievable by the introduction of new trade
barriers. This is all the more realistic that, as established in the first part of the report, a vast
majority of the countries experiencing declines in food consumption as a result of the WHO
norms belong to the developed world where farmers are politically powerful. Assumption (c)
simply aims to take into account the competitive position of exporting countries based on
their past export performances. Note, however, that this assumption is somewhat restrictive in
that it implies that the trade patterns of the countries reducing their imports of a particular
commodity are identical to those of countries not reducing their imports of that commodity14
.
This assumption was made because bilateral trade data were simply not available for all the
commodities considered in this study15
.
___________________________________________________________________________ 14
That is, if country A accounts for n% of world exports of a given commodity, we also assume that it accounts
for n% of total exports to the subset of countries reducing their imports of that commodity.
15
More precisely, we initially tried to use the FAO’s world agricultural trade matrix in order to get an accurate
representation of the bilateral trade flows of agricultural commodities. However, this data set proved grossly
inconsistent with FAOSTAT data and the FAO warns that its coverage is only partial (‘the detailed data
26
Results
Meat
Bovine Meat
World production of bovine meat was estimated at 59.8 million tons in 2000. Of this, the
countries that are currently above the WHO/FAO fat consumption norm accounted for 25.07
million tons. Our results show that in these countries, consumption of bovine meat is likely to
increase by 3.65% to 26 million tons. This is mainly on account of the movement away from
meats like pig meat and mutton/goat meat, which, on average, have a much higher fat
content. As our model predicts a marginal increase in consumption of bovine meat in the
“adjusting” countries, we have not attempted a more detailed country-by-country analysis of
production and trade impacts for bovine meat.
Pig meat
The impact of adjustment to WHO/FAO norms on the production of pig meat is summarised
in Table-2. The table shows the impact on production of pig meat in the top 20 countries
faced with the largest decline in production.
contained here include only those provided electronically by countries’, see website at
http://www.fao.org/es/ess/watm.asp)

27
Table-2: Decrease in Pig Meat Production - Top 20 Countries and World
Country Production (000 MT) Decline in production
(000 MT)
Percentage decline in
production
United States of America 8597.00 1072.31 12.47%
France 2312.00 738.88 31.96%
Spain 2912.39 608.59 20.90%
Denmark 1624.50 439.63 27.06%
Netherlands 1622.80 399.90 24.64%
Germany 3981.90 320.44 8.05%
Canada 1640.54 291.54 17.77%
Belgium 1065.40 249.13 23.38%
Serbia and Montenegro 655.40 131.19 20.02%
Hungary 640.98 109.66 17.11%
Austria 624.00 106.93 17.14%
Australia 362.86 84.65 23.33%
Switzerland 225.07 51.60 22.93%
Brazil 1887.80 49.57 2.63%
Ireland 226.40 35.06 15.49%
Finland 172.79 34.46 19.94%
Poland 1923.00 25.07 1.30%
Viet Nam 1409.02 24.08 1.71%
Norway 102.91 23.88 23.20%
Czech Republic 416.60 15.04 3.61%
World 89534.90 4851.94 5.42%
Total world production of pig meat in 2000 was estimated at 89.53 million tons.
Implementation of the norms is likely to lead to a 5.42% (4.85 million tons) decline in total
world production. The largest decreases in production are expected to occur in the United
States, Canada and European countries. It must be noted that with a production of 41 million
tons, China accounts for nearly 46% of total world production of pig meat, but is not a major
net exporter. China is not currently above the norm for fat consumption and is, therefore, not
required to reduce its consumption of pig meat. The impact of the norms on pig meat
production will appear to be much higher (about 10%) if we consider world production
excluding China. The top 20 countries faced with the largest production impact are likely to
experience a 15% decline in production. A few countries, which are not currently above the
fat consumption norm (and consequently do not have to make any adjustments in

28
consumption), also experience production declines on account of reduction in consumption
by developed countries. These countries are Brazil, Poland and Vietnam. The decline in
production in these countries is relatively small (<3%) in relation to their existing levels of
production but constitutes a much larger proportion of their exports. The impact of the norms
on international trade in pig meat is much larger and the trade impacts are summarised in
Table-3.
Table-3: Pig Meat – Trade Impact
Exports-Top 20 Countries and World Imports-Top 20 Countries and World
Country Export Qty
(000 MT)
Decline in
exports
(000 MT)
Percentage
decline in
exports
Country Import Qty
(000 MT)
Decline in
imports
(000 MT)
Percentage
decline in
imports
Denmark 1223.52 378.56 30.94% Germany 869.523 419.81 48.28%
Netherlands 879.65 250.86 28.52% Italy 870.518 374.34 43.00%
Belgium 682.47 187.25 27.44% United Kingdom 701.099 348.79 49.75%
Canada 595.74 169.74 28.49% Greece 226.623 56.33 24.85%
Spain 405.54 98.02 24.17% Sweden 57.595 38.15 66.24%
Brazil 153.28 49.57 32.34% Portugal 112.696 35.96 31.91%
U.S.A. 580.12 46.90 8.08% Switzerland 17.154 17.06 99.47%
Hungary 150.64 38.49 25.56% Czech Republic 20.125 13.05 64.86%
France 552.26 32.81 5.94% New Zealand 17.228 10.08 58.53%
Poland 117.86 25.07 21.28% Argentina 62.79 8.40 13.37%
Ireland 115.84 24.95 21.54% Slovakia 15.532 8.27 53.23%
Viet Nam 74.21 24.08 32.44% Bulgaria 7.385 7.10 96.19%
Chile 17.17 4.70 27.37% Latvia 6.869 4.27 62.14%
Belarus 20.90 4.05 19.38% Slovenia 15.737 2.94 18.70%
Ukraine 13.17 3.59 27.28% Serbia 5.844 1.86 31.90%
Austria 118.38 3.22 2.72% Croatia 23.033 1.04 4.51%
Thailand 7.53 2.41 31.98% Norway 2.423 0.37 15.23%
Swaziland 4.19 0.92 21.97% Dominican Rep 1.27 0.33 26.23%
Australia 40.98 0.83 2.03% Paraguay 0.278 0.28 100.00%
Zimbabwe 2.48 0.80 32.40% Lebanon 6.857 0.12 1.75%
World 6952.12 1348.59 19.40% World 7016.04 1348.59 19.22%

29
The implementation of the norms is likely to lead to a reduction of 19% in international trade
in pig meat. The reduction of imports by countries currently above the fat consumption norm
could lead to loss of export markets not only for developed countries in North America and
Europe but also for a number of developing countries. Countries like Brazil, Poland,
Vietnam, Chile, Belarus, Ukraine, Thailand, Swaziland and Zimbabwe stand to lose a quarter
to one-third of their exports of pig meat. This illustrates the potential knock-on effects of a
reduction in consumption in developing countries on the exports of developing countries.
Mutton and Goat Meat
The impact of WHO/FAO norms on the production of mutton and goat meat is summarised
in Table-4.
Table-4: Decrease in Mutton and Goat Meat Production - Top 20 Countries and World
Country Production
(000 MT)
Decline in production
(000 MT)
Percentage decline in
production
Australia 690.575 141.08 20.43%
New Zealand 534.285 86.91 16.27%
Spain 251.132 52.60 20.94%
United Kingdom 359 48.86 13.61%
Mongolia 120 14.00 11.67%
Ireland 82.9 11.21 13.52%
Serbia and Montenegro 23.734 4.67 19.66%
Bulgaria 58.9 4.19 7.11%
Netherlands 18.6 3.91 21.00%
Uruguay 51 3.29 6.46%
Norway 23.759 3.20 13.46%
India 696.2 2.37 0.34%
Hungary 7.54 1.10 14.53%
Sudan 261 1.04 0.40%
Argentina 59.002 0.88 1.49%
Chile 16.487 0.76 4.63%
Pakistan 506 0.66 0.13%
Macedonia 4.5 0.41 9.02%
Iceland 9.735 0.27 2.73%
Ethiopia 61.56 0.23 0.38%
World 11057.759 382.88 3.46%

30
World production of mutton and goat meat was estimated at 11.05 million tons in 2000.
Implementation of the norms is likely to lead to a 3.46% decline in world production. 35
countries are required to adjust consumption in order to adhere to the norms and these
countries account for 27% of world production. The top 20 countries faced with the largest
decline in production are likely to experience a production decline of nearly 10%. The
adverse impact on production is somewhat mitigated by the fact that some of the largest
producers of mutton and goat meat are countries like China, India, Iran, Pakistan and Turkey,
which are not required to adjust their consumption to adhere to the recommended norms.
Nevertheless, production impacts are felt by several developing countries as a result of
reduction in consumption in the “adjusting” countries. These developing countries are Chile,
India, Ethiopia, Macedonia, Pakistan, Sudan and Uruguay. The production impacts in these
countries are not large in relation to their current levels of production. But the trade impacts
for these countries are more significant. The trade impacts are summarised in Table-5.
Table-5: Trade Impact on Mutton and Goat Meat
Exports-Top 20 Countries and World Imports-Top 20 Countries and World Country Export Qty
(000 MT)
Decline in
exports
(000 MT)
Percentage
decline in
exports
Country Import Qty
(000 MT)
Decline in
imports
(000 MT)
Percentag
e decline
in imports
New Zealand 380.058 74.80 19.68% France 170.432 50.09 29.39%
Australia 310.692 61.91 19.93% U.S.A. 60.409 23.32 38.60%
Ireland 52.63 10.18 19.34% United Kingdom 108.88 20.06 18.42%
Uruguay 16.508 3.29 19.96% Greece 18.625 17.90 96.12%
India 11.903 2.37 19.95% Italy 24.976 15.73 62.96%
Sudan 5.22 1.04 19.96% Germany 40.545 15.16 37.38%
Bulgaria 5.3 1.04 19.58% Belgium-Lux 29.079 4.05 13.94%
Netherlands 12.285 0.95 7.70% Canada 16.278 3.85 23.65%
Spain 15.217 0.83 5.43% Portugal 10.421 3.43 32.90%
Chile 3.944 0.76 19.37% Switzerland 8.278 2.54 30.70%
Pakistan 3.303 0.66 19.89% Austria 1.937 1.89 97.68%
Macedonia 2.044 0.41 19.86% Sweden 3.562 1.09 30.64%
Iceland 1.333 0.27 19.96% Denmark 5.304 1.01 19.12%
Ethiopia 1.162 0.23 19.96% Norway 0.873 0.86 98.40%
Moldova 1.153 0.23 19.96% Israel 1.082 0.41 38.19%
Turkey 1.017 0.20 19.88% Finland 1.126 0.28 24.96%
Mongolia 0.77 0.15 19.96% Czech Republic 0.19 0.19 100.00%
Namibia 1.796 0.14 8.01% Argentina 1.659 0.14 8.20%
Hungary 0.526 0.08 14.65% Lebanon 0.636 0.05 8.20%
Slovakia 0.339 0.07 19.90% Paraguay 0.045 0.045 100.00%
World 957.787 159.76 16.68% 904.993 159.76 17.65%

31
Table-5 shows that international trade in mutton and goat meat is likely to decline by 17%
consequent to the implementation of the norms. France, US, UK, Greece, Italy and Germany
will have to make the largest cuts in their imports. Several developing countries – Uruguay,
India, Sudan, Chile, Pakistan, Macedonia, Ethiopia, Moldova, Turkey and Namibia stand to
lose as much as 20% of their export markets.
Poultry Meat
The production impacts on poultry meat are summarised in Table-6. World poultry meat
production in 2000 was estimated at 68.3 million tons and the implementation of the norms is
expected to lead to reduction of 1% in world production. The marginal impact on production
of poultry meat is largely attributable to the fact that the total projected decline in
consumption in the “adjusting” countries is estimated to be only 2.5%. Besides, several large
poultry meat producers like Brazil, China, India, Japan, Mexico and Thailand (which
collectively account for 35% of world production) are countries which are below the fat
consumption norm and consequently are not required to adjust their consumption.
Table-6: Decrease in Poultry Meat Production – Top 20 Countries and World
Country
Production
(000 MT)
Decline in
production
(000 MT)
Percentage
change in
production
United States of America 16415.60 312.78 1.91%
France 2219.70 139.51 6.29%
Australia 643.24 66.36 10.32%
Italy 1088.80 35.65 3.27%
Brazil 6124.75 28.68 0.47%
Netherlands 754.00 14.56 1.93%
Canada 1064.43 11.56 1.09%
Thailand 1220.19 10.45 0.86%
New Zealand 106.73 9.69 9.08%
Hungary 470.03 8.55 1.82%
Denmark 201.70 5.26 2.61%
Serbia and Montenegro 88.60 5.04 5.68%
Paraguay 58.26 2.80 4.80%
Belgium-Luxembourg 407.23 1.75 0.43%
Ireland 116.28 1.15 0.99%
Poland 626.40 0.86 0.14%
Chile 378.11 0.73 0.19%
Ecuador 148.21 0.12 0.08%
El Salvador 47.60 0.11 0.23%
Turkey 660.92 0.07 0.01%
World 68,347.61 646.27 0.95%

32
The trade impacts on poultry meat are summarised in Table-7. The impact on international
trade in poultry meat is also marginal with an expected decline of 2% in world trade. The
percentage decline in several of the top 20 importing countries (faced with the largest decline
in imports) is quite high, but the overall impact on international trade is limited because these
countries collectively account for only 18% of the world trade. The impact on the exports of
developing (“non-adjusting” countries) is also very limited (<2%).
Table-7: Poultry Meat – Trade Impact
Imports-Top 20 Countries and World
Exports-Top 20 Countries and World
Country Export Qty
(000 MT)
Decline in
exports
(000 MT)
Percentage
decline in
exports
Country Import Qty
(000 MT)
Decline in
imports
(000 MT)
Percentage
decline in
imports
United States of
America 2889.33 85.74 2.97% United Kingdom 405.46 52.17 12.87%
Brazil 961.13 28.68 2.98% Canada 127.26 43.08 33.85%
France 797.26 19.24 2.41% Spain 100.33 28.61 28.52%
Netherlands 750.92 16.71 2.23% Germany 449.53 21.75 4.84%
Thailand 350.37 10.45 2.98% Portugal 14.98 8.95 59.75%
Belgium-
Luxembourg 326.08 5.97 1.83% Italy 78.71 6.61 8.40%
Denmark 129.52 3.17 2.45% Greece 47.15 6.23 13.21%
Hungary 118.16 2.91 2.46%
Serbia and
Montenegro 5.99 5.26 87.83%
Poland 46.47 0.86 1.85%
Dominican
Republic 2.20 1.83 83.00%
Chile 24.81 0.73 2.95% Slovenia 5.53 1.61 29.13%
Australia 20.09 0.59 2.94% Czech Republic 17.69 1.52 8.57%
Israel 8.51 0.25 2.98% Finland 4.04 1.39 34.56%
Ireland 64.60 0.13 0.20% Slovakia 9.13 1.22 13.31%
Ecuador 4.87 0.12 2.38% Latvia 17.51 1.07 6.11%
El Salvador 4.55 0.11 2.37% Bulgaria 23.31 1.00 4.27%
Turkey 3.75 0.07 1.83% Austria 39.54 0.25 0.63%
Costa Rica 3.03 0.07 2.20% Paraguay 0.28 0.24 84.15%
Croatia 3.72 0.04 1.19% Lebanon 2.07 0.13 6.35%
Zimbabwe 1.12 0.03 2.86%
New Zealand 1.02 0.02 1.66%
World 8609.45 175.90 2.04% World 7499.69 175.90 2.35%
Dairy Products, Animal Fat and Eggs
Butter & Ghee
Table-8 shows the world production impacts for butter (and ghee). The world decline
amounts to 917,700 metric tons, or 12.5% of total world production. Some countries are
predicted to feel the burden of this decline very sharply – New Zealand’s butter production
shrinks by almost 60%, while Australia and Ireland stand to see their butter production

33
almost halved. There are two contributory factors to this. Firstly, adherence to the new WHO
norms would imply a significant reduction in current butter consumption, and therefore
production, in these countries. Secondly and more importantly, three major net importers of
butter, UK, France and Germany, would need to slash their imports drastically, contributing
to a decline in exports and therefore production for major exporters such as New Zealand and
Ireland.
Table-8: Decrease in Butter & Ghee Production - Top 20 Countries and World
Country
Reduction in Production
(MT)
Percentage reduction in
production
New-Zealand 201930 59
USA 176195 30
France 86763 19
Australia 80958 48
Ireland 64595 48
Germany 63494 15
Netherlands 32317 26
Belgium-Luxembourg 26467 21
Finland 24156 44
Sweden 18082 36
Ukraine 16808 12
Canada 13774 17
Spain 13596 35
Czech-Republic 11863 19
Denmark 11848 26
Switzerland 9804 26
Belarus 9313 14
Austria 9252 25
Argentina 8537 14
World 917701 12.5
Table-9 below lists the trade impacts for butter & ghee. World trade is cut by more than a
third of its current level, declining in volume by 441,752 metric tons. France and Germany
are major net importers and consumers of butter, and their butter consumption would
significantly decline if the WHO norms were implemented. This predicted consumption
reduction being in excess of their current imports, all their current imports would be slashed
according to the setup of our model, along with some reductions in domestic production as
well. Significant reduction in imports would also follow in the UK, Italy and North America.
The major exporters, New Zealand, Australia, Ireland, Finland and Netherlands would feel
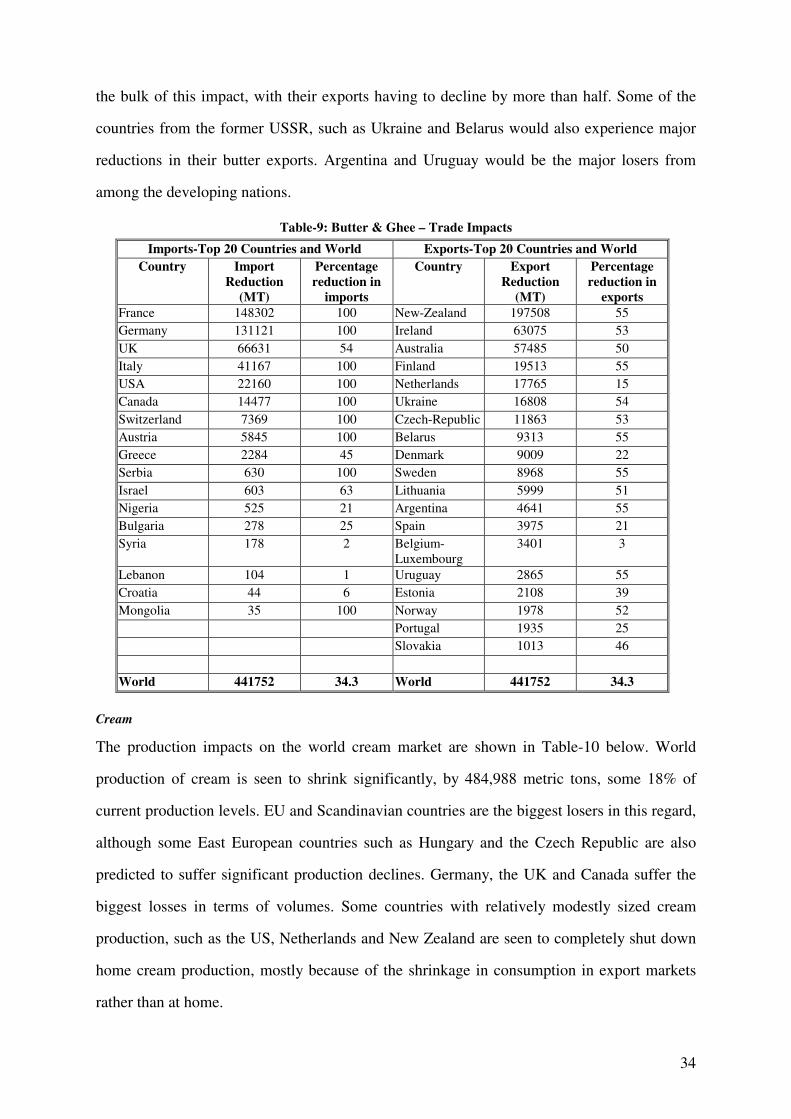
34
the bulk of this impact, with their exports having to decline by more than half. Some of the
countries from the former USSR, such as Ukraine and Belarus would also experience major
reductions in their butter exports. Argentina and Uruguay would be the major losers from
among the developing nations.
Table-9: Butter & Ghee – Trade Impacts
Imports-Top 20 Countries and World Exports-Top 20 Countries and World
Country Import
Reduction
(MT)
Percentage
reduction in
imports
Country Export
Reduction
(MT)
Percentage
reduction in
exports
France 148302 100 New-Zealand 197508 55
Germany 131121 100 Ireland 63075 53
UK 66631 54 Australia 57485 50
Italy 41167 100 Finland 19513 55
USA 22160 100 Netherlands 17765 15
Canada 14477 100 Ukraine 16808 54
Switzerland 7369 100 Czech-Republic 11863 53
Austria 5845 100 Belarus 9313 55
Greece 2284 45 Denmark 9009 22
Serbia 630 100 Sweden 8968 55
Israel 603 63 Lithuania 5999 51
Nigeria 525 21 Argentina 4641 55
Bulgaria 278 25 Spain 3975 21
Syria 178 2 Belgium-
Luxembourg
3401 3
Lebanon 104 1 Uruguay 2865 55
Croatia 44 6 Estonia 2108 39
Mongolia 35 100 Norway 1978 52
Portugal 1935 25
Slovakia 1013 46
World 441752 34.3 World 441752 34.3
Cream
The production impacts on the world cream market are shown in Table-10 below. World
production of cream is seen to shrink significantly, by 484,988 metric tons, some 18% of
current production levels. EU and Scandinavian countries are the biggest losers in this regard,
although some East European countries such as Hungary and the Czech Republic are also
predicted to suffer significant production declines. Germany, the UK and Canada suffer the
biggest losses in terms of volumes. Some countries with relatively modestly sized cream
production, such as the US, Netherlands and New Zealand are seen to completely shut down
home cream production, mostly because of the shrinkage in consumption in export markets
rather than at home.

35
Table-10: Decrease in Cream Production - Top 20 Countries and World
Country
Reduction in Production
(MT)
Percentage reduction in
production
Germany 198602 30
United-Kingdom 54113 72
Canada 47856 23
Spain 26661 34
Netherlands 25000 100
Sweden 23968 25
Austria 20311 35
Denmark 19628 34
Hungary 18112 21
Australia 8393 73
Finland 7409 19
Norway 6644 22
Czech-Republic 4853 27
New-Zealand 4502 100
USA 3510 100
Lithuania 3038 17
Israel 2544 10
Switzerland 2124 5
Portugal 2065 17
World 484988 18
Trade impacts are presented in Table-11. Almost a third of the world cream trade is forecast
to be wiped out by international adherence to the diet norms. More than half of this effect on
trade derives from the consumption reductions in only three countries: France, Italy and
Belgium/Luxembourg. These three countries are large importers and consumers of cream.
Adjusting to the WHO norms results in large reductions in cream consumption in these
counties, which translates to a significant curtailment of their imports. The main countries
affected are the largest net exporters of cream, the UK, Germany, Netherlands and Austria.
Note however, that some lower income cream exporting countries such as Tunisia and Chile
also face a significant shrinkage in their cream exports.
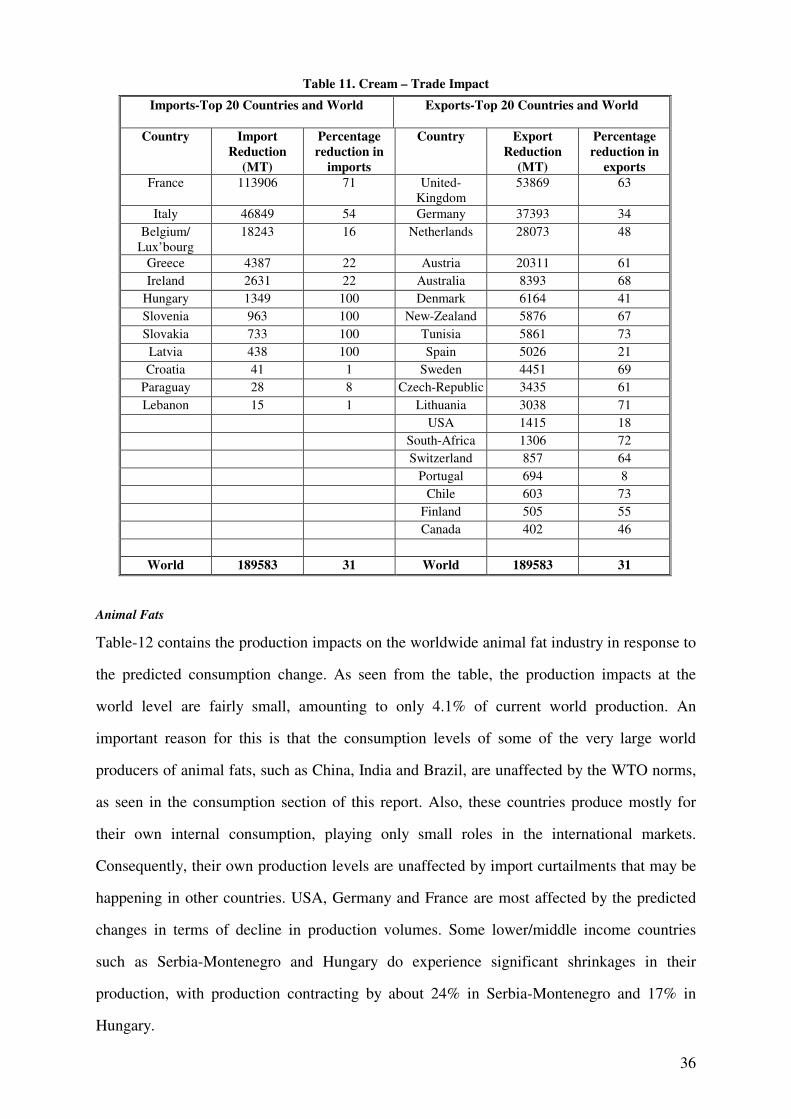
36
Table 11. Cream – Trade Impact
Imports-Top 20 Countries and World
Exports-Top 20 Countries and World
Country Import
Reduction
(MT)
Percentage
reduction in
imports
Country Export
Reduction
(MT)
Percentage
reduction in
exports
France 113906 71 United-
Kingdom
53869 63
Italy 46849 54 Germany 37393 34
Belgium/
Lux’bourg
18243 16 Netherlands 28073 48
Greece 4387 22 Austria 20311 61
Ireland 2631 22 Australia 8393 68
Hungary 1349 100 Denmark 6164 41
Slovenia 963 100 New-Zealand 5876 67
Slovakia 733 100 Tunisia 5861 73
Latvia 438 100 Spain 5026 21
Croatia 41 1 Sweden 4451 69
Paraguay 28 8 Czech-Republic 3435 61
Lebanon 15 1 Lithuania 3038 71
USA 1415 18
South-Africa 1306 72
Switzerland 857 64
Portugal 694 8
Chile 603 73
Finland 505 55
Canada 402 46
World 189583 31 World 189583 31
Animal Fats
Table-12 contains the production impacts on the worldwide animal fat industry in response to
the predicted consumption change. As seen from the table, the production impacts at the
world level are fairly small, amounting to only 4.1% of current world production. An
important reason for this is that the consumption levels of some of the very large world
producers of animal fats, such as China, India and Brazil, are unaffected by the WTO norms,
as seen in the consumption section of this report. Also, these countries produce mostly for
their own internal consumption, playing only small roles in the international markets.
Consequently, their own production levels are unaffected by import curtailments that may be
happening in other countries. USA, Germany and France are most affected by the predicted
changes in terms of decline in production volumes. Some lower/middle income countries
such as Serbia-Montenegro and Hungary do experience significant shrinkages in their
production, with production contracting by about 24% in Serbia-Montenegro and 17% in
Hungary.

37
Table-12: Decrease in Animal Fats Production - Top 20 Countries and World
Country
Reduction in Production
(MT)
Percentage reduction in
production
USA 483088 7
Germany 223423 10
France 113712 9
Canada 79349 8
Australia 62588 8
Hungary 50230 17
Serbia-and-Montenegro 45104 24
Netherlands 41218 7
New-Zealand 37645 7
Austria 30988 11
Denmark 24408 6
Peru 16125 3
Argentina 14619 5
Ireland 13871 5
Sweden 12993 6
Iceland 5582 6
Czech-Republic 5548 3
Slovakia 4068 5
Finland 4020 4
World 1283973.4 4.1
Table-13 lists the world trade impacts. A similar result is seen for world trade in animal fats,
with imports & exports declining by a modest 3.5% each. Again, an important reason for the
small size of the effects in trade relates to the fact that major consumers of animal fat such as
India, China and Brazil are mostly self-sufficient in this product. Although some importing
countries, mostly in the EU, experience significant reductions in the imports (31% in Italy
and 40% in Portugal), the major exporters such as the US, Australia and New Zealand
experience only a 6% reduction in the volume of their exports. Two developing countries,
Peru and Bolivia, are among the 20 countries experiencing the largest reductions in animal fat
exports.

38
Table-13: Animal Fats – Trade Impact Top 20 Countries and World
Imports-Top 20 Countries and World
Exports-Top 20 Countries and World
Country Import
Reduction
(MT)
Percentage
reduction in
imports
Country Export
Reduction
(MT)
Percentage
reduction in
exports
Italy 74961 31 USA 92260 6
United-
Kingdom
64097 20 Australia 37394 6
Belgium-
Lux’bourg
46400 10 New-Zealand 31895 6
Spain 33484 15 Peru 16125 6
Portugal 13626 40 Canada 12629 4
Switzerland 11510 51 Germany 12620 2
Norway 7167 3 Ireland 11876 6
Paraguay 3033 72 Argentina 8216 5
Bulgaria 2807 41 Denmark 6537 3
Latvia 2616 40 Iceland 5582 6
Dominican-
Republic
1323 2 Uruguay 3981 6
Greece 1152 4 Sweden 3956 6
Mongolia 604 100 Austria 3590 4
Croatia 498 4 Ukraine 2514 6
Israel 408 8 Finland 2414 5
Syria 253 3 Netherlands 1942 0
Lebanon 44 0 Bolivia 1760 5
Poland 1561 3
Slovenia 1421 4
World 263984 3.5 World 263984 3.5
Eggs
Tables 14 and 15 present the impact of the WHO/FAO norms on the production and trade of
(hen) eggs. The total production impacts are modest at around 700,000 tons that represent
only 1.4% of world production in year 2000 but some countries, such as the Netherlands,
Spain and Belgium, experience relative decreases in production in excess of 10%. Table-15
shows that implementation of the norms reduces trade in eggs by almost a third, but this is
largely due to the fact that international trade in eggs is limited in the first place16
.
___________________________________________________________________________ 16
The FAO reports a volume of trade of less than a million tons in year 2000 for a volume of world production
of more than 50 million tons.

39
Table-14: Decrease in Egg Production - Top 20 Countries and World
Country Volume MT) Share of initial production (%)
USA 192,586 3.9
Netherlands 140,549 21.0
Spain 80,759 13.5
France 42,217 4.1
Belgium 30,092 15.5
Malaysia 26,276 6.7
Belarus 24,013 13.2
UK 23,085 3.9
Iran 18,225 3.1
Italy 15,783 2.3
Australia 12,046 8.4
Hungary 10,217 5.8
Greece 9,832 8.4
Serbia 7,227 10.0
Finland 6,449 11.0
Czech Rep. 6,257 3.3
India 4,867 0.3
Russia 4,226 0.2
El Salvador 3,971 7.5
New Zealand 3,762 8.7
World 693,120 1.4
Table-15: Eggs – Trade Impact
Decrease in Imports - Top 20 countries and world Decrease in Exports - Top 20 countries and world
Country Volume (MT)
Share of initial
imports Country Volume (MT)
Share of initial
exports
Germany 85,606 39.0% Netherlands 113,584 38.4%
Italy 62,821 100.0% USA 28,871 44.7%
France 61,046 100.0% Malaysia 26,276 47.2%
UK 32,773 100.0% Belarus 24,013 47.2%
Canada 22,508 96.7% Belgium 22,326 29.3%
Austria 8,951 90.9% Spain 21,454 44.9%
Sweden 7,534 81.2% Iran 18,225 47.0%
Denmark 7,516 37.7% India 4,867 47.3%
Switzerland 4,490 19.0% Russia 4,226 42.9%
Bulgaria 3,432 67.3% El Salvador 3,971 41.5%
Ireland 1,205 69.4% Finland 2,794 46.5%
Serbia 1,097 100.0% Ecuador 2,497 42.6%
Slovenia 642 86.3% Thailand 2,352 47.2%
Paraguay 216 100.0% Brazil 2,007 45.3%
Croatia 130 6.6% Moldova 1,690 46.7%
Hungary 1,581 36.9%
Saudi Arabia 1,469 19.2%
South Africa 1,347 47.1%
Zimbabwe 1,288 47.3%
Viet Nam 1,131 45.2%
World 295,096 32.9% World 295,096 30.8%

40
Vegetable Oils
Soybean Oil
Table-16: Decrease in Soybean Oil Production - Top 20 Countries and World
Country
Volume (MT)
Share of initial production
(%)
USA 2,204,617 27.3
Germany 110,189 15.8
Italy 65,695 26.8
Spain 63,486 14.4
France 50,980 75.4
Canada 44,067 15.0
UK 43,607 30.4
Netherlands 36,936 4.7
Argentina 29,158 0.9
Belgium 16,479 11.0
Norway 12,773 19.1
Brazil 8,701 0.2
Serbia 8,551 32.2
Paraguay 6,014 4.3
Finland 5,942 24.0
Portugal 5,293 5.2
Switzerland 3,746 18.2
Greece 1,855 4.2
Bolivia 1,387 0.8
Malaysia 858 0.9
World 2,720,774 11.4
The potential impact of the WHO/FAO norms on production of soybean oil is presented in
Table-16. Our analysis suggests that world production would decrease by more than 2.7
million tons, which represents 11.4% of world production in year 2000. Given that oil
production represents the main use of soybean, this decrease would have a substantial
negative effect on soybean growers around the world. Using the conversion ratio of soybeans
into oil reported by the Chicago board of trade17
, one obtains an estimate of the decline in
actual soybean production in the range of 15 million tons.
Table-16 further presents the decrease in production of soybean oil production for individual
countries. The United States is by far the country that would be the most adversely affected
___________________________________________________________________________ 17
The Chicago Board of Trade reports that crushing 60 pounds of soybeans produces on average 11 pounds of
soybean oil, see website at http://www.cbot.com/cbot/www/cont_detail/0,1493,12+29+170+6173,00.html

41
with a decrease in soybean oil production in excess of 2.2 million tons, which represents
more than a quarter of its 2000 production level. This result can be explained first by the fact
that, according to our model, US domestic consumption of soybean oil would contract by
34% as a result of WHO/FAO fat target. Furthermore, the US is a large exporter of soybean
oil and would therefore be affected by reductions in consumption of this product in importing
countries, most notably within the EU. Table-17, which presents the trade impact of the
norms, demonstrates that the first of these two effects is the largest since the decrease in US
exports of soybean oil is marginal at less than 1% of its 2000 level.
Table-17: Soybean Oil: Trade Impact
Decrease in Imports - Top 20 countries and world Decrease in Exports - Top 20 countries and world
Country Volume
(MT)
Share of initial
imports Country
Volume
(MT)
Share of initial
imports
Dominican
Republic 11,647 11.3% Argentina 26,370 0.9%
Israel 7,992 100.0% Brazil 8,563 0.8%
Denmark 6,464 22.1% USA 4,822 0.8%
Australia 5,021 61.5% Germany 3,561 0.8%
Sweden 4,183 17.8% Netherlands 2,960 0.6%
Hungary 3,406 54.9% Spain 1,433 0.8%
Czech Rep. 3,272 12.5% Bolivia 1,365 0.9%
New Zealand 2,987 18.2% Paraguay 845 0.9%
Austria 1,312 7.6% Malaysia 844 0.5%
Mongolia 1,252 N.A. Belgium 345 0.1%
Bulgaria 863 41.1% Portugal 330 0.7%
Syria 837 3.4% Thailand 242 0.9%
Slovakia 792 7.5% Norway 221 0.7%
Latvia 787 24.7% Italy 177 0.6%
Ireland 707 4.7% Serbia 174 0.8%
Slovenia 588 5.7% Finland 131 0.9%
Lebanon 531 1.4% Greece 126 0.8%
Croatia 386 7.9% Romania 115 0.9%
UK 112 0.4%
Switzerland 100 0.7%
World 53,029 0.78% 53,029 0.74%
Our results further demonstrate that production in other countries would also be significantly
affected by the WHO/FAO norms (Table-16). The largest impacts are observed in EU
countries and Canada, while the other large world producers of soybean oil such as Argentina
and Brazil remain relatively unaffected. This is explained by the fact that the trade impacts of
the norms are very small (Table-17) with a reduction in world exports amounting to less than

42
1% of their levels in year 2000. Consequently, most of the decrease in production takes place
where consumption declines as a result of the introduction of the WHO/FAO norms. Notice,
however, that our results only provide a partial view of the impact of the norms on
agricultural producers because soybean oil is a processed product that can be manufactured
from imported soybeans. That is in fact the case in most European countries. For instance,
Germany produced 700,000 MT of soybean oil in year 2000 when its production of soybeans
was a bare 1000 MT.
Rapeseed Oil
The impact of the norms on production of rapeseed oil is presented in Table-18. At a world
level, the total effect is a relatively modest decline of less than one million tons representing
roughly 7% of world production in year 2000. However, the impact on individual countries
can be rather large and this apparent paradox is explained by the fact that production of
rapeseed oil in India and China, two of the world’s largest producers, would not be affected
by the WHO norms. The impact on virtually all the other large producers is large. Germany
tops the list of countries with a decline of almost half a million tons that represents a quarter
of its national production. Large reductions in production of rapeseed oil are also observed in
Canada, France, Belgium and Australia. Altogether, it is the developed countries that are
affected, and particularly so within the EU, while the production impacts of the WHO norms
on developing countries and the transitional economies of Eastern Europe are limited.

43
Table-18: Decrease in Rapeseed Oil Production - Top 20 Countries and World
The trade impacts are much more pronounced than in the case of soybean oil, with decreases
in exports accounting for more than one third of the decline in world production. This is
explained by the fact that many of the countries that reduce their consumption of rapeseed oil
are also net importers of this product, which, by assumption, adjust to the change by cutting
imports. Table-19 shows that the largest reductions in imports of rapeseed oil take place in
the high-income economies of Western Europe (UK, Sweden, Italy, Netherlands, Spain) and
the US, while changes in developing and transitional economies have little impact on the
pattern of world trade in rapeseed oil. The largest decreases in exports take place in the
countries where production impacts are also largest, with Germany and Canada, for instance,
loosing more than 20% of their export markets due to the WHO/FAO norms.
Country Volume (MT) Share of initial production (%)
Germany 452,022 24.6
Canada 211,838 16.3
France 92,196 16.8
Belgium 61,005 19.4
Australia 60,359 35.7
Austria 19,585 27.8
Czech Republic 19,150 9.0
Finland 9,057 13.6
Denmark 4,705 4.0
Switzerland 4,109 25.6
Hungary 2,476 2.8
Malaysia 2,080 16.8
Serbia 1,543 39.8
Ukraine 1,057 4.8
Israel 915 7.6
Paraguay 661 N.A.
Romania 411 15.9
Togo 46 N.A.
Greece 25 N.A.
Uganda 25 N.A.
World 943,286 6.98
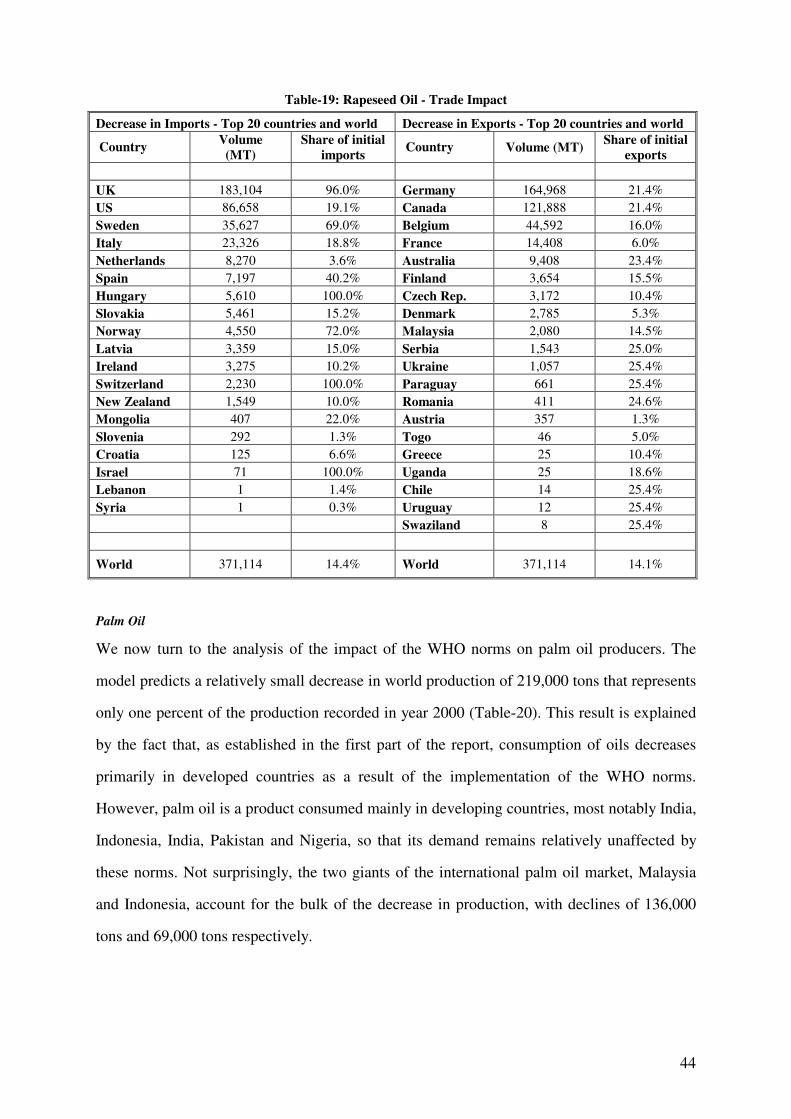
44
Table-19: Rapeseed Oil - Trade Impact
Decrease in Imports - Top 20 countries and world Decrease in Exports - Top 20 countries and world
Country Volume
(MT)
Share of initial
imports Country Volume (MT)
Share of initial
exports
UK 183,104 96.0% Germany 164,968 21.4%
US 86,658 19.1% Canada 121,888 21.4%
Sweden 35,627 69.0% Belgium 44,592 16.0%
Italy 23,326 18.8% France 14,408 6.0%
Netherlands 8,270 3.6% Australia 9,408 23.4%
Spain 7,197 40.2% Finland 3,654 15.5%
Hungary 5,610 100.0% Czech Rep. 3,172 10.4%
Slovakia 5,461 15.2% Denmark 2,785 5.3%
Norway 4,550 72.0% Malaysia 2,080 14.5%
Latvia 3,359 15.0% Serbia 1,543 25.0%
Ireland 3,275 10.2% Ukraine 1,057 25.4%
Switzerland 2,230 100.0% Paraguay 661 25.4%
New Zealand 1,549 10.0% Romania 411 24.6%
Mongolia 407 22.0% Austria 357 1.3%
Slovenia 292 1.3% Togo 46 5.0%
Croatia 125 6.6% Greece 25 10.4%
Israel 71 100.0% Uganda 25 18.6%
Lebanon 1 1.4% Chile 14 25.4%
Syria 1 0.3% Uruguay 12 25.4%
Swaziland 8 25.4%
World 371,114 14.4% World 371,114 14.1%
Palm Oil
We now turn to the analysis of the impact of the WHO norms on palm oil producers. The
model predicts a relatively small decrease in world production of 219,000 tons that represents
only one percent of the production recorded in year 2000 (Table-20). This result is explained
by the fact that, as established in the first part of the report, consumption of oils decreases
primarily in developed countries as a result of the implementation of the WHO norms.
However, palm oil is a product consumed mainly in developing countries, most notably India,
Indonesia, India, Pakistan and Nigeria, so that its demand remains relatively unaffected by
these norms. Not surprisingly, the two giants of the international palm oil market, Malaysia
and Indonesia, account for the bulk of the decrease in production, with declines of 136,000
tons and 69,000 tons respectively.

45
Table-20: Decrease in Palm Oil Production - Top 20 Countries and World
Country Volume
(MT) Share of initial production (%)
Malaysia 136,269 1.3
Indonesia 69,245 1.0
Papua New
Guinea 5,567 1.7
Costa Rica 1,614 1.2
Colombia 1,562 0.3
Côte d'Ivoire 999 0.4
Thailand 608 0.1
Honduras 553 0.6
Solomon Islands 540 1.5
Guatemala 511 1.2
Paraguay 320 11.7
Senegal 228 4.1
Ecuador 183 0.1
Brazil 179 0.2
Ghana 136 0.1
Peru 126 0.5
Liberia 93 0.2
Cameroon 93 0.1
Gabon 81 1.3
World 219,051 1.0
Because most of the decrease in consumption takes place in temperate high-income countries
while production takes place in tropical countries of the developing world, 99.8% of the
decrease in production is associated with a decrease in trade. The countries reducing their
imports the most are Germany, the UK as well as Australia and other EU members. Eastern
European countries such as the Czech Republic and Hungary also reduce their imports of
palm oil but the calculated volumes are very small. Malaysia and Indonesia reduce their
exports of palm oil by the largest volumes but the calculated declines represent only a small
percentage of their exports in year 2000 (Table-21).

46
Table-21: Palm Oil – Trade Impact
Decrease in Imports - Top 20 countries and world Decrease in Exports - Top 20 countries and world
Country Volume
(MT)
Share of initial
imports Country Volume (MT)
Share of initial
exports
Germany 66,594 12.0% Malaysia 136,269 1.7%
UK 36,511 6.6% Indonesia 69,245 1.7%
Australia 34,221 31.0% Papua New
Guinea 5,567 1.7%
Netherlands 16,177 2.3% Costa Rica 1,614 1.7%
France 14,274 11.5% Colombia 1,562 1.6%
Belgium 12,758 4.7% Côte d'Ivoire 999 1.4%
Italy 11,896 4.6% Thailand 608 1.6%
Spain 6,344 4.4% Honduras 553 1.7%
Dominican
Rep. 4,583 43.6% Solomon
Islands 540 1.7%
Switzerland 4,088 36.9% Guatemala 511 1.3%
Portugal 3,842 14.6% Senegal 228 0.8%
Czech
Republic 3,149 12.3% Ecuador 183 1.4%
Hungary 1,314 9.3% Brazil 179 0.6%
Austria 1,308 9.0% Sweden 144 0.6%
Israel 705 4.8% Ghana 136 1.0%
Serbia 572 27.5% Peru 126 1.5%
New Zealand 396 2.7% Liberia 93 1.7%
Cameroon 93 0.8%
Gabon 81 1.3%
Paraguay 2 1.7%
World 218,732 1.6% World 218,732 1.5%
Conclusions
This study presents a quick assessment of the likely impact of WHO dietary
recommendations on world food consumption, production and trade. FAO nutritional balance
sheets are used to describe average food consumption for a group of 173 countries in year
2000. The analysis demonstrates that forty-nine of these countries violate the norm with
regard to the maximum percentage of energy intake originating from fat. Most of these
countries are either developed countries of the Western hemisphere and Oceania, or Eastern
European countries. The norm on protein intake is rarely violated.
A programming approach is used to predict how diets in countries violating the WHO/FAO
norms would have to adjust in order to meet these norms. The model formalises the idea that
consumers would attempt to adhere to the norms by modifying their diets as little as possible.

47
The results demonstrate that in the countries currently violating the norms, the adjustments in
food consumption necessary to adhere to the norms are substantial. The general direction of
the change is a shift away from human consumption of meats, vegetable oils, eggs and dairy
products towards consumption of more cereal-based products, pulses, fruits and vegetables.
The production and trade impacts differ widely across products and countries but in some
cases are found to be large. It is clear that in many countries, the WHO/FAO norms have
serious implications for farm income and farmers’ livelihoods. The most significant effects
relate to the production of oil crops (soybean, rapeseed), meats (pig meat, mutton) and dairy
products. The effect of the norms on international trade is also found to be substantial and, in
general, exceeds the production impact in relative terms.
Besides the effects of the WHO/FAO population nutrient goals evaluated in this report,
consumer preferences for specific food products are also likely to be influenced by the
references in the WHO/FAO report to the harmful effects of the intake of these products.
These additional effects, however, are difficult to quantify. Yet, it is clear that these specific
references to individual food items will be of great importance when countries set food-based
(as opposed to nutrient-based) dietary guidelines. The potential impact of the WHO/FAO
report on consumer preferences for individual food products could be large.

48
References
Bouwman, A. F. (1997). Long-Term Scenarios of Livestock-Crop-Land Use Interactions in
Developing Countries. FAO Land and Water Bulletin 6, Food and Agriculture Organization of the
United Nations (FAO), Rome.
FAO (1994). Fats and Oils in Human Nutrition. Report of a Joint Expert Consultation. FAO Food
and Nutrition Technical Paper no. 57, Rome: FAO.
FAO (2001). FAO Statistical Databases. FAOSTAT CD-ROM 2001, FAO, Rome
Gillespie, S. and L.J. Haddad (2003). The Double Burden of Malnutrition in Asia: Causes,
Consequences and Solutions. Sage Publications, New Delhi.
Guo, X, et. al. (2000). “Structural Change in the Impact of Food Consumption in China 1989-93.”
Economic Development and Cultural Change, 48: pp. 737-760.
Irz, X (2003) Impact of WHO Dietary Recommendations on World Sugar Consumption, Production
and Trade. Report prepared for the World Sugar Research Organisation.
WHO (2003). Diet, Nutrition and the Prevention of Chronic Diseases: Report of a Joint WHO/FAO
Expert Consultation, Geneva, 28 January - 1 February 2002, WHO technical report series: 916, World
Health Organization, Geneva.

49
Appendix-1: Share of Fat in Energy Intake, All Countries, 2000
Country Calories
(kcal)/person/
day
Fat
grams/person
/day
Fat as % of kcal
1 France 3,596.70 167.4 41.9%
2 Spain 3,386.90 151.6 40.3%
3 Switzerland 3,435.40 150.5 39.4%
4 Germany 3,505.50 152.9 39.3%
5 Netherlands 3,336.40 144.7 39.0%
6 Australia 3,110.30 134.8 39.0%
7 Belgium-Luxembourg 3,695.40 159.8 38.9%
8 Austria 3,794.00 163.7 38.8%
9 Serbia and Montenegro 2,660.30 113.5 38.4%
10 Italy 3,663.00 154.7 38.0%
11 United Kingdom 3,311.90 139.8 38.0%
12 Hungary 3,551.80 147.2 37.3%
13 Bermuda 2,950.00 120.2 36.7%
14 Iceland 3,213.90 130.9 36.7%
15 Denmark 3,443.40 139.8 36.5%
16 United States of America 3,814.30 154.3 36.4%
17 Cyprus 3,282.70 132.7 36.4%
18 Greece 3,738.00 151 36.4%
19 French Polynesia 2,881.10 115.9 36.2%
20 Sweden 3,099.80 123.7 35.9%
21 Canada 3,178.00 126.8 35.9%
22 Norway 3,338.00 133 35.9%
23 Mongolia 2,083.50 81.6 35.2%
24 New Caledonia 2,774.70 107.3 34.8%
25 Finland 3,169.40 120.7 34.3%
26 Latvia 2,719.70 102.7 34.0%
27 Bulgaria 2,544.00 95.2 33.7%
28 Antigua and Barbuda 2,378.20 88.1 33.3%
29 Ireland 3,701.00 137 33.3%
30 Israel 3,509.70 129.8 33.3%
31 Fiji Islands 2,777.80 102.1 33.1%
32 Portugal 3,757.20 138 33.1%
33 Czech Republic 3,028.30 111.1 33.0%
34 New Zealand 3,210.50 117.1 32.8%
35 Grenada 2,757.50 100 32.6%
36 Paraguay 2,543.60 91.8 32.5%
37 Netherlands Antilles 2,595.30 93.6 32.5%
38 Dominican Republic 2,318.70 83.6 32.4%
39 Kiribati 2,910.10 104.2 32.2%
40 Slovakia 2,788.70 99.8 32.2%
41 Seychelles 2,436.80 87 32.1%
42 Bahamas 2,735.60 97.3 32.0%
43 Lebanon 3,151.20 111.5 31.8%
44 Vanuatu 2,582.70 91.1 31.7%
45 Slovenia 3,149.20 110.4 31.6%
46 Syrian Arab Republic 3,052.30 104.6 30.8%
47 Argentina 3,180.40 108.5 30.7%
48 Croatia 2,596.60 88.5 30.7%
49 Macedonia, The Fmr Yug Rp 2,695.20 90.3 30.2%

50
50 Belarus 2,895.20 96.2 29.9%
51 Uruguay 2,837.80 94 29.8%
52 Poland 3,401.00 112.6 29.8%
53 Barbados 2,946.20 97.5 29.8%
54 Ecuador 2,726.40 89.2 29.4%
55 Chad 2,082.50 67.7 29.3%
56 Libyan Arab Jamahiriya 3,324.30 107.9 29.2%
57 Sudan 2,272.00 73.6 29.2%
58 United Arab Emirates 3,333.30 107.9 29.1%
59 Kuwait 3,151.20 102 29.1%
60 Saint Kitts and Nevis 3,095.20 99.1 28.8%
61 Malta 3,542.70 113.2 28.8%
62 Sao Tome and Principe 2,484.00 78.4 28.4%
63 Central African Republic 1,968.10 61.1 27.9%
64 Panama 2,215.20 67.8 27.5%
65 Japan 2,752.60 83 27.1%
66 Tunisia 3,309.90 99.8 27.1%
67 Gambia 2,273.30 67.8 26.8%
68 Jamaica 2,685.70 80 26.8%
69 Albania 2,874.80 85.6 26.8%
70 Kazakhstan 2,385.60 70.9 26.7%
71 Chile 2,867.30 85.2 26.7%
72 Cape Verde 3,285.80 97.6 26.7%
73 Brazil 3,002.30 88.8 26.6%
74 Jordan 2,732.20 80.7 26.6%
75 Estonia 2,946.40 86.5 26.4%
76 Senegal 2,270.30 66.5 26.4%
77 Djibouti 2,181.50 63.3 26.1%
78 Lithuania 3,292.80 94.9 25.9%
79 Mauritius 2,988.70 85.6 25.8%
80 Malaysia 2,917.20 83.5 25.8%
81 Trinidad and Tobago 2,712.60 77.4 25.7%
82 Dominica 2,990.60 85.2 25.6%
83 Saint Vincent/Grenadines 2,641.80 74.9 25.5%
84 China 2,978.90 83 25.1%
85 Brunei Darussalam 2,758.00 76.7 25.0%
86 Honduras 2,394.30 66.2 24.9%
87 Saudi Arabia 2,836.70 78.3 24.8%
88 Pakistan 2,456.40 67.8 24.8%
89 Romania 3,329.20 91 24.6%
90 Mexico 3,153.90 86.1 24.6%
91 Turkey 3,373.50 91.9 24.5%
92 Liberia 2,175.50 59.2 24.5%
93 Saint Lucia 2,957.70 80.1 24.4%
94 Costa Rica 2,749.20 73.7 24.1%
95 Russian Federation 2,917.90 77.5 23.9%
96 Zimbabwe 2,104.20 54.9 23.5%
97 Venezuela 2,359.70 61.1 23.3%
98 Suriname 2,624.50 67.2 23.0%
99 Gabon 2,585.40 66.1 23.0%
100 Turkmenistan 2,715.10 69.4 23.0%
101 Ukraine 2,898.40 73.8 22.9%
102 Uzbekistan 2,285.70 57.5 22.6%
103 Colombia 2,576.00 64.8 22.6%

51
104 South Africa 2,907.60 73 22.6%
105 Bosnia and Herzegovina 2,723.40 67.8 22.4%
106 Korea, Republic of 3,092.60 76.7 22.3%
107 Botswana 2,255.60 55.1 22.0%
108 Guinea 2,320.40 56.1 21.8%
109 Kenya 2,037.20 48.9 21.6%
110 Maldives 2,551.90 60.9 21.5%
111 Belize 2,867.30 68.4 21.5%
112 Guinea-Bissau 2,486.30 59.1 21.4%
113 Sierra Leone 1,904.20 45.2 21.4%
114 Mauritania 2,762.30 64.8 21.1%
115 Congo, Republic of 2,235.50 52.4 21.1%
116 Nigeria 2,742.50 63.7 20.9%
117 Algeria 2,928.20 67 20.6%
118 Burkina Faso 2,438.90 55.3 20.4%
119 El Salvador 2,470.00 55.5 20.2%
120 Comoros 1,763.50 39.6 20.2%
121 Cameroon 2,254.00 50.6 20.2%
122 Bolivia 2,227.50 49.5 20.0%
123 Armenia 2,006.00 43.8 19.7%
124 Guatemala 2,147.80 46.8 19.6%
125 India 2,489.40 54.2 19.6%
126 Haiti 2,045.90 43.8 19.3%
127 Côte d'Ivoire 2,588.10 54.7 19.0%
128 Nicaragua 2,222.60 46.6 18.9%
129 Papua New Guinea 2,177.40 45.6 18.8%
130 Namibia 2,742.70 57.3 18.8%
131 Georgia 2,235.90 46.2 18.6%
132 Swaziland 2,541.00 52.5 18.6%
133 Philippines 2,374.80 48.9 18.5%
134 Mali 2,357.60 47.8 18.2%
135 Iran, Islamic Rep of 2,935.40 59.3 18.2%
136 Indonesia 2,912.90 58.8 18.2%
137 Angola 1,901.80 38.1 18.0%
138 Thailand 2,458.70 49.2 18.0%
139 Togo 2,281.10 45 17.8%
140 Morocco 2,965.60 58.5 17.8%
141 Tajikistan 1,716.40 33.8 17.7%
142 Cuba 2,614.40 51.4 17.7%
143 Sri Lanka 2,345.00 46 17.7%
144 Peru 2,599.20 50.2 17.4%
145 Solomon Islands 2,221.30 42.8 17.3%
146 Guyana 2,639.30 50.2 17.1%
147 Benin 2,537.00 47.3 16.8%
148 Kyrgyzstan 2,876.60 53.6 16.8%
149 Yemen 2,040.80 38 16.8%
150 Moldova, Republic of 2,628.20 48.9 16.7%
151 Egypt 3,375.70 62.5 16.7%
152 Zambia 1,900.80 33.1 15.7%
153 Myanmar 2,806.30 46.1 14.8%
154 Niger 2,120.60 34.7 14.7%
155 Korea, Dem People's Rep 2,165.40 34.7 14.4%
156 Viet Nam 2,498.30 39.2 14.1%
157 Nepal 2,446.30 37.8 13.9%
52
158 Eritrea 1,668.90 25.7 13.9%
159 Tanzania, United Rep of 1,958.40 30 13.8%
160 Azerbaijan, Republic of 2,386.80 36.4 13.7%
161 Congo, Dem Republic of 1,556.90 23.6 13.6%
162 Madagascar 2,138.40 32.3 13.6%
163 Ghana 2,613.00 37.7 13.0%
164 Cambodia 2,011.00 28.2 12.6%
165 Lesotho 2,304.40 32.2 12.6%
166 Mozambique 1,939.30 26.9 12.5%
167 Uganda 2,381.90 31.3 11.8%
168 Malawi 2,166.00 27.5 11.4%
169 Laos 2,302.90 29 11.3%
170 Bangladesh 2,158.30 26.3 11.0%
171 Ethiopia 1,886.90 19.5 9.3%
172 Rwanda 2,057.70 19.3 8.4%
173 Burundi 1,603.60 10.8 6.1%
World 2,804.40 76.3 24.5%