who votes in toronto municipal elections? - maytree · 2 myer siemiatycki and sean marshall •...
TRANSCRIPT

Who Votes in Toronto Municipal
Elections?
Myer Siemiatycki and Sean Marshall
October 2014
maytree.com/policy

Who Votes in Toronto Municipal Elections?
© 2014 Maytree Authors: Myer Siemiatycki and Sean Marshall
Report Authors
Myer Siemiatycki is Professor of Politics and Public Administration at Ryerson University.
Sean Marshall is a Toronto-based geographer with interests in municipal politics and public health.
Acknowledgements
The authors are grateful to Maytree for encouraging and supporting this research. We also thank the City of Toronto for providing us with election data, without which this research could not have been conducted. All analysis and any errors in this research are the authors’ sole responsibility.
ISBN: 978-1-928003-03-8

ConTEnTs
Executive Summary 1
1. Introduction 3
2. Methodology 5
3. One City – Different Spaces 8
4. Toronto Voting Patterns by Ward and Neighbourhood 14
4.a. Mapping ‘Toronto’s Distinct Geography of Voting’ 14
4.b. Regression Analysis of Voting Patterns 16
4.c. The View from the Ground 18
5. Lessons from the Exceptions 20
6. Explaining Toronto’s Voting Patterns 23
7. Recommendations for Raising Municipal Voter Turnout in Toronto 24
8. Citations 26
9. Appendices 27


1Who Votes In toronto MunIcIpal electIons?
ExECuTiVE suMMARy
Who votes in Toronto municipal elections? This landmark study identifies signifi-cant variations in voter turnout among eligible voters across the city’s 44 wards and 140 official neighbourhoods over the past three civic elections of 2003, 2006 and 2010. We are especially interested in identifying how an area’s proportion of immi-grants, visible minorities, tenants and its median household income impacts voter turnout. We conclude that Toronto has a distinctly uneven geography and demogra-phy of municipal voting.
Key findings based on our analysis of the past three municipal elections are:
• Voter turnout in Toronto municipal elections is low across all areas and communities.
o Voter turnout over the last three Toronto municipal elections aver-aged 42.7%, compared to a 61.6% turnout average in the last three federal elections.
o In 42 of Toronto’s 44 wards, less than half of all eligible municipal voters cast a ballot.
• Voter turnout varies significantly across the city’s wards and neighbourhoods.
o Wards range from average turnout of 35% to 51%, neighbourhoods from 32% to 58%.
• Toronto’s wards and neighbourhoods vary widely in their demographic make-up.
o Wards range in proportion of immigrants from 25% to 71%, in vis-ible minorities from 13% to 89%, in tenants from 15% to 71%, and in median household income from 38K to $85K.
• Our study provides new insights, and challenges some long-held assump-tions regarding voter participation in municipal elections in Toronto.
• An area’s proportion of immigrants has a strong inverse correlation to voter turnout.
• An area’s proportion of visible minorities has a medium inverse correlation to turnout.
• An area’s median income has weak positive correlation to voter turnout.
• There is no correlation between an area’s voter turnout and its proportion of tenants or homeowners.
2 Myer SieMiatycki and Sean MarShall
• Competitive election races for positions of mayor or councilor increase voter turnout.
• Areas with lowest voter turnout are generally located in the pre-amalgama-tion borders of Etobicoke, North York, Scarborough and York.
• There are outlier examples to the patterns identified above – eg. Areas with high immigrant and visible minority populations which have high voter turnout.
• Voter participation in Toronto municipal elections could be increased through a variety of initiatives including electoral reform, enhanced civic education and voter outreach.
• A city committed to democratic participation and inclusion would do more to promote voter engagement.
Readers interested in a quick scan of key visuals provided in this paper could con-sult Tables 1, 2 and 3 along with maps 7 and 8.

3Who Votes In toronto MunIcIpal electIons?
1. inTRoduCTion
This study examines voter turnout in Toronto municipal elections. We are especial-ly interested in establishing how a series of socio-economic, identity and geographic characteristics correlate with exercising the right to vote among eligible voters.
Toronto’s demographics make it a particularly rich and interesting terrain for such study. By any number of measures, Toronto is among the world’s most diverse, cos-mopolitan cities. The 2011 census revealed a total population of 2.6 million people, with visible minorities and immigrants each comprising 49% of the total popula-tion. This positions Toronto at the tipping point of becoming a majority foreign-born, non-white city. Additionally, the city was home to over 200 different ethnic origins, with 45% of the population speaking a mother tongue other than English or French (City of Toronto 2013, City of Toronto 2012).
Toronto is also, in several respects, a divided city. Political fault lines often appear to pit the downtown, central city against the “inner suburbs” of Etobicoke, North York and Scarborough. Income and housing inequalities have increasingly become cause for concern, with evidence of deepening poverty, precarious housing and widening polarization across the city (Monsebraaten 2014, Monsebraaten 2013, Hulchansky 2010, Stapleton et al 2012). Additional concerns have been raised regarding inequitable outcomes for racialized minorities in the labour market, and a variety of local services including schooling and policing.
This study explores the connection between municipal voting behaviour and some of Toronto’s prime demographic characteristics: immigrant status, visible minority identity, income and home ownership. Specifically, we examine whether a ward or neighbourhood’s voter turnout is affected by its proportion of immigrants, visible minorities, and tenants or by its average income. Underlying our research is the view that municipal government is important to Torontonians’ quality of life, and voting in municipal elections matters.
Voting is the cornerstone of public participation in our democratic system. It’s the mechanism by which the public selects both its political leaders and its govern-ment’s policy direction. If all eligible voters are not equally drawn to the ballot box, there could be consequences for which communities and issues come to be regard-ed as priorities by elected officials. Additionally, low voter participation can reflect broader dynamics of social exclusion and alienation felt by some voters. Finally, the legitimacy of government itself can be compromised, if voter turnout is especially low in some areas or communities.
Further underlying our research is the belief in the importance of municipal gov-ernment. Cities are where the vast majority of Canadians live, and municipalities provide a host of services that directly shape the quality of everyday life. In focusing

4 Myer SieMiatycki and Sean MarShall
on Toronto, we are examining the fourth largest municipality in North America, with a population larger than six of Canada’s provinces. As an urban nation, our cit-ies require more resources – including research attention and study.
To date, studies of voting have focussed on national, not local elections. And rela-tively little attention has been devoted to the voting patterns among immigrants and visible minorities. Thus a leading team of researchers on Canadian federal elec-tions has argued: “Although nearly one fifth of Canada’s population is foreign-born, relatively little is known about the electoral participation of immigrants” (White et al 2006: 10). Even more sparse, as Canadian scholars Fred Cutler and J. Scott Matthews declare, is research on city elections. “Municipal elections,” they declare, “are the poor cousins in the study of elections and voting behaviour” (Cutler and Matthews 2005: 359).
Research into voter behaviour in national elections in Canada and other western countries has resulted in a number of widely accepted conclusions. These are well and succinctly expressed by S. Karthick Ramakrishnan who has observed: “The likelihood of voting increases among those who are older, wealthier, and more edu-cated. These findings have constituted the bedrock of studies of voting participation since the 1960s” (Ramakrishnan 2005: 41).
Meanwhile, despite the absence of hard research into Canadian municipal elec-tions, one bit of conventional wisdom has endured. Municipal politicians and scholars generally take as given that among eligible voters in local elections, homeowners are considerably more likely to vote than tenants. This flows from the assumption that since homeowners directly pay property taxes to city hall, and recognize the impact of local government on the value of their property, they have a greater stake in the outcome of local elections (Tindal and Tindal, 2000: 299).
Our study provides new insights, and challenges some long-held assumptions regard-ing voter participation. Our focus on Toronto is a ground-breaking examination of voter participation at the municipal scale in Canada. Our interest in immigrants and visible minorities provides new data on the correlation of these characteristics with voter participation at the municipal scale. And our tracking in Toronto of fac-tors such as income and homeownership challenges long-held assumptions of their influence on voter participation.
Key findings of this study reveal that:
• Toronto municipal elections have low voter turnout, reflected in all geo-graphic and demographic parts of the city.
• That said, Toronto’s wards and neighbourhoods vary considerably in voter turnout and demographic composition. This produces a distinct “geography of voting” in Toronto.

5Who Votes In toronto MunIcIpal electIons?
• Lower areas of voter turnout typically have high concentrations of immi-grant and visible minority population.
• Areas with the lowest voter turnouts generally are located in the pre-amalga-mation municipalities of Etobicoke, North York, Scarborough and York.
• There was no correlation found between voter turnout and an area’s pro-portion of tenants or homeowners. Wards and neighbourhoods with high percentage of renters have similar voting rates as areas with high concentra-tions of homeowners.
• Higher household income has a weak correlation with higher voter turnout. Income is not a significant predictor of who votes in Toronto elections.
• There are some notable exceptions to the general patterns identified above. For example, one of Toronto’s highest voting neighbourhoods (Thorncliffe Park) has among the highest concentrations of immigrants, visible minori-ties, tenants and low income residents in the city. There is nothing inevi-table or pre-determined about who votes in municipal elections.
• Voter turnout can be increased in any area or community by such factors as: a high profile mayoralty race, a competitive ward election for councilor, or robust grass-roots campaigning by candidates or organizations.
2. METhodology
This study adopts a spatial analysis approach to establish voting patterns in Toronto municipal elections. We examined voter turnout in the past three civic elections of 2003, 2006 and 2010. Findings are drawn from matching voter turnout results to socio-economic demographics at both the ward and neighbourhood scales of the city.
From the census, we are able to establish key demographic characteristics for each of Toronto’s 44 municipal wards and 140 official neighbourhoods. From the City of Toronto, we were able to obtain the following data for each election: poll by poll voting turnout data for every ward, demographic data on every neighbourhood, and geo-coded locations for all (over 1,500) polling stations in the City. This data allows us to establish voter turnout by ward or neighbourhood, and then to correlate these with the area’s demographic characteristics. In particular, we were interested in correlating voter turnout with a handful of demographics: immigrant status, visible minority identity, income, and home ownership.
Any research strategy or instrument can pose its distinct challenges. Survey re-search for instance – asking randomly sampled respondents whether they voted in a previous election – is both expensive and prone to inaccuracy. Invariably, such
6 Myer SieMiatycki and Sean MarShall
surveys report inflated voter participation, as respondents invariably overstate their own voting history. Our spatial approach has the advantage of working with official voter turnout data for all eligible voters. But this geo-political approach to studying voting patterns in Toronto is not without its own ambiguities and limitations. Our unit of analysis here is not individuals or groups, but geographic areas (wards and neighbourhoods). Our findings do not allow us to identify what proportion of any particular group (eg. Immigrants) vote, but rather how an area’s proportion of immi-grants correlates with voter turnout. Thus we are able to establish whether an area’s proportion of immigrants correlates with distinctive patterns of voter turnout. The statistical technique of regression analysis then further allows us to assess the extent to which a single variable – such as immigrant concentration – influences voter turnout.
A second challenge posed by our methodology was which census year to draw demographic data from. As noted, this study examines voting patterns in the 2003, 2006 and 2010 Toronto municipal elections. In addition to providing findings for each election year, we present findings averages across all three elections. This required us to also have a single baseline of city demographics. Canada conducts its census every five years, and we have used the 2006 census as our demographic baseline. We did so for two reasons. First, the year 2006 is mid-point, to our three election timespan. Perhaps more important, its data is more comprehensive and reliable than the 2011 census conducted on the basis of the new, non-compulsory National Household Survey.
Before presenting our findings, a brief overview of our three elections is in order. Two of these elections (2003 and 2010) featured fiercely contested mayoralty campaigns, with no incumbent in the running. David Miller was elected in 2003 and Rob Ford in 2010. The 2006 election returned mayor Miller to office, as had been widely expected. The competitive nature of an election campaign signifi-cantly impacts voter turnout, with the mayoralty race (elected at large across the entire municipality) most important of all. A hotly contested race features robust campaigning, considerable media attention and a perception that every vote counts; meanwhile an election regarded as a coronation commands considerably less pub-lic interest and commitment. Turnout in our three elections under study confirm this pattern, but with a twist.
Voter turnout in Toronto’s 2010 election was 50.4%, up strongly from 39.3% in 2006. But in the heated contest of 2003, the official turnout was only 38.3%, lower than would be expected for that year’s competitive mayoralty contest. The explana-tion lies in that election’s problematic voters list. The 2003 election was conducted with a hugely inflated voters list of 1.8 million voters, compared with just 1.5 mil-lion in 2006 – the first year that Toronto began cross-referencing its municipal list with the more accurate federal election voters list. Previously, the voters list con-

7Who Votes In toronto MunIcIpal electIons?
tained names of many persons ineligible to vote because they were not yet Cana-dian citizens, were deceased or were no longer living in the city. The vast majority of these “extra voters” did not cast a ballot in 2003, but their inclusion in the voters list had the effect of reducing the voter turnout calculation. The “real” turnout in 2003, were we to measure votes cast against an accurate voters list would be in the mid to upper 40 percent range. For the purpose of this study however, we use the official 2003 voter turnout percentage of votes cast as a proportion of all names on that year’s voters list.
Accordingly, the city-wide voter turnout average across all three municipal elections of 2003, 2006 and 2010 was 42.7%. Only 2 of Toronto’s 44 wards posted an average turnout of more than 50% over these 3 elections. And just 12 of the city’s 140 neigh-bourhoods had over half its eligible voters cast a ballot. Toronto’s municipal voting deficit affects all parts and communities of the city. That said, we now proceed with our interest in establishing geographic and demographic municipal voting patterns in the city.

8 Myer SieMiatycki and Sean MarShall
3. onE CiTy – diffEREnT spACEs
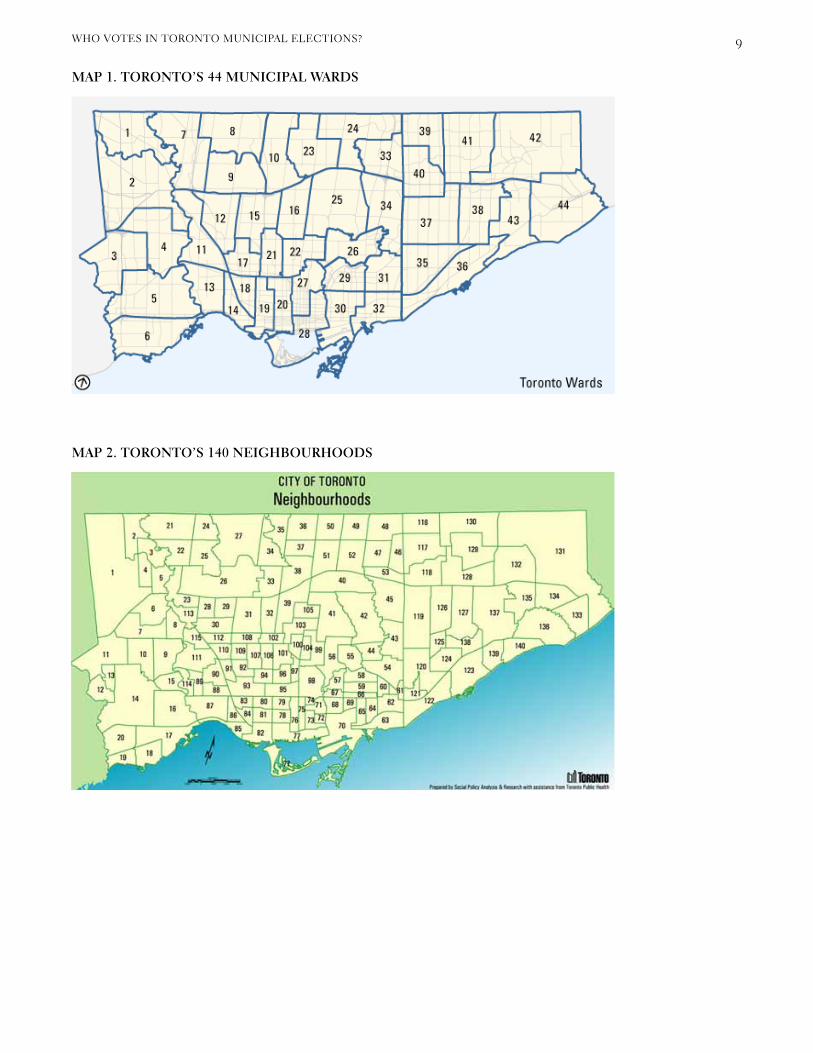
Toronto is a city of 44 electoral wards, and 140 official neighbourhoods. The de-mographic composition of these geographic spaces varies significantly. This allows us to correlate different voting patterns with statistically significant differences in population composition. Maps 1 and 2 below show the location and boundaries of Toronto’s wards and neighbourhoods. Table 1 further below shows the wide range of population characteristics across these wards and neighbourhoods.
Several notable observations flow from the data in Table 1 below. First, the number of eligible voters in both wards and neighbourhoods varies greatly across the city. The ward with the largest electorate has twice as many voters as the smallest ward. Further, it is evident that variations in voter turnout by ward and neighbourhood can affect election outcomes, since they amount to a difference of thousands of votes cast in every neighbourhood and ward depending on whether their turnout is at the high or low end of the participation range. At the neighbourhood scale, lowest average turnout for all three elections was 32%, while the top neighbourhood reached a 58% turnout. In selecting the city’s mayor, who is elected at large across all 140 neighbourhoods, some neighbourhoods clearly affect the outcome more than others – depending on their respective voter turnout.
As Table 1 also demonstrates, the variances in population demographics at both the ward and neighbourhood scales are very large. Wards and neighbourhoods across Toronto can differ considerably in the proportion of immigrants, visible minorities, tenants and household income. The range is especially pronounced at the neigh-bourhood scale because their smaller size and population can concentrate residents closer to the extreme ends of a measurement continuum (eg. Percentage of visible minorities or tenants).
9Who Votes In toronto MunIcIpal electIons?
MAp 1. ToRonTo’s 44 MuniCipAl WARds
MAp 2. ToRonTo’s 140 nEighbouRhoods
10 Myer SieMiatycki and Sean MarShall
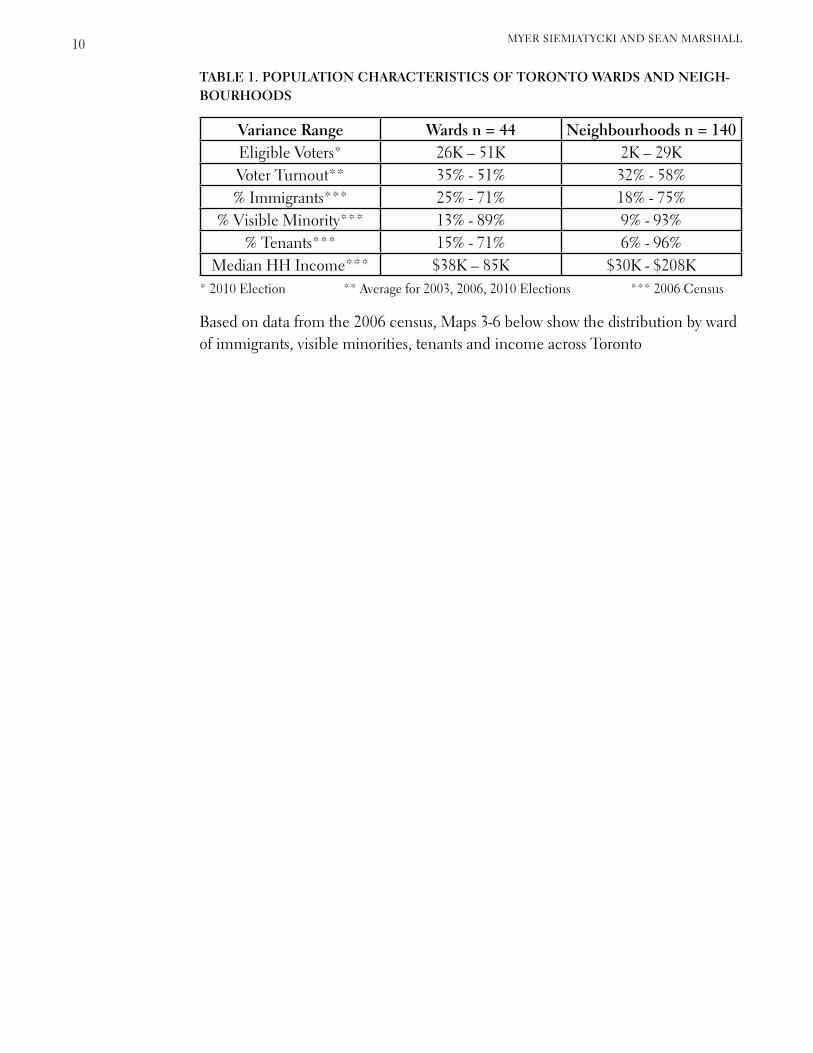
TAblE 1. populATion ChARACTERisTiCs of ToRonTo WARds And nEigh-bouRhoods
Variance Range Wards n = 44 neighbourhoods n = 140Eligible Voters* 26K – 51K 2K – 29KVoter Turnout** 35% - 51% 32% - 58%% Immigrants*** 25% - 71% 18% - 75%
% Visible Minority*** 13% - 89% 9% - 93%% Tenants*** 15% - 71% 6% - 96%
Median HH Income*** $38K – 85K $30K - $208K* 2010 Election ** Average for 2003, 2006, 2010 Elections *** 2006 Census
Based on data from the 2006 census, Maps 3-6 below show the distribution by ward of immigrants, visible minorities, tenants and income across Toronto

11Who Votes In toronto MunIcIpal electIons?
MAp 3. iMMigRAnTs by WARd, 2006
MAp 4. VisiblE MinoRiTiEs by WARd, 2006

12 Myer SieMiatycki and Sean MarShall
MAp 5. TEnAnTs by WARd, 2006
MAp 6. MEdiAn housEhold inCoME by WARd, 2006
13Who Votes In toronto MunIcIpal electIons?
As Maps 3 and 4 show, immigrants and visible minorities are particularly concen-trated across the top of Toronto, north of Highway 401, reaching down to pockets of the former municipalities of York, East York and Scarborough. Areas of lower immigrant and visible minority concentration span across the lower and central part of the city.
Maps 5 and 6 each reveal distinct patterns of tenant and household income distri-bution across Toronto. Tenants are most concentrated in the central and downtown core of Toronto, with strong pockets also in the former municipalities of York, North York and East York. Income distribution also appears randomly clustered in To-ronto. The highest concentration of top income wards is in Etobicoke, followed by North York and Scarborough. Low income wards are most prevalent in York, North York and the central city of Toronto.
The variances of population characteristics depicted in Maps 3-6 allow us to identi-fy correlations between area demographics and their voter turnout. We now present these findings.

14 Myer SieMiatycki and Sean MarShall
4. ToRonTo VoTing pATTERns by WARd And nEighbouRhood
4.a. Mapping ‘Toronto’s distinct geography of Voting’
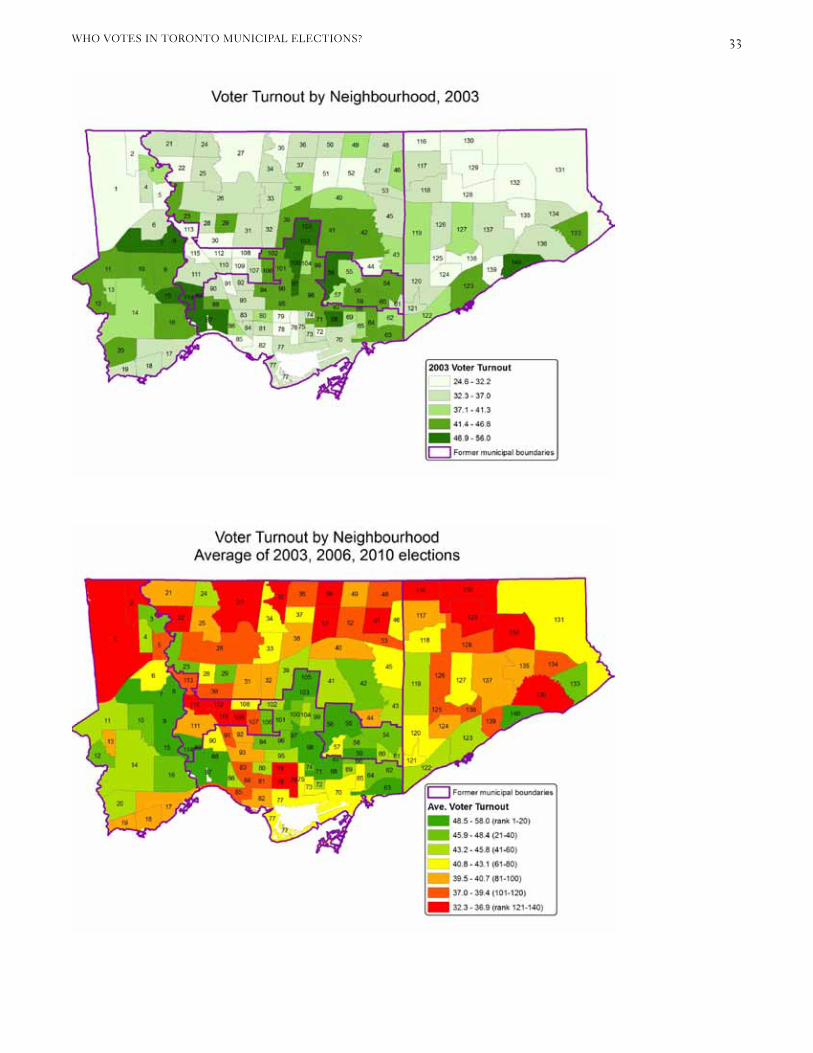
Maps 7 and 8 below show average voter turnout by ward and neighbourhood, for the three most recent municipal elections of 2003, 2006 and 2010. (In the Appen-dix, we show maps and tables of voter turnout for each election at both ward and neighbourhood scales.)
MAp 7. VoTER TuRnouT by WARd, AVERAgE of 2003, 2006, 2010 ElECTions

15Who Votes In toronto MunIcIpal electIons?
MAp 8. VoTER TuRnouT by nEighbouRhood, AVERAgE of 2003, 2006, 2010 ElECTions
Maps 7 and 8 reveal the wide discrepancies in voter turnout across Toronto wards and neighbourhoods over the past three civic elections. With a city-wide average turnout of 42.7%, the variance across all 44 wards ran from a low of 35.6% to a high of 51.2%. Across Toronto’s 140 neighbourhoods a wider variance from 32.3% to 58% prevailed.
At both ward and neighbourhood scales, Maps 7 and 8 reveal what we call “To-ronto’s distinct geography of voting.” A lower rate of voter turnout generally prevails across the top of Toronto north of Highway 401, through Etobicoke, North York and Scarborough. Higher turnout rates cluster in the central core of the city, and its west end. A further contrast (particularly at neighbourhood scale) distinguishes the two smallest former municipalities of pre-amalgamation Toronto: East York charac-terized by high turnout, and York by low.
The location of Toronto’s highest and lowest voting areas reflects “Toronto’s distinct geography of voting.” Ward 1 in northwest Etobicoke recorded the lowest average turnout of any ward, and it also contains the neighbourhood (number 2 on our map of city neighbourhoods) with the city’s lowest turnout – Mount Olive-Silverstone-Jamestown. Meanwhile, Ward 13 in southwest Toronto recorded the highest aver-age ward turnout, while Leaside Bennington (neighbourhood number 56) in the central city (and former East York) had the highest neighbourhood voter turnout.

16 Myer SieMiatycki and Sean MarShall
Again, we note, the difference in turnout here is large: in the most recent 2010 mu-nicipal election, of every 100 eligible voters, an average of 28 more voted in Leaside Bennington than in Mount Olive-Silverstone-Jamestown.
There are several ways to identify the relationship between voter turnout and our demographic variables of interest. First, an eyeball comparison of Map 7 with Maps 3-6 is instructive. This compares voting by ward with the distribution of immigrants, visible minorities, tenants and income by ward. Maps 7 (voting distribution) and 3 (immigrant distribution) are a stark study in contrasts. Darker shaded wards in Map 3 (those with highest immigrant concentrations) generally correspond with lighter coloured wards (those with lowest turnout) in Map 7. And the converse also holds: lighter shaded Wards in Map 3 (lowest immigration concentration) tend to become darker shaded (highest turnout) wards in Map 7. A similar, though somewhat less striking, inverse pattern re-appears in comparing Map 4’s distribution of visible minorities across Toronto with Map 7. Much weaker is the correspondence of Map 7 on voter turnout to Map 6 on income distribution in the city, reflecting a minimal correspondence of income and voter participation across the city. And finally, verg-ing on random, is the correspondence of Map 7 on voter turnout to Map 5 on ten-ant distribution across the city. As we will see, this reflects no correlation between an area’s voter turnout and its proportion of tenants or homeowners.
4.b. Regression Analysis of Voting patterns
The statistical technique of regression analysis provides a second and more precise measure of the correlation of potential influences on voter turnout. Table 2 presents our regression findings for the past three Toronto elections, expressed in R-squared parameter. This represents an estimate of the contribution made by our four in-dependent variables of interest (a ward’s percentage immigrant, visible minority and tenant population, and its median household income) in explaining the total variability in the dependent variable (voter turnout) across all wards in the city. The higher the R-squared number is, the stronger the correlation, which may be either a positive or inverse (negative) relationship.
TAblE 2: REgREssion AnAlysis of VoTER TuRnouT And sElECT VARiAblEs AT WARd sCAlE, ToRonTo AVERAgE of 2003, 2006, 2010 ElECTions
Ward variable R-squaredRelationship to Voter Turnout
Percent population, immigrant 0.6117 InversePercent population, visible minority 0.4384 InverseMedian household income 0.1423 PositivePercent tenants (dwellings, rental) 0.0443 Positive

R² = 0.61173
0.0
10.0
20.0
30.0
40.0
50.0
60.0
70.0
80.0
20.0 25.0 30.0 35.0 40.0 45.0 50.0 55.0
% Im
migrant
Voter Turnout
Immigrant popula<on vs voter turnout, all 3 elec<ons
17Who Votes In toronto MunIcIpal electIons?
As Table 2 shows, a ward’s proportion of immigrant population recorded the stron-gest correlation to voter turnout across Toronto’s 44 wards. It generated an inverse R-squared of 0.6117, regarded as a statistically strong correlation. Table 2 also shows a medium-impact inverse correlation for visible minority status of 0.4384, a modest positive correlation of 0.1423 for median household income, and a minimal, virtu-ally insignificant but positive correlation for renters compared with homeowners. These last two correlations come as surprises given our earlier references to: a) pre-vious national election research findings which highlight the strong correlation of higher income with higher voter participation, and b) the longstanding assumption that homeowners greatly outvote tenants in municipal elections.
The significance of these regressions is visually captured in Charts 1 and 2, showing the contrasting impacts of ward concentrations of immigrants and tenants on vot-ing. Chart 1 shows where all 44 wards locate on the joint continuums of immigrant population and voter turnout. Note that with very few exceptions, the robust nega-tive or inverse correlation is illustrated by the downward slope of the immigration R-squared line. With few exceptions, the higher a ward’s proportion of immigrants, the lower its voter turnout. Conversely, in Chart 2 there is no evident correspon-dence between a ward’s percentage renters and its voter turnout. Note the large number of wards vertically positioned in a turnout range of 36% to 41%. Their pro-portion of renters ranges from under 20% to over 60%, hence a regression finding of virtually no impact of renter threshold on voting in Toronto elections.
ChART 1. REgREssion CoRRElATion of iMMigRAnT populATion And VoTER TuRnouT, WARd sCAlE, 2003, 2006, 2010 ToRonTo ElECTions
immigrant population vs voter turnout, all 3 elections

R² = 0.04426
0.0
10.0
20.0
30.0
40.0
50.0
60.0
70.0
80.0
20.0 25.0 30.0 35.0 40.0 45.0 50.0 55.0
% Ren
ters
Turnout
% Renters vs Turnout, last 3 elec:ons
18 Myer SieMiatycki and Sean MarShall
ChART 2. REgREssion CoRRElATion of TEnAnT populATion And VoTER TuRnouT, WARd sCAlE, 2003, 2006, 2010 ToRonTo ElECTions
4.c. The View from the ground
Another way of expressing the correlation of voter turnout and voter demograph-ics is comparing the population characteristics of specific voting areas. We do this at both ward and neighbourhood scales for the most recent 2010 election. Table 3 below shows average turnout and demographic characteristics for the 10 top and bottom voting wards in 2010. Their respective profiles are striking in several respects. They differ dramatically in their concentration of immigrants and visible minorities, with higher proportions of each corresponding with lower voter turnout. This reinforces the negative or inverse relationship revealed by our regression analy-sis between a ward’s voting turnout, and its concentration of immigrants and visible minorities. Conversely, the highest voting wards have significantly lower proportions of both immigrants and visible minorities than the city average.
% Renters vs Turnout, last 3 elections

19Who Votes In toronto MunIcIpal electIons?
TAblE 3: Top/boTToM 10 WARds VoTER TuRnouT And dEMogRAphiCs, 2010 ElECTion
WardsAverage %
Voter Turn-out
% Immi-grant
% Visible Minority
Median Household Income ($)
% Rented Dwellings
Top 10 56.8 37.3 27.3 59,964 46.8 Bottom 10 44.6 63.0 62.7 53,104 38.4 City Total 50.4 50.0 46.9 52,833 45.6
Most surprising, in view of conventional wisdom, is our finding in Table 3 that the 10 highest voting wards in Toronto have a higher concentration of tenants than the 10 lowest voting wards. Of interest as well, is that highest voting wards have only modestly higher household income than our lowest voting polls. This suggests that income is not as strong a tie to voting municipally in Toronto, as it has been shown in national election studies of many western countries.
As Table 4 below reveals, the voting patterns established in our regression analysis play out in even more extreme form at the smaller neighbourhood scale. A wider gap separates top and bottom 10 neighbourhoods than wards in average voter turn-out, and spatial correlation of immigrants, visible minorities and income. Interest-ingly, the random impact of tenant concentrations previously established through regression analysis is reflected here in its slightly inverse association with neighbour-hood voting in Table 4, compared with its significantly positive association at the ward scale in Table 3.
TAblE 4: Top/boTToM 10 nEighbouRhoods VoTER TuRnouT And dEMo-gRAphiCs, 2010 ElECTion
Neighbour-hoods
Average % Voter Turn-
out
% Immi-grant
% Visible Minority
Median Household Income ($)
% Rented Dwellings
Top 10 60.6 28.9 14.9 81,366 37.6 Bottom 10 40.8 58.3 58 50,897 39.7 City Total 50.4 50.0 46.9 52,833 45.6

20 Myer SieMiatycki and Sean MarShall
5. lEssons fRoM ThE ExCEpTions
Our findings show that in Toronto, an area’s proportion of immigrants and visible minorities represents the strongest correlation to its voter turnout at municipal elec-tions. Income we have seen has a weak correlation to voting, and tenancy across the entire city has no consistent association with voting. These findings are reflected in the various maps, tables and charts presented to this point.
However there are wards and neighbourhoods which defy these general patterns. These outliers also convey important lessons about voting in Toronto municipal elections. Two distinct outlier categories can be identified. First are wards and neighbourhoods that consistently –across all three elections analyzed – defied the voting pattern we have identified for the city. Second are wards and neighbour-hoods which only inconsistently reflected these voting patterns – conforming in some of the three elections we studied, but not others.
There are very few outliers in our first category – those that consistently defy the general voting portrait we depict. It is telling for instance, that nine of the top ten voting wards in Toronto over the three elections studied have below city average proportion of immigrants. And all ten of the lowest voting wards have above city average proportion of immigrants. At the neighbourhood scale nine of the top ten voting neighbourhoods had below city average percentage of immigrants, and eight of the ten lowest voting neighbourhoods had above city average immigrant concen-tration.
In a city where voting outlier areas are few and far between, Ward 26 and one of its neighbourhoods – Thorncliffe Park – stand out. Ward 26 is located in east-central Toronto in the former municipality of East York. As the chart in our Appendix on ward turnout and demographics shows, Ward 26 is Toronto’s second highest voting city ward over all three elections of 2003, 2006 and 2010. It is also the only ward among the ten top voting wards with higher than city average concentrations of im-migrants and visible minorities. Thorncliffe Park, as our Appendix neighbourhood table shows, is a neighbourhood hugely higher than city average in immigrants, visible minorities and tenants, and well below city average in income. Yet it ranks 10th among 140 city neighbourhoods in voter turnout over the past three elections. Indeed, it ranked first among all city neighbourhoods in the 2006 election.
What is the secret of Ward 26 and Thorncliffe Park getting out the vote? Several factors contribute. To be sure, Ward 26 benefits from having within its boundary parts of other neighbourhoods that do fit our demographic “recipe” for high voter turnout. This includes Leaside-Bennington, the highest voting neighbourhood in the city. Yet Thorncliffe Park is the only neighbourhood that is entirely in Ward 26, and not part of any other ward. As our Appendix data show, Thorncliffe Park is cer-tainly pulling its weight (and the vote!) in making Ward 26 second highest voting

21Who Votes In toronto MunIcIpal electIons?
ward in Toronto. Underlying this is an important story about voting in Toronto.
In the 2003 Toronto election which elected David Miller mayor for the first time, Thorncliffe Park’s turnout ranked 56th of 140, and Ward 26 ranked 13th out of 44 wards. The local councillor contest that year in Ward 26 was a coronation, with incumbent Jane Pitfield winning 87% of the vote, the highest victory margin for any city councillor across the whole city. In the 2006 civic election Pitfield challenged David Miller in the mayoralty race, losing by a wide margin. As noted earlier, Da-vid Miller’s re-election was widely predicted and expected. This had a discouraging effect on voter turnout across the city – with 101,729 fewer votes cast in the 2006 municipal election than in 2003.
However, Ward 26 in 2006 was the site of an exceptionally spirited and competitive race for the council seat vacated by Jane Pitfield. Fourteen candidates contested the seat, including several of South Asian origin from Thorncliffe Park, who mounted strong grassroots campaigns in the predominantly South Asian neighbourhood. In an exceptionally tight ward election, the three top candidates came within 2% of each other when ballots were counted. A competitive council race with strong local visible minority candidates propelled Thorncliffe Park from 56th to 1st in neigh-bourhood turnout. Also at play was the exceptional community engagement led by Thorncliffe Neighbourhood House, then headed by its dynamic Executive Director Jehad Aliweiwi. By 2006, Thorncliffe Park had become a lower income neighbour-hood of 68% immigrants, 75% visible minorities, 91% renters with strong social capital rooted in shared space, institutions and programs. Impressively, we repeat, it led all 140 city neighbourhoods in voter turnout that year. The subsequent 2010 election featured both a competitive mayoralty and councillor race in Thorncliffe Park. And while voter turnout in the neighbourhood climbed from 54% in 2006 to 58% in 2010, Thorncliffe Park dropped from previously top turnout neighbourhood in the city to still notable 15th ranked, as the competitive mayoralty race boosted voter turnout in other neighbourhoods as well.
Ward 26 and Thorncliffe Park in particular remind us there is nothing pre-deter-mined or inevitable about voter turnout. Strong community empowerment, com-bined with credible dedicated local candidates and competitive election races can mobilize any voters – especially immigrants, visible minorities, low income and tenants.
Other Toronto wards and neighbourhoods have also “gone against script” in voter turnout. Some have experienced great volatility in their voting over three elections. Inevitably, this is a reflection of campaign races: whether competitive or corona-tion. Ward 8 in north-western North York for instance, ranked 43rd (second last) in turnout in 2003, and 40th in 2010. But in 2006 it shot up to 5th overall. This in a ward that is also home to far larger proportions of immigrants, visible minorities and

22 Myer SieMiatycki and Sean MarShall
low income residents than city average. How did this fluctuation happen?
Most significant was the fiercely contested councillor race in 2006 pitting incum-bent Peter LiPreti against rival and ultimate victor Anthony Perruzza. Tenant advocacy group ACORN extensively canvassed apartment buildings in support of Perruzza. The result was more ballots cast; this combined with the fall-off in voting across the city in the non-competitive mayoralty race of 2006, propelled Ward 8 to 5th highest voting rank among all city wards.
Ward 16 further exemplifies the volatile impact the local council race can have on voter turnout. Located in North Toronto (now central amalgamated Toronto), the ward had among the lowest proportion of immigrants and visible minorities. In 2003 Ward 16 recorded the highest turnout in the city, as newcomer Karen Stintz defeated longtime incumbent Anne Johnston in a hotly contested campaign. Three years later, with no competitive mayoralty or councillor race, voter turnout fell from 51% in 2003 to 40% in 2006, and its ward rank to 13th overall.
Voting, like all human behaviour, is subject to influence and choices. Any identi-fied correlations are subject to change, when context and circumstances change.

23Who Votes In toronto MunIcIpal electIons?
6. ExplAining ToRonTo’s VoTing pATTERns
Our findings show that in Toronto, an area’s proportion of immigrants and visible mi-norities represents the strongest correlation to its voter turnout at municipal elections. Income we have seen has a weak correlation to voting, while tenancy and homeowner-ship have no consistent association with voting.
Fully explaining these patterns would require further research. However, some start-ing hypotheses can be identified. Voting in municipal elections can be challenging, as reflected in the considerably lower turnout rate over the years for local elections com-pared with federal and provincial elections. This should remind us that all categories of eligible voters are less likely to vote municipally than at any other election.
Low municipal voter turnout is a problem for all demographics of Toronto society. This stems in part from the inherent difficulty voters face making an informed choice in mu-nicipal elections. The absence of political parties, leaves a laundry list of names on the long municipal ballot running for three positions: city mayor, ward councillor and school board trustee. It is virtually impossible for voters to know who all the candidates are, what they stand for, or their past record. More generally, civics education is no longer a priority in our schools, and many urban residents know little about the role or structure of local government. We need to do better at making municipal voting more user-friendly. This could involve initiatives of both public education and electoral reform.
Eligible immigrants and visible minorities may encounter particular barriers in vot-ing. It can take time for immigrants to become familiar with our political system, or to feel their voice and vote are wanted. Visible minority engagement may be impeded by the very low number of elected visible minority members of Toronto city council. Visible minorities now hold only 11% of council seats, while accounting for 49% of the city population in 2011. A more diverse political leadership in the city could prompt deeper engagement from Toronto’s diverse communities. Indeed, as we have seen, this dynamic has played out in some ward election races.
Geographically, Toronto’s lowest areas of voting are found in the northern parts of Etobi-coke, North York and Scarborough, plus pockets of the former municipality of York. These areas are home to especially large concentrations of immigrants and visible mi-norities. As Maps 3, 4 and 6 show a number of these areas, especially in North York and Scarborough, are higher than average income areas of the city. Worth further research is whether our finding of minimal association between income and voting across Toronto as a whole is impacted by the lower voting in these particular areas. Conversely, the non-association of tenancy and voting may be partially explained by the distribution of tenants across Toronto. As Map 5 demonstrates, the concentration of tenants in central parts of the city core, with its strong tradition of civic engagement may well contribute significantly to boosting the correlation between voting and renters.

24 Myer SieMiatycki and Sean MarShall
7. RECoMMEndATions foR RAising MuniCipAl VoTER TuRn-ouT in ToRonTo
Toronto, like other municipalities, has a poor record of voter participation in civic elections. There are many reasons to take this democratic deficit seriously. It threat-ens the legitimacy and confidence of local government and risks local officials being out of touch with public needs and concerns. It can lead to areas or commu-nities within the city being marginalized from public decision-making.
Many liberal democracies are now confronted with declining voter participation. It will take effort and creativity to create the civic culture that promotes greater engagement. There is room for experimentation, with non-partisan initiatives large and small. These include steps that can be taken by municipal institutions, by elections candidates, by community organizations and by individuals. These could include:
initiatives by Municipalities
• Greater public education campaigns related to municipal government especially in the months prior to civic elections, delivered across the city in a host of municipal institutions including libraries, schools and transit hubs.
• City-wide voting information and promotion advertising prior to elections.
• Promoting immigrant voting through such measures as community-based civics education, multi-lingual voting advertising encouraging newcomers to vote, and extending municipal voting rights (as endorsed by Toronto city council) to all permanent resident immigrants in the city.
• Using the carrot approach (as some municipalities do) to provide those who vote with tangible reward (eg. small tax rebate).
initiatives by Election Candidates
• Engage in more community-based campaigning.
• Produce multilingual campaign messaging and material.
• Reach out to community and “ethnic” media.
initiatives by Community organizations
• Promote civic awareness and voting among community members.
• Identify and organize around issues of particular interest/concern to the community.

25Who Votes In toronto MunIcIpal electIons?
• Use all available media (community and social) to message the importance of voting as elections approach.
initiatives by individuals
• Don’t underestimate the influence individuals have over family and friends.
• Talk it up, text it up, tweet it up: voting matters.
• Participate in innovative civic engagement initiatives such as the 1,000 Din-ners TO idea of having 1,000 dinners at which Torontonians discuss making the city a better place. Further information and registration is available at http://1000dinnersto.com/

26 Myer SieMiatycki and Sean MarShall
8. CiTATions
City of Toronto. 2013. Backgrounder: 2011 National Household Survey, May 9, 2013.
City of Toronto. 2012. Backgrounder: 2011 Census: Language, October 25, 2012.
Cutler, F. and J. S. Matthews. 2005. The Challenge of Municipal Voting: Vancou-ver 2002. Canadian Journal of Political Science 38 (2).
Hulchansky, D. 2010. The Three Cities Among Toronto: Income Polarization Within Toron’s Neighbourhoods, 1970-2005, University of Toronto Cities Centre, Toronto.
Monsebraaten, L. 2014. City faces ‘epidemic’ of child poverty. The Toronto Star, 27 August.
Monsebraaten, L. 2013. Ontario’s affordable housing crisis deepens. The Toronto Star, 18 June.
Ramakrishnan, S. K. 2005. Democracy in Immigrant America. Stanford University Press, Redwood City.
Stapleton, J., B. Murphy, and Y. Xing. 2012. The Working Poor in the Toronto Region. Metcalf Foundation, Toronto.
White, S., N. Nevitte, A. Blais, J. Everitt, P. Fournier and E. Gidengil. 2006. Mak-ing up for Lost time: Immigrant Voter Turnout in Canada. Electoral Insight 8 (2).

27Who Votes In toronto MunIcIpal electIons?
9. AppEndiCEs
list of Maps and Tables
Voter Turnout by Ward, 2010 28
Voter Turnout by Ward, 2006 28
Voter Turnout by Ward, 2003 29
Voter Turnout by Ward, Average of 2003, 2006, 2010 elections 29
Voter Turnout and Key Demographics by Toronto Ward 30
Voter Turnout by Neighbourhood, 2010 32
Voter Turnout by Neighbourhood, 2006 32
Voter Turnout by Neighbourhood, 2003 33
Voter Turnout by Neighbourhood, Average of 2003, 2006, 2010 elections 33
Voter Turnout and Key Demographics by Toronto Neighbourhood 34

28 Myer SieMiatycki and Sean MarShall

29Who Votes In toronto MunIcIpal electIons?
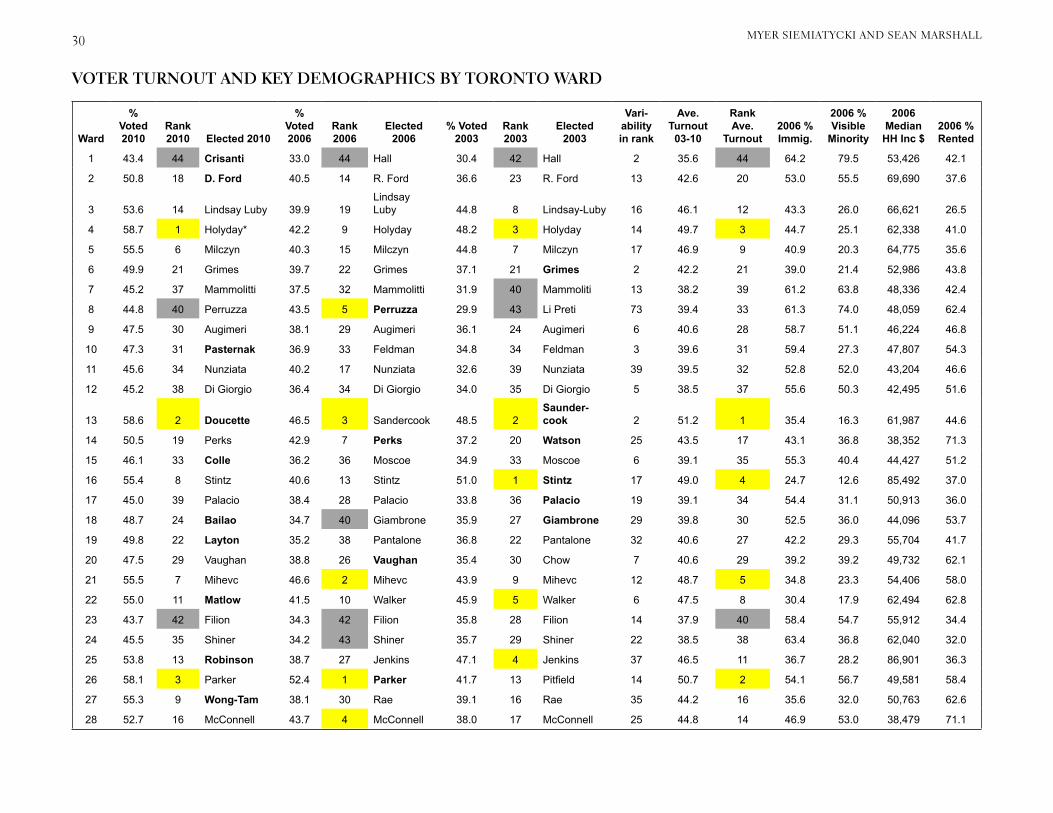
VoTER TuRnouT And KEy dEMogRAphiCs by ToRonTo WARd
Ward
% Voted 2010
Rank 2010 Elected 2010
% Voted 2006
Rank 2006
Elected 2006
% Voted 2003
Rank 2003
Elected 2003
Vari-ability in rank
Ave. Turnout
03-10
Rank Ave.
Turnout2006 % Immig.
2006 % Visible
Minority
2006 Median HH Inc $
2006 % Rented
1 43.4 44 Crisanti 33.0 44 Hall 30.4 42 Hall 2 35.6 44 64.2 79.5 53,426 42.1
2 50.8 18 D. Ford 40.5 14 R. Ford 36.6 23 R. Ford 13 42.6 20 53.0 55.5 69,690 37.6
3 53.6 14 Lindsay Luby 39.9 19Lindsay Luby 44.8 8 Lindsay-Luby 16 46.1 12 43.3 26.0 66,621 26.5
4 58.7 1 Holyday* 42.2 9 Holyday 48.2 3 Holyday 14 49.7 3 44.7 25.1 62,338 41.0
5 55.5 6 Milczyn 40.3 15 Milczyn 44.8 7 Milczyn 17 46.9 9 40.9 20.3 64,775 35.6
6 49.9 21 Grimes 39.7 22 Grimes 37.1 21 Grimes 2 42.2 21 39.0 21.4 52,986 43.8
7 45.2 37 Mammolitti 37.5 32 Mammolitti 31.9 40 Mammoliti 13 38.2 39 61.2 63.8 48,336 42.4
8 44.8 40 Perruzza 43.5 5 Perruzza 29.9 43 Li Preti 73 39.4 33 61.3 74.0 48,059 62.4
9 47.5 30 Augimeri 38.1 29 Augimeri 36.1 24 Augimeri 6 40.6 28 58.7 51.1 46,224 46.8
10 47.3 31 Pasternak 36.9 33 Feldman 34.8 34 Feldman 3 39.6 31 59.4 27.3 47,807 54.3
11 45.6 34 Nunziata 40.2 17 Nunziata 32.6 39 Nunziata 39 39.5 32 52.8 52.0 43,204 46.6
12 45.2 38 Di Giorgio 36.4 34 Di Giorgio 34.0 35 Di Giorgio 5 38.5 37 55.6 50.3 42,495 51.6
13 58.6 2 Doucette 46.5 3 Sandercook 48.5 2Saunder-cook 2 51.2 1 35.4 16.3 61,987 44.6
14 50.5 19 Perks 42.9 7 Perks 37.2 20 Watson 25 43.5 17 43.1 36.8 38,352 71.3
15 46.1 33 Colle 36.2 36 Moscoe 34.9 33 Moscoe 6 39.1 35 55.3 40.4 44,427 51.2
16 55.4 8 Stintz 40.6 13 Stintz 51.0 1 Stintz 17 49.0 4 24.7 12.6 85,492 37.0
17 45.0 39 Palacio 38.4 28 Palacio 33.8 36 Palacio 19 39.1 34 54.4 31.1 50,913 36.0
18 48.7 24 Bailao 34.7 40 Giambrone 35.9 27 Giambrone 29 39.8 30 52.5 36.0 44,096 53.7
19 49.8 22 Layton 35.2 38 Pantalone 36.8 22 Pantalone 32 40.6 27 42.2 29.3 55,704 41.7
20 47.5 29 Vaughan 38.8 26 Vaughan 35.4 30 Chow 7 40.6 29 39.2 39.2 49,732 62.1
21 55.5 7 Mihevc 46.6 2 Mihevc 43.9 9 Mihevc 12 48.7 5 34.8 23.3 54,406 58.0
22 55.0 11 Matlow 41.5 10 Walker 45.9 5 Walker 6 47.5 8 30.4 17.9 62,494 62.8
23 43.7 42 Filion 34.3 42 Filion 35.8 28 Filion 14 37.9 40 58.4 54.7 55,912 34.4
24 45.5 35 Shiner 34.2 43 Shiner 35.7 29 Shiner 22 38.5 38 63.4 36.8 62,040 32.0
25 53.8 13 Robinson 38.7 27 Jenkins 47.1 4 Jenkins 37 46.5 11 36.7 28.2 86,901 36.3
26 58.1 3 Parker 52.4 1 Parker 41.7 13 Pitfield 14 50.7 2 54.1 56.7 49,581 58.4
27 55.3 9 Wong-Tam 38.1 30 Rae 39.1 16 Rae 35 44.2 16 35.6 32.0 50,763 62.6
28 52.7 16 McConnell 43.7 4 McConnell 38.0 17 McConnell 25 44.8 14 46.9 53.0 38,479 71.1
MYER SIEMIATYCKI AND SEAN MARSHALL30

WHO VOTES IN TORONTO MUNICIPAL ELECTIONS?31
29 57.7 5 Fragedakis 42.8 8 Ootes 43.7 10 Ootes 5 48.1 6 39.0 23.6 52,101 47.8
30 55.3 10 Fletcher 40.3 16 Fletcher 41.2 14 Fletcher 8 45.6 13 37.9 41.8 53,100 41.7
31 54.0 12 Davis 42.9 6 Davis 42.7 11 Davis 11 46.6 10 43.7 40.9 50,023 42.9
32 57.9 4 McMahon 40.9 12 Bussin 44.9 6 Bussin 14 47.9 7 26.2 21.2 61,098 41.3
33 45.4 36 Carroll 34.6 41 Carroll 36.0 25 Carroll 21 38.7 36 68.9 65.0 55,853 44.1
34 50.9 17 Minnan-Wong 41.3 11Minnan-Wong 37.8 18
Minnan-Wong 13 43.3 18 53.7 50.3 51,269 58.8
35 49.4 23 Berardinetti 39.9 21 Heaps 32.8 38 Altobello 19 40.7 26 54.9 37.4 42,102 50.9
36 53.2 15 Crawford 39.5 24 Ashton 41.7 12 Ashton 21 44.8 15 37.5 36.2 52,877 39.1
37 48.5 26 Thompson 38.1 31 Thompson 37.3 19 Thompson 17 41.3 23 52.2 56.8 48,736 38.8
38 48.4 27De Baer-emaeker 40.0 18
De Baer-emaeker 35.1 31
De Baer-emaeker 22 41.2 24 57.7 66.1 49,261 40.9
39 44.6 41 Del Grande 34.9 39 Del Grande 33.0 37 Del Grande 4 37.5 42 71.1 83.7 55,186 21.1
40 48.6 25 Kelly 39.6 23 Kelly 36.0 26 Kelly 5 41.4 22 64.0 69.3 46,427 44.0
41 43.6 43 Lee 36.2 35 Lee 31.6 41 Balkissoon* 14 37.1 43 71.4 87.8 58,822 17.6
42 47.1 32 Cho 36.1 37 Cho 29.5 44 Cho 12 37.6 41 63.8 88.7 61,333 24.3
43 48.2 28 Ainslie 39.9 20 Ainslie** 35.1 32 Sokancki 20 41.1 25 50.6 59.2 48,549 43.8
44 50.1 20 Moeser 38.9 25 Moeser 39.7 15 Cowbourne 15 42.9 19 45.3 51.9 76,173 15.3
City 50.6 R. Ford 39.3 Miller 38.3 Miller 42.7 50.0 46.9 52,833 45.6

32 Myer SieMiatycki and Sean MarShall
33Who Votes In toronto MunIcIpal electIons?

VoTER TuRnouT And KEy dEMogRAphiCs by ToRonTo nEighbouRhood
Neighbourhood Wards
Eligible Electors,
2010
% Voted 2010
Rank, 2010
% Voted 2006
Rank, 2006
% Voted 2003
Rank, 2003
Avg. Turnout
03-10
Rank Avg.
TurnoutVariab. in rank
% Im-mig.
% Vis Min
% Rent-ed
Median HH In-come $
Leaside-Bennington 26, 29 11114 64.7 1 53.4 2 56.0 1 58.0 1 2 18.4 9.3 26.7 94,837
Guildwood 36, 43 7690 61.3 2 48.9 6 49.9 6 53.4 3 4 30.2 22.5 21.1 75,023
Lawrence Park North 16, 25 10697 61.3 3 45.1 16 55.0 3 53.8 2 26 19.9 11.9 25.6 100,098
Cabbagetown-South St.James Town 27, 28 8886 60.5 4 46.8 9 42.3 38 49.9 15 34 32.3 23 54.4 54,684
Playter Estates-Danforth 29 7046 60.3 5 46.7 10 45.8 18 50.9 6 13 26.7 14.9 54.9 61,249
Kingsway South 4, 5 8152 60.2 6 42.1 37 55.9 2 52.7 4 66 21.4 8.5 16.3 121,671
Edenbridge-Humber Valley 4 7896 60.0 7 41.3 48 46.8 14 49.3 16 75 42.4 13.0 45.0 72,567
Runnymede-Bloor West Village 13 9333 59.6 8 46.6 12 50.1 5 52.1 5 11 29.4 11.8 19.7 80,618
High Park North 13, 14 11534 59.6 9 49.4 5 43.1 33 50.7 7 32 41.0 20.0 68.0 53,168
Rosedale-Moore Park 22, 27 15870 59.1 10 40.9 55 46.1 17 48.7 19 83 27.2 13.6 44.3 99,740
The Beaches 32 15142 59.0 11 41.5 45 46.4 15 49.0 17 64 19.2 9.4 36.3 79,666
Willowridge-Martingrove-Rich-view 4 13019 58.8 12 43.4 24 47.8 12 50.0 13 24 47.8 34.9 42.9 60,280
Princess-Rosethorn 3, 4 11667 58.7 13 42.5 33 44.2 26 48.4 21 27 30.0 14.1 14.7 118,478
North Riverdale 30 9635 58.6 14 44.3 21 47.9 11 50.3 12 17 33.0 30.2 39.6 69,084
Thorncliffe Park 26 7423 58.5 15 54.1 1 39.1 56 50.5 10 69 68.1 74.9 91.0 39,580
Woodbine Corridor 32 9123 58.0 16 41.8 42 44.4 23 48.1 24 45 28.8 25.0 41.6 58,882
High Park-Swansea 13, 14 18450 57.2 17 46.6 13 48.2 8 50.6 8 9 32.4 13.4 38.5 63,763
Lawrence Park South 16, 25 11289 57.1 18 41.8 43 52.9 4 50.6 9 64 19.0 9.0 27.3 129,322
Humber Heights-Westmount 2, 4 8001 57.1 19 46.1 14 48.4 7 50.5 11 12 50.0 20.3 44.1 50,230
Casa Loma 21, 22 10740 57.0 20 42.9 29 43.9 28 48.0 27 10 27.4 14.5 61.4 71,705
Birchcliffe-Cliffside 36 15949 56.7 21 39.5 67 40.3 48 45.5 44 65 27.6 20.7 32.4 58,717
Danforth Village - East York 29, 31 9136 56.7 22 44.4 20 44.5 22 48.5 20 4 39.5 27.6 28.2 57,810
Markland Woods 3 8471 56.7 23 43.3 26 44.7 20 48.2 23 9 37.3 15.4 23.5 75,699
Yonge-St.Clair 22 6589 56.6 24 45.1 17 48.1 9 49.9 14 15 28.9 12.8 62.4 70,725
East End-Danforth 31, 32 15559 56.5 25 41.1 50 40.2 49 45.9 40 26 29.1 26.9 46.2 55,102
Thistletown-Beaumond Heights 1 5068 56.5 26 42.4 34 39.4 54 46.1 39 28 55.9 53.8 34.4 55,032
Lambton Baby Point 13 4436 56.4 27 42.1 39 48.0 10 48.8 18 41 34.2 20.9 42.1 66,138
Forest Hill South 21, 22 4628 56.3 28 39.5 68 44 27 46.6 34 81 23.6 11.2 45.4 90,832
Mount Pleasant East 22, 25 8325 56.0 29 44 22 42.8 36 47.6 31 21 25.8 12.2 40.7 78,035
Banbury-Don Mills 25, 26 18057 55.9 30 45 18 42.9 34 47.9 28 28 47.6 38.6 38.9 74,228
City Total 1,643,427 50.6 39.3 38.3 42.7 50.0 46.9 45.6 52,833
MYER SIEMIATYCKI AND SEAN MARSHALL 34

WHO VOTES IN TORONTO MUNICIPAL ELECTIONS?35
nEighbouRhoods 31-60
Neighbourhood Wards
Eligible Electors,
2010
% Voted 2010
Rank, 2010
% Voted 2006
Rank, 2006
% Voted 2003
Rank, 2003
Avg. Turnout
03-10
Rank Avg.
TurnoutVariab. in rank
% Im-mig.
% Vis Min
% Rented
Median HH In-come $
Yonge-Eglinton 16, 22 9401 55.7 31 42.2 36 47.3 13 48.4 22 28 23.2 15.0 59.2 68,503
Old East York 29, 31 9706 55.6 32 42.6 31 44.7 21 47.6 30 11 34.5 23.2 29.0 63,185
Stonegate-Queensway 5 17285 55.5 33 40.1 59 42.9 35 46.2 37 50 38.8 11.6 35.5 66,154
Wychwood 21 7071 55.5 34 46.6 11 41.7 43 47.9 29 55 40.3 28.6 53.1 47,619
O’Connor-Parkview 36, 31 11735 55.3 35 45.2 15 43.3 30 48.0 26 35 41.4 37.6 48.2 50,163
Blake-Jones 30 4600 55.2 36 40.1 60 40.1 50 45.1 47 34 37.9 41.0 44.7 49,352
Annex 20, 27 19737 55.1 37 40.0 63 42.0 39 45.7 42 50 31.4 20.6 63.7 53,873
Humewood-Cedarvale 21 9370 54.9 38 47.1 8 42.0 40 48.0 25 62 35.2 28.5 63.0 52,591
Danforth Village - Toronto 29 7539 54.8 39 42.7 30 41.9 42 46.5 35 21 36.3 26.7 35.5 56,622
Briar Hill-Belgravia 15 3182 54.4 40 36.6 98 31.7 114 40.9 76 74 62.0 40.9 50.7 47,393
Pelmo Park-Humberlea 7, 11 6271 54.4 41 43.4 25 42.5 37 46.8 32 28 47.4 36.4 17.1 64,532
Broadview North 29 5467 54.2 42 35.0 119 37.4 63 42.2 69 133 48.5 24.3 70.6 40,774
Church-Yonge Corridor 27, 28 21571 54.1 43 39.8 64 35.4 77 43.1 61 34 35.6 34.6 71.4 43,651
Rexdale-Kipling 2 7339 54.1 44 40.9 54 36.1 70 43.7 58 26 47.3 41.8 45.1 52,428
Bridle Path-Sunnybrook-York Mills 25, 26 6901 53.8 45 35.5 109 44.4 24 44.5 51 149 27.0 20.2 5.5 208,312
Mount Pleasant West 22, 25 19608 53.7 46 41.9 40 41.3 45 45.6 43 11 39.9 28.2 80.7 49,651
South Riverdale 30 16342 53.7 47 37.9 89 36.0 73 42.5 65 58 41.0 47.8 40.1 48,515
North St.James Town 27, 28 8241 53.6 48 49.5 4 36.9 65 46.7 33 105 60.0 68.2 96.4 30,237
Niagara 19, 20 9938 53.5 49 35.0 117 31.9 112 40.1 91 73 35.0 32.9 36.6 62,374
Regent Park 28 2225 53.4 50 52.4 3 30.7 122 45.5 45 166 53.9 78.8 89.1 35,656
Crescent Town 31 7319 53.2 51 43.0 28 35.8 74 44.0 56 69 61.2 62.8 63.7 39,625
Eringate-Centennial-West Deane 3 12139 53.0 52 38.0 85 44.3 25 45.1 48 93 44.0 27.7 14.1 71,005
Junction Area 11, 13, 14 9939 52.8 53 41.6 44 33.7 100 42.7 64 65 40.3 28.7 44.9 53,543
Alderwood 6 9200 52.7 54 41.9 41 41.6 44 45.4 46 16 37.0 10.2 21.9 62,842
Maple Leaf 12 5245 52.6 55 43.9 23 42.0 41 46.2 38 50 54.8 36.2 46.0 48,937
Cliffcrest 36 11376 52.5 56 41.0 52 43.7 29 45.8 41 27 33.5 27.0 32.5 62,770
Oakridge 35 6693 52.5 57 42.1 38 32.9 105 42.5 66 86 58.4 72.7 70.2 31,367
Woodbine-Lumsden 31 4902 52.3 58 39.7 66 43.1 31 45.1 49 43 34.7 30.8 30.0 53,499
Greenwood-Coxwell 30, 32 9443 52.2 59 37.0 94 39.4 53 42.8 63 76 38.7 44.1 39.5 48,198
Centennial Scarborough 44 9100 52.0 60 42.3 35 44.9 19 46.4 36 41 35.4 34.8 6.2 99,376
City Total 1,643,427 50.6 39.3 38.3 42.7 50.0 46.9 45.6 52,833

36 MYER SIEMIATYCKI AND SEAN MARSHALL
nEighbouRhoods 61-90
Neighbourhood Wards
Eligible Electors,
2010
% Voted 2010
Rank, 2010
% Voted 2006
Rank, 2006
% Voted 2003
Rank, 2003
Avg. Turnout
03-10
Rank Avg.
TurnoutVariab. in rank
% Im-mig.
% Vis Min
% Rented
Median HH In-come $
Islington-City Centre West 3, 5 23950 51.9 61 39.4 69 40.9 46 44.1 55 31 47.6 31.2 40.4 61,514
Bedford Park-Nortown 16 13538 51.9 62 36.6 99 46.2 16 44.9 50 120 26.9 12.6 31.4 90,635
Moss Park 27, 28 9075 51.8 63 36.6 97 36.4 69 41.6 73 62 36.9 39.7 58.6 41,375
Brookhaven-Amesbury 11, 12 20051 51.7 64 35.4 111 30.1 124 39.1 103 60 57.9 62.9 56.1 43,385
Palmerston-Little Italy 18, 19 16665 51.6 65 38.0 86 40.0 51 43.2 60 56 39.8 24.3 52.9 50,990
Wexford/Maryvale 37, 40 17401 51.5 66 41.2 49 40.0 52 44.2 53 20 47.7 45.5 37.5 51,071
Rouge 42, 44 28877 51.2 67 39.3 71 32.1 110 40.9 77 43 55.7 75.7 13.3 76,945
Waterfront Communities-The Island 20, 28 28791 51.0 68 40.1 58 35.7 76 42.3 68 28 38.3 36.8 51.8 60,871
Forest Hill North 16, 21 7862 50.7 69 37.9 90 43.1 32 43.9 57 79 37.0 18.4 66.9 56,972
Willowdale West 23 8670 50.7 70 41.4 47 36.6 67 42.9 62 43 51.6 37.3 30.0 57,733
Parkwoods-Donalda 34 19224 50.7 71 40.0 62 35.4 78 42.1 70 25 53.9 49.7 60.4 56,941
Victoria Village 34 9843 50.4 72 42.6 32 37.8 60 43.6 59 68 55.1 54.7 56.3 42,317
Roncesvalles 14 8908 50.4 73 43.0 27 39.2 55 44.2 54 74 40.7 31.7 55.1 47,685
Rustic 12 4972 50.3 74 40.1 61 37.0 64 42.4 67 16 54.8 55.3 60.1 36,944
Mimico 6 17270 50.1 75 37.4 92 33.8 99 40.4 85 24 41.6 23.8 44.8 55,773
Clairlea-Birchmount 35 14406 50.1 76 40.9 53 34.4 94 41.8 72 64 49.6 49.3 36.4 52,060
Black Creek 8 10089 50.0 77 48.5 7 34.8 88 44.4 52 151 61.8 78.1 66.1 39,775
Bathurst Manor 10 7959 49.8 78 36.8 95 36.6 68 41.1 75 44 55.9 24.4 47.6 54,314
Dovercourt-Wallace Emerson-Junction
17, 18, 19 23089 48.9 79 35.4 110 34.9 86 39.7 98 55 52.9 37.1 47.3 46,897
Clanton Park 10 8442 48.5 80 38.7 79 36.0 72 41.1 74 8 48.2 30.0 46.3 51,962
Bendale 37, 38 16526 48.5 81 39.1 73 38.4 59 42.0 71 22 53.4 58.3 31.9 62,604
Woburn 38, 43 28223 48.4 82 40.5 56 33.1 103 40.7 82 73 58.5 68.5 45.4 49,306
Kennedy Park 35 10684 48.3 83 38.7 80 31.9 111 39.7 100 34 55.8 64.8 44.8 41,132
Morningside 43 11535 48.3 84 39.0 76 32.1 109 39.8 97 41 57.0 69.3 35.8 54,588
Trinity-Bellwoods 19 12001 48.3 85 32.3 133 34.4 92 38.3 109 89 48.0 31.0 43.3 52,218
Tam O’Shanter-Sullivan 40 15152 48.2 86 39.0 75 35.3 79 40.8 80 15 64.9 69.6 44.0 49,212
Bayview Woods-Steeles 24 7939 48.1 87 34.6 125 37.5 62 40.0 93 101 59.8 58.1 40.1 64,948
Kingsview Village-The Westway 2, 4 13821 48.0 88 38.9 77 35.7 75 40.9 78 13 56.0 54.3 42.7 50,933
Humber Summit 7 7672 48.0 89 39.0 74 34.0 97 40.3 87 38 62.6 54.2 25.3 57,809
Bay Street Corridor 27, 28 9871 47.9 90 28.9 140 28.7 135 35.2 132 55 43.7 52.5 68.2 50,593
City Total 1,643,427 50.6 39.3 38.3 42.7 50.0 46.9 45.6 52,833

WHO VOTES IN TORONTO MUNICIPAL ELECTIONS?37
nEighbouRhoods 91-120
Neighbourhood Wards
Eligible Electors,
2010
% Voted 2010
Rank, 2010
% Voted 2006
Rank, 2006
% Voted 2003
Rank, 2003
Avg. Turnout
03-10
Rank Avg.
TurnoutVariab. in rank
% Im-mig.
% Vis Min
% Rented
Median HH In-come $
L’Amoreaux 39, 40 28528 47.9 91 38.6 82 34.5 91 40.4 86 18 66.2 76.2 34.6 51,037
Bayview Village 24, 33 9531 47.8 92 34.8 120 32.2 108 38.3 110 40 59.1 59.0 35.0 70,854
Little Portugal 18 8244 47.5 93 32.8 130 32.7 106 37.7 117 61 50.3 26.9 51.0 46,194
New Toronto 6 10505 47.4 94 39.1 72 35.0 84 40.5 83 34 38.1 29.6 55.7 43,440
Lansing-Westgate 10, 23 11478 47.4 95 36.5 102 37.6 61 40.5 84 48 40.8 30.2 40.5 63,355
Pleasant View 33 10780 47.3 96 36.5 103 38.7 57 40.8 79 53 67.0 60.8 24.8 61,457
Englemount-Lawrence 15 13992 47.3 97 36.5 100 35.2 82 39.7 99 21 47.2 35.8 57.8 45,060
Long Branch 6 5143 46.9 98 38.4 83 34.7 89 40.0 94 21 35.4 19.3 50.7 51,054
Flemingdon Park 26 10949 46.9 99 45.0 19 30.1 125 40.7 81 186 67.3 77.2 55.4 41,278
St.Andrew-Windfields 25 12193 46.6 100 32.7 131 40.4 47 39.9 95 115 44.0 39.7 32.8 92,367
Highland Creek 44 10722 46.5 101 34.5 126 35.2 80 38.7 106 71 53.5 66.2 6.3 86,852
Weston 11 8382 46.4 102 41.1 51 29.4 129 39.0 104 129 47.2 51.1 62.2 39,298
Downsview-Roding-CFB 7, 9 18999 46.4 103 36.5 101 33.0 104 38.6 107 5 55.7 48.4 53.8 45,772
Etobicoke West Mall 3 7173 46.3 104 35.6 108 38.5 58 40.1 90 54 51.9 35.9 43.4 52,437
Eglinton East 35, 37, 38 13119 46.1 105 37.5 91 30.6 123 38.1 112 46 55.7 68.7 54.5 43,934
Henry Farm 33 4964 46.1 106 37.2 93 35.0 83 39.4 101 23 70.8 70.3 62.7 56,664
Elms-Old Rexdale 2 5827 46.0 107 38.6 81 31.7 115 38.8 105 60 53.9 60.5 41.2 53,779
Corsa Italia-Davenport 17 10718 46.0 108 39.4 70 34.8 87 40.1 92 55 53.5 24.0 32.2 54,222
Agincourt South-Malvern West 39 - 42 12215 45.8 109 36.3 104 31.2 117 37.8 116 18 66.7 78.2 26.4 55,041
Ionview 35, 37 6332 45.6 110 34.6 124 31.6 116 37.3 120 22 57.5 66.0 59.3 44,090
Oakwood-Vaughan 15, 17, 21 21067 45.6 111 38.1 84 34.1 96 39.2 102 39 53.7 40.7 45.6 44,924
Weston-Pellam Park 17 6705 45.5 112 38.8 78 30.0 126 38.1 111 82 56.0 37.2 38.2 46,995
Glenfield-Jane Heights 7, 8, 9 16262 45.1 113 41.4 46 34.4 93 40.3 88 114 63.6 72.5 46.8 44,208
Westminster-Branson 10 13375 45.1 114 36.2 105 29.2 132 36.9 122 36 71.3 30.0 61.8 42,518
Dufferin Grove 18 6112 45.1 115 33.9 128 36.0 71 38.4 108 70 50.0 37.2 60.0 42,427
Rockcliffe-Smythe 11 14085 45.1 116 40.4 57 35.2 81 40.2 89 83 54.6 47.2 42.1 45,514
Hillcrest Village 24 14447 45.0 117 34.8 121 34.4 95 38.0 113 30 69.2 72.2 22.7 59,609
Yorkdale-Glen Park 15 9186 44.8 118 38.0 87 36.8 66 39.9 96 52 57.4 40.4 41.7 49,457
Scarborough Village 36 7057 44.6 119 36.0 106 31.7 113 37.5 119 20 55.1 65.6 55.6 42,417
Kensington-Chinatown 19, 20 11736 44.5 120 36.0 107 29.0 134 36.5 123 40 54.2 65.8 70.2 34,260
City Total 1,643,427 50.6 39.3 38.3 42.7 50.0 46.9 45.6 52,833

MYER SIEMIATYCKI AND SEAN MARSHALL38
nEighbouRhoods 121-140
Neighbourhood Wards
Eligible Electors,
2010
% Voted 2010
Rank, 2010
% Voted 2006
Rank, 2006
% Voted 2003
Rank, 2003
Avg. Turnout
03-10
Rank Avg.
TurnoutVariab. in rank
% Im-mig.
% Vis Min
% Rented
Median HH In-come $
West Humber-Clairville 1, 2 20711 44.5 121 35.0 116 29.4 130 36.3 124 19 60.0 77.9 27.4 63,413
South Parkdale 13, 14 11454 44.2 122 39.8 65 29.5 127 37.8 115 119 52.4 55.5 91.3 28,560
Malvern 42 25925 44.0 123 34.7 123 28.5 137 35.7 129 14 64.4 86.5 29.7 56,611
Beechborough-Greenbrook 12 5331 43.8 124 32.8 129 27.9 138 34.8 134 14 52.7 52.9 64.6 38,620
Dorset Park 37, 40 13023 43.7 125 36.7 96 33.2 101 37.9 114 34 61.5 71.9 37.5 46,485
Milliken 39, 41 16985 43.7 126 35.3 113 29.3 131 36.1 126 31 70.9 93.3 15.9 60,350
Humbermede 7 8573 43.2 127 34.4 127 29.4 128 35.7 130 1 63.7 70.1 46.8 46,463
Don Valley Village 33 15424 43.0 128 32.0 134 33.1 102 36.0 127 38 70.5 65.6 50.2 56,118
Newtonbrook West 10, 23 13405 42.2 129 35.3 114 35.0 85 37.5 118 44 64.0 42.1 44.6 51,629
Agincourt North 41 19170 42.2 130 35.2 115 28.7 136 35.4 131 36 72.6 88.3 14.7 58,095
West Hill 43, 44 17093 42.1 131 34.8 122 33.8 98 36.9 121 33 48.3 55.2 40.3 46,789
Mount Olive-Silverstone-James-town 1 15352 41.8 132 30.6 137 24.6 140 32.3 140 8 67.1 85.3 52.0 48,146
University 20 7625 41.6 133 30.7 136 30.9 119 34.4 136 20 33.7 24.7 55.7 58,781
Newtonbrook East 24 9941 41.4 134 32.5 132 34.7 90 36.2 125 44 63.0 61.2 30.7 60,459
Keelesdale-Eglinton West 12 5985 40.9 135 30.5 138 32.6 107 34.7 135 34 54.7 34.3 32.2 45,651
Mount Dennis 11 6801 40.6 136 35.0 118 26.1 139 33.9 138 39 57.7 65.2 48.3 41,062
Steeles 39 16262 40.6 137 31.7 135 30.7 121 34.3 137 16 75.2 86.9 16.7 57,365
York University Heights 8, 9, 10 17749 40.6 138 37.9 88 29.0 133 35.8 128 95 60.4 63.3 56.0 43,051
Willowdale East 23 23023 39.5 139 29.3 139 30.9 118 33.3 139 21 62.2 67.5 33.6 55,986
Caledonia-Fairbanks 17 6201 39.1 140 35.4 112 30.8 120 35.1 133 36 60.2 35.2 31.5 51,684
City Total 1,643,427 50.6 39.3 38.3 42.7 50.0 46.9 45.6 52,833


170 Bloor Street West, Suite 804, Toronto, ON M5S 1T9 | 416.944.2627 | www.maytree.com