who turned out in the 2014 midterm election a p ost -e lection d ebrief presented by
TRANSCRIPT

WHO TURNED OUT IN THE 2014 MIDTERM ELECTION
A POST-ELECTION DEBRIEF
Presented by
ABOUT NONPROFIT VOTE AND CIRCLE
AboutUs
• Founded in 2005, Nonprofit VOTE partners with America's nonprofits to help the people they serve participate and vote.
• CIRCLE conducts research on young Americans’ voting and political participation, service, activism, media use, and other forms of civic engagement.
Find out more about our mission and partners on our sites
www.nonprofitvote.org, www.civicyouth.org

TODAY’S PRESENTERS
Who
Abby KiesaYouth Coordinator and Researcher
CIRCLE
George PillsburyFounder and
Executive Director
Nonprofit VOTE

Agenda

AGENDA
Agenda
2014 Voter Turnout 2014 Share of the Vote Partisan Preference by Demographic Voters on the Issues Election Democracy Takeaways
2014 VOTER TURNOUT

Voter Turnout Trend, Midterms and Presidential 1990-2014
VOTER TURNOUT TREND
2014Turnout1988 1990 1992 1994 1996 1998 2000 2002 2004 2006 2008 2010 2012 2014 2016
30%
35%
40%
45%
50%
55%
60%
65%
Midterms Presidential
SOURCE: United States Election Project, Voter Turnout: http://www.electproject.org/home/voter-turnout/voter-turnout-data

TOP 5, BOTTOM 5 STATES
2014Turnout
0%
10%
20%
30%
40%
50%
60%59% 57% 55% 53% 53%
29% 29% 29% 28% 28%
SOURCE: United States Election Project, November 2014 General Election Turnout Rates: http://www.electproject.org/2014g
Voter Turnout Trend, Midterms and Presidential 1990-2014

THE DRAG DOWN EFFECT
2014Turnout
All Other States Drag Down States20%
25%
30%
35%
40%
45%
39.3%
30.6%
Low Turnout in CA, NY & TX Drags Down Overall Turnout
SOURCE: Nonprofit VOTE’s calculations, based on USEP data

2014 SHARE OF THE VOTE
75%
12%
8%5%
White Black Latino Asian and Other

• A poll of 19,441 Election Day voters and 2,800 absentee and early voters.
WHAT IS THE NATIONAL ELECTION EXIT POLL?
The Poll
• Conducted by Edison Research on behalf of major American news outlets a consortium of ABC News, Associated Press, CBS News, CNN, Fox News and NBC News
SOURCE: New York Times, Election 2014, Exit Polls: http://www.nytimes.com/interactive/2014/11/04/us/politics/2014-exit-polls.htmlSEE ALSO: Edison Research, National Exit Poll FAQs: http://www.edisonresearch.com/election-polling/#toggle-id-4

SHARE OF THE VOTE IN 2014
Share ofThe Vote
SOURCE: CNN, House Full Results, Exit Polls: http://www.cnn.com/election/2014/results/race/house#
49%51%
Share of Vote by Gender
Male Female
13%
13%
19%33%
22%
Share of Vote by Age
18-29 30-39 40-4950-64 65 and older

SHARE OF THE VOTE IN 2014
Share ofThe Vote
SOURCE: CNN, House Full Results, Exit Polls: http://www.cnn.com/election/2014/results/race/house#
75%
12%
8%5%
Share of Vote by Race/Ethnicity
White BlackLatino Asian and Other
16%
20%
34%
23%
7%
Share of Vote by Income
Under $ 30,000 $30-50,000 $50-100,000$100-200,000 $200,000 or more

SHARE OF THE VOTE: 2014 VS. 2010Share of the electorate was the same as 2010 across
all demographics• The young and diverse voters served by nonprofits
voters of color, youth(18-29) and low income (<$50k) held steady when compared to 2010.
• African-Americans, Asian Americans and young voters did see a one point increase each in share of the electorate.
Share ofThe Vote
SOURCE: CNN, House Full Results, Exit Polls: http://www.cnn.com/election/2014/results/race/house#

LATINO SHARE OF THE VOTE IN 2014Latinos were 8% of the voting electorate
but 11% of eligible electorate• Most competitive races for Senate and Governor
were not in states with large Latino populations.• Close to half of the Latino population lives in CA, NY
and TX – among the least competitive with lowest turnout.
• Latinos are ten years younger than the U.S. median population
Share ofThe Vote
SOURCE: Pew Research Hispanic Trends Project, "Latino Voters and the 2014 Midterm Elections": http://www.pewhispanic.org/2014/10/16/latino-voters-and-the-2014-midterm-elections/

Percentage Point Increase/Decrease
• asdf
SHARE OF THE VOTE: 2014 vs. 2012
Share ofThe VoteMale
Female
White
Blac
kLa
tinoAsia
n
< 40 yr
> 50 yr
< $50 K
> $50 K-15
-10
-5
0
5
10
15
2
-2
3
-1 -2
0
-10
11
-5
5
SOURCE: Nonprofit VOTE calculations based on exit poll data

Share of Vote 2012 to 2014 for Under 40, Over 50
• asdf
UNDER 40 DROPOFF: 2012 TO 2014
Share ofThe Vote
Under 40 Over 500%
10%
20%
30%
40%
50%
60%
36%44%
26%
55%
2012 2014
SOURCE: Nonprofit VOTE calculations base d on exit poll data

VOTER CONTACT IN THE MIDTERM
Latino Voters AAPI Voters0%
10%
20%
30%
40%
50%
41% 42%
% Contacted aboutRegistering or Voting
Latino Voters AAPI Voters0%
10%
20%
30%
40%
50%
32%
21%
% Contacted byCommunity Organization
Share ofThe Vote
SOURCE: Latino Decisions and Asian American Decisions, Election Eve Polls: http://www.latinodecisions.com/2014-election-eve-poll/http://asianamericandecisions.com/2014/11/06/asian-american-decisions-releases-2014-election-eve-poll-results-2/

21.5% Estimated Youth Turnout, Comparable to Recent Midterm Years
CIRCLE’s estimate of two-day-after youth turnout, is based on exit polls, the number of ballots counted, and demographic data from the US Census

www.civicyouth.org
Youth Made up 13% of the Overall Electorate

Youth Turnout & Election Competitiveness

www.civicyouth.org
High Profile Ballot Measures

Who Youth Voted For
• Nationally, 18-29 year olds preferred Democratic House candidates 54% to 43% (57% of youth voted for Democratic House candidates in 2010)
• Only age group where most of vote went for Democratic candidate in statewide races: Iowa (Senate), Louisiana (Senate), Wisconsin (Gov)
• Voted with other age groups: New Hampshire
• More youth voted Republican: Alaska and Arkansas
• Significant reduction in youth support from 2008: North Carolina and Virginia

PARTISANPREFERENCE

PARTISAN PREFERENCE
• 2010 to 2014: Partisan preferences were virtually the same as 2010 except people earning over $200,000 became more liberal
• 2012 to 2014: Most demographics became slightly more conservative in compared to 2012 by anywhere from 2 to 9 points.
PartisanPreference
SOURCE: CNN, House Full Results, Exit Polls: http://www.cnn.com/election/2014/results/race/house#

Most GOP and Most Dem by Demo
OTHER PREFERENCE GAPS
PartisanPreference
White Male > $50K Black Asian Latino < $50K0%
20%
40%
60%
80%
100%
22% 16% 13%
0.79
0.3 0.260.11
Republican Democratic
SOURCE: Nonprofit VOTE calculations based on exit poll data
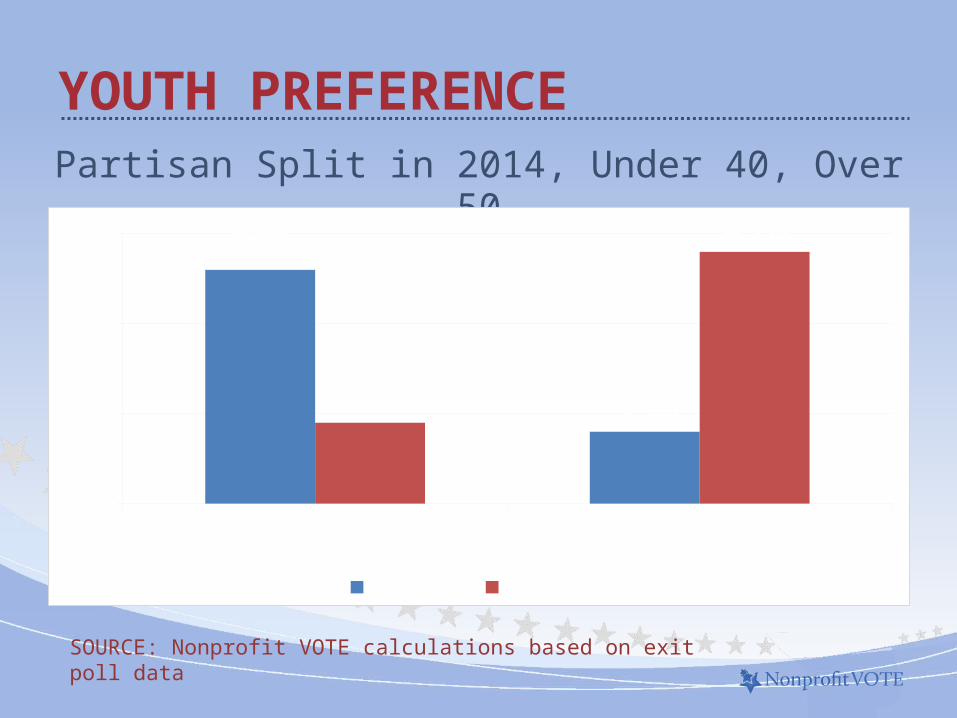
Partisan Split in 2014, Under 40, Over 50
YOUTH PREFERENCE
PartisanPreferenceUnder 40 Over 50
40%
45%
50%
55% 53%
44%45%
54%
2014 Dem 2014 Rep
SOURCE: Nonprofit VOTE calculations based on exit poll data

VOTERS ON THE ISSUES

VOTERS WEIGH IN – NONPROFITS SUPPORT
BallotMeasures
Winning Ballot Measures 2014• Economic Security
• Increased the minimum wage in Alaska, Arkansas, Nebraska, and South Dakota.
• Voting Rights• Protected Election Day voter registration in Montana.
Rejected a sham early voting in Missouri.
• Reproductive Choice• Defeating personhood amendments,
protecting reproductive rights in Colorado and North Dakota.
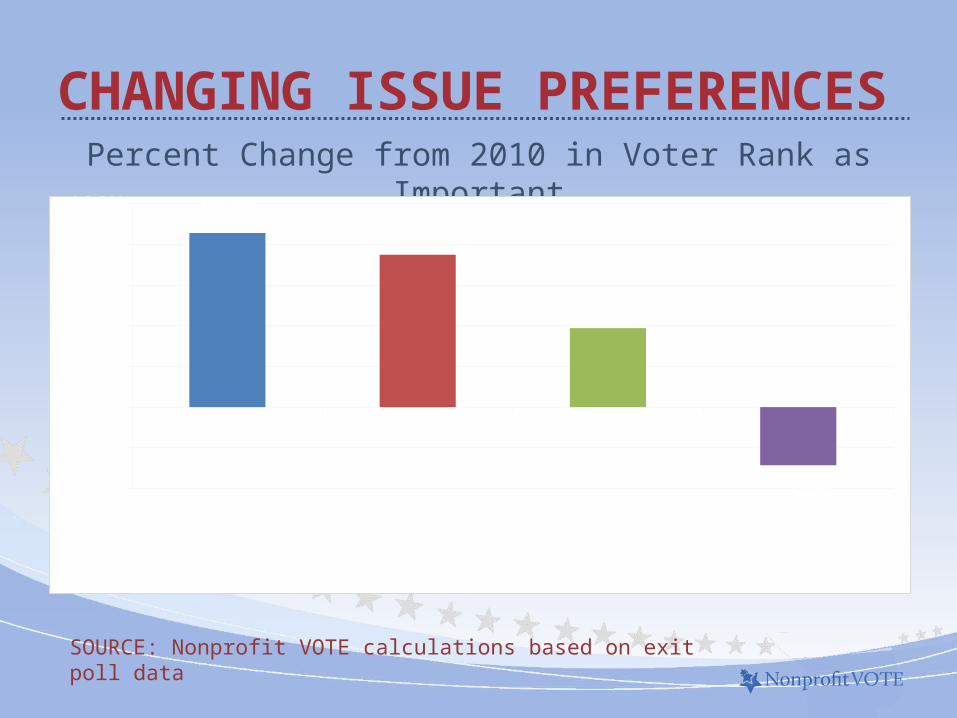
CHANGING ISSUE PREFERENCESPercent Change from 2010 in Voter Rank as Important
Foreign Policy Immigration Health Care Economy-40%
-20%
0%
20%
40%
60%
80%
100% 86%75%
39%
-29%
SOURCE: Nonprofit VOTE calculations based on exit poll data

CHANGING ISSUE PREFERENCES2014 Partisan Split on Most Important Issues
Illegal immigration
Foreign policy
Health care
Economy
0% 10% 20% 30% 40% 50% 60% 70% 80%
Republican Democratic
SOURCE: Nonprofit VOTE calculations based on exit poll data

ELECTION DEMOCRACY

• Voter ID: Photo ID has public support, but overly strict laws create barriers. In Texas:• # of registered voter up 700,000 since 2010• # of voters down 271,000
• Redistricting: Only 66 of 435 House seats were competitive in 2014.
RESTRICTIONS & CHALLENGES
ElectionDemocracy
SOURCE: Cook Political Report: http://cookpolitical.com/house/charts/race-ratings

• Online Voter Registration:• 20 states have OVR• 10 more since the last midterm
• Election Day Registration:• 12 states have EDR• Colorado, Connecticut and Illinois for the first time• Used by 7 of the top 10 turnout states
EXPANDING ACCESS & OPPORTUNITY
ElectionDemocracy
SOURCE: National Conference of State Legislatures: http://www.ncsl.org/research/elections-and-campaigns.aspx

• Close the age gap: Increase turnout of voters under 40• Take the “ground game” to public settings• Modernize voting to match expectations • Government is us.
• Close the partisan gap: No party should concede any demographic.
• Expand Democracy: Hold elected officials accountable• Increase Competition: Nonpartisan
Redistricting Commissions
• Keep Competing: In all 50 states
TAKEAWAYS
Takeaways

RESOURCES
Resources

www.civicyouth.org

617.357.VOTE (8683)
www.nonprofitvote.org
Nonprofit VOTE89 South StreetSuite 203Boston, MA 02111
George Pillsbury
Abby Kiesa