who global report on amr 2014. johan struwe (sweden)
TRANSCRIPT

1 |
Johan Struwe, PHA Sweden
On behalf of WHO AMR-team, Geneva

2 |
WHO disease-specific programs to contain AMR
Tuberculosis (2006)
Artemisinin- resistance in
Malaria (2011)
Antimicrobial resistance in
N. Gonorrhoea (2012)
Anti-HIV drug-resistance
(2012)
There is still a gap in action targeting “ordinary” bacteria causing common infections
. Sid
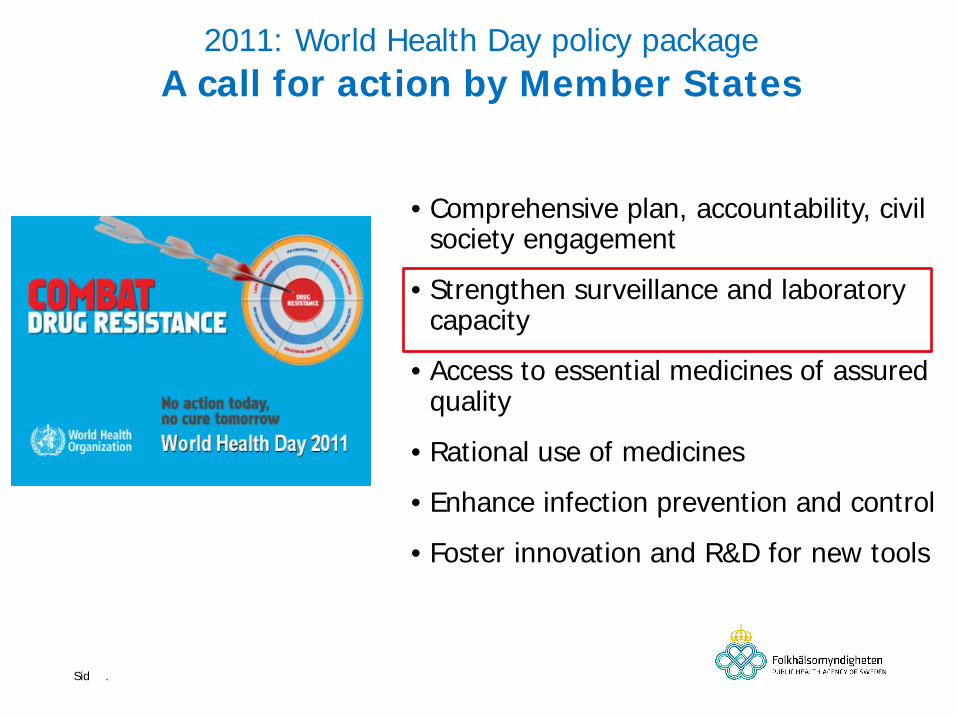
2011: World Health Day policy package A call for action by Member States
• Comprehensive plan, accountability, civil society engagement
• Strengthen surveillance and laboratory capacity
• Access to essential medicines of assured quality
• Rational use of medicines
• Enhance infection prevention and control
• Foster innovation and R&D for new tools

4 |
Consultation in Dec 2012: AMR surveillance roadmap: 1. WHO Global AMR Report
• To raise global awareness of AMR, and ABR in particular • To create a platform for future collaboration
2. Address need for standards and harmonization
3. Collaborate with and build on existing surveillance networks

5 |
• Focuses on antibacterial resistance (ABR) • (but includes summaries of surveillance from disease specific programs, food/ animals and candidiasis)
Surveillance of ABR according to WHO
regions
National and published data on 7 bacteria
Systematic reviews of evidence of health and
economic burden in 5 bacteria/ resistance
combinations
Identification of gaps
Antimicrobial Resistance Global Report on Surveillance 2014

6 |
ABR Data Collection
National official sources
National and international
networks of ABR surveillance
Scientific literature
When no data could be obtained,
published from 2008
Advice from a developing group representing WHO, WHO collaborating centres and external partners

7 |
Considerations and limitations in ABR data from Member States
National data in this report = data obtained from official sources
― data may not representative for the population or country as a whole.
Data are presented ”as reported”
― without validation of laboratory methods, quality or representativity
Data should generally not be compared between different sources
― Presented rates should be regarded as indicators of resistance in the studied populations

8 |
Bacterium Resistance/ decreased susceptibility to:
Escherichia coli 3rd generation cephalosporins, fluoroquinolones
Klebsiella pneumoniae 3rd generation cephalosporins, carbapenems
Staphylococcus aureus Methicillin (beta-lactam antibiotics) i.e. MRSA
Streptococcus pneumoniae Penicillin
Nontyphoidal Salmonella (NTS) Fluoroquinolones
Shigella species Fluoroquinolones
Neisseria gonorrhoeae 3rd generation cephalosporins
Selected Bacteria/Resistance Combinations

9 |
*National data means data obtained from official sources, but not that data necessarily are representative for the population or country as a whole
Available National Data* on Resistance for Nine Selected Bacteria/Antibacterial Drug Combinations, 2013
WHO: Antimicrobial Resistance. Global report on surveillance 2014

10 |
Name of bacterium/ resistance
Examples of typical diseases
No. of 194 MS providing
national data
No. of WHO regions with national reports of 50 %
resistance or more
Range of reported proportion of
resistance
Escherichia coli Urinary tract infections, blood stream infections
-vs 3rd gen. cephalosporins 84 5/6 0-82
-vs fluoroquinolones 90 5/6 3-96
Klebsiella pneumoniae
Pneumonia, blood stream infections, urinary tract infections
-vs 3rd gen. cephalosporins 85 6/6 2-82
-vs carbapenems 69 2/6 0-68
Staphylococcus aureus Wound infections, blood stream infections
-vs methicillin “MRSA” 83 5/6 0.3-90
Bacteria Commonly Causing Infections in Hospitals and Communities

11 |
Name of bacterium/ resistance
Examples of typical diseases
No. of 194 MS providing national data
No. of WHO regions with national reports of 25 % resistance or more
Range of reported proportion of
resistance
Streptococcus pneumoniae
Pneumonia, meningitis, otitis
-non-susceptible to penicillin
66 6/6 0-73
Nontyphoidal Salmonella Foodborne diarrhoea, blood stream infections
-vs fluoroquinolones 66 3/6 0-96
Shigella species Diarrhoea (“bacillary dysenteria”)
- vs fluoroquinolones 34 2/6 0-47
Neisseria gonorrhoeae Gonorrhoea
-vs 3rd gen. cephalosporins 42 3/6 0-36
Bacteria Mainly Causing Infections in the Community

Neisseria gonorrhoeae Detection of decreased susceptibility to 3rd generation cephalosporin and
treatment failures up to 2010

13 |
Is there any difference in outcome from infections
caused by resistant vs sensitive bacteria?
Systemic Reviews

14 |
Deaths (%)
Outcome (number of studies included) Resistant Not resistant RR (95% CI)
Escherichia coli resistant to:
3rd gen. cephalosporins Bacterium attributable mortality (n=4) 23.6 12.6 2.02 (1.41 to 2.90)
Fluoroquinolones Bacterium attributable mortality (n=1) 0 0
Klebsiella pneumoniae resistant to:
3rd gen. cephalosporins Bacterium attributable mortality (n=4) 20 10.1 1.93 (1.13 to 3.31)
Carbapenems Bacterium attributable mortality (n=1) 27 13.6 1.98 (0.61 to 6.43)
Staphylococcus aureus resistant to:
Methicillin (MRSA) Bacterium attributable mortality (n=46) 26.3 16.9 1.64 (1.43 to 1.87)
Risk of Death is Higher in Patients Infected with Resistant Strains

15 |
Does Published Literature Indicate Additional Costs Due to ABR?
Antibacterial resistance Studies included in SR (n)
Studies reporting cost
data (n)
Excess cost (n = studies reporting costs)
Hospitalization Antibacterial therapy Medical care Additional cost
variables
Escherichia coli resistant to:
3rd gen. cephalosporins 25 2 Yes (n=2) Yes (n=1) Yes (n=1) Yes (n=1)
Fluoroquinolones 12 0 - - - -
Klebsiella pneumoniae resistant to:
3rd gen. cephalosporins 24 0 - - - -
Carbapenems 13 0 - - - -
Staphylococcus aureus resistant to:
Methicillin 147 19 - Yes (n=6) Yes (n=6) Yes (n=9)

16 |
1. High proportions of resistance to common treatments for bacteria causing infections in both healthcare settings and in the community were reported in all WHO regions
2. Antibacterial resistance has a negative effect on patient outcomes and health expenditures
3. Treatment options for common infections are running out
4. Despite limitations, the report demonstrates worldwide magnitude of ABR and surveillance gaps
Summary I: Antibacterial Resistance
17 |
1. Gaps are largest where health systems are weak
2. There is no agreement on surveillance standards: • What samples and information to collect • How to analyse samples • How to compile and share data
3. Obtained national data was usually based on proportions of resistant bacteria rather than proportions of resistant bacteria causing specific diseases or affecting defined populations
4. The report provides a benchmark for future surveillance progress
Summary II: Surveillance of Antibacterial Resistance

18 |
The Global Action Plan
A Global Program for ABR Surveillance
Next Steps

19 |
Thank you!