who gains and who loses from credit card payments? theory and
TRANSCRIPT

No. 10-03
Who Gains and Who Loses from Credit Card Payments? Theory and Calibrations
Scott Schuh, Oz Shy, and Joanna Stavins Abstract: Merchant fees and reward programs generate an implicit monetary transfer to credit card users from non-card (or “cash”) users because merchants generally do not set differential prices for card users to recoup the costs of fees and rewards. On average, each cash-using household pays $149 to card-using households and each card-using household receives $1,133 from cash users every year. Because credit card spending and rewards are positively correlated with household income, the payment instrument transfer also induces a regressive transfer from low-income to high-income households in general. On average, and after accounting for rewards paid to households by banks, the lowest-income household ($20,000 or less annually) pays $21 and the highest-income household ($150,000 or more annually) receives $750 every year. We build and calibrate a model of consumer payment choice to compute the effects of merchant fees and card rewards on consumer welfare. Reducing merchant fees and card rewards would likely increase consumer welfare.
Keywords: credit cards, cash, merchant fees, rewards, regressive transfers, no-surcharge rule
JEL Classifications: E42, D14, G29 Scott Schuh is Director of the Consumer Payments Research Center and a senior economist in the research department at the Federal Reserve Bank of Boston. Oz Shy is a senior economist and a member of the Consumer Payments Research Center and Joanna Stavins is a senior economist and policy advisor and a member of the Consumer Payments Research Center, both in the research department at the Federal Reserve Bank of Boston. Their email addresses are [email protected], [email protected], and [email protected], respectively.
This paper, which may be revised, is available on the web site of the Federal Reserve Bank of Boston at http://www.bos.frb.org/economic/wp/index.htm.
We thank Tamás Briglevics for most valuable research assistance, analysis, and advice. We also thank Santiago Carbó Valverde, Dennis Carlton, Bob Chakravorti, Alan Frankel, Jeff Fuhrer, Fumiko Hayashi, Bob Hunt, Suzanne Lorant, John Sabelhaus, Irina Telyukova, Bob Triest, Lotta Väänänen, Zhu Wang, Paul Willen, and Michael Zabek, as well as seminar participants at the Boston Fed and at the Economics of Payments IV conference (New York Fed, May 2010), the conference on Platform Markets (ZEW Mannheim, June 2010), and the conference on Payment Markets (University of Granada, June 2010) for valuable comments and suggestions on earlier drafts.
The views and opinions expressed in this paper are those of the authors and do not necessarily represent the views of the Federal Reserve Bank of Boston or the Federal Reserve System.
This version: August 31, 2010

1. Introduction
The typical consumer is largely unaware of the full ramifications of paying for goods and
services by credit card. Faced with many choices—cash, check, debit or credit card, etc.—
consumers naturally consider the costs and benefits of each payment instrument and choose
accordingly. For credit cards, consumers likely think most about their benefits: delayed
payment—“buy now, pay later”—and the rewards earned—cash back, frequent flier miles,
or other enticements. What most consumers do not know is that their decision to pay by
credit card involves merchant fees, retail price increases, a nontrivial transfer of income from
cash to card payers, and consequently a transfer from low-income to high-income consumers.
In contrast, the typical merchant is acutely aware of the ramifications of his customers’
decisions to pay with credit cards. For the privilege of accepting credit cards, U.S. merchants
pay banks a fee that is proportional to the dollar value of the sale. The merchant’s bank
then pays a proportional interchange fee to the consumer’s credit card bank.1 Naturally,
merchants seek to pass the merchant fee to their customers. Merchants may want to recoup
the merchant fee only from consumers who pay by credit card. In practice, however, credit
card companies impose a “no-surcharge rule” (NSR) that prohibits U.S. merchants from
doing so, and most merchants are reluctant to give cash discounts.2 Instead, merchants
mark up their retail prices for all consumers by enough to recoup the merchant fees from
credit card sales.
This retail price markup for all consumers results in credit-card-paying consumers being
subsidized by consumers who do not pay with credit cards, a result that was first discussed
in Carlton and Frankel (1995), and later in Frankel (1998), Katz (2001), Gans and King
1Shy and Wang (Forthcoming) show that card networks extract higher surplus from merchants usingproportional merchant fees (rather than fixed, per-transaction fees). The amount of surplus that cardnetworks can extract increases with the degree of merchants’ market power.
2See Appendix D for additional discussion on the implications of the NSR. Card associations allowU.S. merchants to give cash discounts under certain restrictions. However, cash discounts are not widelyobserved. Frankel (1998) argues that a prohibition on credit card surcharges can have effects different fromthose resulting from a prohibition on cash discounts, because card surcharges allow merchants to vary theircharges according to the different merchant fees they pay on different cards, whereas a cash discount is takenfrom a single card price.
1

(2003), and Schwartz and Vincent (2006). For simplicity, we refer to consumers who do
not pay by credit card as cash payers, where “cash” represents all payment instruments
other than credit cards: cash, checks, debit and prepaid cards, etc.3 “Subsidize” means that
merchant fees are passed on to all buyers in the form of higher retail prices regardless of the
means of payments buyers use to pay. Thus, cash buyers must pay higher retail prices to
cover merchants’ costs associated with the credit cards’ merchant fees. Because these fees
are used to pay for rewards given to credit card users, and since cash users do not receive
rewards, cash users also finance part of the rewards given to credit card users.
If the subsidy of card payers by cash payers results from heterogeneity in consumer
preferences and utility between cash and card payments, the subsidy may be innocuous
in terms of consumer and social welfare. However, U.S. data show that credit card use is
very positively correlated with consumer income. Consequently, the subsidy of credit card
payers by cash payers also involves a regressive transfer of income from low-income to high-
income consumers. This regressive transfer is amplified by the disproportionate distribution
of rewards, which are proportional to credit card sales, to high-income credit card users.4
Frankel (1998, Footnote 85) was the first to connect the wealth transfers to average income
of groups of consumers (that is, poorer non-cardholders subsidizing wealthier cardholders).
This idea was later discussed in Carlton and Frankel (2005, pp. 640–641) and Frankel and
Shampine (2006, Footnote 19).5
Our contribution to this line of research is that we are the first to compute who gains
and loses from credit card payments in the aggregate economy. We compute dollar-value
estimates of the actual transfers from cash payers to card users and from low-income to
3McAndrews and Wang (2008) demonstrates the possibility of a subsidy in the opposite direction (fromcard to cash users) in cases where merchants’ cost of handling cash exceeds merchants’ card fees. McAndrewsand Wang’s definition of cards includes debit cards, which are less costly than credit cards, whereas in ourpaper debit cards are considered part of “cash.” Humphrey et al. (1996) and Humphrey et al. (2006)also provide evidence that electronic payment instruments, such as debit cards, are less costly than paperinstruments, such as cash or check. Again, however, we focus only on credit cards, which have high merchantfees and are more costly than other payment instruments, paper or electronic.
4See Hayashi (2009) and her references for a comprehensive overview of card reward programs.5Similar points were made recently in New York Times articles by Floyd Norris, “Rich and Poor Should
Pay Same Price,” October 1, 2009; and by Ron Lieber, “The Damage of Card Rewards,” January 8, 2010.
2

high-income households. A related paper by Berkovich (2009) estimates the total amount
transferred from non-rewards consumers to rewards consumers in the United States resulting
from gasoline and grocery purchases only.6
We propose a simple, model-free accounting methodology to compute the two transfers
by comparing the costs imposed by individual consumer payment choices with actual prices
paid by each buyer. On average, each cash buyer pays $149 to card users and each card
buyer receives $1,133 from cash users every year, a total transfer of $1,282 from the average
cash payer to the average card payer. On average, and after accounting for rewards paid
to households by banks, when all households are divided into two income groups, each
low-income household pays $8 to high-income households and each high-income household
receives $430 from low-income households every year. The magnitude of this transfer is
even greater when household income is divided into seven categories: on average, the lowest-
income household ($20, 000 or less annually) pays a transfer of $21 and the highest-income
household ($150, 000 or more annually) receives a subsidy of $750 every year. The transfers
among income groups are smaller than those between cash and card users because some
low-income households use credit cards and many high-income households use cash. Finally,
about 79 percent of banks’ revenue from credit card merchant fees is obtained from cash
payers, and disproportionately from low-income cash payers.
To conduct welfare and policy analysis of these transfers, we construct a structural model
of a simplified representation of the U.S. payments market and calibrate it with U.S. micro
data on consumer credit card use and related variables. Parameters derived from the model
are notably reasonable given the simplicity and limitations of the model and data. High-
income households appear to receive an inherent utility benefit from credit card use that
is more than twice as high as that received by low-income households. Eliminating the
merchant fee and credit card rewards (together) would increase consumer welfare by 0.15 to
6This estimated transfer is about $1.4b to $1.9b, and rewards are found to have a disproportionate impacton low-income minorities and to resemble a regressive tax on consumption. These estimates focus exclusivelyon rewards transfers and do not account for the full range of transfers from low- to high-income consumersresulting from merchant fees.
3

0.26 percent, depending on the degree of concavity of utility, which also can be interpreted
in an aggregate model as the degree of aversion to income inequality in society.
Our analysis is consistent with, but abstracts from, three features of the U.S. payments
market. First, we focus on the convenience use of credit cards (payments only) and do not
incorporate a role for revolving credit, which is an important feature of the total consumer
welfare associated with credit cards.7 U.S. data indicate that household propensity to revolve
credit card spending is surprisingly similar across income groups, so it is unlikely that interest
income plays a major role in the transfers. This fact supports working with a static model
that is more tractable for data analysis. Second, we abstract from the supply-side details
of the payments market for both cash and cards. We take as given the well-established,
seminal result of Rochet and Tirole (2006) concerning the critical role of an interchange fee
between acquiring and issuing banks in the two-sided credit card market, a result that notes
that the optimal level of the interchange fee is an empirical issue.8 By incorporating both
merchant fees and card rewards rates, we can assume that the interchange fee lies between
these rates and is set internally in the banking sector to the optimal level conditional on
fees and rewards. Finally, we do not incorporate a role for the distribution of bank profits
from credit card payments to households that own banks, because of a lack of sufficient micro
data. Given these three simplifications, we can assess only the consumer welfare implications
of the payment instrument transfers but not the full social welfare implications.
We want to be clear that we do not allege or imply that banks or credit card compa-
nies have designed or operated the credit card market intentionally to produce a regressive
transfer from low-income to high-income households. We are not aware of any evidence to
7For example, the work of Carroll (1997) provides motivation for credit cards to help consumers smoothincome in the face of income and wealth shocks and achieve optimal consumption plans. However, theactual impact of credit card borrowing on consumer and social welfare is complicated, as can be seen fromliterature, including Brito and Hartley (1995), Gross and Souleles (2002), Chatterjee et al. (2007), andCohen-Cole (Forthcoming).
8A complete list of contributions to two-sided markets is too long to be included here. The interestedreader can consult Chakravorti and Shah (2003), Gans and King (2003), Rochet (2003), Wright (2003),Roson (2005), Evans and Schmalensee (2005), Armstrong (2006), Schwartz and Vincent (2006), Bolt andChakravorti (2008), Hayashi (2008), Rysman (2009), and Verdier (Forthcoming). For a comprehensiveempirical study of interchange fees, see Prager et al. (2009).
4

support this allegation or any a priori reason to believe it. However, the existence of a
non-trivial regressive transfer in the credit card market may be a concern that U.S. individ-
uals, businesses, or public policy makers wish to address. If so, our analysis suggests several
principles and approaches worth further study and consideration, which we discuss briefly at
the end of the paper. Recent U.S. financial reform legislation, motivated by concerns about
competition in payment card pricing, gives the Federal Reserve responsibility for regulating
interchange fees associated with debit (but not credit) cards. Our analysis provides a differ-
ent but complementary motivation—income inequality—for policy intervention in the credit
card market.
Section 2 documents three basic facts about card card use. Section 3 demonstrates a
simple “accounting” of transfers from cash to card users and from low-to high-income buy-
ers. Section 4 presents an analytical model, which is then used in Section 5 to calibrate
the welfare-maximizing merchant fees and rewards to card users, and to compute changes
in welfare associated with a total elimination of card reward programs and merchant fees.
Policy implications are explored in Section 6. Section 7 subjects our computations of income
transfers to a wide variety of tests associated with additional modifications of the data. Sec-
tion 8 concludes. An appendix provides data details and sensitivity analysis of the calibrated
model.
2. Basic Facts about Credit Cards
This section establishes three basic facts about credit cards: 1) consumer credit card use
has been increasing; 2) consumer credit card use and rewards are positively correlated with
household income; and 3) credit card use varies across consumers due to heterogeneity in
nonpecuniary benefits from cards, even within income groups. These facts motivate our
analysis and modeling of transfers among consumers, associated with convenience use of
cards.
5

2.1 Credit cards in the economy
Over the last two decades, payment cards have enjoyed increased popularity in all sectors of
the economy. Our research focuses on credit and charge cards issued by banks, stores, and
gas stations and used by consumers only. Figure 1 shows that the fraction of households who
have a credit card (adopters) has been steady at about 70–75 percent during the past two
decades, reflecting the maturity of the market. However, the percentage of total consumption
expenditure paid for by credit card increased from about 9 percent to 15 percent during the
same period.9 As a result, revenue from merchant fees, which are proportional to credit card
spending, also increased. Consumer credit card spending accounts for approximately half of
all credit card spending in 2007.10
020
4060
8010
0P
erce
ntag
e of
hou
seho
lds
810
1214
1618
Per
cent
age
of c
onsu
mpt
ion
expe
nditu
re
1990 1995 2000 2005 2010
Consumption spendingvolume (left scale)
Credit card adoptionrate (right scale)
Sources: Survey of Consumer Finances 1989−2007
Credit Card Usage
Figure 1: Credit card adoption and spending rates.
9Both series were taken from the Survey of Consumer Finances (SCF), which asked consumers about theamount of credit card charges they had in the previous month (variable x412 ) since 1989 (“Consumptionspending volume”) and about credit card adoption (variable x410 ) since 1989 (“Credit card adoption rate”).
10Total credit card spending, which includes business and government expenditures, was about $42 billionin 2007, according to the Federal Deposit Insurance Corporation’s Call Report data (series rcfdc223 andrcdfc224 ).
6
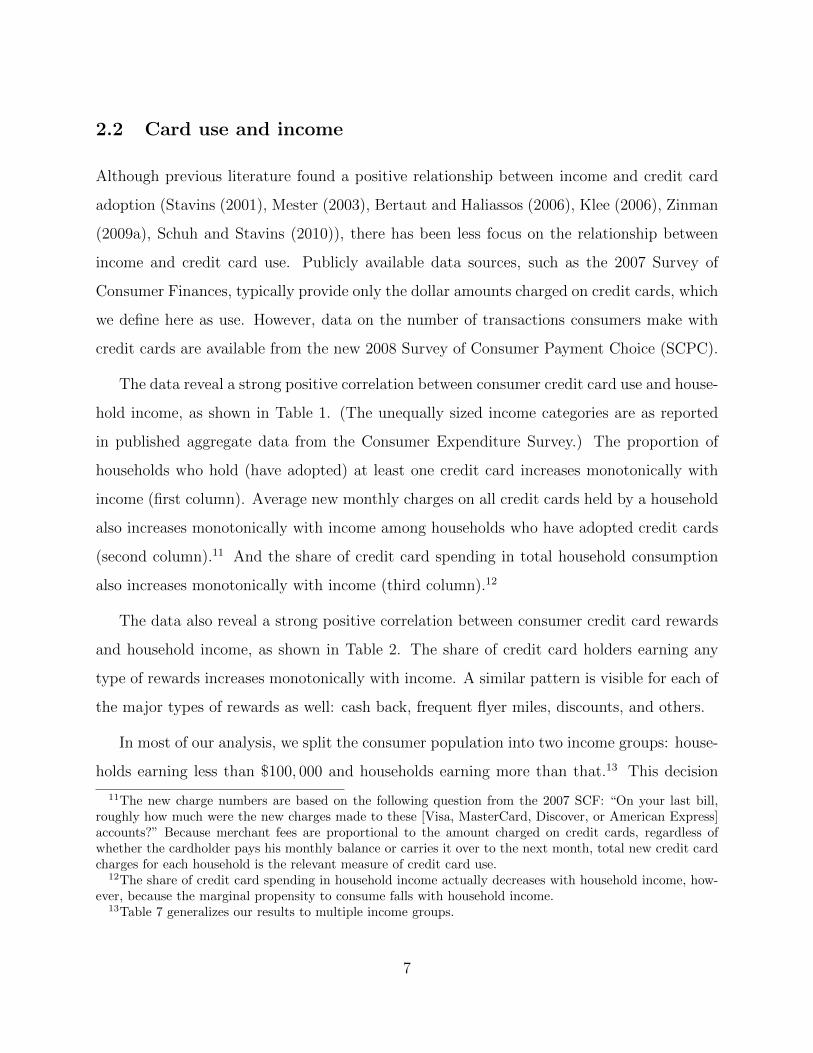
2.2 Card use and income
Although previous literature found a positive relationship between income and credit card
adoption (Stavins (2001), Mester (2003), Bertaut and Haliassos (2006), Klee (2006), Zinman
(2009a), Schuh and Stavins (2010)), there has been less focus on the relationship between
income and credit card use. Publicly available data sources, such as the 2007 Survey of
Consumer Finances, typically provide only the dollar amounts charged on credit cards, which
we define here as use. However, data on the number of transactions consumers make with
credit cards are available from the new 2008 Survey of Consumer Payment Choice (SCPC).
The data reveal a strong positive correlation between consumer credit card use and house-
hold income, as shown in Table 1. (The unequally sized income categories are as reported
in published aggregate data from the Consumer Expenditure Survey.) The proportion of
households who hold (have adopted) at least one credit card increases monotonically with
income (first column). Average new monthly charges on all credit cards held by a household
also increases monotonically with income among households who have adopted credit cards
(second column).11 And the share of credit card spending in total household consumption
also increases monotonically with income (third column).12
The data also reveal a strong positive correlation between consumer credit card rewards
and household income, as shown in Table 2. The share of credit card holders earning any
type of rewards increases monotonically with income. A similar pattern is visible for each of
the major types of rewards as well: cash back, frequent flyer miles, discounts, and others.
In most of our analysis, we split the consumer population into two income groups: house-
holds earning less than $100, 000 and households earning more than that.13 This decision
11The new charge numbers are based on the following question from the 2007 SCF: “On your last bill,roughly how much were the new charges made to these [Visa, MasterCard, Discover, or American Express]accounts?” Because merchant fees are proportional to the amount charged on credit cards, regardless ofwhether the cardholder pays his monthly balance or carries it over to the next month, total new credit cardcharges for each household is the relevant measure of credit card use.
12The share of credit card spending in household income actually decreases with household income, how-ever, because the marginal propensity to consume falls with household income.
13Table 7 generalizes our results to multiple income groups.
7

Average monthly cc Share of cc spendingAnnual income Have cc charge by adopters in consumption
Under $20, 000 42% $447 8.4%$20, 000–49, 999 67% $478 9.3%$50, 000–79, 999 87% $714 12.8%$80, 000–99, 999 92% $1, 026 15.7%$100, 000–119, 999 93% $1, 293 17.9%$120, 000–149, 999 97% $1, 642 20.9%Over $150, 000 97% $4, 696 27.6%Under $100, 000 68% $616 11.3%Over $100, 000 96% $2, 966 24.8%Whole sample 73% $1, 190 16.9%
Table 1: Households’ credit card adoption rates and new monthly charges by annual householdincome. Source: 2007 Survey of Consumer Finances.
is motivated by the need for parsimony in modeling, by the significant differences in credit
card behavior between these two broad income groups shown in Tables 1 and 2, and by
our desire to put the focus more on the transfer to higher-income households (and less on
the transfer from lower-income households). Table 1 shows that credit card spending by
high-income consumers is nearly five times higher than credit card spending by low-income
consumers, and Table 2 shows that high-income consumers are 20 percentage points more
likely to receive credit card rewards. The difference between the lowest-income (less than
$20,000 per year) and the highest-income ($150,000 per year or more) households’ credit
card spending and rewards is markedly greater.
2.3 Non-income factors affecting credit card use
Income is not the only factor that is positively correlated with credit card use. Schuh and
Stavins (2010) estimated the use of payment instruments as a function of various characteris-
tics of these instruments, employing a 2006 survey of U.S. consumers. They found that, after
controlling for income, the characteristics of convenience, cost, and timing of payment have
a statistically significant effect on credit card use. Using the more extensive 2008 SCPC,
we re-estimated the effects of payment instrument characteristics on consumer adoption and
8

Income Any Reward Cash Back Airlines Miles Discounts Other RewardsUnder $20,000 48 27 17 13 8$20,000–49,999 50 28 17 11 10$50,000–79,999 62 35 26 13 12$80,000–99,999 68 38 36 15 11$100,000–119,999 71 37 33 16 15$120,000–149,999 82 44 39 19 25Over $150,000 75 33 48 15 19Under $100, 000 57 32 23 12 10Over $100, 000 77 37 40 16 19Whole sample 61 33 27 13 12
Table 2: Percentage (%) of credit card adopters receiving credit card rewards. Source: 2007–2008Consumer Finance Monthly survey conducted by the Ohio State University.
use of credit cards, using the following specification:
CCi
TOTPAYi
= f (CHARi,DEMi, Yi,NUMi) , (1)
where CCi/TOTPAYi is consumer i’s share of the number of credit card payments in total
payments; CHARi is a vector of characteristics of credit cards relative to all other payments
adopted by consumer i, DEMi is a vector of demographic variables for consumer i, including
age, race, gender, education, and marital status; Yi is a set of income and financial variables;
NUMi is the set of dummy variables indicating the number of other payment instruments
adopted by consumer i.
Table 3 shows the distribution of credit card use, calculated as a share of credit card
payments in all payments for each consumer. The share of credit card transactions is higher
for the over $100K income group than for the under $100K income group across the whole
distribution. However, there is substantial variation within each income group. For example,
among the high-income consumers, the 10th percentile of credit card users pay for 4 percent
of their transactions with credit cards, compared with 70 percent of transactions for the 90th
percentile of users. Therefore, there is variance in credit card use within income groups that
needs to be explained.
Several relative payment-instrument characteristics have a significant effect on credit card
9

Percentile Under $100K Over $100K Whole Sample10th 0 4 125th 5 13 550th 15 30 1875th 34 55 3990th 63 70 66
Table 3: Distribution (%) of credit card use within income groups for credit card adopters. Note:Based on the 2008 Survey of Consumer Payment Choice, and weighted using the popu-lation weights from the 2008 SCPC.
use. Table 4 shows the estimated coefficients on payment-instrument characteristics from
estimating equation (1) for three different samples. While the cost of credit cards (which
includes rewards as well as interest rates and fees) is significant in all specifications and for
both income groups, other attributes of credit cards also are important determinants of credit
card use, conditional on cost. Controlling for income categories (column 1 of Table 4), ease
of use and record keeping have a strong and statistically significant effect on credit card use.
In separate regressions by household income category, record keeping and cost have much
stronger effects on higher-income consumers (column 3) than on lower-income consumers
(column 2), while ease of use was not statistically significant for the higher-income group.
The preceding results indicate that payment-instrument characteristics are valued dif-
ferently by consumers both within and between income groups. The model in Section 4
captures consumers’ nonpecuniary benefits from using credit cards relative to cash, such as
record keeping, in a utility parameter labeled as bi, specific to income group i. This param-
eter turns out to be an important factor determining the choice of cash versus credit card
for payments.
3. Transfer Accounting
This section demonstrates a simple, model-free approach to computing two implicit monetary
transfers between U.S. consumers that result when some buyers pay with credit cards and
others do not. One transfer is from cash buyers to credit card buyers; the other is from
10

(1) (2) (3)Explanatory Variables Whole Sample Under $100K Over $100KCost 0.10 *** 0.10 *** 0.13 ***Speed 0.00 −0.05 0.11Security 0.01 0.02 −0.02Control 0.01 0.01 −0.00Records 0.11 *** 0.08 ** 0.17 **Acceptance 0.06 0.06 0.08Ease 0.11 *** 0.12 ** 0.11Income categories included? Yes No No
Table 4: Three credit card use regressions. Note: Authors’ estimation using the 2008 Survey ofConsumer Payment Choice. *** significant at the 1% level, ** significant at the 5% level.
low-income buyers to high-income buyers. Our methodology decomposes national income
account data on consumption into consumer groups defined by payment choice and income
level, using micro data on consumption, credit card spending, and related variables (along
with the benchmark estimates of payment costs). Humphrey, Kaloudis, and Øwre (2004)
use an analogous methodology to estimate cash use in Norway.
3.1 The payments market
Figure 2 illustrates a simplified version of the U.S. payments market that frames the computa-
tion of aggregate transfers. There are three types of agents: buyers (consumers), merchants,
and “banks.” Buyers can have high or low incomes and pay by credit card or cash (all other
non-credit card payments). A representative merchant sells a representative good to all con-
sumers. This assumption is not strictly true for all markets, so we explore the implications
of relaxing it in Section 7. However, it is a good approximation for most transactions and
it is necessary to compute the transfers, given the lack of micro data on payment choice
at the level of individual transactions.14 Finally, “banks” represents the financial market
that provides credit card payment services. It includes banks that issue cards to consumers
14It also greatly simplifies the modeling task by avoiding the need to have search and matching of indi-vidual consumers, merchants, and goods—a level of detail for which proper data are not currently availableanyway—in addition to payment choice.
11

(“issuers”), banks that receive card payments from merchants (“acquirers”), and card com-
panies (Visa or MasterCard are examples) that facilitate interactions among banks and be-
tween banks and their customers.15 The literature on two-sided markets analyzes the details
of the “banks” and merchant markets but tends to abstract from consumer heterogeneity,
restricting analysis of transfers among consumers. Our analysis takes the opposite approach.
����
����
���� AcquirerIssuer�
6
?p = Price ($)
κ = Interchange fee (%)
µ = Merchant Fee (2%)ρ = Reward (1%)
��
��Card Companies }
=
“Banks”
Low-income card users -High-income card users
#"
! Merchant Low-income cash users
High-income cash users
#"
!�
p
(ρ < κ < µ)
ε = handling cash cost (0.5%)
Figure 2: Fees and payments in a simple market with a card network.
Payments occur as follows. Buyers purchase a good for an endogenously determined price,
p, using cash or credit card according to buyers’ preferences for the payment instruments.
The merchant incurs a cost with either payment choice. For cash, the merchant bears a cost,
denoted 0 ≤ ε < 1, associated with handling cash transactions. Thus, the merchant’s cost
of accepting a cash transaction is ε · p.16 For credit cards, the merchant pays a fee, µ, to
banks (acquirers) that is proportional to card sales. Thus, the merchant’s cost of accepting
a credit card transaction is µ · p. Card buyers receive a partial rebate of the merchant fee
from banks (issuers) in the form of card rewards, ρ, that are proportional to card sales and
15Until recently, Visa and MasterCard were owned by banks. Visa became public in early 2008, andMasterCard in 2006.
16As drawn, the cash-handling cost ε is a marginal cost. However, the actual cost of handling cash mayinclude a fixed cost as well. Footnote 22 presents estimates of the cost of handling cash where ε could beinterpreted as average cost that includes possible fixed costs because the data do not distinguish well betweenfixed and marginal costs.
12

are given to encourage use.17 Thus, card buyers receive reward income of ρ · p.
The merchant fee and reward rate are closely related to pricing decisions internal to banks.
Acquirers pay a proportional fee, κ, to issuers. When the card issuer and card acquirer are
owned by different financial institutions, κ is called an interchange fee. Because interchange
fees involve the fixing of fees by competing card issuers, they have triggered many debates and
court cases against card organizations by antitrust authorities and merchant associations.18
Typically, banks make profits by setting ρ < κ < µ, which we assume holds. Our analysis of
the transfers among consumers requires only the merchant fee and reward rate and not the
inclusion of the interchange fee.
Regardless of whether buyers choose cash or credit card, U.S. merchants tend to charge
the same price, p, despite incurring different costs from the two payment instruments. Under
the no-surcharge rule, merchants cannot charge credit card buyers a higher price than the
price they charge cash buyers to recoup the extra cost (µ−ε ≈ 1.5 percent in our calculations).
However, under certain conditions card companies do allow the merchant to offer a discount
to cash buyers, which is conceptually the same as surcharging cards.19 Nevertheless, while
some U.S. merchants have offered cash discounts from time to time, they generally do not do
so widely or consistently. One reason may be the cost of offering two prices. Another reason
may be concerns about adverse customer reactions to differential pricing and especially to
penalizing card buyers, who tend to be higher-income households and to buy more goods.
The simplified payments market in Figure 2 covers only convenience use of credit cards
and not the revolving credit feature of cards. In reality, banks also receive revenue from
consumers through interest payments on revolving debt and from credit card fees (annual,
over-the-limit, etc.), so it is possible that card rewards may be funded from sources of
17To fund rewards, banks use revenue from merchant fees and possibly other sources, such as annual feesor interest from revolving credit card debt. Funding of rewards is discussed more later.
18Some court cases in the United States and worldwide are discussed in Bradford and Hayashi (2008).19For example, Section 5.2.D.2 of Visa U.S.A. April 2008 operating regulations states that “A Merchant
may offer a discount as an inducement for a Cardholder to use a means of payment that the Merchant prefers,provided that the discount is clearly disclosed as a discount from the standard price and, non-discriminatoryas between a Cardholder who pays with a Visa Card and a cardholder who pays with a ‘comparable card’.”See also Footnote 2.
13

credit card revenue other than merchant fees.20 However, our data and analysis presented
below suggest that these alternative sources of credit card revenue are unlikely to alter
our qualitative conclusions about transfers. Furthermore, the welfare effects of credit card
borrowing and lending are extremely difficult to identify in economic theory and practice—
revolving debt may be welfare improving, even at very high interest rates—whereas the
welfare effects of transfers among consumers associated with convenience use of credit cards
are less so.
3.2 Data and assumptions
The payments market discussed in Section 3.1 generates implicit monetary transfers between
consumers, regardless of whether revolving credit is extended for card purchases. Calculation
of these transfers does not require a formal economic model, only data and arithmetic—
hence the terminology “transfer accounting.”21 However, the transfer calculations are based
on three key economic assumptions described below.
The quantitative fees and costs portrayed in Figure 2 represent “benchmark” estimates
of recent conditions in the U.S. payments market. The limited available data suggest that
a reasonable, but very rough, estimate of the per-dollar merchant effort of handling cash
is ε = 0.5 percent.22 Available data suggest that a reasonable estimate of the merchant
fee across all types of cards, weighted by card use, is µ = 2 percent.23 And available data
20Section 7.2 discusses the funding of card rewards and the relevant literature.21See Appendix A for more details about the data.22Garcia-Swartz, Hahn, and Layne-Farrar (2006) report that the marginal cost of processing a $54.24
transaction (the average check transaction) is $0.43 (or 0.8 percent) if it is a cash transaction and $1.22(or 2.25 percent) if it is paid by a credit/charge card. The study by Bergman, Guibourg, and Segendorf(2007) for Sweden found that the total private costs incurred by the retail sector from handling 235 billionSwedish Crown (SEK) worth of transactions was 3.68 billion SEK in 2002, which would put our measureof cash-handling costs at ε = 1.6 percent. For the Norwegian payment system, Gresvik and Haare (2009)estimates that private costs of handling 62.1 billion Norwegian Crown (NOK) worth of cash transactionsincurred by the retailers was 0.322 billion NOK in 2007, which would imply ε = 0.5 percent.
23Merchant fees in the United States were in the range of $40–$50 billion in 2008; see, for example, “CardFees Pit Retailers Against Banks,” New York Times, July 15, 2009. This range approximately equals 2percent of the U.S. credit card sales for that same year in the Call Report data for depository institutions.Actual merchant fees are complex and heterogeneous, varying over cards and merchants. We estimatemerchant fees across cards as follows: general purpose (Visa, MasterCard, and Discover) 2 percent; American
14
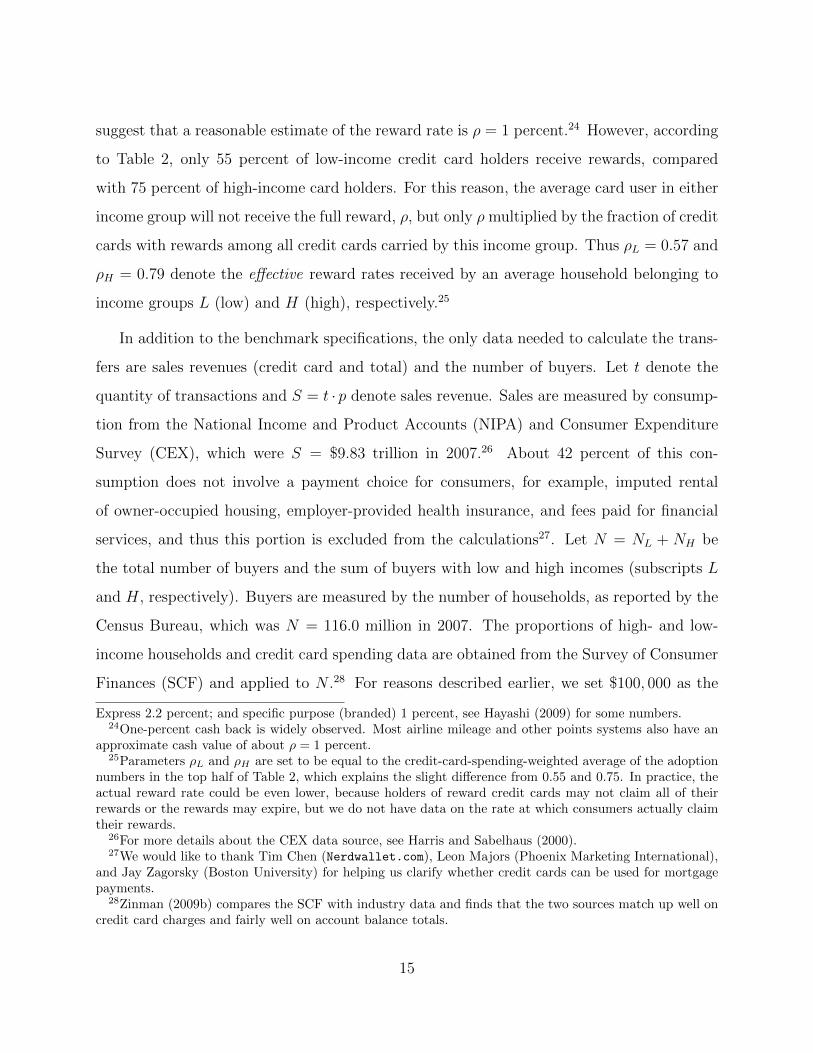
suggest that a reasonable estimate of the reward rate is ρ = 1 percent.24 However, according
to Table 2, only 55 percent of low-income credit card holders receive rewards, compared
with 75 percent of high-income card holders. For this reason, the average card user in either
income group will not receive the full reward, ρ, but only ρ multiplied by the fraction of credit
cards with rewards among all credit cards carried by this income group. Thus ρL = 0.57 and
ρH = 0.79 denote the effective reward rates received by an average household belonging to
income groups L (low) and H (high), respectively.25
In addition to the benchmark specifications, the only data needed to calculate the trans-
fers are sales revenues (credit card and total) and the number of buyers. Let t denote the
quantity of transactions and S = t · p denote sales revenue. Sales are measured by consump-
tion from the National Income and Product Accounts (NIPA) and Consumer Expenditure
Survey (CEX), which were S = $9.83 trillion in 2007.26 About 42 percent of this con-
sumption does not involve a payment choice for consumers, for example, imputed rental
of owner-occupied housing, employer-provided health insurance, and fees paid for financial
services, and thus this portion is excluded from the calculations27. Let N = NL + NH be
the total number of buyers and the sum of buyers with low and high incomes (subscripts L
and H, respectively). Buyers are measured by the number of households, as reported by the
Census Bureau, which was N = 116.0 million in 2007. The proportions of high- and low-
income households and credit card spending data are obtained from the Survey of Consumer
Finances (SCF) and applied to N .28 For reasons described earlier, we set $100, 000 as the
Express 2.2 percent; and specific purpose (branded) 1 percent, see Hayashi (2009) for some numbers.24One-percent cash back is widely observed. Most airline mileage and other points systems also have an
approximate cash value of about ρ = 1 percent.25Parameters ρL and ρH are set to be equal to the credit-card-spending-weighted average of the adoption
numbers in the top half of Table 2, which explains the slight difference from 0.55 and 0.75. In practice, theactual reward rate could be even lower, because holders of reward credit cards may not claim all of theirrewards or the rewards may expire, but we do not have data on the rate at which consumers actually claimtheir rewards.
26For more details about the CEX data source, see Harris and Sabelhaus (2000).27We would like to thank Tim Chen (Nerdwallet.com), Leon Majors (Phoenix Marketing International),
and Jay Zagorsky (Boston University) for helping us clarify whether credit cards can be used for mortgagepayments.
28Zinman (2009b) compares the SCF with industry data and finds that the two sources match up well oncredit card charges and fairly well on account balance totals.
15
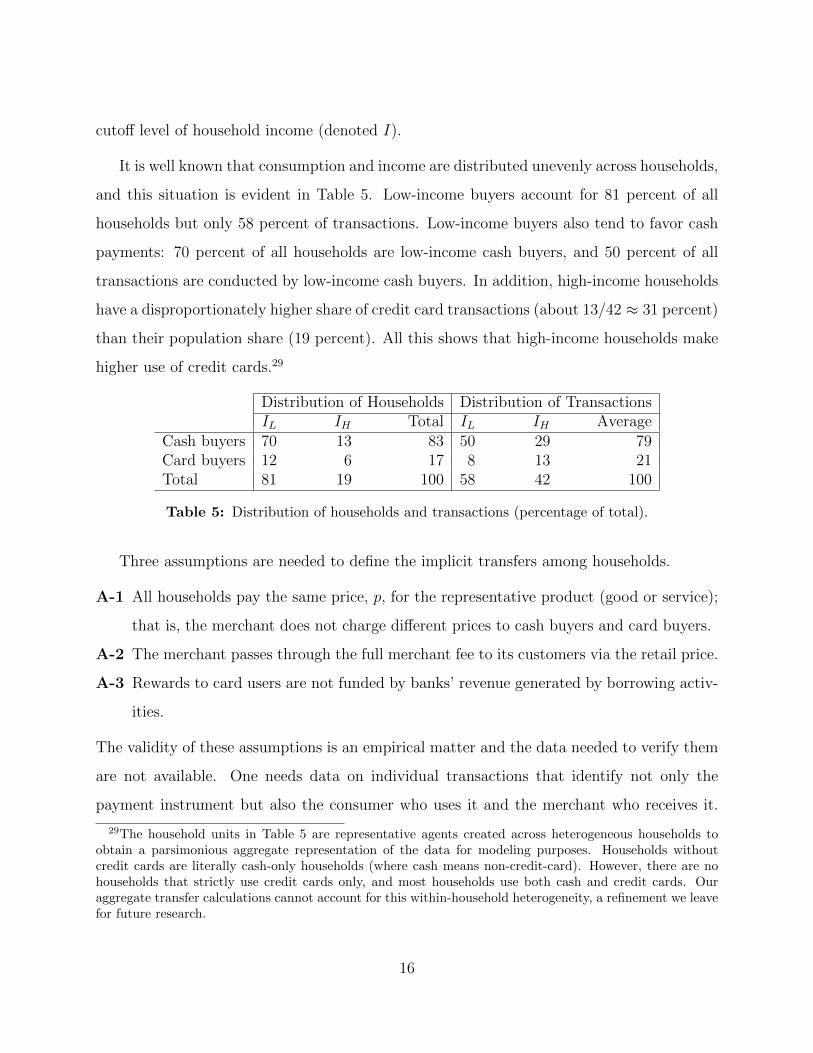
cutoff level of household income (denoted I).
It is well known that consumption and income are distributed unevenly across households,
and this situation is evident in Table 5. Low-income buyers account for 81 percent of all
households but only 58 percent of transactions. Low-income buyers also tend to favor cash
payments: 70 percent of all households are low-income cash buyers, and 50 percent of all
transactions are conducted by low-income cash buyers. In addition, high-income households
have a disproportionately higher share of credit card transactions (about 13/42 ≈ 31 percent)
than their population share (19 percent). All this shows that high-income households make
higher use of credit cards.29
Distribution of Households Distribution of TransactionsIL IH Total IL IH Average
Cash buyers 70 13 83 50 29 79Card buyers 12 6 17 8 13 21Total 81 19 100 58 42 100
Table 5: Distribution of households and transactions (percentage of total).
Three assumptions are needed to define the implicit transfers among households.
A-1 All households pay the same price, p, for the representative product (good or service);
that is, the merchant does not charge different prices to cash buyers and card buyers.
A-2 The merchant passes through the full merchant fee to its customers via the retail price.
A-3 Rewards to card users are not funded by banks’ revenue generated by borrowing activ-
ities.
The validity of these assumptions is an empirical matter and the data needed to verify them
are not available. One needs data on individual transactions that identify not only the
payment instrument but also the consumer who uses it and the merchant who receives it.
29The household units in Table 5 are representative agents created across heterogeneous households toobtain a parsimonious aggregate representation of the data for modeling purposes. Households withoutcredit cards are literally cash-only households (where cash means non-credit-card). However, there are nohouseholds that strictly use credit cards only, and most households use both cash and credit cards. Ouraggregate transfer calculations cannot account for this within-household heterogeneity, a refinement we leavefor future research.
16
Such matched consumer-merchant data are extremely rare, and may not even be sufficient.
If consumers of different income groups buy different products within merchants, and if
merchants price those products not only according to their price elasticities of demand but
also by their probabilities of being paid for by cash versus credit, then consumer-merchant
data are needed at the level of detailed individual products (goods and services) as well.
Future research based on such rich and finely graded data would provide valuable refinements
of our calculations. However, Section 7 considers some alternative calculations that explore
the effects of relaxing these assumptions on the transfers.
3.3 Transfer definitions
Our goal is to measure the actual transfers in the U.S. payments market and their effects on
consumer welfare. Thus, we define each transfer as the difference between the actual money
paid by a household toward merchant payment costs, on one hand, and the reference value
(amount of money) the household would pay if it faced the full cost of its payment choice in
the current payment environment, on the other. The actual money paid is the household’s
share of the merchant’s total cost of payments (µSd + εSh). The reference value of the
payment depends on the marginal cost of the good for the household. As shown in Section 4,
the marginal cost of producing the good (denoted σ) is the same for all households but the
marginal cost of payment varies across households according to the household’s payment
choice. Households paying by cash impose a marginal cost of ε · p for their transactions, and
households paying by credit card impose a marginal cost of µ · p for their transactions.
With this transfer definition in mind, consider first the transfer between cash and credit
card users. Let X denote the transfer made (or subsidy received, if the transfer is negative).
Then the transfer made by cash users (superscript h) is
Xh def=
{Sh
S
(µSd + εSh
)}− εSh and xh
def=
Xh
NhL +Nh
H
, (2)
where xh denotes the transfer per household, our preferred metric. The term of Xh in braces
is what cash users actually pay toward total merchant payment costs: the cash share of total
17
spending, (Sh/S) = 0.79, times the total merchant cost of transactions, (µSd + εSh) = $47
billion. Cash users indirectly pay a portion of the cost of credit card payments, (µSd) = $24
billion, because cash and credit card buyers pay the same equilibrium price, p, which will
be calibrated later using the model in Section 4. The last term of Xh (outside the braces) is
the total cost of cash transactions: that is, cash-handling costs, (εSh) = $22 billion.
Similar to (2), the transfer (or subsidy received, if the transfer is negative) made by credit
card users (superscript d) is
Xd def=
{Sd
S
(µSd + εSh
)− (ρLS
dL + ρHS
dH)
}− µSd and xd
def=
Xd
NdL +Nd
H
. (3)
The term of Xd in braces is what credit card users actually pay toward total merchant
payment costs net of the rewards they receive. The first term inside the braces is their
contribution to merchants’ transaction costs: the card share of total spending, (Sd/S) = .21,
times the total merchant cost of transactions. The second term inside the braces adjusts for
credit card rewards, (ρLSdL + ρHS
dH) = $8.5 billion. The last term of Xd (outside the braces)
is the total merchant cost of credit card transactions, which equals banks’ fee revenue from
all credit card transactions.
The credit card transfer, equation (3), contains two components. One is the point-of-sale
(POS) transfer, which occurs at the merchant:
X̃d def=
{Sd
S
(µSd + εSh
)}− µSd and x̃d
def=
X̃d
NdL +Nd
H
. (4)
The second component is an adjustment for rewards, −(ρLSdL+ρHS
dH), which are subtracted
from the POS transfer because rewards are rebated to credit card users by banks and reduce
the contribution of card users to total merchant payment costs. The rewards adjustment
to the POS transfer captures the portion of the overall transfer that occurs because credit
card users do not pay the full value of the rewards they receive. Instead, cash users pay for
part of the rewards, and this rewards-related transfer varies across income groups. Thus,
the POS transfer, which excludes rewards, understates the actual transfer occurring as a
18

result of credit card payments.30 Nevertheless, the POS transfer provides an informative,
lower-bound estimate of the transfer, so we report both estimates. Furthermore, the POS
transfer would be the appropriate measure if credit card users paid the full value of their
own rewards.31
Section 2.2 established a positive correlation between card use and income, which moti-
vates calculation of the transfer between low-income and high-income households. Similar
to the transfer definitions given by (2) and (3), the transfers paid by each household income
group are
XLdef=
{SLS
(µSd + εSh
)− ρLSdL
}− (µSdL + εShL), (5)
XHdef=
{SHS
(µSd + εSh
)− ρHSdH
}− (µSdH + εShH). (6)
The first terms in braces are what households actually pay toward total merchant payment
costs: the amounts of merchant payment costs borne by income groups L and H, respectively,
((SL/S) = .58 and (SH/S) = .42), less their credit card rewards, (ρLSdL) = $2.7 billion and
(ρHSdH) = $5.8 billion, respectively. The second terms are the total merchant costs of each
household’s own payment choice: (µSdL + εShL) = $24 billion and (µSdH + εShH) = $23 billion.
Note that the total (aggregate) transfer among households by income level is the same as
between cash-using and card-using households:
X = XL +XH = −(ρLSdL + ρHS
dH). (7)
Similar to equation (4), the POS transfers between low-income and high-income house-
30See Appendix B for more details on this point. We especially thank Fumiko Hayashi, Bob Triest, andPaul Willen for helping us to clarify our thinking about the transfer definitions, especially the central andcrucial definition in equation (3).
31A simple way to see this point is think of an alternative payment market in which merchants surchargecredit card users for their rewards at the POS and then rebate the full rewards instantly to households usingcredit cards. In this case, merchants would pay a fee to banks net of rewards, (µ − ρ), rather than payingthe full merchant fee and having banks pay rewards to households later.
19

holds are
X̃Ldef=
{SLS
(µSd + εSh
)}− (µSdL + εShL) (8)
X̃Hdef=
{SHS
(µSd + εSh
)}− (µSdH + εShH) (9)
and they omit the adjustment for rewards, which varies by income group. At the household
level, the relative magnitudes of the income group transfers are determined primarily by two
facts that favor high-income households: SdH > SdL and ρH > ρL.
3.4 Transfer estimates
Applying the benchmark specification and data described in Section 3.2 to the transfer
equations defined in Section 3.3 yields the central results of this paper. Table 6 displays the
transfer estimates in billions of 2007 dollars and on a per household basis. These two types
of estimates are qualitatively equivalent but we focus on the latter. Recall that positive
(negative) numbers indicate that households using a payment instrument paid a transfer
(received a subsidy).
Total ($ Billions) Per household, total ($)IL IH Total IL IH Average
Cash buyers 9.0 5.3 14.3 111 352 149Card buyers −8.3 −14.5 −22.8 −613 −2, 188 −1, 133Total/Average 0.8 −9.3 −8.5 8 −430 −73
POS only ($ Billions) Per household, POS ($)Cash buyers 9.0 5.3 14.3 111 352 149Card buyers −5.6 −8.7 −14.3 −414 −1, 311 −710Total/Average 3.4 −3.4 0 37 −160 0
Table 6: Transfers in the payment market by household income and payment instrument.
To our knowledge, the results in Table 6 are the first quantitative estimates for the
aggregate economy of theoretical measures of transfers between buyers stemming from the
choice of payment instrument. Two main conclusions can be drawn from the results.
20

Result 1. Cash payers subsidize credit card payers. The average cash-paying household
transfers $149 (xh = 149) annually to card users, and the average credit-card-paying house-
hold receives a subsidy of $1, 133 (xd = −1, 133) annually from cash users.
The annual transfer gap (difference) between the average cash and card users is $1, 282
(xh − xd = $1, 282), which represents 1.8 percent of median income across all households in
2007.
Result 2. Low-income households subsidize high-income households. The average low-income
household transfers $8 (xL = 8) annually to high-income households, and the average high-
income household receives a subsidy of $430 (xH = −430) annually from cash users.
The annual transfer gap (difference) between the average low-income household and the
average high-income household is $438 (xL − xH = $438), which represents 0.6 percent
of median income across low-income households in 2007. By far, the bulk of the transfer
gap is enjoyed by high-income credit card buyers, who receive a $2, 188 subsidy every year.
Although low-income credit card buyers also receive a subsidy ($613) and high-income cash
buyers pay a larger transfer ($352) than low-income cash buyers, the greater use of credit
cards and receipt of rewards gives high-income households a non-trivial subsidy each year.
These transfer estimates, based on only two income categories (defined by a cutoff of
$100, 000), significantly understate the magnitude of the transfer between the lowest- and
highest-income households. Dividing households into seven income categories instead, as
in Table 7, reveals that the transfer gap between the lowest-income households (less than
$20, 000) and the highest-income households (≥ $150, 000) increases to $771 per household
each year. The average lowest-income household pays $21 each year, and the average highest-
income household receives $750 each year, from the convenience use of credit cards. In
between, the transfer gap is nonlinear across groups—relatively flat until household income
rises above $100, 000 annually, then sharply increasing in the highest categories. Thus, each of
a large number of lower-income households pays a relatively small dollar amount of transfer,
21

while each household of a small number of higher-income groups receives a relatively large
dollar amount of subsidy.32
Transfers paidIncome range POS TotalUnder $20, 000 $32 $21$20, 000–49, 999 $45 $26$50, 000–79, 999 $35 −$11$80, 000–99, 999 $16 −$61$100, 000–119, 999 −$11 −$113$120, 000–149, 999 −$50 −$207Over $150, 000 −$313 −$750
Table 7: Transfers in the payment market by disaggregated income categories.
Section 4 develops a model to quantify the potential loss to consumer welfare result-
ing from these transfers. Before doing so, let us put the payment transfer estimates into
perspective by viewing them in the context of another public policy issue. The literature
on inflation finds that the potential welfare gain of reducing steady-state inflation from 10
percent to 0 percent ranges between 0.2 and 1.0 percent of the GDP (see Ireland (2009)
and Lucas (2000)). These estimates translate into an annual per household cost of $243 to
$1, 213 (using 2007 GDP data). Thus, the magnitude of the payments transfers would seem
to merit attention from policy makers similar to that devoted to controlling inflation.
3.5 Sources of banks’ income
This subsection decomposes banks’ gross and net income from merchant fees, µSd, into
sources of revenue from each of the four buyer groups. We multiply gross income (revenue)
by the share of total spending of each group of buyers: ShL/S, SdL/S, ShH/S, and SdH/S. The
results appear in the first panel of Table 8. We then compute rewards paid to credit card
32Table 7 implies that the transfers computed with only two income groups may be sensitive to the cutoffincome level. We chose a cutoff of $100, 000 because the transfer paid increases nonlinearly with income, soa higher cutoff level is more representative of the transfer paid by the highest income groups. If the cutoffhousehold income is $50, 000, then the low-income household pays $37 instead of $8, whereas the high-incomehousehold receives $200 instead of $430.
22

users in the second panel of the table. The third panel reports the net income of banks from
merchant fees, that is, gross income (first panel) minus rewards (second panel).
Revenue from Merchant FeesTotal ($ billions) Per household ($)IL IH Total IL IH Total
Cash buyers 12.0 7.0 19.9 149 469 199Card buyers 2.0 3.1 5.2 149 473 256Total 14.0 10.1 24.2 149 470 209
Rewards to Consumers (expenditure)Cash payers 0 0 0 0 0 0Card payers 2.7 5.8 8.5 199 877 423Total 2.7 5.8 8.5 28 270 73
Net ($ billions) Net Per household ($)Cash payers 12.0 7.0 19.0 149 469 199Card payers −0.7 −2.7 −3.3 −49 −404 −166Total 11.4 4.3 15.7 120 200 135
Table 8: Banks’ gross income sources and expenditure.
From Table 8 we can derive the following results about sources of banks’ income from
merchant fees:
Result 3. Low-income households bear a disproportionately large burden of merchants’ cost
of credit cards because they tend to use cash more often than high-income households. Cash
users pay 82 percent (≈ 19.9/24.2) of banks’ gross income from merchant fees, and low-
income cash users pay 50 percent (≈ 12.0/24.2) of banks’ gross income.
Result 4. Cash payers receive no rewards (naturally) and high-income households receive
the lion’s share of credit card rewards. The average high-income card payers receive $877
in rewards annually, while the average low-income card payers receive only $199, less than
one-fourth as much.
Result 5. Banks earn negative net income from credit card users, as rewards paid exceed
revenues received from these households (net revenue of −$3.3 billion), but banks more than
23
offset this loss with net income from cash-paying households ($19.0 billion). Almost three-
quarters (≈ 11.4/15.7) of banks’ net income is generated from low-income households, de-
spite the fact that the high-income group uses credit cards more than the low-income group
(13/21 ≈ 60 percent in Table 5).
Overall, the picture painted by these data and results is one in which low-income cash payers
account for the bulk of the costs (merchant fee revenue) imposed by the payment choices
(credit card purchases) of mostly high-income households.
4. A Model of Cash and Card Users
To investigate the welfare consequences associated with the redistribution of income among
households, we construct an analytical model and then calibrate it. Endogenously deter-
mined variables will be denoted by lower case letters. Exogenous parameters will be denoted
by roman capital and Greek letters.
4.1 Buyers
There are NL low-income buyers and NH high-income buyers. Income levels are denoted by
IL and IH , respectively. Income group i buyers (i = L,H) are uniformly indexed by bi on
the unit interval [βi − 1, βi], (where 0 ≤ βi ≤ 1) according to the benefit they derive from
paying with a card relative to paying with cash, as illustrated in Figure 3 and described
in Section 2.3. Thus, bi measures the nonpecuniary benefit from paying with a card by an
income group i buyer who is indexed by bi. bi = βi denotes buyers of income group i who
benefit the most from using a card. bi = βi − 1 are income group i buyers who most prefer
paying with cash over card.
Buyers have an endogenous choice of paying with cash or paying with a card. Banks
(card issuers) reward card users by paying ρ · p as “cash back,” where 0 < ρ < 1 is the
fraction of the price p that is paid back to the buyer. Therefore, the effective price paid by
buyers belonging to income group i = H,L is
24

pb =
{p(1− ρi) paying with a card
p paying cash.(10)
Thus, assuming that buyers spend their entire budget, low-income buyers perform IL/pb
transactions, whereas high-income buyers perform IH/pb transactions. Therefore, we define
the utility function of an income group i buyer who is indexed by bi by
Ubi =
[(1 + bi)
Iip(1− ρi)
]αpaying with a card(
Iip
)αpaying cash,
for 0 < α ≤ 1. (11)
Equation (11) implies that a buyer’s utility is increasing with the number of transactions
(income divided by price). In addition, if the buyer pays with a card, the buyer gains an
additional per-transaction benefit bi (loss for buyers indexed by bi < 0).
0
-bL
0
-bH
βH︷ ︸︸ ︷βH − 1
βL︷ ︸︸ ︷βL − 1
NL
NHCardCash
Card -�
−ρL −ρH
Figure 3: Distribution of buyers according to increased benefits from paying with cards. Note:Based on results presented later, the figure assumes NL > NH (most buyers are lowincome) and βL < βH (more high-income buyers prefer paying with a card relative tolow-income buyers).
For each income group i = L,H, buyers who are indifferent between paying cash and
paying with a card are found by solving[(1 + b̂i)
Iip(1− ρi)
]α=
(Iip
)αhence b̂i = −ρi. (12)
Thus, buyers indexed by bi > b̂i pay with cards and buyers bi < b̂i pay cash; see Figure 3. In
the special case where ρi = 0, buyers indexed by b̂i = 0 separate those who pay with cards,
bi > 0, from those who pay cash, bi < 0. This means that card rewards induce some buyers
who otherwise prefer to pay cash to use their cards in order to collect rewards.
25

The remainder of this section computes the number of card and cash payers as well as
the number of transactions made with each payment instrument. Recall that superscripts
“h” (for cash) denote cash payers, whereas superscripts “d” (for card) denote card payers.
In view of the “indifferent” buyers described in (12) and Figure 3, the number of buyers
from group i who pay cash is
nhi = [−ρi − (βi − 1)]Ni, hence
nh = nhL + nhH = NL[(1− βL)− ρL] +NH [(1− βH)− ρH ], (13)
which is the total number of buyers (both income groups combined) who pay cash.
Next, the number of buyers from income group i who pay with cards is
ndi = (βi + ρi)Ni, hence nd = ndL + ndH = NL(βL + ρL) +NH(βH + ρH), (14)
which is the total number of buyers (both income groups combined) who pay with cards.
The total number of cash and card transactions made by each income group i = L,H,
denoted by , thi , and tdi in the model, multiplied by the price p, equals spending. Thus,
Shi = pthi = nhi Ii and Sdi = ptdi = ndiIi
1− ρi. (15)
4.2 Merchants
Merchants supply one “good,” which could be either a product or a service. Free entry
results in normal (zero) profits. Similar to Wang (2010), we model a “mature” card market
in the sense that we assume that all merchants accept payment cards and cash. Thus, we
assume for simplicity that consumers do not have to search for a merchant who accepts their
preferred payment instrument. Let σ denote the unit production (marginal) cost borne by
merchants, and recall that 0 ≤ ε < 1 denotes the effort (disutility) of the merchant from a
cash transaction relative to a card transaction. Thus, the merchant’s disutility from handling
cash is ε · p. Under free entry, merchant profits are reduced to zero, so
0 = th[p(1− ε)− σ] + td[p(1− µ)− σ] hence p =
[1
th
th+td(1− ε) + td
(th+td)(1− µ)
]σ, (16)
26

which is the equilibrium price in a competitive merchant industry. In the above, th[p(1 −
ε)− σ] is the profit from th cash transactions, and td[p(1− µ)− σ] is the profit from td card
transactions, where p(1− µ) is the net price a merchant receives after paying the fee to the
card acquirer.
4.3 Calibrations
We first use the model to calibrate the number of cash and card users within each group,
nhL, ndL, nhH , and ndH . These can be solved from (15) as functions of IL and IH . Because
the numbers of low- and high-income households are known, solving nhL + ndL = NL and
nhH + ndH = NH yields the calibrated values of IL and IH , which should be interpreted as
consumption expenditures because savings are not modeled.
Next, in view of Figure 3, the key parameters to be calibrated are the maximal benefits
from using cards relative to cash, βL and βH . These two parameters are solved directly from
equations (13) and (14), assuming the card reward rates reported in Section 3.1. Transactions
data from the Survey of Consumer Payment Choice (SCPC) show that credit cards accounted
for 21.3 percent of consumer payments in 2008. Table 9 summarizes the model’s parameter
values obtained under the above computations.
4.4 Equilibrium price and markup
Substituting the calibrated parameters from Table 9 into (13)–(16), the equilibrium price
(16) becomes
p|µ=2%ρ=1%
= $27.56, σ = 27.34, and L(p, σ;µ, ρ) =
(p− σp
)100 = 0.82 percent, (17)
which is the Lerner’s index commonly used for measuring markup over marginal cost. Thus,
our calibrations imply the following result:
Result 6. Convenience use of credit cards induces a retail price markup of 0.82 percent over
marginal cost (or 22/c over $27.34).
27

Parameter Notation Value ProcedureCash effort ε 0.5% AssumedMerchant fee µ 2.0% AssumedCard reward ρ 1.0% AssumedRewards to low-income (cc-spend. weighted avg.) ρL 0.57% OSU 2007Rewards to high-income (cc-spend. weighted avg.) ρH 0.79% OSU 2007Number of credit card transactions td 43.9bn SCPC 2008Total Spending Low-income NL · p · tL $3.33tr NIPA 2007Total Spending High-income NH · p · tH $2.35tr NIPA 2007Total Credit Card Spending Low-income NL · p · tdL $0.47tr SCF 2007Total Credit Card Spending High-income NH · p · tdH $0.74tr SCF 2007Low income level (excluding saving) IL $34, 879 CalibrationHigh income level (excluding saving) IH $110, 153 CalibrationMaximum card benefit (low income) βL 0.137 CalibrationMaximum card benefit (high income) βH 0.300 CalibrationPrice p $27.56 CalibrationMarginal cost σ $27.34 Calibration
Table 9: Computed values of model parameters and variables.
To assess the sensitivity of this result, Figure 4 plots the retail price markup as a function
of µ and ρ. The graph excludes all points in which banks make negative profit, which is
depicted by the shaded triangle on the floor of the three-dimensional graph. Each relationship
between the markup and the two parameters is each approximately linear, but the markup
is more sensitive (steeper slope) to the merchant fee than to the reward rate. The reason
for this result follows from equation (16), which shows that the merchant fee affects price
directly because it is a cost for the merchant, whereas the reward rate has only an indirect
effect by making credit cards more attractive, thereby increasing the number of card users,
see equation (14).
The elasticity of the markup with respect to the merchant fee (evaluated at µ = 2 percent,
ρ = 1 percent, and ε = 0.5 percent) is 0.52. In other words, eliminating the merchant fee
(a change of −100 percent) would about halve the markup (from 0.82 percent to around
0.40 percent). These numbers are illustrated in Figure 4 by the point corresponding to no
28

Figure 4: Consumer price markup as a function of the merchant fee and the reward rate.Note: The color gradations facilitate distinguishing among levels (dark red, the highest,through dark blue, the lowest).
merchant fee and no rewards,33 in which case the markup would be 0.40 percent to cover
the costs of cash-handling (ε = 0.5 percent) imposed by the 79 percent of the population
who pay cash. On the other hand, rewards have a much smaller effect on the markup; the
corresponding elasticity of the markup (measured at the same point) is only 0.014, meaning
that abolishing rewards (−100 percent change) would yield only a 1.4 percent reduction in
the markup to 0.79 percent.
4.5 Banks’ income from consumer credit cards
Banks’ net income from income group i buyers is given by p · tdi (µ− ρi), i = L,H. Like the
transfers analyzed in previous sections, banks’ net income is nonlinear with respect to the
merchant fee and reward rate. Banks’ income from consumer credit card payments, net of
rewards, was $15.7 billion in 2007 (see Table 8). Thus, banks keep 65 percent of the revenues
from merchant fees, while consumers receive 35 percent in rewards.
33Since the markup responds very little to a change in the reward rate, the vast majority of the reductionin the markup comes directly from the change in the merchant fee.
29

Figure 5 displays banks’ net income from credit card spending as a function of the
merchant fee, µ, and the reward, ρ. One interesting feature of the net income function
Figure 5: Banks’ net income as a function of the merchant fee and the reward rate.
evident in the graph is that the iso-profit lines are nearly linear with respect to µ and ρ.
Thus, banks can keep the same net income using different combinations of merchant fee
and reward rates, while keeping (µ − ρ) approximately constant. This result is shown in
Figure 6. The dashed line shows the combinations of parameters for which bank profits are
0 1 2 3 4 50
1
2
3
4
5
Merchant fee (%)
Rew
ard
rate
(%
)
Iso−profit line for Π=15.7bnIso−profit line for Π=0
µ = 2% ρ = 1%
µ = 1.36% ρ = 0%
Figure 6: Banks’ iso-profit lines as functions of the merchant fee and the reward rate
zero—combinations of reward rates and merchant fees to the left of this line would result
30

in losses to the banks. Since the rates at which households actually receive rewards (ρi)
are both less than one, the slope of the iso-profit curves is greater than one, meaning that
banks could offer a higher reward rate than the merchant fee, since they earn merchant
fees on every credit card payment while they have to give rewards for only a fraction of
these transactions. The solid line, which runs through the benchmark point, shows the
combinations of parameters for which bank profits are constant at $15.7 billion. Reducing
the merchant fee and reward rate to the point (µ = 1.36 percent, ρ = 0 percent) would
not alter bank profits, but would result in a lower retail price markup, as explained in the
previous subsection.
5. Consumer Welfare Calibrations
The analytical framework developed in this paper enables us to calibrate the consequences of
merchant fees and card rewards on consumer welfare stemming from the implicit monetary
transfers between the two income groups.34 In view of the buyers’ utility function (11) and
Figure 3, aggregate consumer welfare of income group i buyers is given by
cwi(ρi, µ) = Ni
(Iip
)α[−ρi − (βi − 1)] +
[Ii
p(1− ρi)
]α βi∫−ρi
(1 + bi)dbi
, i = L,H, (18)
where the equilibrium price p is given in (16). The above expression consists of the sum
of utilities gained by cash users and card users (whose utilities must be integrated over bi
because buyers derive different benefits from card use). Therefore, total buyer welfare as a
function of the reward rate, ρ, and merchant fee, µ, is given by cw(ρL, ρH , µ) = cwL(ρL, µ) +
cwH(ρH , µ), and is plotted in Figure 7.35
34This partial equilibrium model does not take into consideration how changes in banks’ profits affectconsumption demand, because we do not have micro data on bank ownership (stocks). For this reason, wedo not extend this analysis to include social welfare. However, if household ownership of banks is increasing inincome too, then taking bank profits into consideration would likely magnify our central results. Section 7.3and Appendix B discuss the implications of income changes due to redistribution of banks’ profits.
35A more general formulation of aggregate consumer welfare could take the form of cw(cwL, cwH) =(cwL)γ(cwH)1−γ . For our limited calibration purposes, the additive function is sufficient.
31

Figure 7: Consumer welfare as a function of the merchant fee and the reward rate (assumingα = 0.5)
Consumer welfare increases monotonically with the reward rate, keeping µ constant.
The reason for this result is that rewards are pure windfalls received by the households
from the banks in this partial equilibrium setup. On the other hand, consumer welfare
falls very fast with an increase in the merchant fee. More precisely, the elasticity of the
welfare function with respect to the merchant fee evaluated at the benchmark (point C
on the graph, where µ = 2 percent, ρ = 1 percent) is −0.0021, meaning that eliminating
the merchant fee (while leaving rewards unchanged) would increase aggregate consumer
welfare by −0.0021(−100 percent) = 0.21 percent. However, this change is infeasible without
reducing ρ as well. The elasticity with respect to the reward rate at point C is 0.0006. Hence,
eliminating rewards, while leaving the merchant fee unchanged would lead to a 0.06 percent
decline in aggregate consumer welfare.
Using these elasticities, we can infer the welfare implications of certain changes in the pay-
ment fee structure. If, for example, the merchant fee is cut in half to 1 percent, the economy
would move to point B (µ = 1 percent, ρ = 1 percent). Based on the aforementioned elastic-
ities, this move would entail a 0.105 percent (= −0.0021(−50 percent)) increase in consumer
welfare. However, Figure 7 reveals that this is not the maximum attainable level of welfare.
32

A move from point B to point A (µ = 0 percent, ρ = 0 percent) would further increase con-
sumer welfare, although this move would raise welfare by a smaller amount than the move
from point C to B. The elasticities calculated above confirm this. The welfare improvement
would amount to only a further 0.045 percent, which is the difference between the welfare
gain from another 1-percent reduction in the merchant fee and the welfare loss from the
elimination of rewards (0.0006(−100 percent) = −0.06 percent).36 So, eliminating the mer-
chant fee, and hence rewards, would result about in a 0.105 percent + 0.045 percent = 0.15
percent increase in consumer welfare compared with the benchmark starting point.
The parameter α affects the shape of the utility function and hence the optimal transfer
levels. As α declines, the transfer between household income groups becomes less desirable
because the marginal utility loss from the low-income transfer becomes larger, while the
marginal utility gain from the high-income subsidy gets smaller. When applied to aggregate
data, as we do here, the parameter α can be interpreted equivalently as a measure of the
economy’s aversion to income inequality (lower α means greater inequality aversion).
0.5 0.55 0.6 0.65 0.7 0.75 0.8 0.85 0.9 0.95 1−0.5
0
0.5
1
1.5
2
2.5
α
Mer
chan
t fee
, rew
ard
rate
(%
)
Optimal µOptimal ρ
Figure 8: Consumer welfare-maximizing merchant fee and reward rate as functions of α (assumingzero bank profits)
Figure 8 plots the welfare-maximizing values of the merchant fee and reward rate for
different values of α and portrays the following result:
36This computation is slightly imprecise because we assume that the elasticity at point C is the same asat point B. The exact calculation is given in Table 11 below.
33

Result 7. The merchant fee and card reward that maximize total consumer welfare decline
with an increase in the degree of concavity of buyers’ utility function (11) with respect to the
number of transactions (a decrease in α).
Result 7 highlights the distortion in the income distributions caused by the merchant fee and
card use programs. When buyers’ utility becomes more concave (α decreases), any transfer
from low- to high-income buyers has a greater impact on low-income buyers. For low values
of α, eliminating merchant fees and card rewards is optimal. In the opposite-extreme case of
linear utility, the loss to low-income buyers is smaller than the gain to high-income buyers,
so positive merchant fees and rewards become optimal.
However, even for high levels of α, such as linear utility (α = 1), the move from point C
to point A in Figure 7 would still be welfare improving. In fact, with a linear utility function,
welfare would increase by 0.26 percent (relative to the case in which α = 0.5). Whereas the
consumer optimum in this case would be at µ = 2.66 percent and ρ = 3.79 percent, a move
to µ = 0 percent and ρ = 0 percent would still raise welfare, because such a move eliminates
banks’ net income, so all households would be paying lower prices.37
Finally, Figure 9 illustrates the combinations of merchant fee and card rewards such that
it is possible to reduce the merchant fee from µ = 2 percent to µ = 1.36 percent, and card
reward from ρ = 1 percent to ρ = 0, while keeping banks’ net income constant and also
improving total consumer welfare. The consumer welfare maximum is at µ = 1.36 percent
and ρ = 0 percent, the same point as depicted in the banks iso-profit function in Figure 6.
6. Policy Implications
Our model and analysis suggest that aggregate consumer welfare likely can be increased
by reducing transfers between consumers, especially between low-income and high-income
37The reason why this improvement is bigger than the one in our benchmark model follows from thedifferent shapes of the utility functions. In particular, a higher α results in higher marginal utilities, so thewelfare effects of zero banks’ net income are magnified.
34

1 2 3 4 5
109.6784
109.6785
109.6786
Merchant fee (%)
Con
sum
er W
elfa
re (
log
scal
e)
µ = 2% ρ = 1%
µ = 1.36% ρ = 0%
Figure 9: Welfare-improving fee and reward reductions along banks’ iso-profit line
consumers. While it is natural to consider public policy initiatives in this endeavor, our
research and discussions suggest preemptive actions that private sector agents (households,
merchants, and banks) could take that would reduce the transfers. However, if private
agents are not willing or able to take these actions to reduce the transfers, then public policy
makers may wish to enact policies that would do so. Given the limitations of our model and
analysis, we cannot provide precise policy recommendations that would necessarily optimize
social welfare. Nevertheless, our research suggests some general principles and implications
pertaining to consumer welfare that may be useful for policy deliberations:
• Cost-based pricing—One condition supporting the transfers is uniform pricing across
payment instruments. Policies that would allow and encourage merchants to charge
differential prices according to the costs imposed by payment instruments could help
to reduce the transfers by reducing payment cross subsidies. Eliminating the NSR
would seem to be an obvious option, but it may not be a sufficient incentive to induce
differential pricing (for example, see Bolt and van Renselaar (2009)).
• Full information—Another condition supporting the transfers is the lack of full infor-
mation about about merchant fees and other aspects of payment costs that have an
impact on retail prices and consumer welfare. Policies that would require merchants,
banks, or credit card companies to fully disclose fees, costs, and price markups to
35

consumers could help to reduce transfers by giving consumers the incentive to make
optimal payment choices.
• Redistribution—The transfers can be reduced by compensating low-income households,
using tax policies to redistribute money from high-income households according to
credit card use and receipt of rewards. Direct methods may be complicated and costly,
but tax deductions for reward contributions may be feasible.
• Competition—If there is inadequate competition in the credit card market, then gov-
ernment efforts to promote alternative payment instruments could help to reduce the
transfers. Expanding access to low-cost existing networks, such as the Automatic
Clearing House (ACH), is one possibility.
• Regulation of fees and rewards—The transfers likely can be reduced by regulating the
merchant fee, but two important caveats apply. First, economists would caution as
usual that regulators may have difficulty determining the optimal fee, so regulation
of the merchant fee could actually reduce consumer welfare if the wrong level of the
fee were selected. Second, and unique to our analysis, regulators should consider the
merchant fee and reward rate simultaneously.
Of course, these policy implications and ideas would require more research and formulation
before they could be considered and adopted.
Finally, these policies to reduce transfers are closely related to recent policies enacted to
regulate payment card interchange fees worldwide. Policy makers in Australia and Spain, as
well as the European Commission, have already taken actions to limit the interchange fees
associated with credit cards. Actions taken by various countries are discussed in Bradford and
Hayashi (2008). The recent U.S. financial reform bill (officially, the “Dodd-Frank Wall Street
Reform and Consumer Protection Act” of 2010), signed into law on July 21, 2010, includes
the Durbin Amendment, giving the Federal Reserve responsibility for regulating interchange
fees associated with debit cards. In each of these cases, regulation of interchange fees was
36

motivated in part by concerns over an alleged lack of competition in payment card markets.
Our analysis provides a different but complementary motivation—income inequality—for
policy intervention.
Given that policy makers have been and will be focusing on regulating interchange fees, we
can provide some potentially helpful information about the properties of merchant fees and
rewards for policy makers who wish to take these parameters into consideration. Table 10
summarizes the key elasticities with respect to the merchant fee and the reward rate in
the model. Recall from Section 4.4 that regulating the merchant fee without changing the
Variable Merchant Fee Reward rateMarkup 0.52 0.014Transfer paid by low income (XL) 5.99 −3.560Transfer received by high income (−XH) 0.50 0.658Consumer Welfare −0.0021 0.0006
Table 10: Key elasticities (at µ = 2%, ρ = 1%) with respect to µ and ρ in the model
reward rate would have a much larger effect on the price markup and consumer welfare
than regulating the reward rate without changing the merchant fee (first and last lines
of Table 10). However, it is important to remember that optimal policy would require
simultaneous regulation of the merchant fee and the reward rate. It would also require an
analysis and treatment of household claims to banks’ profits, which we have not considered
here.
Table 11 provides a guide to the effects of policy changes by showing the percentage
changes in consumer welfare associated with reductions in merchant fee and reward rates
below their benchmark values (µ = 2 percent and ρ = 1 percent). A positive number
indicates an increase in consumer welfare. The maximum possible increases in consumer
welfare are found at the top of each column where banks’ net income is the smallest for the
column.
37

Reward rate (ρ)µ 0 0.25 0.50 0.75 1.0
0.00 0.147 · · · ·0.25 0.121 0.137 · · ·0.50 0.095 0.111 0.128 · ·0.75 0.069 0.085 0.101 0.118 0.1341.00 0.043 0.059 0.075 0.091 0.1071.25 0.018 0.033 0.049 0.065 0.0811.50 −0.008 0.007 0.022 0.038 0.0541.75 −0.034 −0.019 −0.004 0.011 0.0272.00 −0.060 −0.045 −0.030 −0.015 0.000
Table 11: Percentage changes in consumer welfare associated with reductions in merchant fee andreward rates below their benchmark values (µ = 2% and ρ = 1%).
7. Qualifications and Extensions
Our analysis relies on several assumptions and simplifications imposed due to lack of data
or for tractability. Relaxing these restrictions could alter the magnitudes of the transfer
estimates. This section explores the potential impact of these restrictions, and provides
some qualifications and extensions to the central results.
7.1 Transfer accounting assumptions
Section 3.2 lists three key assumptions underlying the estimates of the transfers between
cash and card payers and between low-income and high-income households. In reality, each
assumption may not hold exactly. So we designed some alternative transfer calculations to
approximate more realistic conditions in the payments market that would occur if we relaxed
the assumptions. Table 12 reports the results of our alternative transfer calculations and
their deviations from the benchmark estimates based on two household income categories.
To simplify the analysis, columns three and four report only the transfer gap, which we
defined earlier as the difference between the average transfer per low-income household and
the average transfer per high-income household. The remaining two columns report the
percentage change for the alternative transfer estimate relative to the benchmark estimate.
38
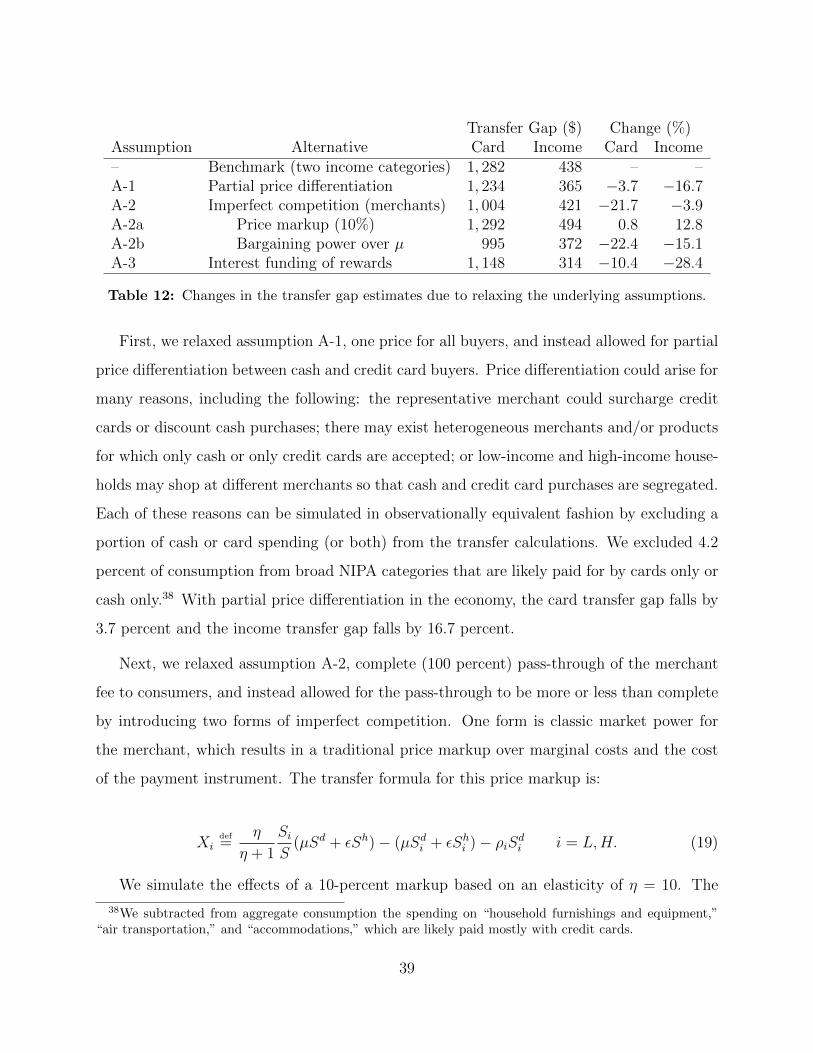
Transfer Gap ($) Change (%)Assumption Alternative Card Income Card Income– Benchmark (two income categories) 1, 282 438 – –A-1 Partial price differentiation 1, 234 365 −3.7 −16.7A-2 Imperfect competition (merchants) 1, 004 421 −21.7 −3.9A-2a Price markup (10%) 1, 292 494 0.8 12.8A-2b Bargaining power over µ 995 372 −22.4 −15.1A-3 Interest funding of rewards 1, 148 314 −10.4 −28.4
Table 12: Changes in the transfer gap estimates due to relaxing the underlying assumptions.
First, we relaxed assumption A-1, one price for all buyers, and instead allowed for partial
price differentiation between cash and credit card buyers. Price differentiation could arise for
many reasons, including the following: the representative merchant could surcharge credit
cards or discount cash purchases; there may exist heterogeneous merchants and/or products
for which only cash or only credit cards are accepted; or low-income and high-income house-
holds may shop at different merchants so that cash and credit card purchases are segregated.
Each of these reasons can be simulated in observationally equivalent fashion by excluding a
portion of cash or card spending (or both) from the transfer calculations. We excluded 4.2
percent of consumption from broad NIPA categories that are likely paid for by cards only or
cash only.38 With partial price differentiation in the economy, the card transfer gap falls by
3.7 percent and the income transfer gap falls by 16.7 percent.
Next, we relaxed assumption A-2, complete (100 percent) pass-through of the merchant
fee to consumers, and instead allowed for the pass-through to be more or less than complete
by introducing two forms of imperfect competition. One form is classic market power for
the merchant, which results in a traditional price markup over marginal costs and the cost
of the payment instrument. The transfer formula for this price markup is:
Xidef=
η
η + 1
SiS
(µSd + εSh)− (µSdi + εShi )− ρiSdi i = L,H. (19)
We simulate the effects of a 10-percent markup based on an elasticity of η = 10. The
38We subtracted from aggregate consumption the spending on “household furnishings and equipment,”“air transportation,” and “accommodations,” which are likely paid mostly with credit cards.
39

other form is market power held by a very large merchant (for example, Walmart) over
banks, giving the merchant leverage in bargaining over the merchant fee. We simulated
this possibility by reducing the aggregate merchant fee 0.5 percentage points to 1.5 percent.
The price markup of 10 percent increases the income transfer gap by 12.8 percent because
the pass-through of payment costs in the retail price is more than 100 percent; the card
transfer gap is only slightly higher. In contrast, bargaining power over the merchant fee
reduces the card transfer gap by 22.4 percent and the income transfer gap by 15.1 percent.
Combining these two different effects of market power, we see that imperfect competition
tends to affect primarily the card transfer gap (21.7 percent lower) but leaves the income
transfer gap largely the same (3.9 percent lower).
Finally, we relaxed assumption A-3, no funding of credit card rewards from revolving
debt activity, and instead assumed that interest revenue from revolving debt held by high-
income households is used to fund rewards paid to low-income households. As we show in
more detail below, this alternative transfer calculation is not supported well by the data,
even though it is often alleged in the literature. In any case, this alternative does not affect
the card transfer gap, but it reduces the income transfer gap by 28.4 percent because of the
direct transfer of interest payments from high-income to low-income household rewards.
One clear overall conclusion emerges from these alternative transfer calculations: both
transfers remain economically significant even after adjusting for alternative conditions in
the payments market. Although relaxing some assumptions leads to reductions in some of
the estimates, the adjusted transfers are still about three-quarters (or more) as large as their
benchmark values. Furthermore, we have omitted from the benchmark transfer calculations
two very important features of credit card markets—redistribution of bank profits (discussed
in Appendix B) and business credit card use (discussed below)—that likely would increase
the transfer estimates. We believe that these increases to the transfer estimates are most
likely greater (in absolute value) than the reductions reported in Table 12.
40

7.2 Revolving credit
It is important to emphasize once more that our model and analysis focus on the convenience
use of credit cards and do not incorporate a role for revolving credit. Revolving credit is an
important part of the value of credit cards to the economy, and we support future research
that expands our analysis in this direction. We also recognize that debt activity could be
another source of revenue for banks and credit card companies. This subsection explores the
evidence on this issue further to reassure the reader that we have not grossly mischaracterized
the transfers.
High interest and penalties paid by credit card borrowers on revolving debt may directly
or indirectly fund some of the bank issuers’ expenses on card rewards. In fact, Chakravorti
and Emmons (2003) demonstrate an equilibrium in the market for credit cards (as opposed
to debit and charge cards) in which the “convenience use” of credit cards by nonborrowing
consumers is subsidized by liquidity-constrained consumers who borrow on their credit cards
and pay high interest. Chakravorti and Emmons’s results explain that borrowers pay high
interest rates on credit card debt because this interest is used to reward all credit card users,
including those who avoid interest charges by paying their full balances on time. However,
the evidence suggests that rewards are funded at least partly by merchant fees. Levitin
(2007) reports that 44 percent of interchange fees goes to fund reward programs. Hayashi
(2009) also investigates the degree to which card reward programs are financed by merchant
fees, but does not draw definite conclusions. In our calculations, rewards make up about 35
percent (≈ 8.5/24.2) of merchant fees. If we look at interchange fees instead of merchant
fees, subtracting 0.5 percent (acquiring banks’ profit) from 2 percent we compute 35 percent
times 4/3 ≈ 47 percent, which is fairly close to the result in Levitin (2007).
The SCF provides data on credit card revolving debt, reported in Table 13, that help one
to evaluate the idea of Chakravorti and Emmons (2003). The survey poses two questions
related to revolving credit, and both show surprisingly little difference between low-income
and high-income households. First, the SCF asks whether respondents usually pay off their
41

balances. For high-income households, 30.7 percent answer “sometimes” or “hardly ever,”
while for the low-income group, 32.9 percent provide the same answer. The second ques-
tion is about the outstanding balance after the last payment, showing that 43.2 percent
of low-income and 47.5 percent of high-income households carried debt. The similarity in
revolving credit between income groups belies the conventional notion that credit card debt
is predominantly a problem for low-income households.
Low-income High-incomeRevolving debt (reported incidence) 32.9% 30.7%Revolving debt (actual incidence) 43.2% 47.5%Revolving debt (revolvers) $6, 243 $11, 709Interest rate (card holders/revolvers) 12.90%/12.20% 12.85%/11.15%Annual interest payment (debt × rate) $788 $1316Aggregate interest payment (payment × households) $30.9 billion $13.4 billionAggregate annual rewards (from Table 8) $2.7 billion $5.8 billion
Table 13: Revolving credit activity by household income group
The remainder of Table 13 shows the implications of revolving credit for interest revenues
to banks. Among revolvers, high-income households carry about twice as much revolving
debt as low-income households, but their credit cards have interest rates about 1 percentage
point lower.39 The last two rows of Table 13 reveal that both income groups pay more than
enough interest to cover the credit card rewards earned by the group. Thus, it seems unlikely
that interest from either group cross-subsidizes the rewards of the other, so we conclude that
the transfer calculations based only on convenience use of credit cards are likely accurate.
7.3 Other extensions
We close this section with a brief discussion of some extensions to our model and some
analysis that we leave for future research.
39The interest rates in Table 13 are for all credit card holders (the first rate shown) and the debt-weightedaverage for all revolvers (the second rate shown). The other figures in the table, except for those shown inthe last two rows, are averages over the entire income group.
42

Bank profits: We have not incorporated household ownership of banks (including card
companies). In our analysis, banks make $15.7 billion of undistributed profits on consumer
credit card services, which would be distributed to households in reality. Because the wealth-
iest 20 percent of the U.S. population holds the majority of all stocks, bank profits from
merchant fees likely would be distributed disproportionately to high-income households.
Thus, incorporating household ownership of banks is likely to increase the transfers from
low-income to high-income households.
Business credit cards: We use data on credit card use by consumers only. The Call
Report data on total U.S. credit card transactions indicate that total credit card spending
by business (and including government) is about equal to consumer credit card spending. If
businesses used credit cards at the same establishments as consumers, they would impose
further costs on the merchants and raise retail prices even more. If businesses (and their
profits) are more likely to be owned by high-income households, then incorporating business
use of credit cards into the analysis is likely increase the transfers from low-income to high-
income households.
Congestion (externality) effects: Murphy and Ott (1977) suggests that cash buyers
impose more costs on merchants’ sales staffs than on card users. If cash transactions take
significantly longer to handle than credit card transactions, cash users may impose an ex-
ternality on card users by slowing them down at the point of payment. This externality
would offset, at least partly, the transfer from cash users to card users. However, the avail-
able data on the time it takes to handle a transaction by payment method do not provide
strong support for this view.40 It is possible that cash congestion effects may be relevant for
highway toll booths, as discussed in Amromin, Jankowski, and Porter (2007). But electronic
40According to a 2000 study by the Food Marketing Institute, titled “It All Adds Up: An Activity BasedCost Study of Retail Payments,” a credit card transaction takes longer to handle than a cash transaction:49 seconds compared to 29 seconds. However, a 2006 study by MasterCard International titled “MasterCardPayPass: The Simpler Way to Pay,” finds that the average cash transaction is slower than the average creditcard transaction if no signature is required: 34 seconds compared to 27 seconds.
43

toll transponders that serve as a faster alternative to cash are not credit cards, and the
proportion of toll payments is relatively small.
Credit card annual fees: Card fees are another potential source of revenue to fund card
rewards that could affect the transfer estimates. If credit card holders pay for their rewards
with high annual fees, then our transfer calculations would overstate the transfers. However,
this possibility is unlikely to be a major factor. According to the 2003 Synergistics Credit
Card Market survey, low-income households paid an average annual fee of $5.7, while high-
income households paid $7.7. These data imply trivial changes in the transfer estimates.41
The preceding list of extensions suggests that the magnitudes of our estimates and results
for transfers from low-income to high-income consumers may be altered quantitatively by
future research. However, if anything, the qualitative nature of the regressive transfer is
almost surely robust and the quantitative estimates are likely to increase relative to our
benchmark.
8. Conclusion
We proposed an accounting methodology to calculate two types of implicit monetary transfers
occurring in a simplified representation of the U.S. payments market: 1) the transfer between
cash buyers and credit card buyers; and 2) the transfer between low-income and high-income
households. Both of these transfers are estimated to be economically significant and robust
to potential changes in the assumptions underlying the accounting methodology.
We also built an empirically tractable theoretical model of payment for consumption that
includes all of the salient and economically important features of U.S. credit card payments.
We calibrated this model with the best, most detailed data available to us and derived
estimates of the average payment, retail price markup over marginal cost, and nonpecuniary
41Including credit card annual fees would reduce the card transfer gap by 0.6 percent to $1274, and reducethe income transfer gap by 0.5 percent to $436.
44

utility benefit of card use over cash use. The results are remarkably plausible given the
relative simplicity of our data and model.
Extending our model and analysis with better data and more realistic features of the
credit card market surely would provide more refined quantitative estimates of the two
transfers. However, we are confident that the qualitative existence of these two transfers is
robust to changes in the model and data. On balance, our estimates of the transfers likely
understate the true values of the transfers, especially between income classes. Taking into
account the quantitative impact of all potential improvements and extensions to the data
and model, it is most likely that including in future research the factors we omitted from
this analysis will yield higher estimates of the transfers.
Appendix A Data
To get total consumption expenditure, we looked at the National Income and Product Ac-
counts (NIPA) for 2007. From the Personal Consumption Expenditure figure, we subtracted
a number of subcategories, where we believe that the transfers analyzed in the paper did
not take place, because assumption A-1 was not satisfied. Table 14 below details these
calculations for our benchmark model and for the alternative simulation with partial price
differentiation (the second row in Table 12): This adjustment resulted in dropping $4.13
trillion of personal consumption expenditures from the headline figure of $9.83 trillion. The
drawback of using NIPA data is that we cannot break down consumption expenditure by
income categories. To do that, we used the 2008 edition of the Consumer Expenditure
Survey (CEX). Tables 2 and 2301 of the 2008 CEX contain the most detailed breakdown
available of consumption by income. To make our calculations consistent with our NIPA
consumption spending figure we had to take the same spending categories out of the CEX
consumption figure as we took out of the NIPA. Unfortunately, the subcategories in the CEX
and the NIPA do not map into each other one-for-one. So, from the CEX “Average annual
expenditure” figure, we took out the entire “Healthcare” category as well as “Mortgage and
45

Line Category name Amount ($ Billions)1 Personal consumption expenditures $9, 826.4
Benchmark model29 Food produced and consumed on farms $0.446 Net expenditures abroad by U.S. residents $6.150 Housing $1, 472.960 Health care $1, 465.484 Food furnished to employees (including military) $14.187 Financial services $507.993 Net health insurance $158.3106 Social services and religious activities $134.3109 Foreign travel by U.S. residents $113.9111 NPISHs $254.2Total adjustments made $4, 127.5
Partial price differentiation8 Furnishings and durable household equipment $277.774 Air transportation $51.685 Accommodations $80.8Additional adjustments made $410.1
Table 14: Adjustments to PCE figure using NIPA Table 2.4.5, revised, August 5, 2010.
interest charges,” “Property taxes,” “Rented dwellings,” “Cash contributions,” and “Pen-
sions and Social Security.” (Expenditures on financial services are not measured in the CEX
at all.) Once we had the relevant consumption and income figures from the CEX (readily
available in Tables 2 and 2301 of the CEX publication), we could construct the average
propensity to consume by each income category (except for the bottom income group). For
the lowest income group, where consumers’ average income was negative, the average total
consumption expenditure per weighted respondent was matched so that it was equal to that
of the second-lowest group. These average propensities could then be multiplied by the in-
come figure in the Survey of Consumer Finances (SCF) 2007 to yield an estimate of total
consumption expenditure by income group. We measured household income as the sum of
variables x5702, x5704, x5706, x5708, x5710, x5712, x5714, x5716, x5718, x5720, x5722, and
x5724. To make the resulting consumption number consistent with the NIPA data, we also
multiplied the resulting number by a scalar so that it matched our adjusted total Personal
46

Consumption Expenditures figure.
Total annual credit card spending was computed as the sum of the values data gathered
in response to questions in the SCF asking about consumers’ total use of credit cards in the
past month, x412, x426, x420, and x423, all multiplied by 12. For the partial price discrimi-
nation scenario we subtracted “Other lodging” and “Household furnishings and equipment”
spending by income group from their respective total credit card spending. The figures for
total annual credit card transactions were taken from Table 19 (monthly credit card use
multiplied by 12) in SCPC 2008 (Foster et al. (2009)).
Appendix B Transfer Accounting Details
To understand better why it is appropriate to adjust the POS transfer for rewards, consider
the aggregate accounting of the complete flow of funds among households, merchants, and
banks. The revenue from merchant fees is paid to banks, which then distribute rewards to
households that use credit cards. Thus, banks’ profits (Π) are:42
Π = µSd − (ρLSdL + ρHS
dH). (20)
Viewed this way, credit card rewards act as a claim on banks’ profits that is paid to credit card
users only, rather than to all owners of banks, and the distribution of rewards precedes the
distribution of profits to owners of banks.43 Because households own banks (either publicly
or privately), banks’ profits ultimately are income for households. Thus, rewards represent
a transfer of profits and dividend income from owners of banks to credit card users who may
or may not be owners of banks. Let Di denote the dividends received by household type i.
After rewards are paid to credit card holders, the distribution of profits to the owners of
banks is
Π = Dh +Dd. (21)
42In this equation, we omit the costs of providing credit card services for simplicity and clarity. If banksare perfectly competitive, then these profits would be zero.
43In a sense, owners of banks have subordinated claims to profits and credit card users have primaryclaims. However, this would be irrelevant if credit card users were the sole owners of banks.
47

Because our computations omit the distribution of banks’ profits given in (21), the sum of
transfers equals the negative amount of rewards,
X = Xh +Xd = −(ρLSdL + ρHS
dH) < 0, (22)
rather than zero. Therefore, estimates of the full aggregate transfer between cash-paying
and card-paying households depends crucially on the structure of ownership of banks by
households. In contrast, the sum of transfers at the point of sale,
X̃ = Xh + X̃d = 0, (23)
does equal zero and does not depend on the ownership of banks.
Data on household ownership of banks by household payment choice and household in-
come are not available, so we cannot estimate the full aggregate transfer. However, unless
cash-paying households own a large portion of the banks, the full aggregate transfer likely is
greater than the POS transfer for two reasons: (1) the dividend income of cash-paying house-
holds is reduced by the payment of rewards to credit card users; and (2) the post-rewards
distribution of dividend income to households may not be proportional to the payment costs
imposed on merchants by household payment choices. The credit card transfer, equation (3),
includes rewards as an estimate of (1), but it does not include an estimate of (2). However, if
the ownership of banks is positively correlated with income, the net effects of bank ownership
on total (pre-reward) profits is likely to make the full aggregate transfer at least as large as
the rewards-adjusted transfer. The rewards-adjusted transfer also allows evaluation of the
independent effects of changes in the merchant fees versus changes in rewards. Clearly, more
data and additional research in this area would produce more complete and refined estimates
of the full aggregate transfer.
Transfer equations (2) and (3) can be rewritten using the definitions above to clarify the
role of rewards in the transfers. Let wh = (Sh/S) and wd = (Sd/S) denote the spending
shares of cash and card users, respectively, so that wh+wd = 1, and recall that Sd = SdL+SdH .
Merchant fee revenue is divided between credit card users (in the form of rewards) and owners
48

of banks (in the form of profits), so that µ = (π + ρ), where π is profit expressed as a rate.
Substituting this identity into the transfer equations, and then collecting and rearranging
terms, yields
Xh def=
{wh[πSd + εSh
]+ whρ(SdL + SdH)
}− εSh (24)
Xd def=
{wd[πSd + εSh
]+ (wdρ− ρL)SdL + (wdρ− ρH)SdH
}−[πSd + ρSd
]. (25)
The structure of the rewritten transfer equations mirrors the original equations. In both
equations, the first term in braces represents what payment users actually pay toward total
merchant payment costs, and the second term (outside braces) represents the merchant cost
of the household’s payment choice. With regard to rewards, it is now clear from equation
(25) that the credit card transfer represents the amount of imbalance between the rewards
portion of credit card costs borne by the merchant (−ρSd), on the one hand, and the portion
of that cost paid by credit card users ((wdρ − ρL)SdL + (wdρ − ρH)SdH), on the other. The
portion paid by credit card users clearly shows that card users do not pay the full value of
their rewards: (wdρ− ρL) = (0.21− 0.55) = −0.34 and (wdρ− ρH) = (0.21− 0.75) = −0.54.
Appendix C Sensitivity Analysis
The following sections present the sensitivity analysis to changes in βH and ε. Since we
are not aware of any study that has directly estimated βH , we would like to see how our
assumption that richer people derive higher utility from using credit cards affects our results.
Also, as noted above, some empirical studies find values that differ from our estimates for the
costs of handling the payment instruments that we labeled as “cash,” and these differences
could have important implications for our results.
When thinking about the welfare implications of different parameter values, one has to
look carefully at the utility of all four groups in the model: (i) low-income cash users, (ii) low-
income card users, (iii) high-income cash users and (iv) high-income card users. The different
parameter values considered below lead to different estimates of the transfers between these
49

groups. In general, since our social welfare function is utilitarian, a redistribution to groups
with higher marginal utility will be desirable. With our concave individual utility functions,
low-income households will have higher marginal utilities, but the (1+ bi) (with bi > 0) term
in card users’ utility will raise their marginal utility above cash users’ within their respective
income groups.
C.1 Sensitivity analysis with respect to βH
We will now analyze what would happen if βH decreased all the way to the level of βL.
Having βH > βL means two things in the model: (i) a higher share of card users in the
high-income group (see equation (14)) and (ii) a higher average marginal utility of card
users in that income category. The former means that for βH > βL, the cash-payer-to-
card-payer transfer will amplify the redistribution of income between the income groups as
well. Intuitively, there will be more card payers who underpay in the high-income group,
so the cash payers (in both income categories) will have to overpay by more, but with the
number of card payers in the low-income category fixed (for a given βL), this overpaying will
result in a cross-subsidy from low-income households to their high-income counterparts. For
concave utility functions, this redistribution will lower total consumer welfare. At the same
time, a higher βH also results in a higher utility gain from redistributing money from cash
users to card users within the high-income group. Remember that in both income groups
card payers derive higher marginal utilities from an additional transaction (for a given t),
so a redistribution from cash to card payers within each income group is welfare increasing
until the marginal utilities of cash and card users within the income groups are equalized.
As βH increases, this utility gain is traded off against the utility loss from a simultaneous
redistribution of income from low- to high-income groups.
The top panel of Figure 10 helps to gauge the effect of a change in βH on the aggregate
consumer welfare function. The mean change in the consumer welfare function has the exact
same shape as the maximum change (not shown) or the change at the point of (µ = 2
percent, ρ = 1 percent). This finding indicates, that changes in βH will not affect the shape
50

of the consumer welfare function drastically, so we expect our results to remain robust to
changes in βH . The bottom panel of the same figure shows that the shape of the transfers
paid by the low-income group changes with the value of βH , as we would expect based on
the discussion above, but the magnitude of the transfer at µ = 2 percent and ρ = 1 percent
stays fairly constant.
0.12 0.14 0.16 0.18 0.2 0.22 0.24 0.26 0.28 0.311.7
11.8
11.9
12
12.1
12.2
12.3
βH
Per
cent
age
(%)
Change in consumer welfare compared to benchmark
Mean changeChange at µ=2%, ρ=1%
0.12 0.14 0.16 0.18 0.2 0.22 0.24 0.26 0.28 0.3−20
−10
0
10
20
βH
Dol
lar
billi
ons
Change of XL
Min XL
Max XL At µ=2%, ρ=1%
Figure 10: Welfare and transfers as a function of βH
Figure 11 plots the welfare-maximizing level of µ as a function of βH and ε, illustrating the
story about the within- and across-income-group redistribution outlined above. A higher βH
leads to a relatively higher number of card payers among the rich, and thus more of the cash-
to-card-payer redistribution becomes also low-income-to-high-income redistribution. Since
this latter is detrimental to aggregate welfare, the optimal level of µ decreases with βH to
curtail the amount of cash-to-card-payer redistribution.
C.2 Sensitivity analysis with respect to ε
According to Figure 12, changes in ε lead to changes in the consumer welfare function that
are of similar magnitude to the changes produced by different values of βH . Again the upper
51

Figure 11: Optimal merchant fee as a function of βH and ε
panel of Figure 12 suggests that the shape of the consumer welfare function does not change
by much as ε takes on different values. Surprisingly, the redistribution also stays fairly
constant as ε changes. From Equation 5 one can see that
∂XL
∂ε=SLSSh − ShL =
SLSSh − ShL
ShSh = −0.05 · Sh,
where the last line makes use of the figures in Table 5. In words, a change in ε changes low-
income households’ contribution to the costs imposed and to the costs paid by roughly the
same amount. A rise in the cost of handling cash leads to a redistribution from card to cash
payers, just as the increase in the merchant fee leads to a transfer from cash payers to card
payers. Again, the no-surcharge rule forces merchants to recover the higher costs imposed by
cash payers by charging higher prices to all customers, so as ε increases, the price paid by card
users will increase, even though their purchases do not impose any additional costs to the
merchants. Since this transfer means a redistribution from high- to low-income households
(with βH > βL), it can increase social welfare as long as it helps to equalize marginal utilities
between the income groups. As can be seen from Figure 11, however, this redistribution can
become inefficiently high for high values of ε, which would then validate a nonzero merchant
fee to redirect some of the transfer to low-income households back to high-income households.
52

0.5 1 1.511.8
11.9
12
12.1
12.2
Cash−handling cost (ε) in %
Per
cent
age
(%)
Change in consumer welfare compared to benchmark
Mean changeChange at µ=2%, ρ=1%
0.5 1 1.5
0
15
Cash−handling cost (ε) in %
Dol
lar
billi
ons
Change in XL
Min XL
Max XL At µ=2%, ρ=1%
Figure 12: Welfare and transfers as a function of ε
However, in our benchmark model with a high βH , a 1.6 percent cash-handling cost would
still not warrant a positive merchant fee to maximize consumer welfare. Also, as noted above,
for high cash-handling costs the optimal merchant fee changes markedly with different values
of βH , as the difference between βL and βH (difference between the fraction of card users in
the two income groups) increases the between-income group redistribution. If there were no
redistribution between income groups, the transfer resulting from cash-handling costs would
decrease welfare, since it would channel income from (high marginal utility) card payers to
(lower marginal utility) cash payers. This is why, in the case of equal βs and high ε, a
high merchant fee (0.9 percent) would be optimal to offset the transfer from card payers
to cash payers. As βH increases, however, the redistribution towards cash payers becomes
more desirable, as it becomes a subsidy from high-income to low-income households, while
the redistribution caused by the merchant fee becomes less desirable, since it works in the
opposite direction. Note that in Figure 11, a high merchant fee is optimal only for low βH
and high ε.
Cash-handling costs play an important role in determining the markup. Because of the
high fraction of cash payers (approximately 86 percent in the low- and 69 percent in the high-
53

income group), the markup moves almost one-for-one with ε. Figure 13 plots the markup
as a function of cash-handling costs and the merchant fee. Note that while the merchant
fee goes from 0 to 5 percent, cash-handling costs vary only between 0.5 and 1.6 percent.
Keeping this in mind, Figure 13 shows that the markup is almost five times more responsive
to changes in ε than to changes in µ.
Figure 13: Markup as a function of µ and ε
Appendix D Discussions of the NSR
Our analysis is conducted under the assumption that merchants obey the no-surcharge rule
(NSR). Under the NSR, merchants sign an agreement under which they cannot charge con-
sumers an additional fee for using a card. Over the years, formal NSR agreements have been
declared illegal by several antitrust authorities but not in the United States. Most merchants
in the United States still do not impose a surcharge on card payments and many do not give
discounts for cash payments. Bolt and van Renselaar (2009) provide an empirical analysis
of the effect of surcharging card payments on actual payment behavior in the Netherlands,
where surcharging is currently allowed.
54

There are a number of explanations for why merchants do not surcharge buyers for card
payments, despite having to pay a high fee for each card transaction.
Buyers’ perceptions: Most buyers are not aware of the high fees imposed on merchants.
Buyers may suspect that the sole purpose of a card surcharge is to enhance merchants’
profit with no cost justification. Clearly, educating consumers may solve this problem.
Proper marking: Most states require shops to mark prices on all items they sell. Imposing
a surcharge on cards may require placing two labels. By itself, this should not be a
big problem; however, when a sale is declared, merchants will have difficulties with
marking down different prices associated with the different means of payment.
Competition: Card acceptance under high merchant fees may reflect a “bad” equilibrium
for merchants, in which no merchant can profitably deviate by refusing to accept card
payments. See Hayashi (2006) for a theoretical study.44
References
Amromin, G., C. Jankowski, and R.D. Porter. 2007. “Transforming payment choices by
doubling fees on the Illinois Tollway.” Economic Perspectives 31 (2).
Armstrong, M. 2006. “Competition in two-sided markets.” RAND Journal of Economics
37 (3):668–691.
Ausubel, L. 1991. “The failure of competition in the credit card market.” The American
Economic Review 81 (1):50–81.
Bergman, M., G. Guibourg, and B. Segendorf. 2007. “The costs of paying—Private and
social costs of cash and card payments.” Bank of Sweden Working Paper No. 212 .
Berkovich, E. 2009. “Trickle-Up Wealth Transfer: Cross-subsidization in the payment card
market.” The Hispanic Institute Working Paper .
44Borzekowski and Kiser (2008) present evidence showing that merchants can substantially reduce theircost by not accepting credit cards. In fact, Ausubel (1991) has already suggested that the use of plastic cardsby buyers cannot always be explained in a rational matter. Merchants may also manifest similar behavior.
55
Bertaut, C. and M. Haliassos. 2006. “Credit cards: Facts and theories.” In The economics
of consumer credit, edited by G. Bertola, R. Disney, and C. Grant. Cambridge, MA: MIT
Press.
Bolt, N. Jonker, W. and C. van Renselaar. 2009. “Incentives at the counter: An empirical
analysis of surcharging card payments and payment behavior in the Netherlands.” Journal
of Banking and Finance 34 (8):1738–1744.
Bolt, W. and S. Chakravorti. 2008. “Economics of payment cards: A status report.” Eco-
nomic Perspectives 32 (4):15–27.
Borzekowski, R. and E. Kiser. 2008. “The choice at the checkout: Quantifying demand across
payment instruments.” International Journal of Industrial Organization 26 (4):889–902.
Bradford, T. and F. Hayashi. 2008. “Developments in interchange fees in the U.S. and
Abroad.” Federal Reserve Bank of Kansas City Payment System Research Briefing :37–
63.
Brito, D. and P. Hartley. 1995. “Consumer rationality and credit cards.” Journal of Political
Economy 103 (2):400–433.
Carlton, D. and A. Frankel. 1995. “The antitrust economics of payment card networks.”
Antitrust Law Journal 63 (2):643–668.
———. 2005. “Transaction costs, externalities, and two-sided payment markets.” Columbia
Business Law Review :617–642.
Carroll, C.D. 1997. “Buffer-stock saving and the life cycle/permanent income hypothesis.”
Quarterly Journal of Economics 112 (1):1–55.
Chakravorti, S. and W. Emmons. 2003. “Who pays for credit cards?” Journal of Consumer
affairs 37 (2):208–231.
56

Chakravorti, S. and A. Shah. 2003. “Underlying incentives in credit card networks.” Antitrust
Bulletin 48 (1):53–76.
Chatterjee, S., D. Corbae, M. Nakajima, and J.V. Rios-Rull. 2007. “A quantitative theory
of unsecured consumer credit with risk of default.” Econometrica 75 (6):1525–1589.
Cohen-Cole, E. Forthcoming. “Credit card redlining.” Review of Economics & Statistics .
Evans, D. and R. Schmalensee. 2005. “The economics of interchange fees and their regulation:
An overview.” In Interchange Fees in Credit and Debit Card Industries: What Role for
Public Authorities? Kansas City: Federal Reserve Bank of Kansas City.
Foster, K., E. Meijer, S. Schuh, and M. Zabek. 2009. “The 2008 survey of consumer payment
choice.” Federal Reserve Bank of Boston, Public Policy Discussion Paper 09–10.
Frankel, A. 1998. “Monopoly and competition in the supply and exchange of money.”
Antitrust Law Journal 66:313–361.
Frankel, A. and A. Shampine. 2006. “The economic effects of interchange fees.” Antitrust
Law Journal 73:627–673.
Gans, J. and S. King. 2003. “The neutrality of interchange fees in payment systems.” Topics
in Economic Analysis and Policy 3 (1):1069–1069.
Garcia-Swartz, D., R. Hahn, and A. Layne-Farrar. 2006. “The move toward a cashless
society: Calculating the costs and benefits.” Review of Network Economics 5 (2):199–228.
Gresvik, O. and H. Haare. 2009. “Costs in the Norwegian payment system.” Norges Bank
Staff memo .
Gross, D. and N. Souleles. 2002. “Do liquidity constraints and interest rates matter for
consumer behavior? Evidence from credit card data.” Quarterly Journal of Economics
117 (1):149–185.
57

Harris, E. and J. Sabelhaus. 2000. “Consumer expenditure survey family level extracts.”
www.nber.org/data/ces_cbo.html, National Bureau of Economic Research.
Hayashi, F. 2006. “A puzzle of card payment pricing: Why are merchants still accepting
card payments?” Review of Network Economics 5 (1):144–174.
———. 2008. “The economics of interchange fees and payment card fee structure: What
is the optimal balance between merchant fee and payment card rewards?” Economic
Research, Federal Reserve Bank of Kansas City Working Paper :08–06.
———. 2009. “Do U.S. consumers really benefit from payment card rewards?” Federal
Reserve Bank of Kansas City Economic Review :37–63.
Humphrey, D., A. Kaloudis, and G. Øwre. 2004. “The future of cash: Falling legal use
and implications for government policy.” Journal of International Financial Markets,
Institutions and Money 14 (3):221–233.
Humphrey, D., L. Pulley, J. Vesala, and R. Avery. 1996. “Cash, paper, and electronic
payments: a cross-country analysis.” Journal of Money, Credit & Banking 28 (4):914–
939.
Humphrey, D., M. Willesson, G. Bergendahl, and T. Lindblom. 2006. “Benefits from a
changing payment technology in European banking.” Journal of Banking & Finance
30 (6):1631–1652.
Ireland, P. 2009. “On the welfare cost of inflation and the recent behavior of money demand.”
American Economic Review 99 (3):1040–1052.
Katz, M. 2001. “Reform of credit card schemes in Australia II: Commissioned report.”
Reserve Bank of Australia Public Document. August .
Klee, E. 2006. “Families’ use of payment instruments during a decade of change in the
U.S. payment system.” Federal Reserve Board, Finance and Economics Discussion Paper
2006-01 .
58

Levitin, A. 2007. “Priceless? The costs of credit cards.” UCLA Law Review 55 (2):1321–
1405.
Lucas, R. 2000. “Inflation and welfare.” Econometrica 68 (2):247–274.
McAndrews, J. and Z. Wang. 2008. “The economics of two-sided payment card markets:
Pricing, adoption and usage.” Federal Reserve Bank of Kansas City, Research Working
Paper :08–12.
Mester, L. 2003. “Changes in the use of electronic means of payment: 1995-2001.” Business
Review (Q3):18–28.
Murphy, M. and M. Ott. 1977. “Retail credit, credit cards and price discrimination.” South-
ern Economic Journal 43 (3):1303–1312.
Prager, R., M. Manuszak, E. Kiser, and R. Borzekowski. 2009. “Interchange fees and pay-
ment card networks: Economics, industry developments, and policy issues.” Finance and
Economics Discussion Series .
Rochet, J. 2003. “the Theory of Interchange Fees: A synthesis of recent contributions.”
Review of Network Economics 2 (2):97–124.
Rochet, J. and J. Tirole. 2006. “Two-sided markets: A progress report.” RAND Journal of
Economics 37 (3):645–667.
Roson, R. 2005. “Two-sided markets: A tentative survey.” Review of Network Economics
4 (2):142–160.
Rysman, M. 2009. “The economics of two-sided markets.” Journal of Economic Perspectives
23 (3):125–143.
Schuh, S. and J. Stavins. 2010. “Why are (some) consumers (finally) writing fewer checks?
The role of payment characteristics.” Journal of Banking and Finance 34 (8):1745–1758.
59

Schwartz, M. and D. Vincent. 2006. “The no surcharge rule and card user rebates: Vertical
control by a payment network.” Review of Network Economics 5 (1):72–102.
Shy, O. and Z. Wang. Forthcoming. “Why do card networks charge proportional fees?”
American Economic Review .
Stavins, J. 2001. “Effect of consumer characteristics on the use of payment instruments.”
New England Economic Review 3 (2001):19–30.
Verdier, M. Forthcoming. “Interchange fees in payment card systems: A survey of the
literature.” Journal of Economic Surveys .
Wang, Z. 2010. “Market structure and payment card pricing: What drives the interchange?”
International Journal of Industrial Organization 28 (1):86–98.
Wright, J. 2003. “Optimal card payment systems.” European Economic Review 47 (4):587–
612.
Zinman, J. 2009a. “Debit or credit?” Journal of Banking and Finance 33 (2):358–366.
———. 2009b. “Where is the missing credit card debt? Clues and implications.” Review of
Income and Wealth 55 (2):249–265.
60