who eats who in the open ocean? - university of hawaii at hilo · organisms of the open ocean ......
TRANSCRIPT

Open Ocean 3
Concepts How do the organisms of the open ocean interact with each other? What is a foodweb? How are humans the ultimate predators in terms of our fisheries?
Standards Addressed HCPS 5.3
Duration Prep: 45 min Activity: 2 periods (45 minutes each)
Source Material PRISM & MARE
Vocabulary Predator Prey Photic zone Foodweb Foodchain Photoplankton Zooplankton Fishery
Who eats Who in the Open Ocean?
Summary: Students learn about how different organisms interact with each other in the open ocean in terms of predatorprey relationships by using their organism cards. Students then learn how these relationships build food webs. Students are introduced to how we, as humans, represent the top predator in every foodweb.
Objectives: 1. Describe how the organisms in the open ocean interact in
terms of predators and prey. 2. Explore how these relationships add up to build food webs
with many levels and pieces. 3. Introduce how humans fit into the open ocean dynamic of
food webs.
Materials: Organism Cards Sample Organism Distributions Sample Foodweb Food Web worksheet Sample roles page
Making Connections: This session is meant to introduce the students to how what you feed on or what eats you is important. This concept feeds into the next session where we examine how squids are adapted to feed on or escape certain organisms. The session also builds the concept of foodwebs and interrelationships, which is the basis of ecology and a keystone of fishery management.
Background: Open ocean organisms spend a lot of time searching for food or avoiding predation. This behavior is often the most well understood piece of an open ocean organism’s biology because much of what we know about those animals comes from catching them and examining their stomachs. Stomach contents can provide important clues about what that animal ate and where it may have found that food. This information coupled with direct observations of predation and organism distribution has allowed researchers to build oceanic food webs, which attempt to link the major predators and prey together, for different areas of the world. Often the foodwebs in tropical areas like Hawaii are very complex because the diversity of organisms is much greater.
This is not to say all the relationships in the open ocean are built off eating eachother. Some animals group together for protection, for hunting, for cleaning, or for a free ride. There are a myriad of interactions in the open ocean.

Commercial fisheries typically fit into the top of foodwebs because we prey on the top predators first in most systems. However, as many oceanic predators are heavily fished other fisheries may begin to exploit smaller organisms in a foodweb. This practice is called fishing down the foodweb and is best illustrated by the whale fishery of the early 1900s. This fishery decimated the large species of whales that fed primarily on krill. The krill population subsequently increased in size and was then exploited by a newly formed fishery in Japan. This example also demonstrates how fisheries may alter foodwebs by not only reducing the population of a target species but decreasing predation for other species.
Preparation: 1 st Period:
1. Print a few actual distributions from the provided examples. 2. Think about how you will break the students into their final project roles. Fishermen,
Biologist, Fishery Manager. 3. Print out a copy of the example roles for yourself.
2 nd Period 1. Print foodweb worksheets for students (one per student). 2. Draw an outline of the foodweb on the board but do not fill in the organisms yet.
Procedure:
1 st Period. Review HW from lesson #2 (10 min) What is the actual distribution of your organism and compare to map? Print out 4 or 5 actual distributions from the provided examples. These maps are from www.iobis.org or from the FAO website (see link below) for other maps. Once you have several of the actual distributions, show them to the students and compare to the student’s maps. Why do the distributions look different??
REMEMBER: All of the students these distributions are created using data collected from satellites. These satellites only “see” what is happening on the surface! We learned in the first lesson that the ocean is changing all the time through currents and seasons. This sattelite data may not be accurate for all times of the year. Also there are other important factors in determining organism distribution. Just because an organism is capable of surviving the physical environment does not mean it will necessarily be in that environment. Factors such as where that organism originated from, amount of prey or predators, reproduction, or migrations may all play important roles in determining distributions.
Questions for students (may be in class or as homework) 1. Is the actual distribution of the organisms the same or different from what you and the
other students mapped? Why do you think so? 2. If you were a krill and a current swept you out of your salinity range, what would happen
to you? 3. What are the four major physical ranges (you mapped them already) that make up
habitats in the open ocean.

4. What type of person would use the information on ocean habitats in their work and how would they use it?
Review final project (see final project folder) and break students into their respective roles. You may let the students choose their roles or assign them, however you should have approximately equal numbers of each role, Biologist, Fisherman, and Fishery Manager. You may want to read the provided examples of each role before letting the students pick their role or after you assign each role. Future lessons may use the students in their respective roles.
2 nd Period. This week we are going to learn about how open ocean organisms interact with each other in the open ocean This lesson deals with predators and prey. We are going to build food webs. FOOD WEBS SHOW HOW MANY ANIMALS ARE INTERCONNECTED BY DIFFERENT PATHS this is different from a food chain. FOOD CHAINS FOLLOW A SINGLE PATH AS ANIMALS EAT EACH OTHER. The basis of most ocean foodwebs is phytoplankton. Phytoplankton are just like plants on land in that they harness the energy of the sun and use nutrients to grow in a process called photosynthesis. Because of this phytoplankton are limited to the photic zone, where light penetrates. These phytoplankton are preyed on by zooplankton that follow them around in the water. Both phyto and zooplankton can be large colonies or individual organisms or they can be microscopic. Take a look in a glass of seawater sometime and look at all the organisms in there (Optional activity). These two groups support almost all the other animals in the ocean.
Put organism cards in plain view and write down list of each organism to be put into the foodweb. Make sure to have two phytoplankton cards and a picture of a person for the top of the food web. Have handout with empty foodweb, no names or lines. (A sample food web is provided. You should draw out the blanks of your food web on the blackboard before so you have an idea where to generally put each organism).
Marlin Loggerhead Turtle Squid Amphipod Mako Shark ManOWar Slug Flying Fish Phytoplankton Albatross ManOWar Jelly Anchovy Phytoplankton Opah Sunfish Copepod People Mahimahi Whaleshark Krill
Give the students 15 – 20 minutes to fill out their foodwebs on the first side of the handout. They should fill in the names of all the organisms, including phytoplankton and people, in each of the blanks. Then have the students draw a one way arrow to indicate who eats who. A good way to start is to begin with the top of the food web and fill out the major predators, then fill out the bottom of the foodweb, and then try to fill in the middle. Pass around the organism cards using the predators and prey information on each on to help complete your foodweb.
Once the students have finished their foodwebs you should fill out the master copy on the blackboard. You may write the name of the organism or you may want to tape the organism card onto the board if there is enough space. The students may follow along by filling out the second side of their handout. The point here is to demonstrate the complexity of the foodweb not to have every student’s foodweb look the same. Start with the plankton and ask who eats it. Draw lines

to indicate who eats who. Try to keep the connections to two predators and two prey for each animal. At the end make sure to put PEOPLE on the top.
Remove the phytoplankton from the web. Ask the students what the zooplankton will eat. (Nothing). Then remove zooplankton and on and on to demonstrate that the food web is based on phytos. It is important to discuss how the foodweb is affected if we remove the base of the foodweb (phytoplankton) or we remove a top predator (such as is happening with the millions of sharks being killed for shark products. See link www.biteback.com ). Work on the questions at the end of the worksheet.
Assessment: HW: Answer the questions on the third page of the food web worksheet.
Key Concepts (what the students should know!) 1. The four major physical ranges (you mapped them already) that make up habitats and
determine organism’s distribution in the open ocean. 2. Some other reasons why organisms live in certain habitats (food, reproduction, etc.) 3. Who is always at the top of the ocean foodweb and who is always at the bottom. 4. What the difference is between a food web and food chain.
OPTIONAL ACTIVITY: Have the students memorize who in the class is their predator and who is their prey (this should be about 4 people). Play Tag (outside or in but the space should have boundaries) avoid being preyed upon. Once you have eaten a prey item you must hang on to that prey while you get others. Eventually this will build a giant food web.
Links:
http://www.fao.org/figis/servlet/FiRefServlet?ds=subservlet&session=Species&xp_banner=none &xsl=webapps/figis/subservlet/species/selectone.xsl&url=figis/kimsmaps/species[3Fquery[3Ds Names[2CcNames[26outformat[3Dxml This is the FAO website link to look at more fish distributions. Input the common or scientific name from the organism card into the search engine for both websites. The FAO website works well for foodfish such as marlin, mahimahi, mako shark, and opah. Use iobis for other species.
NOTES

Albatross (Ka’upu)
Diomedea immutabilis
This map uses a tool based on the reported occurances of an animal and the values of temperature, salinity, depth,
and nutrients that that animal prefers. The purple dots are reported occurances and the orange areas show the
potential distribution. This map does not show the actual distribution of the animal, only the potential range!
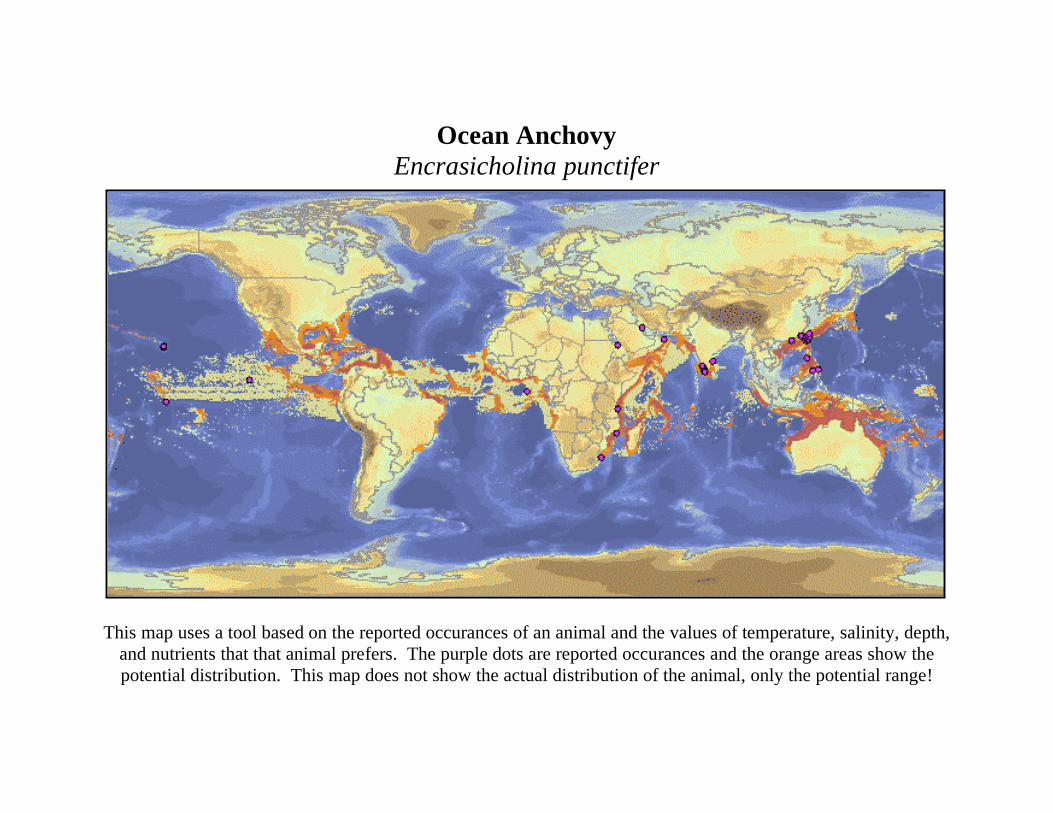
Ocean Anchovy
Encrasicholina punctifer
This map uses a tool based on the reported occurances of an animal and the values of temperature, salinity, depth,
and nutrients that that animal prefers. The purple dots are reported occurances and the orange areas show the
potential distribution. This map does not show the actual distribution of the animal, only the potential range!

Loggerhead Turtle
Caretta Caretta
This map uses a tool based on the reported occurances of an animal and the values of temperature, salinity, depth,
and nutrients that that animal prefers. The purple dots are reported occurances and the orange areas show the
potential distribution. This map does not show the actual distribution of the animal, only the potential range!

Dolphinfish (Mahimahi)
Coryphaena hippurus
This map uses a tool based on the reported occurances of an animal and the values of temperature, salinity, depth,
and nutrients that that animal prefers. The purple dots are reported occurances and the orange areas show the
potential distribution. This map does not show the actual distribution of the animal, only the potential range!

Shortfin Mako Shark
Isurus oxyrhincus
This map uses a tool based on the reported occurances of an animal and the values of temperature, salinity, depth,
and nutrients that that animal prefers. The purple dots are reported occurances and the orange areas show the
potential distribution. This map does not show the actual distribution of the animal, only the potential range!

Flying Fish (Malolo)
Parexcroetus brachypterus
This map uses a tool based on the reported occurances of an animal and the values of temperature, salinity, depth,
and nutrients that that animal prefers. The purple dots are reported occurances and the orange areas show the
potential distribution. This map does not show the actual distribution of the animal, only the potential range!

Moonfish (Opah)
Lampris guttatus
This map uses a tool based on the reported occurances of an animal and the values of temperature, salinity, depth,
and nutrients that that animal prefers. The purple dots are reported occurances and the orange areas show the
potential distribution. This map does not show the actual distribution of the animal, only the potential range!

Phytoplankton
Diatom
This map uses a tool based on the reported occurances of an animal and the values of temperature, salinity, depth,
and nutrients that that animal prefers. The purple dots are reported occurances and the orange areas show the
potential distribution. This map does not show the actual distribution of the animal, only the potential range!

Whaleshark
Rhincodon typus
This map uses a tool based on the reported occurances of an animal and the values of temperature, salinity, depth,
and nutrients that that animal prefers. The purple dots are reported occurances and the orange areas show the
potential distribution. This map does not show the actual distribution of the animal, only the potential range!

FOOD WEB WORKSHEET Name_________________________________
1. Predict where you think the organism goes. (Hint: top of the web = predators) 2. Draw arrows from Predator à to Prey

FOOD WEB of the Pacific Ocean 1. Draw where organisms actually are

Questions:
1. Does your predicted foodweb compare to the foodweb drawn on the board? Be specific (for instance were any animals way out of place?).
2. Were the results suprising?
3. Where do all the lines one the food web eventually lead back too? (who is on the bottom)?
4. What would happen if somehow all the phytoplankton in the ocean suddenly died?
5. How do phytoplankton support all of the animals in the whole ocean when they are so small?

PHYTOPLANKTON
MAKO SHARK
MARLIN LOGGERHEAD TURTLE
OPAH
MAHIMAHI SUNFISH
ALBATROSS
PHYTOPLANKTON
ANCHOVY
COPEPOD AMPHIPOD
PEOPLE
SQUID
FLYING FISH
MANO WAR JELLY
MANO WAR SLUG
FOOD WEB OF THE PACIFIC OCEAN
KRILL
WHALESHARK

Sample Roles Lawrence Hall of Science
Fisherman I’ve spent my life fishing in Hawaiian waters and can’t imagine doing anything else. I fish for food and to make money to pay for my family’s house and food. I’m proud of what I do. My dad and grandfather were fishermen too. A lot’s changed since they were fishing, including the fact that there are now many women fishing. The major change is that there are less fish and more rules! I know that there are less fish because of pollution and foreign fishing vessels as well as my dad and grandfather’s fishing practices, but why should I stop when the foreign fishing vessels will steal all the fish anyway. I might be willing to change the way I fish if it meant more fish in the future. I don’t know what else I’d do if I couldn’t go fishing. Don’t I have a right to support my family and make an honest living?
Marine Scientist I’ve spent my life studying plants and animals that live in the ocean around Hawaii. I am fascinated by those animals and plants because there is so much that we don’t know about them, especially the ones that live in the open ocean. Those plants and animals often live far from land, travel great distances, and live in very deep water. During my time as a marine scientist I’ve seen many fish species decline for many reasons. I’ve studied the impacts of pollution, overfishing, and global warming and made many recommendations to the State and Federal government and to the fishermen themselves to try and help those animals. However, I can’t make anybody stop fishing besides; I like to eat fish too! I’d like to keep studying the animals and plants that I love but some of them are getting harder and harder to find.
Fishery Manager I’m in charge of managing fisheries in Hawaii. This means that I want fishermen to keep on fishing but I don’t want the fish to disappear. There are many ways of doing this but most of them involve making rules to make the fishermen catch less adult fish and less young fish (this is particularly important). Many fishery managers are also starting to not only regulate the amount of fish caught but the amount of pollution, the amount of other species caught, and the amount of people fishing. All these rules are sometimes very hard to keep in order and to make sure everyone obeys the rules. Oftentimes on the open ocean we can tell fishermen from Hawaii “no catching sharks” but then fishers from another country come and catch all the sharks. Then the fishermen from Hawaii get mad. Managing these fisheries is very hard, especially because everyone likes to eat fish!