who benefits froltt intergovernrnental transfers?
TRANSCRIPT
Who Benefits frolTtIntergovernrnental Transfers? {<
Ann R. Markusen, Annalee Saxenian, and Marc A. Weiss{.! nit'ersitv of' C alifrtrniu, Berkelet'
THE STATUS OI' INTERGOVERNMENTAL FISCAL STUDIES
In a recent review of intergovernmental finance, George Break states, "iffiscal research is stimulated by rapid growth in the programs to bestudied, intergovernmental grants should soon be basking in the warmglow of expert attention."l With the burgeoning debate on the spatialdistribution of these grants, we might add that such research will undoubt-edly address these spatial patterns. In order to speculate on the directionand value of future fiscal research, in this section rve investigate existingapproaches. These can be divided into descriptive. causal, and prescrip-tive studies.
Descriptite Studies
A number of studies and ongoing research efforts attempt to identify the"beneficiaries" of intergovemmental transfers by examining current pat-
terns of distribution of government spending. They seek to describe whatis being distributed to whom. Ideally, such descriptive work shouldexamine the distribution in three dimensions. It should show how trans-fers are distributed spatially, how this distribution has changed over time,and how to weight the relative importance of different categories andtypes of expenditures. This combination of spatial, tempcrral and func-
+ We are grateful to the Center fbr Urban Policy Research at Rutgers University, theOffice of Policy Development and Research of the U . S. Department of Hortsing and UrbanDevelopment, and the Institute of Urban and Regional Development at the University ofCalifornia, Berkeley, for material support for this research. We are particularly grateful toDavid Wilmcth, Dan Feshbach, Michael Luger, Michael Teitz. Roger Montgomery. "IohnMollenkopf, Dennis Keating and the National Urban Policy Collective for critical com-ments. An extended version of this article is published in Robert Burchell and David Listo-kin. eds., Cities Uruler Stress: The Fiscul Cri.st'.s oJ Urban America (New Brunswick. N.J.:Center for Urban Policy Research. Rutgers University Press, 1980).
I George Break, "lntergovernmental Finance," in John Peterson, Catharine Spain, andMartharose Laffey, State and Locul Government Finunce and F'inancial Manugement: A
Compen<lium oJ'Current Researc'h (Washington, D.C.: Government Finance Center, l9?8).
"n
Publius/Winter l98l
tional evidence could provide a clear overview of what is being distributedto whom, how this distribution is changing, and which components are themost significant in explaining the distribution.
Descriptive studies work with two different definitions of governmentspending: grants-in-aid and total outlays. The federal government spent$60 billion in grants-in-aid to state and local governments during 1976.However, during the same year, total federal outlays exceeded $358 bil-lion. This included all government expenditures, of which the direct aid tostates and localities comprised only 17 percent. Purchases of goods andservices (defense and non-defense), payments to individuals, and interestpayments on debt accounted for the remaining $298 billion. Expendituresof such magnitude have substantial distributional effects, and in fact pro-vide a very different picture of the overall "impact" of federal spendingon regions and on states. It is important, therefore, to distinguish betweenstudies that use grants-in-aid and those that use total outlays.2
In specifying to whom these expenditures are distributed, descriptivestudies are confined by existing data. Conceptually, many recipient unitsand categories can be identified, ranging from individuals to classes toregions of varying definition. However, available data has been collectedon spatial units and has been aggregated according to political boundaries.Therefore, while other distributional foci could be very enlightening,necessity limits consideration to politically defined spatial units such asregions, states, cities, and counties.
The descriptive studies that exist do not provide us with a comprehen-sive picture of spatial, temporal and functional distribution. Instead, theycan be pieced together in patchwork fashion to provide a partial view.Federal grants-in-aid to regions and states have been studied in detail byVehorn and GAO.3 Federal outlays to regions and states have beenstudied by Havemann and Stanfield and Anton.a Descriptions of federal
'z Currently there are three principal sources of data from which to examine these elementsof governmental spending. The Department of Commerce's Census qf Governments andGovernment Finances itemize f'ederal, state, and local intergovernmental transfers of aid byfunction (e.g., education, highways, public welfare). The Treasury Department's FederalAid to States provides a detailed listing of federal grants paid directly to state and localgovernments by agency and by specific type of allocation. Both of these sources deal onlywith aid-grants which pass directly from one local government to another. Finally, theCommunity Services Administration's Federal Outlays provides a listing of all federal ex-penditures, both direct and indirect. This source lists dollar outlays according to federalagency, and itemizes them by specific program and function. Thus, Federal Outlays pro-vides a comprehensive description ofthe overall pattern ofgovernment spending. Unfortu-nately, severe accounting problems render it currently only about 75 percent accurate sothat it must be used with caution. Thomas Anton, "Outlays Data and the Analysis of FederalPolicy Impact," in Norman Clickman, ed.,The Urban Impacts of Federal Policies (Balti-more: Johns Hopkins University Press, 1979).
3 Charfes L. Vehorn, The Regionul Distibution of Federal Grants-in-Aid, Urban andRegional Development Series no. 3 (Columbus, OH: Academy for Contemporary Problems,1977): and General Accounting Office, Antirecession Assistance-An Evaluation(Washington, D.C.: Government Printing Office, 1977).
a Joel Havemann and Rochelle L. Stanfield, "A Year Later, the Frostbelt Strikes Back,"National Journal 9, no. 27 (July 1977): and Anton, "Outlays Data."

Intergovernmental Transfers
aid to cities by city size and by suburban/central city/nonmetropolitandesignations can be constructed from Census data and have been studiedby Vehorn.s No comparable local level data on federal outlays isavailable.
Spatial patterns of state aid to local governments are even harder todocument. Hovey cites a couple of anecdotal studies and relates the Car-ter administration's trials in trying to ascertain if state governments dis-criminate against central cities.6Interpreting state aid flows is particularlytricky because alarge part of state-to-local distribution consists of pass-throughs from the federal government.? A GAO study of New York showsthe complexities of computing the state-to-local aid flows. The ACIR has
compiled data on receipt of state aid over time by type of jurisdiction(county, township, municipality, school district).8
Numerous data problems confront the descriptive approach. But evenif these were to be resolved, severe problems of interpretation wouldpersist. For instance, can we generalize across regions and states whenvariations within these geographic units often exceed variations amongthem? Or, must straightforward comparisons of dollar amounts be qual-ified by a consideration of differences in economic conditions and cost-of-living across geographical units?
Only very tentative conclusions can be drawn from the existing litera-ture. Regionally, the Northeast and the West receive the largest per capitaFederal aid allocations, which are accounted for in large part by publicwelfare grants in excess of other regions; these disparities in aid amongregions appear to be diminishing over time, however. Federal outlaysfavor the West, with the Midwest receiving the least per capita; defensespending accounts for more than half the disparity. When disaggregated tothe state level, generalizations about sunbelt/frostbelt disparities becomemore difficult to make, although tentative evidence suggests that bothfederal aid and outlays vary positively with state per capita income. Thesmallest cities receive the smallest per capita federal aid, but the largestcities do not receive the greatest. Since no functional breakdowns norfederal outlays data are available, we can only tentatively conclude thatfederal aid tends to favor larger cities, but disparities across city size seemto be diminishing over time. Central cities appear to be favored in aidformulas, except that in the Western region suburbs and rural areas re-ceive more than central cities. State aid favors larger cities, butstatehouses seem to have been increasingly more generous to
s Vehorn, Regionol Distribution.6 Harold Hovey, "State-Local Intergovernmental Finance," in Peterson et al., State and
Local Government Finance, pp. 107-8.7 Advisory Commission on Intergovernmental Relations, The States and Intergovernmen-
tal Aids (Washington, D.C.: Governrnent Printing Office, 1977), p. 14.8 General Accounting Offrce, The Interaction of Federal and State Aid: A Case Study of
New York Strzle, forthcoming; Advisory Commission on Intergovernmental Relations, Slg-niJicant Features oJ- Fiscul Federalism, 1976-77, Volume 3, Expenditures (Washington,D.C.: Government Printing Offrce, 1977).

Fublius/Winter l98l
intermediate-sized cities than to those considered most in need of aidinfusions in the urban-conscious seventies."
Perhaps the greatest weakness of descriptive studies is their failure toplace the distributional exercise in its normative framework. This pointhas been explored hy one of the authors at greater length elsewhere.l0 Tosummarize, it is impossible to discover any general consensus about whatthe aggregate expenditure distribution should be: should big cities receivemore than their suburbs, should frostbelt states receive more than theirsouthern neighbors? The level ofaggregation, both spatially and function-ally. lumps qualitatively different recipients and programs together.
In probing fbr normative criteria, one inevitably concludes that a proc-ess of disaggregation must be undertaken. Ultimately. we think of justiceas a matter of human. not spatial, consequences. The substitution ofspatial units for individual recipients, the logical outcome of the fact thatpolitical units (state and local governments) are the major actors in theintergovernmental battle, obscures the patterns of real change in thehuman condition for various socio-economic groups and individuals. In-dividuals are the only ones lbr whom we ha.ve had a societal consensus onthe appropriate indicator: the distribution of income. A single criterionemerges for judging the success or failure of various programs in improv-ing the distribution: changes over time in per capita income of individualsin the various income intervals. No spatial characteristics equivalent toincome in the individual case has ever been proposed, much less agreedupon. Thus, in the descriptions above, we noted when the distribution,over various sets of spatial groupings. appears to be less skewed or toregister greater dispersion over time on either a per capita or an incomeper capita basis. But we really cannot say whether these outcomes aregood or bad.
Unless we could generate one agreed upon index of spatial worthiness(e.g.. current etlirrts to rank cities as more or less "distressed" ), our onlyoption is to try to map the incidence of many deserving individuals ontospatial units, a presumption which lurks behind many of the arguments informula construction for intergovernmental transfers. To champion a par-
ticular spatial distrihution is to assume this correspondence.r'
e Ann Markusen. Annalee Saxenian, and Marc Weiss. "Who Benefits from lnter-governmental Transfers?" in Rcbert Burchell and Dnvid Listokin. eds.. Cities UnderStress: The Fi.;cal Crises o.l'I-lrban Americu (New Brunswick. NJ: Center tbr Urban PolicyResearch, Rutgers University Press. 1980).
r0 Ann Markusen and Jerry Fastrup. "The Regional War for Federal Aid." The Puhlit'Interest -53 (Fall 1978): 87-99.
It The debate about people prosperity v. place prosperity is not new. Louis Winnick,"Place Prosperity vs. People Prosperity: Welfare Considerations in the Geographic Dis-tribution of Economic Activity," in Real Estate Research, Essal's in Urban I'andEcononics lLos Angeles: University of California at Los Angeles Press, 1966): and WilliamAlonso, "Equity and lts Relation to Efficiency in Urbanization," in John Kain and JohnMeyer, Esszr.v.r in Regional Ecttnomic.s (Cambridge: Harvard University Press, l97l). In the1960s it. was employed as a right-wing critique of many KennedylJohnson programs. Re-cently it has been rearticulated cogently on the left by Matt Edel as a criticism ofthe currentdrift of national urban policy. Matthew Edel, "People vs. Places in Urban ImpactAnalysis," in Clickman, ed.,The Ilrban Impoct o1 Federal I'crlicies.

Intergovern mental Transfers
Yet we know that spatial units do nor correspond to needy populationswell. Central cities have widely disparate income distributions and manyinner ring suburbs have large numbers of poor, unemployed residents.Thus it is impossible to argue single-mindedly that central cities slrculdreceive greater intergovernmental transfers or that states with high un-employment rates should receive more. We could only reasonably arguefbr such aggregate distributions if we knew that the unemployed andpoorer groups within each jurisdication really received the flows. In orderto know the letter, we would need studies of economic and service flowsthat are simply not now available. First. we would have to know how eachstate and local government spends its receipts, and how each locallybased recipient of federal outlays (including private corporations) spendstheir dollars. Then we would have to be able to document the multipliereffects, to show us for instance whether public employee salaries remainin the neighborhood or city and generate iobs for other residents. Withpresent techniques, the demonstration that intergovernmental transfersby place do reach worthy people is impossible to make. Many of thetechnical difficulties encumbering even the documentation of flows byplace (e.g., which regions do federal military dollars ultimately reach) areaddressed in the various papers assembled in Glickman's book.'2
A final caveat for interpreting spatial disparities in expenditure as evi-dence of favoritism is that intergovernmental relations are not reducible tointergovernmental transfers. Tax flows are also important, as well as thedistribution of tax breaks. The ultimate origin of taxes is quite difficult totrace.r3 Nonbudgetary policies such as regulation, licensing, trade, andforeign policies also may have severe distributional consequences, but arenot visible in a spatial accounting of intergovernmental transf'ers. A greatdeal of additional work would have to be done before we could say withmuch certainty that we knew what the distributional consequences ofsuch policies might be. ln part, this arises from the fact that such policiesfrequently affect the supply side of regional growth rather than the de-mand side. Supply-induced growth is particularly difficult to model andmeasure quantitatively. 1a
ln addition to the receipt by places and people of expenditures, anentirely different and fascinating question is posed by the political conse-quences of changes in the pattern of intergovernmental transfers. Re-search on the effects that changes in levels and requirements of particulartransfers have had on political power relationships at the state and locallevel is almost nonexistent. One notable exception is Yin, who tries toshow how local political bureaucracies restructure themselves in responseto changes in particular grant programs. rs Since gains in political power in
t2 Glickman, Urban Impact.13 Markusen and Fastrup, "Regional War," p. 89.
'n Benjamin Chinitz, "Contrasts in Agglomeration: New York and Pittsburgh" (AmericanEconomic Association, Papers and Proceedings, May 1961), pp.279-89.
15 Robert K. Yin, "Creeping Federalism: 'Ihe Federal Impact on the Structures and Func-tions of Local Government," in Glickman. e<].. The Urhtn Intpact ol'Itederal Policies.

r0 Publius/Winter 1981
the long run may be as significant as economic gains, the documentationof such political consequences should be included in the accounting of" Who benefits from intergovernmental transfers? "Causal Studies
Causal research effbrts use empirical testing to substantiate hypothesesabout "explanations" for the variation in fiscal variables (expenditures,tax rates, tax base) cross-sectionally or over time. There are two types ofsuch studies: those which avoid behavioral postulates, focusing oncharacteristics of jurisdictions as determinants of tax or spending pat-terns, and those which employ explicit theories of government behavior.The first type of study generally consists of multiple regression techniqueswhere a dependent variable such as expenditure is regressed on severalexplanatory variables, such as local per capita tax base, percent of taxbase that is commercial and industrial, and intergovernmental transfers.While the exogenous variables in reduced form equations may be consid-ered proxies for fiscal capacity (ability to pay) and tax price of publicservices, they imperfectly represent decision variables in public choicemodels. Elliott Morss definitively criticized both the empirical andtheoretical weaknesses of expenditure determination studies years ago.16
While such studies have become less fashionable of late, the new inter-est in spatial distribution of expenditure may revive them. An example isthe effort to gauge the state and local fiscal response to demographicchanges across a sample of fifty states by Weinstein and Firestine, inwhich they use 57 different demographic indicators in turn to try to ex-plain the variation in expenditure patterns over time.17 Undoubtedly, ef-forts will soon be made to explain the variation in federal and state-to-local expenditures to areas by determination studies, in which theexogenous variables will be characteristics of areas (per capita income,local tax effort, percent poverty population) and functional components ofexpenditure (defense, health, and education). What such studies will tellus is uncertain; the characteristics of places which may be correlated withexpenditure levels may not reveal anything about the complex publicsector behavior that ultimately determines such distributions, especiallyin ways that would enable forecasting. And the regression of aggregatelevels of expenditure on components of that expenditure (categories suchas education, health, etc.) has been shown by Morss to be incorrect use ofeconometric techniques, which are supposed to be employed on stochas-tic processes, not on a relationship which by definition is determinate.Similarly, a regression which "explains" expenditure levels by several
16 Elliot Morss, "Some Thoughts on the Determinants of State and Local Expenditures,"National Tax Journal 19 (1966): 95-103.
r7 Bernard L. Weinstein and Robert E. Firestine, Reeional Growth and Decline in theUnited States (New York: Praeger Publishers, 1978).

Intergovernmental Transfers
indicators will not be analyzing a stochastic process if those very indicatorsare used in the allocation formulas.
The second type of causal study which has gained popularity in recentyears tries more explicitly to describe the behavior of the public sectorwith methods that have emerged from rational behavior models in micro-economics. The new field of public choice theory focuses directly on suchbehavior. Unfortunately, to date, public choice studies rely almost totallyon individual utility maximization models in which the median voter isassumed to be the active agent in deciding public sector tax and expendi-ture levels, by pursuing utility maximization.ls The empirical work testingvoter choice models similarly employs regression techniques that attemptto explain expenditure outcomes on the basis of the public sector priceand income equivalents of consumer choice in the private sector.
The trouble with both these variants of expenditure determinationstudies is that their modeling of the public sector institutions and behaviorrequires rather restrictive simplifying assumptions. This is particularlytrue if we anticipate their application to the determination of inter-governmental transfers. Even the second type of study limits its scrutinyof the relevant actors to voter/consumers, which assumes that the politi-cal process is demand-dominated and that government legislative bodies,bureaus and elected officials automatically respond to the medial voter'swishes. But in fact, the array of petitioners and decision makers includesmany whose powers and interest are quite different from the medianvoters. We map out an alternative approach below.
Prescriptive Studies
Intergovernmental prescriptive studies include the original Heller/Pechman work on revenue sharing, which argued that replacing categori-cals by revenue sharing from the federal to state and local levels wouldsolve the fiscal imbalance problem, increase flexibility in decision makingand improve efficiency in the public sector by permitting the use ofrevenue sharing funds to be more responsive to constituents' needs. Sincethen, Richard Nathan at Brookings and other social scientists have de-signed specific criteria on which to base revenue sharing, at both thefederal and state levels, as well as certain categorical programs such as
CDBG. (One of the authors, Markusen, recently designed an indicator forthe anti-recessionary program based on changes in employment as aproxy for long run economic health.)1s
In general, such studies identify problems with current formulas(anomalous distributions, for instance) and suggest new indicators forformula construction. The new indicators are generally proxies for"needs" of geographical places and are thus clearly prescriptive and ad-
18 Break, " Intergovernmental Finance. "ls General Accounting Office, "Antirecession Assistance," pp. 103-123.
ll

12 Publius/Winter 1981
vocatory. This comrnitment on the part of social scientists and policyanalysts to produce prescriptive recommendations is laudable. However,the exercise itself frequently results in scientific claims for the appropri-ateness of a particular indicator, claims which may originate in the politi-cal rather than research sphere, but nevertheless accompany the publicdebate. Whether a particular formula inventor is aware of it or not, anyindividual indicator will favor certain jurisdictions over others and willembody a normative decision about need. When such formulas are de-bated, they are frequently shorn of their normative logic and simplychampioned as better criteria of "need." An example is the age of thehousing stock variable in recent federal formulas. And, of course, theparticular formulas have frequently been chosen because their indicatorscorrelate with certain impressions of deservedness of their populations,without any guarantee that the expenditures will reach those peoplewithin the jurisdiction who are, in fact, worthy.
On the basis of the above reflections, w€ might offer a structuralcritique of the role of fiscal experts in the formula creation process. Withthe advent of general revenue sharing in 1972, prescriptive work on for-mulas reached a new stage of development. No longer merely accountingfor expenditure and revenue patterns of state and local government postfacto, fiscal specialists now played a central role in creating the formulasthat allocated revenue to state and local governments. The formulas forgeneral and special revenue sharing were to be based, &s President Nixonput it, "on objective criteria." 20 Fiscal experts came to be relied upon todevelop these criteria, a job which has expanded to encompass revisionsof the original formulas and the creation of new federal grant programsbased on formula distributions.
Social science construction of allocation criteria did not begin withrevenue sharing. Economists, sociologists, political scientists,psychologists, and other professionals devised the criteria for the NewFrontier and Great Society categorical project grant programs in the1960s. Here too "objective criteria" were necessary. Piven and Clowardargue that the criteria functioned to obscure the political purpose of theprograms.
There were other reasons why the political interests at stake were notwidely recognized, at least in the beginning. One was the large role playedby various professionals, especially social workers and social scientists,who provided the rationales for the Great Society. Each measure was pre-sented at the outset as a politically neutral "scientific cure" for a disturbingsocial malady. Each concrete program that evolved was couched in themurky, esoteric terminology customarily used by professionals, & terminol-ogy that obscured the class and racial interests at stake, So that few groups
20 Dan Feshbach, "History of Revenue Sharing." (Manuscript, Department of City andRegional Planning, University of California, Berkeley, 1975),, p. 15.

Intergovernmental Transfers 13
could be celtain who would gain tiom the new programs or who would lose,or what they would gain or lose.:]
In other words, the apparent scientific character of indicators proposedby public finance experts may have served certain powerful state andlocal groups who wished to smokescreen their attempts to garner a largershare of federal budget.
THII POLITICAL DETERilTINATION OFINTERGOVERNNIENTAL TRANST'ERS
Above we have suggested that fiscal analysts have unduly ignored thepolitical and social conflict which ultimately shapes fiscal federalism. Inplace of an "expenditure determinants" approach to the study of thespatial distribution of transfers, we propose a political study. In whatfollows. we lay out the elements of such a study, documented by anhistorical interpretation of the last two decades of federal aid allocations.We do not claim to pose a satisfactory theory of political resources andpolitical power that would explain all of the interrelationships determiningthe distribution of transfers. This task we commend to fiscal researchersin the future.
Our basic contention is that the spatial distribution of intergovernmen-tal transfers can most easily be explained by studying the politics of theprocess under which they are produced. To borrow from economics, wecan think of the process as having demand and supply sides. Constituents,particularly state and local governments and special interest groups, formthe demand for intergovernmental transfers on the federal plane. On theprivate sector side, certain interest groups are better organized and more"well-heeled," and therefore much stronger and persuasive than the me-dian voter. The pattern of federal outlays and grants may be an amalgamof many special interest-oriented porkbarrel programs, whose shape canonly properly be modelled by explicit inclusion of those groups in themodel. For instance, state shares of federal farm price support paymentscould be hypothesized to be related to the absolute and relative size of thefarm constituency, the seniority of their representatives in Congress, theprofitability of their farms, the level of organization among farmers, andthe campaign contribution "price" they are willing to pay for politicalpower. Similarly, organizations of state and local public officials andemployees, who form the major lobby groups for federal aid, will winlarger allocations if their lobbying effort is well-articulated and well-financed. Several interesting hypotheses could be posed regarding thestrength of such efforts and the expenditure outcomes.
Demanders may be as interested in the functional form in which themoney is distributed as in the actual level of expenditures. The relative
21 Frances Fox Piven and Richard Cloward, Reeulating the Poor (New York: PantheonBooks. 1971), p. 277.
t4 Publius/Winter 1981
power between levels of government and among agencies is strongly af-fected by the form of transfers chosen. For instance, the switch fromcategorical grants to block grants tends to diminish the power of agenciesreceiving categoricals and to strengthen the power of general local gov-ernment. The constituency groups with power within certain local agen-cies also stand to gain or lose from changes in the grant structure.22
On the supply side are the federal Congress and state legislatures whoactually appropriate the funds, and the bureaucracies who propose pro-grams and administer them. Certain congressional committees at the fed-eral level, and their bureaucratic counterparts, may have long histories ofrelationships with certain constituencies.2s Such links may provide a tre-mendous momentum to the distributional pattern. But bureaus may alsohave significant power to shape programs in their own interests. Work onthe supply behavior in the public sector is relatively nonexistent in publicfinance.2a Adequate models would have to take into account the complex-ity and diversity of behavior in the public sector itself.
The political interactions among the forces battling over the distributionof federal expenditures are suggested by federal outlays data on an agencyby agency basis (rather than by function, as is normally done). In Table Iwe have aggregated the total per capita outlays of selected federal agen-cies by subregions. Certain agencies seem to have spatial affinities, asevidenced by the uneven distribution of their expenditures across thecountry. We can hypothesize that these distributions are the outcomes ofthe interactions among agencies, the interests of their constituents, andthe congressional committees concerned. For example, the seeds of anexplanation of the regional unevenness of spending by the Department ofthe Interior are found in a historv of the mountain west.
22 Roger Friedland, Frances Fox Piven and Robert Alford, "Political Conflict, UrbanStructure and the Fiscal Crisis," in Douglas Ashford, ed.,Comparing Public Policy: NewApproaches and Methods (Beverly Hills: Sage Publications, 1977).
23 Grant McConnell, Private Power and American Democracy (New York: Alfred Knopf,1966)r and Aaron Wildausky,The Politics o.f the Budget Process,2nd ed. (Boston: Little,Brown. 1974).
2a Some threads are discernible. O'Connor shows how government output supports pri-vate sector activity. James O'Connor, The Fiscal Crisis o.l'the Srate (New York: St. Martin'sPress, 1973). In sociology and political science, power structure research attempts to showthe links between certain public sector suppliers and private sector powers. G. WilliamDomhoff, Who Really Rlles? (New Brunswick: Transaction Books, 1978); idern,The Pow-ers That Be; and Judith Carnoy and Marc Weiss, A House Divided (Boston: Little, Brown,and Co., 1973). In public choice theory, work on supply behavior within bureaucracies isonly just beginning. William A. Niskanen, Bureaucracy and Representatire Government(New York: Aldine-Atherton, l97l); Gary Wamsley and Mayer Zald,The Political Economyof Public Organizations: A Critique and Approach to the Study of Public Administration(Lexington, Mass.: Lexington Books, 1973\. A recent paper by Markusen speculates on thesupply behavior of the Carter administration in producing the urban impact analysis. AnnMarkusen, "The Urban Impact Analysis: A Critical Forecast," in Glickman, Urban Impact.An outline of endogenous and exogenous supply behavior is presented in Capitol Kapitali-state, "The Study of Studies: A Marxist View of Research Conducted by the State,"Ka pit al ist ate 6 (1977'l: 163- 190.

TA
BLE
1P
er C
apita
F'e
dera
l O
utla
ys t
o R
egio
ns.
by A
genc
y, 1
976
Age
ncy
Per
Cap
ita O
utla
ysl
(in t
hous
ands
of
dolla
rs)
Reg
ion
Agr
icul
ture
Def
ense
HF
]WH
T]I)
Inte
rior
f ra
nspo
rtat
ion
ER
DA
FIP
A
(lom
mer
ce L
abor
N o
rthe
ast
New
Eng
land
Mid
-Atla
ntic
Mid
wes
tG
reat
Lak
esG
reat
Pla
ins
Sou
thS
outh
Atla
ntic
E.
S.
Cen
tral
W.
S.
Cen
tral
Wes
tM
ount
ain
Pac
ific
4t.5
5r.7
42.6
82.7
75.9
r02
t3
86.8
87 .4
62.6
476.
723
9.7
162.
843
7 .6
462.
133
9.0
400.
tt
448.
865
6.2
635.
s64
7 .3
544.
655
7.5
564.
655
2.2
499.
2
469.
756
7.0
t5.7 9.7
8.1
I 1.
5
9.1
10.
I
r0.5
t0 "
2l0
4
4.7
3.5
2.4
16.
I
8.0
5.1
6.7
I18.
l33
.9
53.s
44.2
30.8
41.7
40.4
36.6
43.8
63. l
39.5
3.5
l3.8
13.2
8.r
12.6
69.3 z.z
87.tt
30.7
t7.4 3. t
t
19.7
22.2
24.6
13.5
t4.6
r 5.
i)43
.rJ
.s .4
48
.12.
8 46
.0
2.4
36.
I
4.,s
33
.9
16.5
-1
0.5
4.9
37.
rl
6.9
t4.5
il .9
44
.78.
3 _5
0.6
E J r.+ o n T
A 5 t J H J o !t ) (+ a n J a (D'
:t 0
Sou
rce:
Com
mun
ity S
ervi
ces
Adm
inis
trat
ion,
F
eder
ul O
utla
ys i
n S
umm
ury,
F'is
cal
Yeu
r 19
76 (
Was
hing
ton,
D.C
.: U
.S.
Gov
ernm
ent
Prin
ting
Offi
ce,
1976
t.N
ole:
Dis
tric
t of
Col
umbi
a ha
s no
t be
en i
nclu
ded.
I In
clud
es b
oth
dire
ct g
rant
s an
d al
l ot
her
indi
rect
out
lays
.
lr (rl

l6 Puhlius/Winter l98l
Without the federal factor, the mountain states' economy might not beviable at all . . . The decision to promote the growth of the West. even at thecost of the taxpayers of the other regions, may well have been a wise one inthe interests of long term development of the U.S.A. But the decision wasnot primarily economic. but rather political-the result of adroit maneuver-ing by Western Senators and Representatives on Capitol Hill.
The House Interior Committee, for instance, is headed by Wayne As-pinall ol'Colorado's Western Slope. Aspinall has obtained authorization forso many federal dam and reservoir projects in Colorado that even hishome-state boosters admit some of them are uneconomic and should neverbe built. Yet it is interesting to note that no t'ederal water projects deliversubsidized water to cities east of the Mississippi . . . Interior, of course, isthe great patron department of the West.zi'
This type of historical and political analysis tells much about the distribu-tion of certain federal expenditures that we could never learn fromeconometric expenditure determination studies or microeconomic be-havior models.
We suggest that further examination of such factors in the supply be-havior of the public sector would help explain distributional patterns ofoutlays. Likewise, demand side forces such as the relative levels of or-ganization and influence of the constituency of an agency may be instru-mental in the spatial distribution of federal spending. For instance, wemight hypothesize that the bias of the Agriculture Department in favor ofthe West is in part a reflection of the influence of large scale, organizedagribusiness.
Demand and supply side actors meet before the legislative bodies at thestate and federal levels. Here, the details of outlays and transfers aresketched out. followed, in some cases, by discretionary regulations andimplementation at the bureaucratic or state and local levels, also affectedby political power and conflict. In what follows, we document how impor-tant political coalitions and conflicts are in the determination of certainf'ederal intergovernmental fl ows.
CASE STUDIES OF POLITICAL DETERMINATION
'flte Politics r2l'Tx,o Decudes: Tlte Seesow ButtleOver F-ederul Grunts
In the previous section we have posited the theory that broad social,economic, and political conflict between groups, classes, and individualsorganized on spatial, functional and ideological lines, accounts for thedistribution of federal expenditures. The politics of distribution involvetwo elements: who the money goes to, and who controls the allocationprocess at each level through which the funds flow. These two elementsare highly interrelated. For example, the recent debate over whether
2" Neal Pierce. Thc Mountain States o.f'America (New York: Norton and Co., 1972),p.26.

Intergovern mental Transfers
HUD, EDA, the Department of Treasury, or some newly-created agencyshould control a National Development Bank largely revolved aroundperceptions by various potential recipients about which agency and dis-tribution structure would most favor their interests. Similarly, the deci-sion between establishing the Bank at one central location or a series ofregional offices would influence who ultimately gets what, and who woulddecide who gets what. Even if a grant program employs an automaticformula, the formula itself has distributive consequences. In addition, therecipient state and/or local governments will also shape the distribution,depending on which level of government and which agency within thatlevel controls the program. Political battles also occur over the adminis-trative regulations imposed by both Congress and the federal agenciesresponsible for grant oversight, and the extent to which these regulationsare actually enforced.26
While many interests are brought to bear on the allocation process,including executive and judicial agencies, decisions on the appropriationof funds available for expenditure are worked out in the legislative arena.In this section we take a closer look at the legislative and executivebranch politics ofone small part ofthe total federal budget, federal grantsto cities. We describe the political conflict that has been responsible bothfor the changes in the dollar amounts going to different types of cities indifferent parts ofthe country, and for changes in the structure ofthe grantprograms themselves. In this case a key impetus for change has been therelationship of the Democratic and Republican parties to various ethnic,economic, and political constituency groups, including state and localgovernment officials.
We have found three distinctive swings in the distribution of federalgrants to cities in the 1960s and 1970s that correlate highly with Demo-cratic and Republican electoral strategy. As Table 2 demonstrates, federalgrants to cities grew by a tremendous amount during this total period,with the northeastern and midwestern cities benefitting most from 1965-72, the southern and western cities benefitting most from 1972-75, and aslight swing back in favor of the first group from 1975-78. The first swingin a function of the large Democratic majorities in Congress in the 1960s,coupled with eight years of a Democratic presidency. Particularly duringthe key Great Society years (1965-66), many grant programs were initiatedor expanded that were aimed at the traditional New Deal constituency ofbig city ethnic machines and organized labor in the industrial belt, as wellas at the recently expanded and explosive population of minorities in thelarge northern cities.
However, the focus by the Great Society on blacks and Hispanics inlarge cities produced a political backlash in the once solidly Democratic
26 Daniel J. Elazar, " Restructuring Federal Housing Programs-Who Stands to Gain?"Publius 6, no. 2 (Spring I 976).
l7

ffi
1'A
BI,E
{lom
para
tive
tiror
vth
in l"
ot*r
} F
eder
al (
Jran
ts,
and
Sun
krel
t {li
fies.
196
5-78
(in
2 Sel
et:te
d N
orth
east
ern
and
hlid
wes
;t*r"
nT
hous
ands
of
Dol
lars
)
Eig
ht l
iort
heus
lern
and
ll{itl
wcs
tern
{lit
ies
Tot
al G
rant
sr 96
5-66
'fota
i (i
nant
st9
7l-7
2T
otal
(ira
nts
te71
-7 5
F,s
t. {'r
"unf
s1"
"\' i
rj iF
i
,',)
Inc.
{r$-
72,
! nc
. {.
"/( In
c,?;
-?$
?5-7
tt
ql.
l.crr
irsf}
u l'f
alo
i"'l*
vcln
ndItu
str:
n['h
ilad
eiph
i;r
[.]ct
roit
C h
icag
o$;
.rlti
mor
c
It'tr
";in
I il
iur:
fi-r
t
380
2,58
96.
46tt
32,f3
.12
l5,ft
367{
\.i74
l9,tt
045.
308
tlre
eigh
l N
orth
east
c:r-
n an
rJ M
idw
este
rn c
ities
:
I .1
. I
.15
15,3
4516
,782
6l .7
49It2
.69.
4I
32 "
071
{r5.
l4?
43,tt
-15
3 t.4
fl33
[,1t4
447
,'73.
7
66,7
9213
0,82
016
6,18
3I 66
, I 29
108,
015
1{}9
50t
:t{
0.94
"1
I t0
"ls I
120.
$fi5
32t{
, I
i,"+
3lt.t
,{2
,401
"72(
)l8
l .39
4
"i(rli
l,t*
{
li9 { tl,
i
r.lL
I
5 Jq
,
2 lir
726
r23
l0l{
I t{
.1 I {t 2{r
t4b
l.4s
l5'1
t1t lJl til t5l
87 t45
6t{
795
r33
ql
f+r
tt 1 F} -l
At la
nta
Dai
ias
L{ o
irst(
}nllh
oe n
i x
Birm
irtgh
aml-r
:uis
ville
.luck
sonr
. ill
eN
ew (
)riu
rirs
Okl
lrlrr
.xt'r
a ('i
tv
hdu.
:rui
val
rre
lrlr"
uirc
nin
c "S
lntb
elt
Citr
*,"
2, j-
l I
5 "4
963.
067
I .15
7
.q .:
?(l
"t 9
t{
+.
i hli
I().
l4_s
4, f
{07
1 2,
s07
t{.e
903.
240
2l,5
ttt{
6 "?
.17
i4.7
705.
540
3tt.4
5|i
12.
I 65
4_5.
|t6
936
.556
l4.4
5tJ
36,3
6430
.619
,1,5
.670
It("6
91
5t{.
994
64,1
1',7
,86,
39_S
70,9
1 l
3l ,6
4-tr
67,6
ti6"1
0.rt
86
th.f{
9538
.7"X
n
3.,1
{r
l2li
r93
139
l6"i
i6l I ')
-t
-) -1
169
-t"!
i
.itr
/
\,U i
"l zl
{r 6ll
39fl
i(i,,
,1 -
.1 ,
-s_1
1A ta r{ t
J
91 !19 ti6 7,4
ei)
I ()
l
6s9
ti3

tr ntergrlvernnlental'l'ransfers
south and also among blue-collar white ethnics who were abandoning thecentral cities for suburbia" Richard Nixon based his "silent majority"election campaign ,;f 1968 on an appeal to these disaffected Democrats,and once in office. embarked on what was to be an eight year strategy ofrestructuring the post-New Deal two-party alignment and traditional na-tional voting patteins. This strategy, outlined by Kevin Phillips in TlteEmerging Republkrtn Majoritl:, tried to merge the 1968 Nixon and Wal-lace votes by building a coalition that combined voters from the old Re-publican suburbia antl midwest farm belt with voters in the rapidly grow-ing southern and we :rieri: regions and the new suburbia of the Democraticethnics.zT The redistnb:ri.ir:ir efl'ects of the formulas tbr President Nixon'sgeneral revenue :;hariri;r j,r!{i grant consolidation proposais were a deliber-ate part of this Repubiri:;rn strategy. The adoption by Congress in mod-ified form of some elements of Nixon's "New Federalism" accounts forthe second swing.
The third su,inggreu'orit of the Watergate scandal and recession in themid-1970s. 1'ogether they ied irr a defeat of the Nixon strategy, strongDemocratic congressiun;ri gains in all regions and metropolitan areas, as
well as the election of a sorrthern Democratic president. CongressionalDemocrats were able tu ellect mild redistribution toward areas of theirgreatest voting strength. rvlnie not rescinding the increased i'unding levelsthat had bee n awai'iied tt: ih,' Sunbeit. small cities, and suburbia duringthe hc,vci;1' oi the .l\ew Fcr.iri;ilisil.
Fedc:ral grlnts dir'ectly tr; city gL)vernment agencies began in the NewDeal pcriod. Presir,lent Roosevelt, through reliel and public works pro-grams, wanted to get large arriounts of money into the hands of millions ofunemployed workers, amoll!! othei' things becausr' thc---y were u major'force in his eiectoral coalition. Repubiican-dominaietl staL* governmentshad proven to be unsympathetic to massive relief and public works ef-forts. In addition, he channeled the money through city government agen-cies because big-city Democratic machines were rr crucial part of hiselectoral base, and the various New Deal programs gave Democraticmayors a huge source of money to dispense and thus garner continuedvoter support (not to mention campaign contributions and outright graft,in some cases).28
Republicans during the 1930s and i940s olten denounced what they sawas the New Dea!'s intrusion on slate sovereignty. Their preferred methodwas to funnel grants-in-aid to state governments. Conflict over this issuecame to a head in the Federal Airpori .{ct of 1946, when, despite GOPinsistence that all aid go to the state!. ihe Democrats included a provision
!i Kevin I'hillips, [he Emcretng Re1t11$l1r',,,, Mujority (Garden City. NY: Anchor Books,1970).
2' Arlirur N{. Schlesinger. .lr .. Tltt' i.'t)ntt'n.g oj tit(Co., 1958). idem.'[ite I'oiitit s ()/ {.'ltlt{iitul(Boston:and Cloward, .I&'gtti(tlinq tlte f'ttitt'.
,V(,rr' 1)i,.,/ i Bos{cn, i{crLrghton Mitl'irnHcuehton N,Iifilrn L'o.. 1960): and Pir,,en
Iti

2A Publius/Winter 1981
that allowed federal grants to go directly to certain types of cities. In the1950s the pattern was somewhat reversed, with Republican PresidentEisenhower's Interstate Highway Act putting billions of dollars nation-wide into the hands of state government officials, many (though by nomeans all) of whom were Republicans, with which they could dispensejobs, contracts, and other business to preferred constituents in exchangefor political support.2e
With the Democrats back in power under Kennedy and Johnson, grantsto cities proliferated. Demetrios Caraley, in an analysis of key votes in theHouse and Senate between 1945 and 1975, argues that party affiliation isthe crucial variable in explaining congressional votes on urban aid. Grantprograms to cities were most likely to be passed or appropriations ex-panded when there was a preponderance of northern Democrats in Con-gress, and when a Democrat was president. Southern Democrats weremore likely to oppose urban aid programs than their northern counter-parts, but even so Caraley points out that their voting record in generalwas more pro-urban than congressional Republicans. Thus, the Johnsonyears in particular were ideally suited to a major expansion of urbanprograms.so
Piven and Cloward point out that during the 1960s the Democraticpractice of targeting grants-in-aid to city rather than state governmentswas supplemented by a new strategy of targeting aid to particular ethnicand neighborhood groups. Because black and Hispanic people were gen-erally excluded from urban services by local Democratic machines, theKennedy and Johnson administrations created programs which bypassedlocal government and put money directly into the hands of minority-controlled community agencies.3l
The increasing use of categorical grants led to the emergence of interestgroup coalitions that cut across intergovernmental and geographic lines.The more powerful of these, such as the highway and education lobbies,transcended party affiliation as well. But some were more vulnerable tothe vagaries of political partisanship. As Nixon ascended to the pres-idency in 1968, he prepared to do battle with the Great Society's legacy.The result was a curious admixture known as the New Federalism, whichrather than launching a frontal attack on grant programs for out-of-favorconstituencies, chose instead a flanking movement by reorganizing thegrant system itself.3z
One element of the Nixon strategy was to create a broad grant programthat would give aid to all state governments and nearly all general purpose
2e Paul Dommel, The Politics oJ Revenue Sharing (Bloomington: Indiana UniversityPress,1974).
30 Demetrios Caraley, "Congressional Politics and Urban Aid," Political Science QLtar-terly 91, no. I (1976).
31 Piven and Cloward, Regulating the Poor.32 Richard Nathan, The PIot That Failed: Nixon and the Administratiye Presidency (New
York: John Wiley and Sons, 1975).

lntergovernmental Transfers
local governments. including very small ones. The money. within certainvague guidelines', could be spent in whatever fashion the recipient de-sired. Republican sentiment was that certain bureaucratic and consti-tuency groups were better organized at the congressional committee andfederal agency level than at state or local levels, and that placing moredecision-making power over federnl grants at the state ancl local levelwould result in a diminution of influence by Democratic party-favoredgroups and bureaus.33
In order to drum up support in Congress for General Revenue Sharing(GRS), President Nixon and the Treasury Department mobilized state andlocal government executive and legislative officials to lobby for the meas-ure. They did this by promising a large number of these governmentalunits that they would receive more money under this new program thanthey were getting under the previous categorical grant programs. Theoutcome-more for everybody-has been dubbed " spreading" byRichard Nathan. Under the first formula for the GRS program, whichbegan operating in December,1972, $5.3 billion in aid was divided upbetween 50 states and nearly 38,000 counties, townships,, andmLrnicipalities.:rl
The political payoff for the Republican party was that suburbs and smallcities and towns, plus the western and southern regions in general, werethe biggest gainers under the formula for the new programs.:r5 Still,, sincethe Nixon administration promised that GRS would be an "Add-on" to allexisting grants, mayors in hard-pressed northern central cities were sup-portive. Two key legislators originally opposing the program. DemocratsMuskie of Maine and Mills of Arkansas, were both running for the Demo-cratic presidential nomination in l97l-72 and the mayors in particularprevailed upon them to acquiesce to a modified version of the |.lixonproposal.s6 This support turned out to be crucial in breaking the congres-sional logiam.
The State and Local Fiscal Assistance Act finally passed in October.1972, and one rnonth later President Nixon was overwhelminglyreelected. He then began a renewed push for the second element clf his"New Federalism" strategy: the elimination of many Great Societycategorical grant programs and their replacement by broadly definedbiock grants with power of administration more firmly vested in state andIoc;al general government bodies.37 His first step was to announce drastic
;j;r f'-eshbach, "History of Revenue Sharing": Samuel Beer, "The Adoption of GeneralRevenue Sharing: A Case Study in Public Sector Politica," Ptrblic' Polic), 24, 11o.2 (1976).
31 Richard Nathan, Allen Manuel, Susannah Calkins and Associates, Monitoring ReventreShuring (Washington, D.C.: The Brookings InstitLrtion, 1975).
3i' Nathan. et al., Monitoring Reventte Shuring; Richard Nathan', Charles Adams andAssociates, Re,yenrte Shuring: The Second Rorrnd (Washington, D.C.: The Brookings In-stitution , 1977).
'16 Dommel,'fltr: Po[itics o./' Reyentte Slturing.'t7 Edward Banfield, "Revenue Sharing in Theory and Practice,," The Ptrblic Intere,st 23
J97 tJ.
2l

)122 Publius/Winter l98l
cutbacks in many grant programs, including "impoundment" of fundsalready appropriated by Congress, claiming that General Revenue Shar-ing could be used by cities to make up for the lost grant revenues. Thus,despite repeated promise of "add-on" by the Nixon administration overthe previous four years, this, as Paul Dommel puts it, "was clearly theianguage of a policy of substitution." Big-city mayors who had previouslysupported GRS now turned around and denounced it as a "cruel hoax"and a "gigantic double-cross."38
The battle over block grants (also called "special revenue sharing") gotbogged down by the Watergate scandal, giving the constituency groupsand politicians who opposed the grant reorganization added leverage. Inthe end only two modified versions of Nixon's original special revenuesharing proposals passed Congress, the Comprehensive Employment andTraining Act (CETA) in 1973 and the Community Development BlockGrant (CDBG) program in 1974. The latter, as we argue below, involvedsubstantial redistribution of rnoney and power benefitting constituenciesto which Republicans at all levels of government pitch their electoralappeals. A smaller grant consolidation, Title XX grants to state govern-ments for s<lcial services, also passed Congress inlate 1974.
Since the ,larly 1970s, the politics of federal grants have increasinglyinvolved bargaining and conflict between governmental units rather thanamong priv.iie constituencies. In addition, the debates have focused moreon regional ci.rr{her spatial disparities rather than on functional categoriesof assistance."" ,{n indication of the first trend is the growth since the late1960s of the pii ^r,-r iltd organization of the "intergovernmental lobby"represented by groups like the National Governors' Association.a0 Thefatter trend is characterized by the recent appearance of regional lobbies,such as the Coalition of Northeastern Governors (CONEG).11
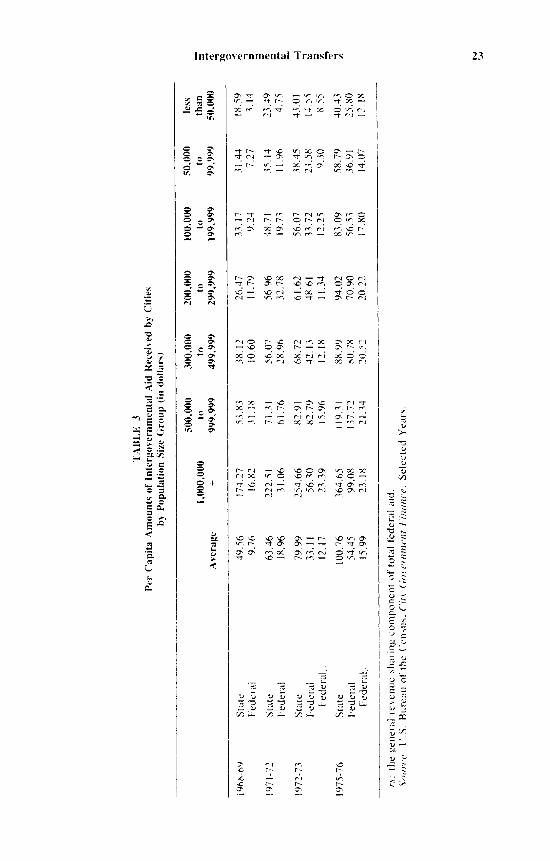
The formula era brought on by the Nixon administration, despite someserious setbacks, achieved its desired result. The net effect on cities, asnoted by one of the architects of General Revenue Sharing, RichardNathan, was "increased support for smaller city gr;vernments in generaland also for larger cities in the South and West that were not activeparticipants in the older categorical programs."n2 Table 3 shows thisclearly for city size categories. But it took only a couple of years for the
rr* Dommel, The I'olitit's o.f Reyenue Sharing, pp. 173-71.3e David Wilmoth, Regionalism and the Carter Administrution (Berkeley: University of
California. Department of City and Regional Planning, 1978).ro The seven main organizations of the "intergovernmental lobby" are the Council of
State Covernments. the National Governors' Association. the National l-egislative Confer-ence. the National Association of Counties, the National League of Cities, the United StatesConference of Mayors, and the International City Management Association.
" Neal Pierce, "Northeast Governors Map Battle Plan for Fight Over Federal FundsFlow." Nrrtional Jottrrutl, 27 Nolember 1976.
a'zRichard Nathan, "The Outlook fbr Federal Grants to Cities," in Roy Bahl, ed.,TheFiscal Outbok.for Cities (Sylacuse: Syracuse University Press, 1978), p. 80.
TA
RI
I.I 3
Per
C'a
pita
Am
ount
s of
Inte
rgov
ernm
enta
l Aid
Rec
eive
d by
Citi
esb.
v_' P
opul
atio
n S
ize
Gro
up (
in d
olla
rs)
A v
erag
eI,0
00,0
00-l
500,
000
to99
9,99
9
300,
000
to19
9,99
9
200,
000
to29
9,99
9
100,
000
to19
9,99
9
50.0
00
less
to
than
99.9
99
50,0
00
I 96
8 he
lt97
| -7
:.
1972
-V3
t97
5-t
6
Sr;
rt*
I;ecl
c rir
l
St at
e[ie
cler
al
Sta
teI''
eder
al[;e
dera
l, -
Sta
teF
eder
alF
eder
al,..
49.5
69.
76
63.4
6I ti.
e6
79.9
913
. r
l
t2. 1
7
Ir)0
.76
54.4
5l5
"99
t7 4
.21
t6.8
2
222.
5r3l
.06
254.
6656
.30
21.3
9
364.
6599
.0t1
23. l8
7r.it
6t.7
6
82.9
182
"79
I 5.
96
i t9.
l r
t37.
7221
.34
38.r
2r 0.
60
56.0
728
.96
68.7
242
.t312
. ltt
tJbi
.99
ti0.7
riIt)
" 52
26.4
7fi.
7e
56.9
632
.78
61.6
248
.6 I
I 1.
34
94.0
270
.90
20.2
2
33.t7
9.24
48.7
|t9
.7 3
56.0
733
.72
t2.2
5
83.0
956
.5 3
r7.8
0
53.
n3
31.r
831
.44
1 8.
59
7.27
3.
t4
35. 14
23
.19
I r .9
6 4.
15
3 tt.
.15
43 .
0 I
2 3.
5tt
l -1.
55
9.l0
fi.
,ss
5tt.7
9 ,4
0..1
3
36.9
1 25
. tto
1,1.
07
12.
I tt
-FI t' ar; o -! 'Q |D ": -t i f.+ ,-l n F -,3 n'
n' .l a
r,r.
' the
gen
eral
rev
enue
sha
ring
com
pone
nt
of t
otal
f'e
dera
l ai
d.\o
trr(
t, ' t
i.S"
Bur
elru
of t
he (
-ens
us,
('rlr'
(lo
rern
tnen
t F
'irttt
nce,
Sel
ecte
tl Y
ear"
s.
h.J
t,

24 Publius/Winter l98l
Democratic Congress to adapt the Nixon-initiated formulas to better ad-vantage. In July of 1976, with the national elections less than four monthsaway, the Democratic Congress overrode President Ford's veto andpassed the Public Works Employment Act of 1976. Title I of this Act, theLocal Public Works Program, and Title II, the Anti-Recession FiscalAssistance Program, combined with Titles II and IV of CETA to form the"countercyclical package." These programs also used formulas, but withvery different distributional results.
Since the strategy of the Democratic Party in the coming elections wasto blame the Republicans fbr the unhealthy state of the economy andparticularly for the high unemployment rate, the counter-cyclical pack-age, with its economic stimulus and job-creation focus, demonstrated theDemocratic commitment to a political alternative.as And since the pro-grams were all targeted to areas of high unemployment, central cities,particularly in the northeast and north central regions, benefitted substan-tially.aa President Carter, upon taking office, expanded the budget forthese programs, and further expansions were made with the passage ofthe Intergovernmental Anti-Recession Act in May of 1977. Also in 1977
Congress passed the new "dual" formula for Community DevelopmentBlock Grants, which was highly beneficial to the older central cities of theNortheast and Midwest. The net effect of these and other programs was aswing-back of federal dollars to the traditional Democratic constituencies,after the Nixon redistribution of the early 1970s.
Table 2, taken from a recent paper by Richard Nathan and extended byus back to 1965-66, illustrates clearly the three cyclical swings of thepolitics of federal grants to local government. The northeastern and mid-western cities did well in the 1960s, were eclipsed by the sunbelt cities'gains under the New Federalism, but enjoyed a significant comeback inthe Democratic surge of 1975-78.
One element of this comeback is the resurrection of a discretionaryproject grant program by HUD to take the place (on a much more modestscale) of urban renewal, which was one of the seven programs "folded-into" CDBG. Table 4 shows the distribution of Urban Development Ac-tion Grants in 1978.
Printotrt Pctlitic.s
The use of automatic formulas for the distribution of grants-in-aid tostate and local governments seems to be a steadily rising trend. Evencost-of-living increases in social security benefits. a transfer program to
'3 James Singer. Employment Rei:ort: Congress Confronts Ford Over Bills to CreateMore Jobs." ,Yutional Journul, ll October 1975.
"t General Accounting Office, Antirec ession Assistunce: Ii.S. Department of the Treas-ury, Office of State and Local Finance, ReDitrt on tlte F-i.stul Intpat.t o.l the EcorutmicStimulus Packuge on 48 Lurge Urhcn (]ot et nmt'nts, 23 Janttar_".- i978: and Advisory Com-mission on Intergovernmental Relations. Fcil':rt! .!t{r}iii:.:i/!,:r F 'lit t': I'itt flole ot' State undLotal G<t,vernmenr (Washington, D.{'.: U.S :i}::r;ii-tini.r:r fi'"ir:!i:it Cffice, 1978),

Intergovernmental Transfers
TABLE 4
UDAGs by Cities, and Dollars According to Region
,q
# of Cities # of Dollars (Millions)
NorlheastNorth CentralSouthWest
45
27
t72
t37I 16
53
60
Source: Katherine Lyall, "Targeting: Progress on the National Urban Policy," Commen-tary 68 (1979).
individuals, were tied to an automatic formula during the Republicanhighpoint in 1972.45 The concern with creation of automatic distributionformulas has generated a whole new industry for fiscal analysts, one thatwe might call "needs measurement." In the last few years a bevy ofstudies have appeared, each trying to develop statistical indices measur-ing "need" according to various criteria which would, in turn, be insertedinto formulas to target the distribution of federal grants.a6 Who shouldreceive the money, by what criteria, through what medium, for whatpurpose, and at what level of spatial or demographic aggregation, are allquestions that are hotly debated.
How can "distress" or "need" be defined? The Congressional BudgetOffice conducted a study in 1977 of the possibilities of targeting federalspending to relieve "troubled local economies," but ran up against sev-eral definitional problems. If one is concerned with the problem of lowgrowth, then the New England, Middle Atlantic, and Great Lakes statesneed the most help. On the other hand, if low income is the primary issue,then the South and Southwest, "despite relatively high growth rates ofpast years," deserve the most urgent attention.az
a5 Martha Derthick, "How Easy Votes on Social Security Came to an End," The PuhlicInterest 54 (197q.
16 Richard Nathan and Charles Adams, "Understanding Central City Hardship," PoliticalScience Quarterly 91, no. I (1976)l Nathan and Paul Dommel, "The Cities," in JosephPechman, ed., Setting Nationul Priorities: The 1978 Budeer (Washington, D.C.: The Brook-ings Institution, 1977): Nathan, Dommel and James Fossett, "Statement and Testimony,"Joint Economic Committees of Congress, Financing Municipal Needs (Washington, D.C.:Government Printing Office, July 28, 1977): David Stanley, Cities in Trortble (Columbus,OH: Academy for Contemporary Problems, 1976)l U.S. Department of Housing and UrbanDevelopment, Office of Policy Development and Research, An Evaluation oJ'tlrc Commun-ity BlockGrant Formula (Washington, D.C.: Government Printing Office, 1976); U.S. De-partment of the Treasury , Report on Fiscal Impact; John Kordalewski, Ways o.f ldentiJ-t,ingCities in Distress (Washington, D.C.: The Urban Institute, 1978)l Stephen Barro, The UrbanImpact oJ'Federal Policies: Volume 3, Fiscal Conditions (Santa Monica: The Rand Corpora-tion, 1978); and U.S. Congress, House Committee on Banking, Finance, and Urban Affairs,Subcommittee on the City, City Need and the Responsiveness oJ'Federal Grant Programs(Washington, D.C.: Government Printing Office, 1978).
az Congressional Budget Office,Troubled Local Economies and the Distrihution oJ'Fed-eral Dollars (Washington, D.C.: Government Printing Office, 1977).

26 Futrlius/ Winter 198 I
A recent report by the House Committee on Banking, Finance. andUrban Affairs lists three different ways of discerning need: (l) socialneeds, such as poverty, crime, or poor health: (2) economic decline.including relative or ahsolute loss in population. income. manufacturingactivity, or retail sales volume: and (3) fiscal problems, ranging from lowtax bases and high tax rates, to short-term cash flow problems. severehudget deficits, and near bankruptcy.as
What size and type of spirtial unit should be chosen for distribution'.)Katharine Lyall, in a forthcoming article on targeting aid to "cities andpeople in distress," lists four different recipient units fbr targetingstrategies: by city, by people. by neighborhood, and by region.Js Each oneof the measurements of need used in the House Banking Strrdy targets aidon different sets and types of cities in diff-erent parts of the United States.As we noted above" rndiv'idual need may not correlate well with spatialc haracteristics.
The l{ouse Banking Committee Report and the GAO Report both ad-vocate better understanding of urban economic evolution lrs a basis forfashioning formulas. The forrner concludes:
Better knowledge of urban dynamics-ol'cause-eff-ect relationships w,itirincities-would tacilitate the development ul- consensus on those aspects ofurban need that should be considered.;('
We question this optimism. When federal budgetary resources arerapidly expanding, congressional leaders could strike a series of com*promises on dual or multiple formulas whereby each unit of governmentchooses the automatic formula most favorable for its purposes. Such anapproach would be the ultimatc'in "spreading." with the entire range ofregional and intra-metropolitan interests in the intergovernmental aidlobby satisfactorily subsidized. But in this age of fiscal restraint, where"targeting" is the watchword. continued bitter controversy is morelikely. Groups such as the Northeilst-Midwest Congressional Coalitionand Southern Growth Policies Board are both launching extensive lbr-mula research projects and writing criticirl reports on "bias" in f'ederalprograms.
Some have bemoaned this domination of'formula grant construction by"printout politics," but regardless of sophisticated social science input.politics has been and will continue to be the determining factor in thegrant process.:" In this sense, there is nc; such thing as a truly non-
'" llouse Commiltee on Banking. Finance. and I rhan Aflairs. (-ir.y Nr,r'rl.ie Katharine Lyall, "-largeting: }'rogresr on the National I'rhan Poliel'." ('()tntn?trtilr\'
tlbrthcomingt.5') tlouse Commitlee on []irnking. Finance. and Lirhan .{tfairs. C'ilr'.\r'r''1, p. 77. See also
General Accounting ()lficc. ,.f ilircr'{,.{Jio/r A.rJl.r/(lr?( r,.f'l Rochelle Stanfield, "Playing (lomputer Politics With Local Aid Formulas." Nrttittnul
Journul, 9 December l97ti.

Intergovernrnental T'ransfers 27
discretionary grant program: it's just that some programs have more pre-dictable payout scheduies than others.
Brookings Monitoring Study. in its summary of the history of revenuesharing, points out that printout pr;litics was an integral part of the processfrom the beginning. In July ol'1970, lbr example. Assistant Secretary ofthe Treasury Weidenbaum held a press conference releasing a "com-prehensive statistical report on how much each individual recipient juris-diction might expect to receive under the administration's revenue-sharing plan."5r'ilhis direct appeal to statc and local pocketbooks re-;eived more exl.ensrve media coverage than previous announcementsabout the philosophy of the New Federalism. Similarly, when the billwasin the Flouse Ways and Means Committee, Deputy Treasury SecretaryClharles Walke r made available a technical staff and computer facilities sothat each ne$ rn{rdificaticn of the firrmula could bc' immediately tested forits political ccusequences."'l
f)ne of the authors of this paper had her own experience with thepolitics of tbrmula grant writing. In 1971, the city of Detroit faced impend-ing fiscal crisis. 'Ihe mayor appealed to the state legislature to find ameans of channeling more state revenue to the city. The unearmarkedportion of existing state shared revenues was alk:cated on the hasis ofpopulation. Markusen, then Staff Economist for the Speaker of theHouse, wrote a new formula incorporating indicators clf per capita taxbase and tax effort. 'fhe formula would have ailocated significantly moreto Detroit, the city with the highest locir! tax rates. Suburhan-jurisdictionsand srrme rural area-u w*r,!I l:lle iost in r:cntparistn since no iidditir-lnal{'evenu{-r! were fi.r[]{.x:c.d. i'he Micitt96n tr!rini:ipal l-eague" representingfhc r:ntii* -i!'r;ly (ri ciiy t-:r.rvernrnents. ci:iintcred by proposing that $-50
miiiion more ire added t{} the tund. nor to advance Detroit's interests tlitio erlsure thiit no city gol'ernrnenl wrrLri'i"i lose . As the battle shaped up, thestaff was rerluired to prcduce city-Lry-city tallics. lbr all I lLi iegislativedistricts, fbr i-, n.r.vriall crf i'ariatir;ns on the tirrrnula. Llltimately. through aprocess of bargaining ,r;rd increniental lilnel increases, tlre Speaker'srighthand man prodticeci a set of rri.:cpial"rle dollar amount\ lry crty anddistrict which rvould win the nr:cessiri-v -57 votes in the House. The staffwiis handerl this tlnul l;rlii.' shec:t and asked to produce a new lbrmulawhich would result in these alLrcations. This proved iiterally impossible,urtless each distr;ct were to l"re represcrrterl hy a dummy variable in thetbrmtrla. The bill u'hrch finallv liassed cont:rined a tax effbrt fbrmula witha series of ingenior"isly constrlrijted grandfalhering provisions, and anextra $23 million.
The politicai fight over the detelmination of the various formulas has
i)2 l{at}:an et tl ". iv{ttrtttlry'lti{ {lti r:;r;;r' ,\ilririrt,* f,. l5r: and Silui t i"ier.iman, "Cities ll't-uldG*t t.{:ast tir:der l$ixr:n }}lnn'" ili'tt'ttit Frr't,Prt,.t.t, } Lfal"u:h l97nt
;rr hiathan et iii .^ 14r:ttitry"trt{ jr'E t {iltrl. .\/ir;r'iirr. ir. jh.';.

28 Publius/Winter 1981
now begun to spill over into considerable controversy over the gatheringand interpretation of the data on which the formulas are based. Whereas,in 1970, $16 billion in federal aid to state and local governments was basedon U.S. Census Bureau data, in 1980 roughly $50 billion is at stake.Similarly, the amount of federal aid dependent on unemployment statis-tics has risen from about $700 million a year in the early 1970s to $17billion in 1977. A recent change by the Bureau of Labor Statistics in theway it calculates local unemployment rates resulted in the loss of millionsof dollars in federal anti-recessionary assistance by 10 large cities lastyear.54 The specter of large gains and losses by state and local govern-ments has hung heavily over the work of the National Commission onEmployment and Unemployment Statistics. Precisely because the stakesare so high, the commission has thus far been very cautious about propos-ing any major reforms.s5
Similarly, the Census Bureau has been surrounded by controversy oflate, including the resignation of its director and the retirement or resigna-tion of other key officials.56 One example of the bureau's political prob-lems concerns the case of Paterson, New Jersey. The city of Patersonrecently pioneered a new technique of conducting its own head count. Itscensus resulted in substantially greater population figures than the CensusBureau's because it included illegal aliens and people living in illegallyconverted dwellings and because it canvassed minority neighborhoodsquite carefully. The city then convinced the bureau to accept its methods,resulting in a l3 percent increase in population count for Paterson and anextra $1.2 million in federal grants. This approach appeals to both sunbeltand frostbelt cities; New York, Dallas, Newark, and Denver have allrequested copies of Paterson's survey techniques. The Census Bureauhas tried to adjust to the political heat by announcing that its 400 districtoffices will have staff authorized to consider instant appeals from localpublic officials should they be unduly displeased with their 1980 censuscount.57
Given that so many federal grant programs now depend on censuspopulation data, with a modest flight of fantasy we can well imagine thepresident and OMB one day deciding how much aid each state and localgovernment should receive and then directing the Census Bureau to ad-just the population figures to produce the correct amount of aid under the
sa Rochelle Stanfield, "Federal Aid for Cities-Is It a Mixed Blessing?" Nutional Jour-nal, 3 June 1978.
5t James Singer, "Big Money at Stake in Refining Unemployment," Nutional Journal, 6January 1979: and Urban f.ehner, "Method of Computing Jobless Rate Faces RelativelyFew Shifts Atter 2-Year Study," Wull Stcet Journul, -5 February 1979.
56 "Troubles Multiply for the 1980 Census," Business Week, 26 February 1979: and"Counting the House," Wall Street Journal, 9 February 1979.
57 Byron Klapper, "Finding the Bodies: Cities Challenge Population Count," Wall StreetJournal.2T December 1978. o. 10.

Intergovernmental Transfers 29
variou s congressional formulas. Geographically-based congre ssional coal-itions might then counterattack by passing laws mandating new surveytechniques. Social scientists, of course, will throw up their hands indespair and long for the days of the categorical grant programs.
Community Developntent Block Grunts
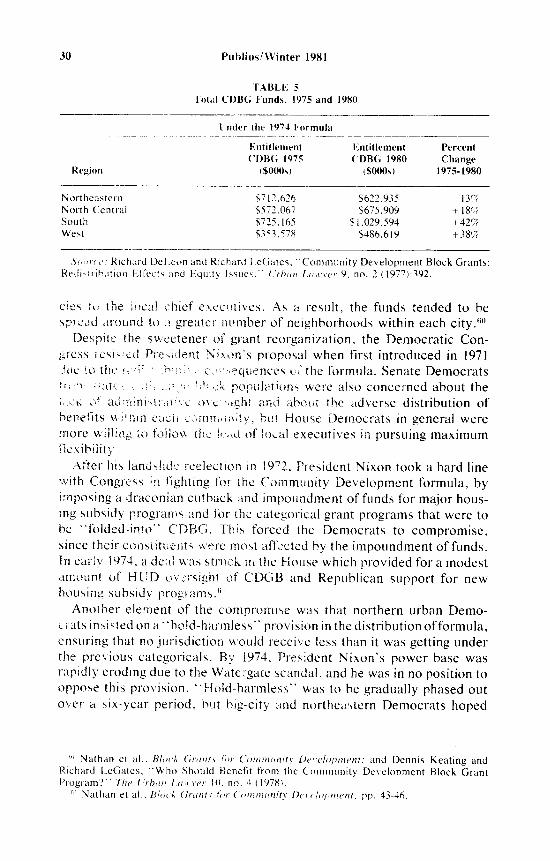
The Housing and Community Development Act of 1974 grew out ofPresident Nixon's "New Federalism" political strategy. The president'sprimary goal was to wrest control of several categorical programs fromthe HUD bureaucracy in order to spread the funds to a much larger groupof local government recipients. He proposed combining seven categoricalprograms into one single block grant to be distributed to eligible localgovernment jurisdictions by an automatic formula. Urban counties wereincluded in the program due to the increasing power of the suburbanlobby.58 The formula redistributed community development funds awayfrom the New England and Middle Atlantic states and toward the south-ern and western regions (see Table 5). In addition, many more local juris-dictions (4,800) were included in the formula than had previously bene-fitted from the seven categorical programs. Smaller jurisdictions gained atthe expense of central cities under the Nixon formula.
The "New Federalism" also made a direct appeal to big-city Democra-tic mayors. The Nixon administration promised to reverse the growth offederal legal requirements and administrative oversight procedures in theurban renewal and Model Cities programs that had been mandated byCongress and HUD in direct response to the black ghetto riots of 1964-68.President Johnson and the Democratic majority in Congress had moved tocorrect past abuses in urban renewal programs by requiring project areacommittees and adequate housing and small business relocation assis-tance. Model Cities went even fufther by requiring the local agency to usethe federal money to directly benefit residents of low and moderate in-come neighborhoods.5e Such restrictions were unpopular with the mayorsand city managers. Nixon's proposal to distribute federal block grants byautomatic formula that could be spent by local governments in a relativelyunrestricted fashion, with no requirements for local matching funds, andvirtually no federal oversight, greatly appealed to groups like the NationalLeague of Cities and U.S. Conference of Mayors. The CDBG programredistributed power from the local redevelopment and Model Cities agen-
t" Richard Nathan et al., Block Grants.lbr Commtrnit,- Development (Washington, D.C.:U.S. Department of Housing and Urban Development, 1977) pp. 46-49.
i'" National Commission on [Jrban Problems, Building the American Clr.v (Washington,D.C.: Government PrintingOffice, 1969) pp. 152-198: Chester Hartman, Yerha Bttenu (SanFrancisco: New Glide Publications. l97a)l and Bernard Frieden and Marshall Kaolan. I/rePolitit.s o.f Negleet (Cambridge: M.l.T. Press, 1975).
30 Puhrlius/Winter l98l
TAtsLE 5
Tuta! CDBG Funds. 1975 and l9tl0
I nder the 1974 Formula
Region
Irntitle ment{'l)BG 1975
($000s)
lintitlement PercentCDBG 1980 Change
t$000s) 1975-1980
NortheasternNorth L-entraiSouthWest
b7l2 .626$572.067$725. 1 65
$353,579
$622.935s675,909
s i ,029"594$496,619
- 13%
+ l8c;(+42%-r -78V:
Sortrce: Richard DeLeon and Richard l-eGates, '"Community Development Block Grants:Redirtrihtrticrn Effects and Eouitv Issues." Urhun Lax'yer 9. no. 2 (19'171:392.
cies to the locai ;hief erer:rrtives. As a result, the funds tended to bespread around to n greatcr number of neighborhoods within each city.60
pg-spite the swcetener of grant reorganization. the Democratic Con-gress resirtcd Presiilent Nix'rn's proposal when first introduced in l97l'Jue !o the r.':r,li ' :hu{i..'; Ciilrsequences uithe formula. Senate Democrats!l 611 ,:r,;i1Eq r ;il, ;.ll-:tr.: bfack populations were also concerned about thei,,rii ilf'adrrinirtrattv(: ovctti.ght and aborrt the adverse distribution ofbeneflts witnin eirsh eiinnlunity, but House Democrats in general werernore willing to fbilow tlre lc;.d of local executives in pursuing maximumfiexibility
Atler his lani.Jslid:: reelection in 1972, President Nixon took a hard linewith Congress in fighting tor the Commrrnity Development formula, byimposing a draconian cutback and impoundment of funds for major hous-ing subsidy program\ and for the categorical grant programs that were tobe "folded-into" ClDIlG. This forced the Democrats to compromise,since their constituenti were mosf affected by the impoundment of funds.In earf v 1974, a deal was stnrck in the House which provided for a modest:rmount of HUD ovrrrsight of CDCiB and Republican support for newhousing subsidy programs.6'
Another elernent of the compromise was that northern urban Demo-crats insisted on a "hold-halmless" provision in the distribution of formula,ensuring that no jurisdiction r,r,ould receive less than it was getting underthe prel'ious categoricals. By 1974, President Nixon's power base wasrapidly eroding due to the Watcrgate scandal, and he was in no position tooppose this provision. "Hold-harmless" was to be gradually phased outover a six-year period. but hig-city and northeastern Democrats hoped
60 Nathan et al., Bkt<'k (irunt.s ior Oom*trtrtity Developntent;and Dennis Keating andRichard L.eGates, "Who Should Benefit from the Community Development Block GrantProgram?" Tlrc Urbun Lu*yer 10, no.4 (1978).
6f Nathan et al., Bitxk (]runt.s.llry Contntrrnit,- Derel,tlrnrent, pp. 43-46.
Intergovernmental Transfers
that the 1974 and 1976 elections would revive their political fortunes sothat they could change the formula.
Ironically, by the time CDBG actually passed Congress in August of1974, President Nixon had already resigned under threat of impeachment.tsut by then all the deals and commitments had already been made. Thepressures from the various lobbying groups of local government officialsto start the money flowing were too great for any major last-minutechanges to be considered. As a result, all eyes turned to the anticipatedbattle over congressional renewal of CDBG in 1977 .
The redistributive effects of the CDBG formula are well documented inthe Brookings Study.62 Deleon and LeGates, in a study of Californiacities, discovered an interesting political pattern that accompanied thegeographical shift. Not only did the CDBG redistribute funds towardeconomically better-off communities, but those communities who had thegreatest net relative gains from the new program also tended to have themost politically conservative electorates and the least favorable attitudestowards construction of low income housing or racial integration of hous-ing. In the politics of automatic formula-writing, conservatives definitelywon the first round.63
Deleon and LeGates also noted shifts in the area of decision making"dramatically away from the federal-local government-sublocal govern-ment authority-neighborhood organi zation model" to local chief execu-tives and general government bodies.64 In other words, both communitygroups and local bureaucrats in some categorical agencies lost part oftheir power base in the changeover from a federal to a local allocationprocess. It has taken several years for these groups to recover theirstrength after the initial setback.
While the full implications of the changes brought about by the CDBGformula were softened by "hold-harmlesS," social scientists responsiveto the concerns of the losers immediately set about developing normativecriteria and statistical measurements of "need" so that arguments couldbe made for a reallocation of funds. Again, both the Brookings Study andthe Deleon and LeGates Report are examples of these efforts, ?S waswork that was conducted in HUD's Office of Policy Development andResearch.65 The old formula, based on equal weights for population andovercrowded housing and a double weight for poverty, was seen to bedeficient because it rewarded growing rather than declining areas, andbecause the overcrowded housing and poverty criteria primarily bene-fitted the South. Since many people in policy and research positions felt
62 lbid.63 Richard Deleon and Richard
ing J'or CommunitT- Developmenternmental Studies, 1976).
61 Ibid., p. 31.65 U.S. Department of Housing
LeGate s, Redistrib ution EfJ'ect s o.f' S pec, ial Ret, enue S hor-(Berkeley: University of California. Institute of Gov-
and Urban Development, Eyuluation o.f Contmunity.
31
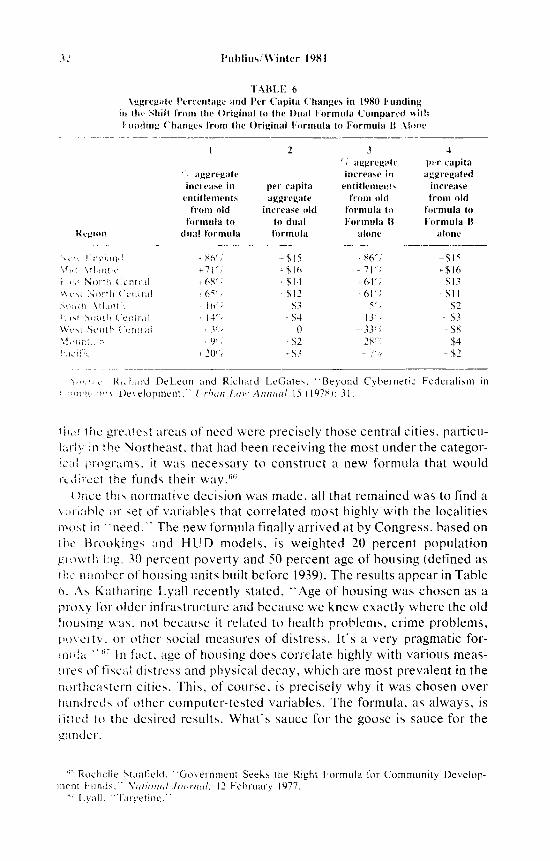
}''' Publius/ Winter 198 I
.T'ABLF, 6
.\ggregat'e Percentage and Per C-apita Changes in 1980 Fundingin tlir: Shift from the ()riginal to the Dual F-onmula Compared withl'unding Changes from the {)riginal Formula to Formula B lhr$t'
Itrginn
I
-: aggregateincrease in
cntitlementsfrorn old
frlrnrula todrual formula
1L
per capitaaggregate
increase oldto dualformula
Jr:' aggregateincrease in
entitlemenf -c
from oldformula toF-ormula B
alone
A+
prr capitaaggregated
increasef'rom old
formula t<l
F srrmula Balone
'.,-t:'.; !:tigi;Ftujfulrti \fl;rntr'-'i 1r".1 Nr.n'Iir (-enti"rl\t'rrl liiri'1lr {-rnlt"itl:ir'rltii \ti,inti,-i r-tr ltrrlllr {.;l;i:';tiW*si 5t:itt h i'cnt r;ri\tiiiiiii..li*ii';lt: I i'ir
* 86'',17 \.;+ 68r;r- b.i'' Ii l6'l, 14(;
1/-'+-1 /
t9( t
+ 20('i
*$15* $16*$14- $12-53+s4
0-f s2*s3
+ [t6ei7lr,i
t64c;t6l{-i
5';13.';
--33., {
- 28(;-- i' /{
+$1-s
+$16+$13r-$11
__$2
-$3-$s-$4'-s2
\ii{,ir {""' H,,r}irrld DeLetln and Richard LeGates. "Beyttnd Cybernetic Federalism ini {rrrrniri;ri.*' lJerelonment." [ :rbun I.rtv' Anntrul 15 ( 1978): 31.
f ir.rr tlr* grea{rst areas of need were precisely those central cities, particu-iliri_-v in the l\ilrlrtheast. that had been receiving the most under the categor-ical ilrilEr"irrns, it wrrs necessary to construct a new formula that wouldrc.tirect the funds their way.66
{irice this normative decision was made, all that remained was to find a\';ir"inhlc {}r set of r,'ariables that correlated most highly \r,ith the localitiesrnc':;t in "'need." The new l'ornrulaflnally arrived at by Congress,, based onf hr: [] rot'rkings ;rnd H LrD models, is weighted 2A percent popLllation
F.r{}v*lt}l i;rg- -10 percent poverty and 50 percent age of housing (defined as
tirr" nrintl"rer ot'housing units built before 1939). The results appear in Tablef!. ,\s Katharine l-yall recently stated, '"Age of housing was chosen as apr-oxy for older infrastructure an{l bec:ause we knew exactly w'here the oldhousing was, not because it related to health prohlems, crime problerns,
[]r]\'crt!,',, (Jr clther sc-lcial measures of distress. It's a very pragmatic for-rrlul' ." 67 ln fue t, age of hoLrsing does correlate highly rvith various meas-irr*s of fiscill distr"ess and physical decay.,which are most prevalent in theffi*r'theastern cities, This, of course, is precisely why it was chosen overhuntlrerls ol' other computer-tested variables. The formula, as always, is
t'itfeil tu the desired results. What's sauce for the goose is sauce fclr thegilnder""
*;'i Rocl"rcllc Stanfleld. "Governmeni Seeks the Right Formula for Community Develop-lr{'nt [jrrn.-ls.'' .Vrr/lottul .lottrnul, l2 Fetl'uary 1977 .
*'; [,y,all. "'fargeting. "
Intergovernmental Transfers 33
The new CDBG allocation formula was passed as a "dual" formula,meaning that communities could choose whichever of the two gave themmore money. Of course, should the overall level of funding be reduced,such political compromises eventually mean less for everyone, so that thebeneficiaries of the old formula can still be relatively worse off as a resultof the "add-on."
Political coalitions organized on explicit regional lines have emerged asanother significant feature of this particular formula fight.68 While federalprograms have always had skewed spatial distributions, the political con-stituencies advocating or opposing them have more often tended to beorganized around functional or programmatic issues. The CDBG fight cutacross many traditional levels of interest group identity. The battle wasbilled primarily as "frostbelt" v. "sunbelt." The Northeast-MidwestCongressional Coalition in the House acted as the mobilizer of forcesdefending the new formula against an amendment to retain the existingformula. The two California Democratic congressmen who introducedthe amendment both represented districts which were net gainers underthe 1974 formula.6e Northeast-Midwest solidarity plus a fair amount oflegislative horse-trading carried the day, and the "dual" formula passed.However, the price of this victory has been a virtual declaration of war bythe Southern Growth Policies Board on any future formula debates.T0 Inparticular, they are attacking the age-of-housing indicator and the push forincorporation of regional cost of living differentials.
The effects of the formula change are substantial for particular cities.St. Louis, for example, would have received $17.1 milhon in FY 1980under the old formula. Under the new CDBG formula, ii will receive $36.8million. But the real question is not how much money any particularjurisdiction is receiving, but how that money is being spent. Here therecord is mixed. Among the most publicized abuses have been Commun-ity Development funds used to build swimming pools, golf courses, andtennis courts. More importantly, municipalities and urban counties have,in many cases, instituted their own local versions of "spreading,"whereby the funds are redistributed to more favored and powerful con-stituencies than the poor.71
68 Markusen, "Urban Impact Analysis."6s Havemann and Stanfield, "A Year Later," p. 1031; Deleon and LeGates, Redistribu-
tion Elfects.70 An example ofthe ferocity ofthe regional formula fights is the speech given by Gover-
nor George Busbee of Georgia to the White House Conference on Balanced NationalGrowth and Economic Development (January 31, 1978). Referring to the 1977 "dual" for-mula for CDBG, Governor Busbee stated "When this formula was passed into law, theSouth had no coalition to counter the efforts of the six active coalitions of the North. AWashington newspaper rubbed salt into the wound by telling us what we belatedlydiscovered-that the South had been caught with its eyes closed and its britches down."Wifmoth, Regionalism, p. 18.
7t Keating and Lecates, "Who Should Benefit."

34 Publius/Winter 1981
Such a pattern has led HUD to impose new regulations beginning inMay 1978 which require CDBG recipients to spend 75 percent of theirCommunity Development funds for the benefit of low and moderate in-come people. How "benefit" is precisely measured is a difficult question.Thus far, HUD's solution is to focus on the income level of the residentsof the census tract in which the money is spent. This criterion still doesnot adequately identify the income level of the ultimate beneficiaries.T2But it is a step in the right direction, for at least it is a recognition of thereal problems. Just because New Orleans has a large number of poorpeople does not mean that those people benefit from the formula whichsends federal funds to their city, any more than the fact that Philadelphiahas a lot of old housing means that the housing stock will improve as aresult of block grant allocations or that people currently living in badhousing will benefit. Local governments are becoming so dependent onfederal funds that efforts to obtain a larger share have overshadowedconcern for the purposes for which the funds should be utilized. Moresocial science research and political activity should be directly addressedto this aspect of fiscal behavior.
THE FUTURE OF INTERGOVERNMENTAL POLITICS AND RESEARCH
Continuing intrametropolitan and interregional demographic changeshave combined with the new anti-inflationary mood of public fiscal auster-ity to produce a situation in which the Democratic upswing of the coun-tercyclical era has now come to a close. The CDBG formula fight mayhave been a last hurrah for the central cities of the Northeast. Last year inCongress attempts to renew the countercyclical programs were defeated,partly due to opposition from southern congressmen who felt that theemphasis on the rate of unemployment in the distribution formulas dis-criminated against their region. And despite his announcement last year ofa "national urban policy," President Carter's proposed budget for 1980indicates a major shift from previous priorities of urban aid. It wouldappear that we are now on the crest of a fourth upswing, a frostbelt/sunbelt free-for-all the outcome of which is hard to predict. Caraley haspointed out the extent to which increasing suburbanization of the popula-tion weakens the commitment of Democratic congressmen, senators,and presidents to aiding central cities, "hardship indexes" not withstand-ing.73 One of the issues in the controversy over the 1980 Census is the factthat reapportionment in the early 1980s will bring political changes thatcould cost state and local governments millions of dollars, depending onthe formulas.
''Targeting" transfers to spatial units, regardless of how much the dataimprove (and nearly all researchers agree there are massive data prob-
72 Ibid.73 Caraley, "Congressional Politics. "

Intergovernmental Transfers 35
lems) or the formulas are refined, is not necessarily any better than"spreading" in addressing needs of people rather than places. Determin-ing which jurisdiction or place receives the money does not really addressthe question of who benefits from intergovernmental transfers. To answerthis question we need to know much more about how the money is actu-ally spent, the direct and indirect impacts of the expenditures, interactionwith other tax, spending and regulatory efforts and with private sectordecisions; and physical, demographic, and income effects. One plannerrecently stated that "redevelopment, after all, was often targeted at poorpeople, like a gun pointed at their head."7a Knowing which region,SMSA, city, town, or even neighborhood the funds flow to does not tellwhich people gain from the use of that money, which people lose, andhow.
The current chairman of the Council of Economic Advisers, CharlesSchultze, wrote several years ago that federal grant programs would be"significantly improved" if "federal control over who got the benefitswere maintained or even intensified in selected cases."75 Schultze addsthat an important reason for pursuing this course of action is to assist localpublic interest groups in their battle for more equitable distribution ofexpenditures. Whether the efforts are federal or locally-based, the politicsof federal grant formula redistribution must be supplanted by the politicsof genuine economic redistribution. Putting their "needs measurement"skills to use in assisting this latter task is something that fiscal expertshave not done often enoush.
7' Roger Montgomery, Personal Communication with the Authors, Department of Cityand Regional Planning, University of California, Berkeley, 26 February 1979.
75 Charles Schultze, "Federal Spending: Past, Present, and Future," in Henry Owen andCharles Schultze, eds., Sel/ing National Priorities: The Next Ten fears (Washington, D.C.:The Brookings Institution, 1976) p.369.