whitepaper | t led led basics -...
TRANSCRIPT

WhitePaper | T LED
LED Basics

LED is a semiconductor based light source which significantly differs from con-ventional light sources. Unlike conventional luminaires where light is produced by a filament or gas, LEDs are tiny electronic chips made of specific semiconductor crystals. This principle of light generation offers many advantages and new oppor-tunities.
The main advantages of LEDs include long lifetime, high efficiency, environmental friendliness, good colour rendering and a wide variety of design options.To make use of its full potential, light designers must be familiar with these new and specific characteristics of the LED. This document explains the most important concepts, techniques and possibilities.
IntroductionLight Emitting Diode

32
The light generated by an LED module can be described by its parameters colour rendering, colour temperature, chromaticity coordinate and colour consistency. The following section explains the relation and differences.
Colour renderingThe Colour Rendering Index (CRI) is a measure that describes how well a light source reproduces the different colours of an illuminated object. The CRI is determined using a reference colour chart with 14 standardized test colours. Depending on the deviations between the secondary spectra and the test colours, the light source is assigned to a particular CRI. If the colours are reproduced badly, the deviations are large and the CRI is low. With good colour rendering the deviations are small and the CRI is high.
The maximum value of the CRI is 100. This corresponds to a colour rendering without any deviation. Sunlight has a CRI of up to 100, a white LED lies between 70 and 98. For practical use, this means that LED lighting units with a higher CRI reproduce the illuminated colours more naturally and more pleasing to the human eye. In certain applications (e.g. the lighting of works of art in museums), this point is of crucial importance.
Parameters to determine the light colourThe different colour spaces of light
Planckian locus with the prevalent colour temperatures within the chromaticity diagram
0
0.1
0 0.1 0.2 0.3 0.4 0.5 0.6 0.7 0.8
0.2
0.3
0.4
0.5
0.6
0.7
0.9
X
0.8
Y
Planckian locus
Neutral white4,200 K
Warm white3,000 K
Daylight white6,500 K
Colour temperature The colour temperature is a measuring unit that describes the colour of a light source. It is measured in Kelvin (K). The most common luminaires have colour temperatures below 3,300 Kelvin (warm white), between 3,300 and 5,000 Kelvin (neutral white) or above 5,000 Kelvin (daylight white).
The colour temperature is determined by comparing the light source with the colour of a black body radiator. This is an idea-lized body which absorbs all light and has no reflected radiati-on. If a black body radiator is slowly heated, it passes through a colour scale from dark red, red, orange, yellow, white to light blue. The colour temperature of the light source is the tempe-rature in Kelvin where the black body radiator shows the same colour. If you transfer the different colours of the black body radiator into the chromaticity diagram and connect them, you get a curve which is referred to as “Planckian locus” or “Black body curve”.

Chromaticity coordinateThe chromaticity coordinate defines a colour by its coor-dinates within the chromaticity diagram. There are three coordinates (x, y, z). Since the sum of all coordinates always equals 1, two coordinates are sufficient to locate a colour. The chromaticity coordinate allows for a more precise definition of colour than the colour temperature. It can be used to specify a desired colour or to designate undesired deviations between colours. This is specifically important in areas where the lighting must produce a specified and uniform colour and deviations can impair the visual appearance of an installation.
Colour consistencyThe colour consistency describes the maximum deviation from a target colour. Its unit is called “SDCM” (short for “Stan-dard Deviation of Colour Matching”). The SDCM value refers to the chromaticity diagram and the MacAdam ellipses.The MacAdam ellipses are named after their discoverer and highlight areas within the chromaticity diagram in which hu-mans can perceive no differences in colour. Different levels of MacAdam ellipses are also used to classify colour deviations. MacAdam1 would be a very small ellipse with a narrow range of different colours. With increasing numbers (MacAdam1, MacAdam2 etc.), the ellipses and the differences between the colours become greater.
SDCM1 or MacAdam1 thus means that the colour deviations of an LED module must be within a MacAdam1 ellipse around the defined chromaticity coordinate. A larger deviation with a chromaticity coordinate outside the MacAdam1 ellipse (but within the next larger MacAdam2 ellipse) would lead to a classi- fication as SDCM2 or MacAdam2. Colour deviations in the range of SDCM1 are practically imperceptible to humans. A value of SDCM3 represents a good compromise and has established itself as a kind of standard.
Definition of the colour temperature neutral white by the x and y coordinates (x=0.38; y =0.38) within the chromaticity diagram
Chromaticity coordinate of the colour temperature neutral white (x=0.38; y=0.38) with the MacAdam ellipses SDCM3 and SDCM5
Practical exampleColour-related specifications from the data sheet of a Tridonic LED module:Colour temperature (2,700 K), chromaticity coordinates (defined by the x=0.463; y=0.420 coordinates), colour consistency (SDCM3), and a graphical representation of chromaticity coordinate and MacAdam ellipse.
0
0.1
0 0.1 0.2 0.3 0.4 0.5 0.6 0.7 0.8
0.2
0.3
0.4
0.5
0.6
0.7
0.9
X
0.8
Y
0.38
0.38
Neutral white 4,200 K
0.4000
0.4050
0.4100
0.4150
0.4200
0.4250
0.4300
0.350
0.4400
0.4450
0.4500
0.4550
0.4600
0.4650
0.4700
0.4750
0.4800
0.4850
0.3550
0.3600
0.3650
0.3700
0.3750
0.3800
0.3850
0.3550
0.3600
0.3650
0.3700
0.3750
0.3800
0.3850
0.3900
0.3950
0.3900
0.3950
SDCM3SDCM5
54
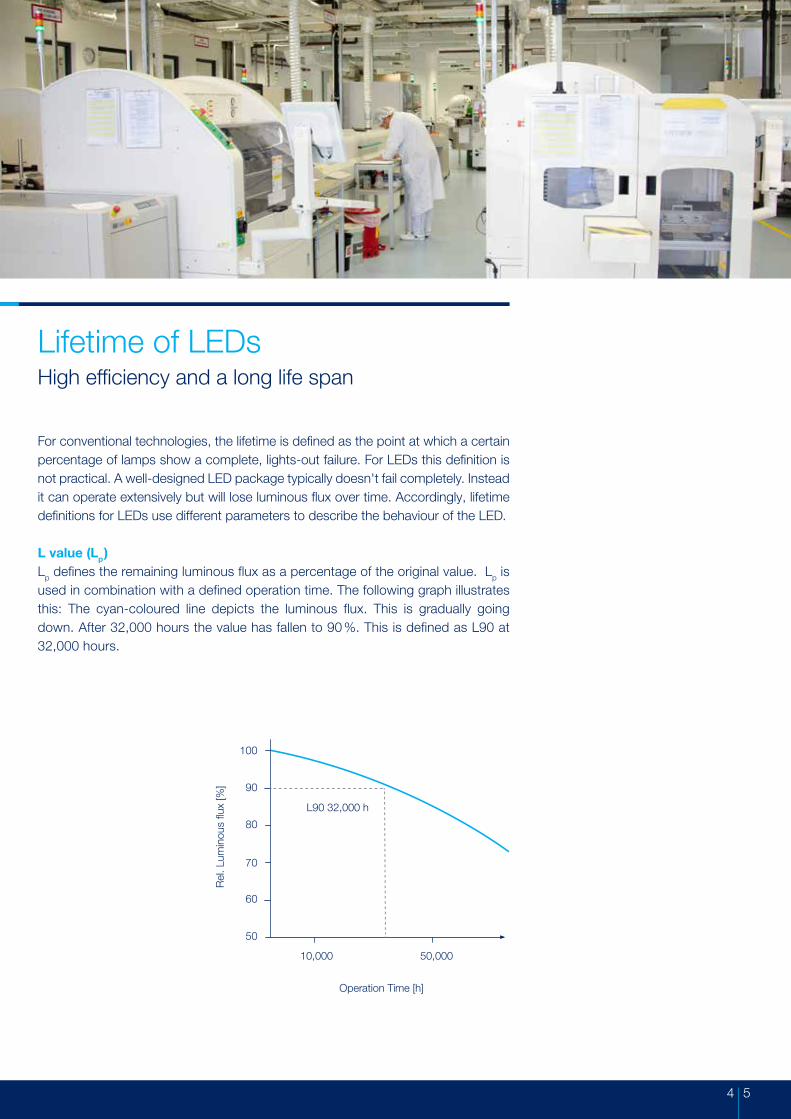
Lifetime of LEDsHigh efficiency and a long life span
For conventional technologies, the lifetime is defined as the point at which a certain percentage of lamps show a complete, lights-out failure. For LEDs this definition is not practical. A well‐designed LED package typically doesn't fail completely. Instead it can operate extensively but will lose luminous flux over time. Accordingly, lifetime definitions for LEDs use different parameters to describe the behaviour of the LED.
L value (Lp )Lp defines the remaining luminous flux as a percentage of the original value. Lp is used in combination with a defined operation time. The following graph illustrates this: The cyan-coloured line depicts the luminous flux. This is gradually going down. After 32,000 hours the value has fallen to 90 %. This is defined as L90 at 32,000 hours.
10,000 50,000
Operation Time [h]
L90 32,000 h

10,000 50,000
Operation Time [h]
10,000 50,000
Operation Time [h]
B50
B10
B value (Bp )In real life the luminous flux cannot be described as a single line. There are devia-tions between different LED modules. The following graph illustrates this: The cyan- coloured line depicts the luminous flux of some of the LED modules. The light blue area shows the bandwidth of all LEDs. Some LEDs have values above, some below.
Bp defines the percentage of LED modules that fail to achieve the specified Lp. With a lower Bp the demands for lifetime get higher. For a complete assessment of an LED module both values, Lp and Bp, must be considered equally. The following graphs show the behaviour for two typical values: B50 and B10.
50 % of LEDs with a remaining luminous flux above the L value
50 % of LEDs with aremaining luminous flux below the L value
90 % of LEDs with a remaining luminous flux above the L value
10 % of LEDs with a remaining luminous flux below the L value
10,000 50,000
Operation Time
[h]
L value

76
Combination of Lp and Bp
The combination of Lp and Bp can be seen in the following graph. It shows two possible descriptions for the same behaviour, depending on what was chosen as initial value.
When combining L90 B50 32,000 h, 50 % of the LEDs have a remaining luminous flux that is less than 90 % of the original value after 32,000 operating hours.When combining L90 B10 24,000 h, 10 % of the LEDs have a remaining luminous flux that is less than 90 % of the original value after 24,000 operating hours. There are two more values.
C value (Cp )Cp depicts the percentage of total failures.
F value (Fp )Fp depicts the combined failure fraction. This is the combination of both gradual (Bp) and total failures (Cp).
Energy efficiency of LEDs LED luminaires are very energy efficient. Compared to T5 or T8 fluorescent lumi-naires, they need 40-60 % less energy when creating the same level of brightness.The energy efficiency is defined as the quotient of the luminous flux emitted and the electrical power. The measured initial luminous flux is divided by the measured initial input power. The energy efficiency is given in lumens per watt (lm/W). Energy efficiency should always relate to the system as a whole and clarify which tempera-ture was chosen as reference. The temperature strongly influences energy efficiency. For realistic results a reference temperature of around 65 °C should be chosen since this corresponds to the temperature in operation.
90 % of LEDs with a remaining luminous flux above the L value
10,000 50,000
Operation Time [h]
L90 B50 32,000 h
L90 B10 24,000 h
B50
B10

Different LED layoutsChip on board (COB) and Surface mounted device (SMD)
There are two main techniques for mounting LEDs to the surface of a printed circuit board. Chip on board technology means the different components of the LED (chip, fluorescent converter, wire bond) are built together on the printed circuit board. SMD technology means the different components of the LED are pre-fabricated. The unit is soldered to the printed circuit board as a whole.
The decision as to which of the two technologies is used mainly depends on the proposed application. Typically SMD is more often used for area modules whereas COB is used for spot modules. Another factor is production costs. COBs are more complicated and more expensive to produce. This disadvantage is levelled out by better qualities in terms of thermo management and luminous density.
Surface mounted device technology (SMD)SMD LEDs are designed for automatic population of circuit boards and extremely low-profile and narrow modules. En-capsulated SMD LEDs are fixed directly onto the circuit boardwith adhesive. Electrical contact is made in a solder pot. These components meet the requirements of general lighting appli-cations such as the quality of light and thermal management.The disadvantage of this technology is that the packaging andsolder increase their thermal resistance. What’s more, the packing density on the LED chip is less than can be achievedwith COB technology.
Chip on board technology (COB)In the case of chip on board technology, “naked” unpackagedsemiconductor chips, known as “dies”, are attached directly to the circuit board by means of an adhesive with high thermal conductivity and connected to the pads on the circuit board via “wire bonding”. Gold wires with cross sections in the micrometre range are used for making electrical contact. The open parts are covered with a potting compound to protect them from mechanical exposure and pollution. For this, the so-called dam and fill technique is used. First, a dam is drawn around the components with a viscous fluid. Subsequently, the intermediate space is filled with a liquid, which hardens afterwards.
Board Pad
Bond wire (Al, Au)
Chip Pad
LED (blue)
PCB
Thermal glue
Phosphor fill up
Dam
SMD Housing
Phosphor fill up
Reflector
Bond wire
SMD connectors
Thermal Resitor
Thermal glue
LED (blue)
PCB

98
LEDs can be easily dimmed by reducing the forward current flowing through the LED. To achieve this, two different techniques can be applied: Analog dimming and pulse width modulation (PWM).
Analog dimming means that the amplitude of the forward current is lowered. When using pulse width modulation, the amplitude remains constant but the current flow is interrupted in the rhythm of a particular PWM frequency. The longer these inter-ruptions are, the lower the effective average current through the LED is and there-fore the perceived brightness.
Dimming of LEDsAnalog dimming and pulse width modulation
Analog dimming with different dimming levels
Dimming by using pulse width modulation
t
I
t
I
t
I
t
I
t
I
t
I

The two methods, analog dimming and pulse width modulation, have their specific advantages and disadvantages.
In analog dimming, shifts in the chromaticity coordinate or differences in the light output between different LEDs can show. However, these limitations only occur at low brightness levels, are the same for all LEDs and are imperceptible for humans.Pulse width modulation is generally less efficient than analog dimming. These effi-ciency problems mainly show at high brightness levels. Also, in order to avoid visible flicker the chosen PWM frequency must be high enough. Typically, 200 Hz or more are an acceptable value.
Both methods can also be combined, for example in the form that they are used for different ranges of brightness levels.
Combination of analog dimming and pulse width modulation
t
I
t
I
t
I

1110
Zhaga is a consortium, initiated in 2010, which takes care of the needs of LED lighting and its standardization. It is active worldwide and has more than 194 member companies (as of 2015).
The aim of the Zhaga consortium is to ensure interchangeability and compatibility of LED luminaires between different manufacturers. To this end, Zhaga defines stan-dards for the interfaces of the various lighting fixtures and holders. This includes the physical dimensions of the lamp base, as well as the photometric, electrical and thermal behavior of LED luminaires. These standardizing measures help to make products comparable, a step that both the manufacturing industry and the consu-mers benefit from.
ZHAGACompatibility of LED light sources

Light you want to follow.
tengine DLE tengine DLE Integrated
tengine SLE
tengine CLE Integratedtengine CLE
tengine FLE tengine LLE tengine QLE
Support and advice from a single sourceWe will help you to create lighting solutions that are unbeatable in terms of economy and functionality, in accordance with our slogan "we devote all our energy to your light".
03/15 Subject to change without notice. Errors and omission excepted.
As an international company, Tridonic is represented worldwide by 30 branch offices and partners in 73 countries.
HeadquartersTridonic GmbH & Co KGFärbergasse 15 | 6851 Dornbirn, Austria T +43 5572 395-0 | F +43 5572 20176www.tridonic.com | [email protected]