white rose research online - understanding the influence of...
TRANSCRIPT

This is a repository copy of Understanding the influence of airport servicescape on travelerdissatisfaction and misbehavior.
White Rose Research Online URL for this paper:http://eprints.whiterose.ac.uk/152397/
Version: Accepted Version
Article:
Taheri, B., Olya, H., Ali, F. et al. (1 more author) (2019) Understanding the influence of airport servicescape on traveler dissatisfaction and misbehavior. Journal of Travel Research. ISSN 0047-2875
https://doi.org/10.1177/0047287519877257
Taheri, B., Olya, H., Ali, F., & Gannon, M. J. (2019). Understanding the Influence of Airport Servicescape on Traveler Dissatisfaction and Misbehavior. Journal of Travel Research. © The Authors. https://doi.org/10.1177/0047287519877257
[email protected]://eprints.whiterose.ac.uk/
Reuse
Items deposited in White Rose Research Online are protected by copyright, with all rights reserved unless indicated otherwise. They may be downloaded and/or printed for private study, or other acts as permitted by national copyright laws. The publisher or other rights holders may allow further reproduction and re-use of the full text version. This is indicated by the licence information on the White Rose Research Online record for the item.
Takedown
If you consider content in White Rose Research Online to be in breach of UK law, please notify us by emailing [email protected] including the URL of the record and the reason for the withdrawal request.
1
Understanding the influence of airport servicescape on traveler
dissatisfaction and misbehavior
Abstract Underpinned by complexity theory, this study investigates whether the influence of social
and physical servicescape on international travelers’ dissatisfaction and misbehavior differs
between two characteristically different international airports in Iran. Partial Least Squares
(PLS) and Multi -Group Analysis (MGA) were employed to test the conceptual model. The
results revealed significant differences between the effects of physical servicescape on
travelers’ dissatisfaction and misbehavior across both airports. However, the results did not
support any differences between the effects of social servicescape on travelers’ dissatisfaction
and misbehavior between both airports. Additionally, using fuzzy-set Qualitative
Comparative Analysis (fsQCA), this study identified multiple configurations of physical and
social servicescape dimensions leading to traveler dissatisfaction and misbehavior. In doing
so, the results highlighted the conditions leading to low traveler dissatisfaction and
misbehavior scores, confirming the applicability of complexity theory in explaining
international traveler behavior in airports, providing implications and directions for future
research in the process.
Keywords: Servicescape, dissatisfaction, misbehavior, complexity theory, Fuzzy-set
Qualitative Comparative Analysis

2
Introduction
The travel sector has boasted virtually uninterrupted recent growth, with worldwide
international tourist arrivals increasing from 674 million (2000) to 1.2 billion (2016) in less
than two decades. Air transport has grown at a faster pace than surface transport, with over
half (55%) of all overnight visitors now traveling to their destination by air (UNWTO 2017).
According to Clarkson (2015), the 20 busiest international airports moved over 700 million
travelers in 2014. Travelers therefore share the environment with others, which can lead to
misbehavior, with verbal aggression and physical violence witnessed in airports across the
world (Moody 2017). In some instances, faced with poor service, dissatisfied travelers
damaged computers and furniture and fought with law enforcement (Blanchard 2008). Long
lines at security gates; delays in baggage reclaim; frustration at poorly-explained flight
delays; and abrupt diversions and cancellations remain the most prominent reasons for
traveler dissatisfaction at airports, resulting in deliberate acts of misbehavior (SKYTRAX
2016). To this end, the International Air Transport Association (IATA) annually receives
around 10,000 serious complaints worldwide pertaining to unruly travelers (Hunter 2016).
Yet, customer satisfaction and behavior are shaped by the evaluation of various
service attributes. Herzberg (1996) proposed ‘satisfaction’ and ‘dissatisfaction’ as conflicting
constructs, with customer misbehavior typified by its physical, psychological and financial
cost to service providers, staff, and other customers (Daunt and Harris 2012). Nonetheless,
few studies have examined the antecedents of customer misbehavior in distinct contexts (e.g.,
international airports) that provide various services to travelers. Ferguson and Johnston
(2011) synthesized extant customer (dis)satisfaction response behaviors and stated that there
are opportunities to extend customer (dis)satisfaction literature. As such, theoretical and
methodological advances can enhance existing knowledge of traveler behavior in
international airports within developing countries.

3
Nonetheless, limited attention has been given to the service characteristics of airports
in influencing misbehavior (Parther and Steele 2015). As identified by Olya and Al-ansi
(2018), travelers typically consider multiple criteria before taking any action, indicating the
complexity of their behaviors. As such, they argued that complexity theory can explain
combinations of predictors (i.e., causal recipes) that can stimulate desired behaviors in
travelers. Thus, this study aims to comprehensively evaluate the influence of servicescape
dimensions on travelers’ dissatisfaction and misbehavior at two international airports with
dissimilar characteristics. It applied complexity theory to support the development of
structural and configurational models, indicating traveler behaviors and servicescape
elements therein. In doing so, it is believed the study contributes theoretically,
methodologically, and contextually to extant knowledge of travelers’ behavioral responses to
service environment characteristics by investigating:
Q1: What servicescape factors affect traveler dissatisfaction and misbehavior in two
Iranian international airports?
Q2: Do the effects of servicescape factors on dissatisfaction and misbehavior differ
across two Iranian international airports?
Q3: How do combinations of physical and social servicescape characteristics explain
conditions leading to dissatisfaction and misbehavior?
Q4: What are the necessary conditions to achieve low traveler dissatisfaction and
misbehavior scores in two Iranian airports?

4
Literature Review
Physical servicescape
Mari and Poggesi (2013) suggested that the terms ‘atmospherics’ and ‘servicescape’ can be
used to describe physical service environments. Kotler (1973, p. 50) considered
‘atmospherics’ as “the design of buying environments to produce specific emotional effects
in the buyer that enhance his/her purchase probability”, whereas Bitner (1992, p.58) defined
‘servicescape’ as “the man-made physical environment where service products are
delivered”. Physical servicescapes have been operationalized as being comprised of two
elements, layout and atmosphere, which can contribute to customer perceptions of quality
(Dong and Siu 2013). These can be both tangible and intangible, and significant in captive
settings, where satisfaction stems from the service environment’s functional characteristics
(Ali, Kim, and Ryu 2016). Various on-site elements can influence satisfaction, including:
accessibility, cleanliness, comfort, food availability, ease-of-parking, signage clarity, and the
quality of restrooms (Getz, O’Neill, and Carlsen 2001; Yalinay et al. 2018). Physical
servicescape quality has been found to be influenced by customers’ responses to layout,
where a clear and easy-to-follow layout can hold principal value (Lee, Lee, Choi, Yoon and
Hart 2014). Logistic considerations, such as perspicuous signage and comprehensible
queuing instructions can also stimulate satisfaction (Jensen, Li, and Uysal 2017), particularly
within an airport setting where the scope, accessibility, and accuracy of terminal information
are important (Brida, Moreno-Izquierdo and Zapata-Aguirre 2016).
Further, aesthetic aspects of servicescape design can improve customer satisfaction
(Hosany and Witham 2010). Hence, furniture, interior design, and the general attractiveness
of a space have been found to influence customer perceptions of its quality (Alfakhri,
Nicholson and Harness 2018). In airports, these elements should reinforce the ‘identity’ of
the airport, where compatibility between design elements and services provided can satisfy

5
travelers (Mattila and Wirtz 2001). Atmosphere has also been found to be important, where
ambience, scent, lighting, and music can contribute to how pleasing visitors consider the
servicescape (Harris and Ezeh 2008). Successful servicescapes can help to stimulate
congruence among these elements by carefully designing them to complement each other
(Mattila and Wirtz 2001). When coupled with the functional and aesthetic elements of
servicescape design, atmosphere has been found to contribute to customers’ perceptions of
service quality (Reimer and Kuehn 2005).
Social servicescape
The service environment does not exist in isolation, and social considerations can contribute
to perceptions of quality. These are primarily concerned with how consumers identify and
respond to others’ behaviors (Grove and Fisk 1997). In tourism, this social environment
typically comprises fellow travelers and employees (Choo and Petrick 2014), and is
important as travelers seek environments that encourage socialization and provide
opportunities for interaction (Gannon et al. 2017; Sheng, Simpson, and Siguaw 2017).
Individuals are more likely to respond positively when their interactions with fellow travelers
are positive (Grove and Fisk 1997), which can intensify their satisfaction and loyalty (Lee et
al. 2014). However, the behavior of others and the quality of customer-to-customer
interactions can significantly detract from satisfaction and relaxation (Getz, O’Neill and
Carlsen 2001), as it can exacerbate dissatisfaction with irksome activities such as queuing
(Grove and Fisk 1997).
As conduct is influenced by the behavior of others, servicescapes can be designed to
amplify this by providing opportunities for positive social interactions (Colm, Ordanini and
Parasuraman 2017). Yet, contextual norms have been found to be important in servicescape
evaluation (Hanks, Line, and Kim 2017), and the captive nature of the airport environment

6
may fuel a greater number of customer-customer interactions (Ali et al. 2016). While these
interactions are generally encouraged (Colm et al. 2017), the airport’s transient nature may
result in a greater degree of misbehavior due to a perceived lack of responsibility (Grove and
Fisk 1997), which may dissatisfy other travelers (Reynolds and Harris 2009).
Further, customer-staff interactions can influence servicescape evaluations (Jensen et
al. 2017). Employees’ attitudes, enthusiasm, and communication style have also been found
to be important in shaping perceptions of service environment quality (Reimer and Kuhn
2005). The helpfulness of staff can hence contribute to satisfaction, where there is an
expectation that customer needs and issues should be addressed professionally (Harris and
Ezeh 2008). Staff behavior can also influence customers’ cognitive experience (Woo and Jun
2017), and satisfaction with staff performance, behavior, and perceived competence can
engender loyalty and trust (Harris and Ezeh 2008).
Together, the physical and social servicescape can contribute to perceived service
environment quality (Grove and Fisk 1997). However, within the airport context there is
another paramount consideration - the perceived security of the environment (Getz et al.
2001). Considerations surrounding how security-conscious the airport appears and how it
deals with unruly travelers can contribute to perceptions of airport vulnerability (Daunt and
Harris 2012). The physical and social elements of the airport service environment can also be
influenced by employees. If staff project notions of safety, this may improve customers’
perceptions of the airport servicescape, increasing their satisfaction with regards to airport
security (Brida et al. 2016; Osman, Johns and Lugosi 2014).
Dissatisfaction
Kano, Seraku, Takahashi and Tsuji (1984) postulated that various service attributes can
influence customer satisfaction. However, the absence of these attributes does not necessarily

7
lead to dissatisfaction. Ferguson and Johnston (2011) synthesized customer (dis)satisfaction
response behaviors and suggested that there are opportunities to extend existing customer
(dis)satisfaction literature. Prior studies have largely focused on (dis)satisfaction antecedents
(expectations, performance, affect, and equity), while few have emphasized the consequences
of (dis)satisfaction (Kim, Kim, and Yoonjoung 2017).
Service environment dissatisfaction has also been found to be contingent upon
customers’ evaluation of each element of the servicescape, individually and in totality
(Reynolds and Harris 2009). It can be born from unmet expectations, where customers feel
underwhelmed by either the physical or social elements of the servicescape. Basic provisions
such as food and comfort can also drive satisfaction, and insufficient quality in this regard
can have a significant impact upon customer experiences and loyalty (Ali et al. 2016).
Further, functional elements of the servicescape can also contribute to dissatisfaction, where
poor signage, uncleanliness, and a lack of information can displease customers (Reynolds and
Harris 2009). Dissatisfaction can also be derived from social interactions with fellow
customers (Sheng et al. 2017), or from customers’ perceptions of their dealings with
employees (Bitner 1992). Various staff-related aspects have also been found to contribute to
dissatisfaction, contingent on how unfriendly or unhelpful customers perceive staff to be;
whether customers feel staff lack competence or knowledge; and staff availability at times of
need (Getz et al. 2001). As such, dissatisfaction born from the social servicescape can serve
as a key stimulant of customer misbehavior (Reynolds and Harris 2009).
Traveler misbehavior
While satisfaction has been found to stimulate positive behaviors, dissatisfaction often
engenders negative behaviors, including complaints, negative word-of-mouth, and
misbehavior (Daunt and Harris 2012; Go and Kim 2008; Tsaur, Cheng and Hong 2019). To

8
this end, customer dissatisfaction can impact service providers significantly more than
satisfaction. Hoffman and Chung (1999) suggested that while 38% of satisfied customers
share their positive experiences, 75% of dissatisfied customers engage in negative word-of-
mouth, reinforcing the importance of understanding the antecedents and consequences of
customer dissatisfaction. Most consumer behavior literature assumes that customers behave
in a normative and functional manner during service exchanges (Daunt and Harris 2012).
This contrasts with emergent literature showcasing customers’ routine activities in an
alternate light (Reynolds and Harris 2009), where their own actions (not those of the service
provider) are presented as the source of service failures and consequent dissatisfaction
(Zourrig, Chebat, and Toffoli 2009).
Consumer misbehavior has been defined as “behavioral acts by consumers, which
violate the generally accepted norms of conduct in consumption situations, and thus disrupt
the consumption order” (Fullerton and Punj 2004, p.1239). This not only includes acts that
are intentional, but also those performed unintentionally out of an ignorance of norms or in
response to the deviant behavior of others. Misbehavior occurs frequently, with severe
consequences for employees, fellow customers, and organizations (Ro 2015). It emerges in a
number of ways and can be active or passive. Passive misbehavior is typically inward-
focused, including actions such as failing to tell an employee when a mistake has been made
in the recipient’s favor (Daunt and Harris 2012). The impact of this misbehavior does not
typically extend beyond the parties directly involved (Go and Kim 2008; Tsaur et al. 2019).
Conversely, active misbehavior is more egregious (Reynolds and Harris 2009), and includes
vandalism, physical violence, theft, and extreme discourtesy (Daunt and Harris 2012). This is
more conspicuous and likely to have a greater impact on others within the servicescape
(Reynolds and Harris 2009).

9
Therefore, consumer misbehavior can be stimulated by dissatisfaction with elements
of the servicescape (Reynolds and Harris 2009). As consumer experiences can be influenced
by the behavior of others (Colm et al. 2017), misbehavior may be driven by social factors,
such as the conduct of fellow customers (Grove and Fisk 1997), or in response to the
perceived ineptitude or unhelpfulness of staff (Daunt and Harris 2014). This may be
exacerbated due to the captive nature of the airport setting, where individuals are more likely
to intermingle and interact, often not through choice (Ali et al. 2016), and therefore poorly
designed airport servicescapes may engender misbehavior (Colm et al. 2017). Further, the
transient nature of the airport servicescape may also result in a lack of individual
accountability, due to being ‘out-of-town’, which may increase misbehavior (Grove and Fisk
1997).
Conversely, the airport servicescape may reduce traveler misbehavior, as increased
security, lack of escape routes, and social expectations can produce a physical environment
with diminished opportunities for extreme misbehavior (Daunt and Greer 2015). Nonetheless,
functional considerations such as longer lines at security, delays in baggage reclaim, flight
delays with insufficient information provided by airlines, and cancellations can contribute to
traveler dissatisfaction at airports, possibly leading to deliberate acts of misbehavior
(SKYTRAX 2016). Traveler misbehavior can lead to service disruption in the travel,
hospitality, and tourism context, with reports attributing fights, vandalism, and deliberate
damage within the airport setting to traveler dissatisfaction with flight delays and
cancellations (Go and Kim 2008; Harris and Reynols 2004; Tsaur et al. 2019).
Theory and conceptual model
Consistent with the above, this study uses ‘servicescape’ to describe the physical and social
components of the service encounter which together characterize the service environment.

10
The impact of the service environment on customer experience has been discussed within
environmental psychology and marketing literature (Bitner 1992; Mari and Poggesi 2013).
Mehrabian and Russell (1974) suggested that environmental psychology theory can be used
to understand the sequential interactions between environmental stimulus, emotional states,
and response. Environmental stimulus includes physical (layout, atmosphere, physical
environment) and social (fellow customers, employee service, and vulnerability)
servicescape. This suggests that servicescape can influence customer evaluations
(satisfaction/dissatisfaction) and affect their behavioral responses (misbehavior).
Several studies have adopted Bitner’s (1992) concept to explore the effects of
servicescape on dissatisfaction and consumer behavior (cf., Daunt and Greer 2015; Daunt and
Harris 2012, 2014; Ferguson and Johnston 2011). However, it can be argued that past
methods have been insufficient in explaining the complex process of traveler behavior
influenced by environmental conditions. This study therefore draws upon ‘complexity theory’
to evaluate the influence of servicescape on traveler misbehavior. Complexity theory has
been used in various sub-disciplines of social sciences including hospitality and tourism, and
marketing (cf. Olya and Mehran 2017; Ragin 2008; Urry 2005; Woodside 2014). It posits that
a combination of antecedents, not a net effect of a single factor, can be used as a causal
solution for indicating complex social phenomena. Complexity theory can explain complex
causal relationships, and the outcomes of these relationships are often influenced by many
causal factors (Woodside 2017). As such, combinations of causal factors can lead to a
specific outcome and the same causal factor may have different (possibly even contrasting)
effects depending on the context (Ragin 2008; Stacey et al. 2000). Accordingly, the same
cause can produce different effects (i.e., there is a non-linear relationships between variables)
(Urry 2005).
Complexity theory can help to describe the nonlinear, heterogonous, and dynamic

11
interaction between antecedents/motivations and the attitudinal/behavioral responses of
travelers (Woodside 2017). This study contends that the relationship between servicescape
dimensions and traveler responses is a complex adaptive system comprised of a wide range of
antecedents, which vary based on the needs, preferences, and demands of the individual
(Ragin 2008; Urry 2005). For example, Grove and Fisk (1997) found that meeting the
requirements for social servicescape may not necessarily lead to desired customer behaviors.
This heterogeneity can be explained by a tenet of complexity theory (recipe principle), which
argues that a set combination of factors (not the net effect of one factor) can describe
complex conditions leading to an outcome (Stacey et al. 2000), thus acknowledging “that no
simple condition is the cause of an outcome of interest” (Wu et al. 2014, p.1666).
Further, the role of each predictor can be defined based on the attributes of other
predictors. Each factor may play a positive or negative role in predicting a given outcome,
and this depends on the features of other predictors (Olya et al. 2017). For example, airport
atmosphere may contribute to travelers’ dissatisfaction either positively or negatively. The
positive/negative effect of atmosphere can be determined by the attributes of the other
indicators (e.g., environment quality) in the causal recipe. Complexity theory postulates that
alternative causal models can explain conditions resulting in expected outcomes. This tenet
(equifinality principle) offers a pragmatic insight into complex phenomena by covering the
views of individuals, including contrarian cases, with different perceptions. For instance, a
group of travelers may believe the lack of specific physical servicescape aspects led to their
dissatisfaction and misbehavior, while other groups may believe that the physical
servicescape was satisfactory, and instead the low quality of the social servicescape led to the
above undesired outcomes.
As such, traveler attitudes and behaviors in airports are nuanced, and complexity
theory can be used to understand the non-linear interactions of servicescape components and

12
traveler behaviors in this context (Pappas and Papatheodorou 2017). The complexity of
associating servicescape dimensions in international airports with traveler behavior is derived
from their inherent self-service, remote, and interpersonal characteristics. As travelers can
compare servicescapes with those previously visited, this study suggests that the formulation
process of international traveler behaviors based on airport servicescapes is likely to be
dynamic and complex. It is rare that two international airports are physically and socially
identical. Thus, the traveler experiences may be unpredictable or unique – further driving
complex behaviors.
Accordingly, complexity theory has been used to understand the behavior of
customers. Woodside (2014) described the key tenets of complexity theory and discussed
how this theory can explain the complexity of a given environment. In a service context, Wu,
Yeh, Huan and Woodside (2014) used complexity theory to assess consumer behavior in the
spa industry; Olya and Mehran (2017) employed it to explore factors underpinning tourism
expenditures; Dekker et al. (2011) used it to investigate human error in the aviation industry;
and Pappas and Papatheodorou (2017) applied it to decision-making processes during the
recent refugee crisis in Greece.
Drawing on Woodside’s (2014) six tenets of complexity theory, this study suggests
that complexity theory can be used to develop greater understanding of traveler misbehavior
in airports. The proposed conceptual model consists of physical servicescape, social
servicescape, dissatisfaction, and misbehavior (Figure.1). Complexity theory can help in
explaining the contrarian role played by physical and social servicescape dimensions in
predicting traveler dissatisfaction and misbehavior. Complexity theory can therefore enable
researchers to explain why causal recipes for satisfaction and desired traveler behavior are
not simply mirror images of the causal recipes stimulating dissatisfaction and misbehavior.
[Figure 1]

13
Research methodology
In line with the research questions, this study investigated the factors predicting traveler
dissatisfaction and misbehavior using path analysis (Q1). Multi-group analysis (MGA) was
then conducted in order to assess differences between the airports (Q2). Next, fuzzy set
qualitative comparative analysis (fsQCA) was performed to explore combinations of factors
leading to traveler dissatisfaction and misbehavior (Q3). Finally, necessary condition analysis
(NCA) was conducted in order to identify the conditions which can predict low scores of
traveler dissatisfaction and misbehavior (Q4). This study echoes Kotler (1967, p.1), who
stated “marketing decisions must be made in the context of insufficient information about
processes that are dynamic, nonlinear, lagged, stochastic, interactive, and downright
difficult”. Thus, recognizing that hypotheses are mainly used for symmetrical analysis (i.e.,
regression and structural equation modeling), the multi-analysis approach adopted in this
study instead developed and assessed distinct research questions. This was deemed
appropriate as two of the analytical approaches used (i.e., fsQCA and NCA) are exploratory
in nature and cannot be used to test hypotheses (Woodside 2017).
Data collection and context
Surveys were conducted ‘face-to-face’ with international travelers at two prominent
international airports in Iran in 2017. Using non-probability judgmental sampling (Wells,
Taheri, Gregory-Smith and Manika 2016), only those waiting for return flights to their home
country and who had already experienced the airports’ services and facilities were invited to
participate in this study. These international travelers were asked to compare their
experiences in the Iranian airport(s) with their prior experiences elsewhere.
The purpose of the study was explained to willing participants, who were also
informed that their responses would remain anonymous in order to minimize social

14
desirability bias and to make them more comfortable with sharing their true feelings
(Podsakoff, MacKenzie, Lee and Podsakoff 2003). Each respondent was instructed to answer
the questionnaire anywhere they desired within the airport, and return it in a sealed envelope
(provided separately) to the data collection team in order to avoid reticence in sharing
misbehavior. The survey was pilot tested with twenty participants at each airport. Based on
participant feedback gathered at this juncture, some items were modified to avoid language
confusion or misinterpretation. All surveys were conducted in English.
Data was collected from two high-traffic international airports in Iran. At their
request, all identifiable information has been anonymized. Therefore, they are labeled as
Airport ‘A’ and ‘B’. Both contain several different service characteristics (Parther and Steele
2015). Airport A has more than double the number of international travelers, international
flights, and terminal area compared to Airport B (IAC 2017). Airport A was ranked in the
lower limit (scale of 1-5) on average transportation cost, whereas Airport B was ranked in the
higher limit (scale of 1-5) of the top 10 high-traffic airports in Iran (Adibi and Razmi 2015).
Travelers perceived Airport A as having very low service quality, reputation, and social
responsibility, whereas Airport B was perceived very highly in these three areas (Olfat et al.
2016). Olya, Alipour and Gavilyan (2018) suggest that face-to-face surveys can help to
achieve higher participation acceptance than remote alternatives. To this end, the research
team directly approached 416 travelers at Airport A and 413 travelers at Airport B, with a
total of 800 travelers (400 per airport) agreeing to participate in the survey. Overall, 591
useable questionnaires were returned, constituting a 71.3% response rate, which is considered
acceptable by Tabachnick and Fidell (2013). Table 1 provides a summary of the profile of
participants in both Airport A and Airport B.
[Table 1]

15
The mean replacement technique was used to overcome missing values across the
dataset. According to Tabachnick and Fidell (2013), the mean replacement technique can
overcome missing values across the dataset if <5% of data is incomplete. In this study, the
percentage of missing values was 1.032%. This approach “replaces the missing values for a
variable with the mean value of that variable calculated from all responses” (Hair et al. 2010,
p.53) and does not change the sample size or mean of variables. Sarstedt, Ringle and Hair
(2017, p.203), suggested that “PLS-SEM can calculate an accurate estimation when the size
of missing values is small (<15%)”. Garson (2016) also proposed that missing values
significantly impact structural models when >5% of values are missing. Thus, it is believed
that missing values did not have a significant impact on this study. The Skewness and
Kurtosis values for each scale item fell within the acceptable range (+/- 3); suggesting normal
data distribution (Wells, Manika, Gregory-Smith, Taheri and McCowlen 2015). Finally, early
and late versions of the survey were compared in order to test for non-response bias
(Armstrong and Overton 1977). The results indicated no significant differences (p > .05);
therefore non-response bias was not believed to be a concern for this study.
Measures
All items were adapted from extant research and participants were asked to indicate their
level of agreement or disagreement with each statement using a 7-point Likert-type scale (‘1
= strongly disagree’ to ‘7 = strongly agree’). All measures and underlying items are presented
in Table 2. Physical servicescape and social servicescape were operationalized as second-
order composites stemming from latent variable scores (Henseler, Ringle and Sarstedt 2016;
Hernandez-Perlines 2016) as underlying first-order composites for their respective higher-
order composites (physical servicescape and social servicescape) are uncorrelated (Henseler

16
et al. 2016). As each first-order “composite captures a different aspect ratio, the composites
are not interchangeable” (Hernandez-Perlines 2016, p.6).
To measure physical servicescape, three underlying first-order composites adapted
from Dagger and Danaher (2014) were used: layout (six-items), atmosphere (five-items) and
environment quality (three-items). To measure social servicescape this study employed three
underlying first-order composites: fellow travelers (six-items), employee service (six-items),
and airport vulnerability (four-items), adapted from Daunt and Harris (2012). Traveler
dissatisfaction was measured with four-items adapted from Reynolds and Harris (2009) and
the form of traveler misbehavior undertaken by respondents was self-nominated in
accordance with 7-items outlined by Daunt and Harris (2012). All items were adapted to
match the airport context. For example, Dagger and Danaher (2014, p.78) used “the furniture
at this store is comfortable” to capture retail store layout, whereas this study used “the
furniture at this airport is comfortable” (Table 2).
[Table 2]
Common method variance (CMV)
Independent and dependent constructs were placed in different areas within the survey in
order to reduce the potential for CMV. Harman’s single-factor test was used to test CMV by
entering all constructs into a principal component analysis (PCA) (Dedeoğlu, Taheri,
Okumus and Gannon 2020; Podsakoff et al. 2003). For Airport A, the eigenvalue unrotated
PCA solution identified 6 factors; the highest portion of variance explained by one single
factor was 33.2%. For Airport B, 6 factors were also detected; the largest portion of variance
for a single factor was 31.4%. Following Min, Park and Kim (2016), this study undertook the
unmeasured method factor approach. The average variance of indicators and method factor

17
were assessed. The average variance illustrated by indicators for Airport A was 66%, whereas
the average method-based variance was 1.6% (41:1). For Airport B, the average variance
explained by indicators was 58%, while the average method-based variance was 1.5% (38:1).
Therefore, CMV was not believed to be a concern for this study.
Analytical approaches
Partial Least Squares structural equation modeling (PLS-SEM) was employed to test the
conceptual model as it has been suggested to be appropriate in the primary stages of theory
building with models comprised of various indicators (Rasoolimanesh et al. 2019; Wells et al.
2016). Wetzels, Odekerken-Schröder and van Oppen (2009, p.190) argued “model
complexity does not pose as severe a restriction to PLS path-modeling as to covariance-based
SEM, since PLS path-modeling at any moment only estimates a subset of parameters”. PLS-
SEM has been posited as suitable for formative, reflective and second-order models (Hair et
al. 2017). For the estimation and assessment of the model, Consistent Partial Least Squares
(PLSc) was employed as an advancement of conventional PLS (Dijkstra and Henseler 2015).
PLSc “solves the consistency problem, path coefficients, construct correlations, and indicator
loadings [and] avoids the issue of overestimation and underestimation of parameters” (Dos
Santos et al. 2016, p.1093). Hence, SmartPLS 3.2.4 was used to analyze the conceptual
model. A non-parametric bootstrapping technique was tested with 591 cases, and 5,000 sub-
samples were randomly generated (Hair et al. 2017).
Symmetrical analyses dominate extant analysis of traveler behavior. Using
symmetrical analysis, scholars have attempted to identify associations between predictor
(e.g., social servicescape) and outcome variables (e.g., misbehavior). Such tests assume high
or low predictor (X) scores link with high or low outcome (Y) scores. However, recent
tourism studies contend that predictors and outcomes are not necessarily symmetrically

18
associated (Olya et al. 2017). As the effects of combinations of predictors may influence
travelers to behave or misbehave, an asymmetrical relationship between X and Y may
emerge. This means that a causal model leading to a high ‘outcome’ score is unique and
different to a causal model that obtains a low ‘outcome’ score. Thus, both high and low
degrees of ‘X’ may contribute in predicting high degrees of an outcome. The role of X
therefore depends on other predictors in a given causal model (Olya and Mehran 2017).
The PLS-SEM results informed the net effect of social and physical servicescape on
the model outcomes. As modeling traveler dissatisfaction and misbehavior is complex,
research must identify how to combine physical and social servicescape dimensions to
combat dissatisfaction and misbehavior. Fuzzy-set Qualitative Comparative Analysis
(fsQCA) was used to investigate sufficient combinations of factors (causal recipes) for
predicting dissatisfaction and misbehavior in both airports. Physical and social servicescape
indicators were used as configurations to predict the study outcomes. In fsQCA, coverage and
consistency are two probabilistic measures that advise sufficient causal recipes leading to
outcomes, which are analogous to the coefficient of determination (R2) and correlation in
symmetrical analyses (Wu et al. 2014).
In fsQCA, data is transformed from crisp-set values (Likert scale data, ranged 1-7) to
fuzzy-set membership values (0: non-full membership to 1: full membership). fsQCA has
been suggested to bridge quantitative and qualitative methods, combatting the drawbacks of
symmetrical analyses such as data normality and multicollinearity. It is a pragmatic and set-
theoretic method used for knowledge generation as it provides exploratory models for
predicting desired outcomes. This can provide deeper insight into phenomena by calculating
the combination of factors predicting model outcomes. NCA is typically used to identify the
factors required to attain an expected outcome. NCA using fsQCA software was therefore
19
performed in order to identify the necessary conditions for achieving the model outcomes
(Dul 2016).
Results
Assessment of measurement model and invariance measurement across two airports
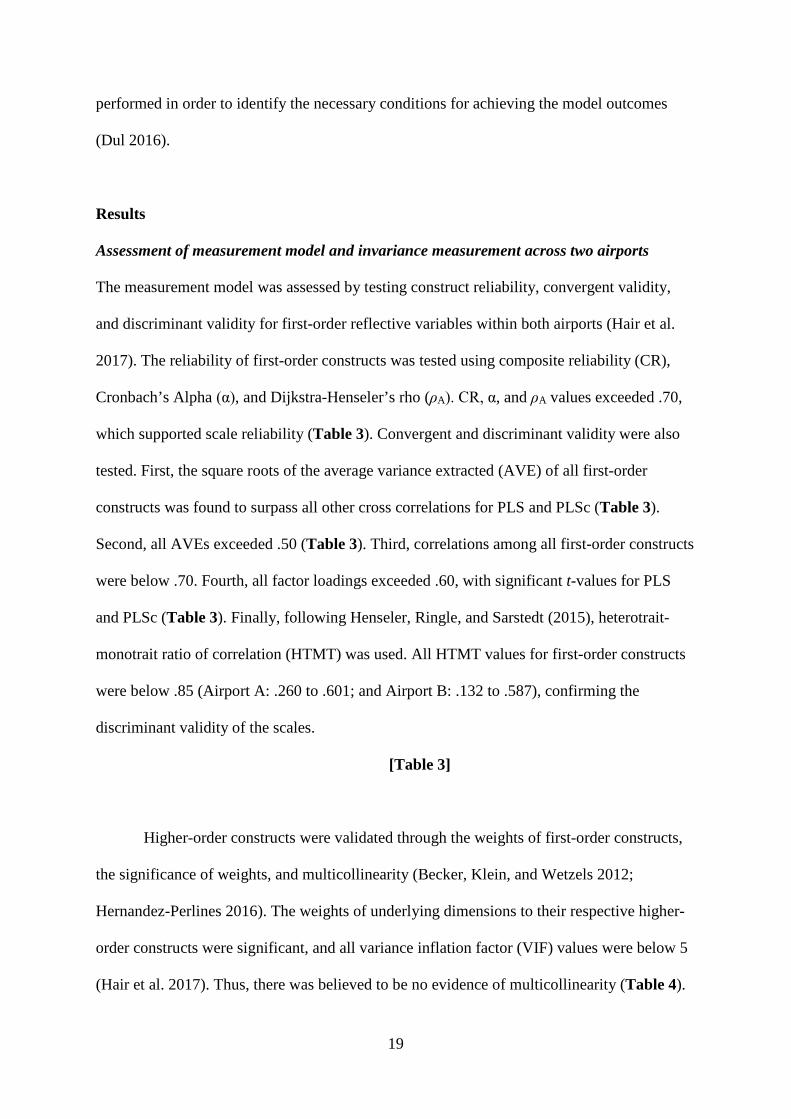
The measurement model was assessed by testing construct reliability, convergent validity,
and discriminant validity for first-order reflective variables within both airports (Hair et al.
2017). The reliability of first-order constructs was tested using composite reliability (CR),
Cronbach’s Alpha (g), and Dijkstra-Henseler’s rho (ȡA). CR, g, and ȡA values exceeded .70,
which supported scale reliability (Table 3). Convergent and discriminant validity were also
tested. First, the square roots of the average variance extracted (AVE) of all first-order
constructs was found to surpass all other cross correlations for PLS and PLSc (Table 3).
Second, all AVEs exceeded .50 (Table 3). Third, correlations among all first-order constructs
were below .70. Fourth, all factor loadings exceeded .60, with significant t-values for PLS
and PLSc (Table 3). Finally, following Henseler, Ringle, and Sarstedt (2015), heterotrait-
monotrait ratio of correlation (HTMT) was used. All HTMT values for first-order constructs
were below .85 (Airport A: .260 to .601; and Airport B: .132 to .587), confirming the
discriminant validity of the scales.
[Table 3]
Higher-order constructs were validated through the weights of first-order constructs,
the significance of weights, and multicollinearity (Becker, Klein, and Wetzels 2012;
Hernandez-Perlines 2016). The weights of underlying dimensions to their respective higher-
order constructs were significant, and all variance inflation factor (VIF) values were below 5
(Hair et al. 2017). Thus, there was believed to be no evidence of multicollinearity (Table 4).

20
[Table 4]
Inter-construct relationships through PLS were calculated in various ways, via: (i)
cross validation communality and redundancy indices; (ii ) R2 values of the endogenous
variables; and (iii ) standardized root mean square residual (SRMR) (Mikalef and Pateli
2017). The findings supported the model’s predictive relevance as all R2 values for
endogenous constructs exceeded .28. Using blindfolding in SmartPLS, all Stone-Geisser’s Q2
values were greater than zero for each construct, suggesting predictive relevance (Hair et al.
2017). For Airport A, the R2 value was 28.3% for dissatisfaction and 64.2% for misbehavior;
the Q2 value was .321 for dissatisfaction and .401 for misbehavior. For Airport B, the R2
value was 38.1% for dissatisfaction and 60.7% for misbehavior; the Q2 value was .178 for
dissatisfaction and .472 for misbehavior. The PLS-SRMR value was .061 (Airport A) and
.067 (Airport B), and the PLSc-SRMR value was .058 (Airport A) and .061 (Airport B) -
below the threshold of .08 (Mikalef and Pateli 2017).
The findings supported the reliability, convergent validity, and discriminant validity
of each measurement model for both airports. Multicollinearity and weights of first-order
constructs on second-order constructs were also calculated. Prior to conducting MGA to
compare path coefficients between the airports, measurement invariance was assessed
(Rasoolimanesh et al. 2017). Henseler et al.’s (2016) Measurement Invariance of Composite
Models (MICOM) three-step procedure was employed, consisting of: (i) Configural
invariance, (ii ) Compositional invariance, (iii ) Scalar invariance. Table 2 shows the metric
invariance assessment permutation algorithm for MGA. The analysis of differences in
loadings between groups for all items under their underlying constructs indicated that the
differences between all factorial loads in both airports were non-significant (Welch-

21
Statterthwaite and permutation tests p-value>.05). Table 5 displays compositional and scalar
invariance, guaranteeing ‘full measurement invariance’.
[Table 5]
Assessment of structural models
Two nonparametric approaches to testing multi-group differences were conducted. Following
Henseler, Ringle and Sinkovics (2009)’s PLS-SEM MGA, the p-value of path coefficient
estimates between groups should be <.05. Further, Chin and Dibbern (2010) and
Rasoolimanesh et al.’s (2017) permutation approach were employed. This technique uses p-
values to test differences across two groups. The results demonstrated significant (if p<.05)
differences between both airports (Table 6).
[Table 6]
Assessment of configurational models
The fsQCA results for predicting dissatisfaction are presented in Table 7. Regarding physical
servicescape, two causal models were found to sufficiently predict dissatisfaction in Airport
A (coverage: .742, consistency: .858). Model 1 indicated that a combination of high layout
quality and low environment quality stimulated traveler dissatisfaction in Airport A. This
suggested that although travelers rated layout as ‘high’ in Airport A, the low score for
environment quality resulted in dissatisfaction. According to Model 2, high layout and low
atmosphere stimulated dissatisfaction among travelers. In Airport B, one causal model
explained the sufficient conditions for dissatisfaction (coverage: .873, consistency: .808).

22
Model 1 demonstrated that low scores for atmosphere and environment quality resulted in
dissatisfaction.
Regarding social servicescape, three causal models (similar in both airports) were
identified to describe conditions stimulating dissatisfaction (Table 7). Model 1 indicated that
a single condition (airport vulnerability) led to dissatisfaction. In Model 2, dissatisfaction
occurred when employee service was low. A low score for ‘fellow traveler’ behavior resulted
in dissatisfaction. The fsQCA results revealed that conditions for predicting misbehavior
based on social and physical servicescape were analogous to causal models for predicting
dissatisfaction. As displayed in Table 7, two causal models in Airport A and one causal
model in Airport B described conditions of traveler misbehavior. As with dissatisfaction,
three single conditions sufficiently explained misbehavior in Airport A and B. This suggests
that similar causal conditions stimulated dissatisfaction and misbehavior in both airports.
[Table 7]
Table 8 presents the fsQCA results using a combination of physical and social
servicescape conditions to predict dissatisfaction (arrow e, Figure 1). Six causal models
explained the complex conditions of dissatisfaction in Airport A (coverage: .809,
consistency: .808). Model 1 suggests high scores for layout, fellow travelers, and airport
vulnerability, with low scores for atmosphere and environment quality, engendered traveler
dissatisfaction. Model 2 indicated that while scores for layout, atmosphere, environment
quality, and employee services were high, low levels of airport vulnerability can lead to
dissatisfaction. Model 3 stated that low scores for fellow travelers with high scores of layout,
atmosphere, environment quality, and employee service resulted in dissatisfaction.

23
Alternatively, dissatisfaction was caused by low scores of environment quality along
with high scores of layout, fellow travelers, employee service, and airport vulnerability
(Model 4, Airport A). Model 5 advised that low scores of atmosphere, along with high scores
of layout, fellow travelers, employee service, and airport vulnerability led to dissatisfaction.
High scores of layout, atmosphere, environment quality, fellow travelers and airport
vulnerability, with low scores of employee service, resulted in traveler dissatisfaction in
Airport A (Model 6, Table 8).
The complex conditions of dissatisfaction in Airport B differed from Airport A. Three
causal models predicted dissatisfaction among travelers of Airport B (coverage: .699,
consistency: .957). Model 1 suggested that low scores of atmosphere, environment quality,
fellow travelers, employee service, and airport vulnerability increased dissatisfaction. In
Model 2, high scores of layout with low scores of atmosphere, environment quality, fellow
travelers, and employee service resulted in dissatisfaction. Model 3 indicated that high scores
of fellow travelers and employee service with low scores of atmosphere, environment quality,
and airport vulnerability heightened dissatisfaction in Airport B (Table 8).
[Table 8]
Table 8 also provides causal models for predicting misbehavior based on physical and
social servicescape conditions (arrow f, Figure 1). Five causal models explored the complex
conditions of misbehavior in Airport A (coverage: .836, consistency: .831). Model 1
indicated that while layout, atmosphere, environment quality, and vulnerability had high
scores, when coupled with dissatisfaction this led to misbehavior. According to Model 2,
dissatisfaction and low scores of atmosphere and environment quality with high scores of
layout, fellow travelers, and airport vulnerability resulted in traveler misbehavior.

24
Model 3 suggested that misbehavior is caused by low environment quality scores and
high scores in layout, atmosphere, fellow travelers, employee service, and airport
vulnerability. A low score for atmosphere and high scores for layout, environment quality,
fellow travelers, employee service, and airport vulnerability resulted in misbehavior in
Airport A (Model 4). In Model 5, a low score for airport vulnerability with high scores of
layout, atmosphere environment quality, fellow travelers, and employee service explained a
causal condition of misbehavior.
Three causal models were identified to describe conditions in which travelers
misbehaved at Airport B (coverage: .590, consistency: .998). In Model 1, dissatisfaction with
low scores of atmosphere, environment quality, fellow travelers, employee service, and
airport vulnerability resulted in misbehavior. According to Model 2, misbehavior occurred
when dissatisfaction and layout were high and atmosphere, environment quality, fellow
travelers, and employee service were low. Model 3 advised that high scores of dissatisfaction,
layout, fellow travelers, and employee service with low scores of atmosphere, environment
quality, and airport vulnerability led to high misbehavior in Airport B (Table 8). The results
of the structural and configurational model tests advised sufficient factors and sufficient
combinations of factors (causal recipes) respectively (Olya and Mehran 2017). The next
subsection introduces the necessary conditions required to achieve the desired outcomes of
the models.
Assessment of Necessary Conditions
The necessary conditions for obtaining low scores of dissatisfaction and misbehavior in the
studied airports are provided in Table 9. The results suggested that the necessary conditions
for low dissatisfaction in Airport A differ from Airport B. Specifically, layout, environment
quality, and airport vulnerability were necessary to achieve low levels of dissatisfaction in

25
Airport A. In Airport B, employee behavior was considered a necessary condition of low
dissatisfaction as the level of consistency was close to the recommended cut-off (consistency
>.9). The necessary conditions for low misbehavior differed from those that resulted in low
dissatisfaction. In Airport A, layout and airport vulnerability were identified as two consistent
necessary conditions. While, in Airport B, four conditions (layout, fellow travelers, employee
service, and low dissatisfaction) were necessary for low misbehavior (Table 9).
[Table 9]
Discussion and implications
This study used path analysis to assess whether social and physical servicescape
dimensions can be used to predict traveler dissatisfaction and misbehavior in airports (Q1).
Further, MGA was used to evaluate possible differences in all hypothesized relationships
across two characteristically different airports (number of flights, traveler demographics,
service quality, service satisfaction, terminal area size, reputation, and CSR) (Q2). As per
Figure 1, a Venn diagram was employed to draw a configurational model for exploring
sufficient factor combinations (i.e., physical servicescape and social servicescape with their
underlying dimensions) leading to dissatisfaction and misbehavior among travelers (Q3). The
fsQCA results revealed how airport managers can consider complex combinations of
social/physical servicescape elements in order to understand the conditions where customers
expressed their dissatisfaction through misbehavior. This is important as airports are
multifaceted systems and the configurational modeling results provided insight into the
physical and social servicescape dimensions that stimulated traveler dissatisfaction and
misbehavior. Finally, while MGA and fsQCA focus on sufficiently distinct combinations of
servicescape factors, the NCA identified the factors required to achieve low scores of
dissatisfaction and misbehavior among travelers in both airports (Q4).

26
Theoretical contributions
It is believed that this study advances understanding of how servicescapes influence
international travelers’ dissatisfaction and misbehavior by extending the previous
understanding of environmental psychology (Mehrabian and Russell 1974) in a complex
context. This study applied complexity theory (Olya and Mehran 2017) to develop and test
structural and configurational models for traveler dissatisfaction and misbehavior. It first
evaluated distinct elements of physical and social servicescape on traveler’s dissatisfaction
and misbehavior using a symmetrical approach (PLS) in two characteristically different
airports in Iran. It then explored complex combinations of servicescape factors on the above
outcomes using an asymmetrical method (fsQCA). It is thus believed that this study
contributes to current understanding of traveler behavior by identifying the servicescape
factors that aid in managing international traveler misbehavior. This study tested the
proposed conceptual models in both airports in order to confirm whether traveler
dissatisfaction and misbehavior varied. Hence, this study evaluated the results of
configurational model testing with key tenets of complexity theory and identified the
relationships between social and physical factors of servicescape which resulted in traveler
misbehavior.
With regards to theoretical contribution, the study first evaluated the effects of social
and physical servicescape characteristics on travelers’ dissatisfaction and misbehavior using
symmetrical path analysis (PLS). In doing so, it confirmed social servicescape and physical
servicescape as higher-order constructs, echoing extant research (Ali et al. 2016). Further, it
is believed that this study can extend current knowledge of traveler behavior as it identified
the complex interactions of physical and social servicescape configurations that can impact
upon dissatisfaction and misbehavior within the airport setting. It thus demonstrated that
dimensions of social and physical servicescape can combine to influence traveler behavior

27
and should not solely be considered as distinct variables in isolation (Ali et al. 2016; Osman
et al. 2014). Therefore, the findings reflect previous studies, which have suggested that
dissatisfaction can lead to misbehavior, albeit in different consumption contexts (Colm et al.
2017; Dagger and Danaher 2014; Daunt and Greer 2015; Grove and Fisk 1997; Reynolds and
Harris 2009).
To this end, whereas previous research often focuses on the satisfaction and loyalty of
travelers in general (Lee et al. 2014), this empirical study is one of the few to investigate
traveler dissatisfaction and misbehavior within airports. As such, the findings also suggested
that consumer dissatisfaction and misbehavior can vary by context (cf. Jensen, Li and Uysal
2017; Reynolds and Harris 2009), with servicescape configurations leading to traveler
outcomes (e.g., dissatisfaction and misbehavior) in Airport A often differing from those in
Airport B (Table 6). This suggests that while opportunities for service settings to retain any
unique characteristics remain (e.g., aesthetics, destination-specific characteristics) (Harris and
Ezeh 2008; Osman et al. 2014), focus should nonetheless be placed on developing and
improving the more rudimentary physical and social servicescape characteristics which are
more likely to reduce traveler misbehavior and dissatisfaction (e.g., signage, employee
service, transit information) (Brida et al. 2016).
Further, the findings suggested that layout, atmosphere, and physical environment
negatively influenced international travelers’ dissatisfaction and misbehavior more for
Airport A compared to B. Traveler dissatisfaction positively influenced traveler misbehavior
for both airports. Such relationships were strong for both airports (Table 6) and were thus
consistent with previous studies (Ali et al. 2016; Go and Kim 2008; Harris and Reynols 2004;
Ryu et al. 2012; Tsaur et al. 2019). These findings highlighted that managing customer
expectations and perceptions of service quality can play an important role in shaping
(mis)behavior within the airport context. However, the findings did not identify a significant

28
difference between Airport A and B with regards to the effect of social servicescape on
traveler dissatisfaction and misbehavior (Choo and Petrik 2014; Sheng 2017).
Finally, by combining three different advanced statistical methods (i.e., MGA, fsQCA
and NCA), this study also contributed methodologically to extant knowledge of travelers’
behavioral responses to service environment characteristics within the context of travel and
tourism. The fsQCA and NCA results reinforced and refined the outcomes obtained from the
MGA. More specifically, the MGA results assessed differences between travelers at two
airports, whereas the fsQCA results explored combinations of factors leading to traveler
dissatisfaction and misbehavior therein. The NCA findings then identified the conditions
managers should focus on in order to attain low scores of traveler dissatisfaction and
misbehavior in each airport. This combined methodological approach provided a more in-
depth understanding of traveler dissatisfaction and misbehavior within the complex airport
context than if any of the analytical techniques were conducted in isolation (Gannon, Taheri
and Olya 2019).
Evaluation of complexity theory
The results were evaluated based on the principles of complexity theory (Olya and Mehran
2017; Woodside 2017). According to the first tenet of complexity theory, it is rare that a
single antecedent (e.g., layout) can sufficiently predict dissatisfaction and behavior. This is
supported by the fsQCA results for physical servicescape. While this was not supported based
on social configurations of servicescape as a simple antecedent (e.g., employee service), it
was found to be sufficient to indicate dissatisfaction and misbehavior (Table 7). The second
tenet of complexity theory (recipe principle) posits that combinations of two or more
antecedents can sufficiently explain conditions leading to an expected outcome. As per Table

29
8, more than two antecedents described the complex conditions of traveler dissatisfaction and
misbehavior, supporting tenet two.
The fsQCA results provided evidence of the equifinality principle (tenet three). As per
Table 8, a causal model (e.g., Model 1) sufficiently predicted dissatisfaction, but is not
necessary as there were alternative models (five for Airport A and two for Airport B) that
sufficiently explained the complex conditions underpinning dissatisfaction. According to
tenet four of complexity theory, antecedents can play both positive and negative roles in
contributing to given outcomes. This is determined by the attributes of other antecedents in
the causal model. The fsQCA results supported this tenet of complexity theory. As per Table
9, atmosphere negatively contributed in Models 2 and 4 in predicting traveler misbehavior in
Airport A, while it played a positive role in Models 1, 3, and 5 for Airport B.
Practical implications
This study may provide interesting and important implications for practitioners and
managers within airport settings. As the results highlighted, conventional cause-and-effect
assessments (e.g., correlations, multiple regression, PLS, etc.) cannot wholly identify the
extent to which antecedent factors influence dissatisfaction and misbehavior as they only
offer a single interpretation of travelers’ evaluations of their airport experience (Woodside
2017). Thus, managers should consider multiple pathways in order to better evaluate the
conditions leading to consumer dissatisfaction and misbehavior. Underpinned by complexity
theory, the fsQCA results can provide managers with an overview of how multiple different
combinations of servicescape dimensions can result in dissatisfaction and misbehavior,
serving as a toolkit and key reference point of ‘what to avoid’ when designing service
solutions and strategies within the complex airport environment.

30
In doing so, this study theorized international airports as environments where travelers
may encounter low-quality servicescapes or service failure. However, travelers may perceive
the service environment differently if they do not experience poor service. Therefore,
managers should endeavor to collect and operationalize information relating to traveler needs
and desires, irrespective of service failure. This study therefore provides insight into airport
environment evaluation and how managers should act upon customer complaints to improve
service quality and counteract traveler misbehavior. More specifically, it contends that the
antecedents of international travelers’ dissatisfaction and misbehavior vary. For example,
specific to this study, heterogeneity is intensified by the sophistication of the servicescapes
within the airport setting. Based on this, a series of practical implications emerged, which can
help decision makers to nullify and manage the misbehavior of international travelers in
airport settings.
First, the study findings indicated that poor airport layout may lead to dissatisfaction
(Airport A) and misbehavior (Airport A and B). Thus, airport managers should pay careful
attention to the design and cleanliness of the interior space, with comfortable furniture freely
available throughout. Airport A also demonstrated the importance of the physical
environment in avoiding traveler dissatisfaction. This again suggests that airport managers
should increase the quality of the physical airport environment with regards to accessibility,
aesthetics, and privacy in order to increase the likelihood of stimulating favorable traveler
behaviors.
Second, concerning social servicescape, the results suggested that the behavior of
fellow travelers stimulated misbehavior in Airport B. Hence, managers must endeavor to gain
a more in-depth understanding of why some travelers may opt to behave in an unpleasant and
inappropriate fashion within the highly regulated and complex airport environment. This
echoed extant research, which highlights the substantive impact that the social environment

31
can have on travel experiences (Cordina, Gannon and Croall 2019). The results emerging
from Airport B suggested that misbehavior and dissatisfaction partly stem from poor
employee service. Airport employees - specifically those who interact directly with travelers -
should regularly undertake training focused on (i) how to build strong relationships with
travelers, (ii) how to address travelers’ problems in satisfactory manner, and (iii) how their
demeanor and enthusiasm is perceived by travelers.
Third, the results suggested that a degree of servicescape standardization across
international airports may reduce instances of misbehavior and dissatisfaction, clarifying
traveler expectations and reducing traveler confusion regarding the machinations of these
(often unfamiliar) service environments in the process. While complaint handling procedures
should be customized and tailored specific to traveler needs, the process of delivering typical
airport services should conform to the protocols and criteria set by recognized international
authorities (e.g., Airport Council International; International Civil Aviation Organization
(ICAO)). This can develop consistency across international airports, shaping service
expectations, and potentially limiting traveler misbehavior and dissatisfaction born from
unfamiliar airport practices and processes. Further, managers and employees should attend
international courses (e.g., ACI Global Training classes) where classroom activities can be
supplemented by practical exercises delivered on-site to allow staff to practice (culturally
specific) auditing approaches under real conditions while receiving guidance and coaching in
applying International Standards and Recommended Practices (SARPs).
Further, airport managers and employees are advised to visit leading world-class
airports (e.g., Incheon in Seoul, S. Korea) to learn how best to design their physical and
social servicescape in order meet traveler standards. This should allow for a better
understanding of how servicescape characteristics influence traveler satisfaction and
behavior, further contextualizing the results of this study in the process. Alternatively,

32
international experts should be invited to advise airport managers on how to improve their
social and physical servicescapes, in line with the recipes identified in this study.
However, the results demonstrated that the conditions leading to traveler misbehavior
differed across the studied airports. Specifically, the physical servicescape in Airport A was
considered more multifaceted than Airport B. Therefore, managers must understand the
complexity of the physical airport servicescape in which a combination of factors (e.g., layout
and atmosphere) can result in traveler dissatisfaction and misbehavior. Although social
dimensions of servicescape appeared simpler than their physical counterparts, airport
managers must understand how each dimension of social servicescape can drive
dissatisfaction and misbehavior among international travelers.
Finally, it is important to distinguish the necessary conditions required to manage
dissatisfaction and misbehavior. This study demonstrated that the necessary physical and
social servicescape conditions that predict low levels of dissatisfaction and misbehavior differ
across airports. For Airport A, layout, environment quality, and vulnerability were necessary
to reduce traveler dissatisfaction and misbehavior. While fellow travelers, employee service,
and dissatisfaction were necessary to gain desired behavioral responses from travelers at
Airport B. Given this heterogeneity, airport managers must regularly ask international
travelers to rate the servicescape of their airport, supported by appropriate incentive
programs.
Limitations and future research
While this study contributed to extant understanding of servicescape and traveler
misbehavior, it contains some limitations. First, future studies should consider the role of
other contextual variables in shaping dissatisfaction and misbehavior. This could include
coping behavior (Strizhakova, Tsarenko, and Ruth 2012); behavioral intentions (Ajzen and

33
Driver 1992); culture and Lean for airport services (Syltevik, Karamperidis, Antony and
Taheri 2018). Second, the context was restricted to Iranian airports. Future studies should test
the relationships studied in different contexts, and provide cross-cultural comparisons (cf.
Taheri et al. 2019). Third, the sampling technique is somewhat limited and future studies
should adopt probability sampling in order to conduct longitudinal studies. As traveler
dissatisfaction and misbehavior were compared across two airports, a paired sample could be
sought to ensure the same respondents rated the servicescape of both airports. Fourth, future
research could employ a qualitative approach to further investigate the relationships between
constructs. Fifth, the survey was conducted in English. Future studies should use other
languages (e.g., French, German, or Arabic) in order to collect a wider and more varied range
of responses. Finally, this study was limited by the self-reporting of misbehavior by
respondents, which may raise issues related to the reliability of the findings. However, it is
important to acknowledge that research into consumer misbehavior is limited, with almost all
studies adopting self-reporting methods for data collection.
34
References
Adibi, Ali ., and Jafar Razmi. 2015. “2-Stage stochastic programming approach for hub location problem under uncertainty: A case study of air network of Iran.” Journal of Air Transport Management 47: 172-178.
Ajzen, Icek., and B.L. Driver. 1992. “Application of theory of planned behaviour to leisure choice.” Journal of Leisure Research,24(3): 207-224.
Alfakhri, Demah, D Harness, John Nicholson, and Tina Harness. 2018. “The role of aesthetics and design in hotelscape: A phenomenological investigation of cosmopolitan consumers.” Journal of Business Research, 85 :523-531.
Ali, Faizan, Woo Gon Kim, and Kisang Ryu. 2016. “The effect of physical environment on passenger delight and satisfaction: Moderating effect of national identity.” Tourism Management,57: 213-224.
Armstrong, Scot J, and Terry S Overton. 1977. “Estimating nonresponse bias in mail surveys.” Journal of Marketing Research 14(3) :396-402.
Becker, Jan-Michael, Kristina Klein, and Martin Wetzels. 2012. “Hierarchical Latent Variable Models in PLS-SEM: Guidelines for Using Reflective-Formative Type Models.” Long Range Planning 45: 359-394.
Bitner, Mary Jo. 1992. “Servicescapes: The Impact of Physical Surroundings on Customers and Employees.” Journal of Marketing 56(April): 57–71.
Blanchard, B. 2008. China to punish airlines whose passengers misbehave. Retrieved July 31, 2008, from https://uk.reuters.com/article/uk-olympics-airlines/china-to-punish-airlines-whose-passengers-misbehave-idUKPEK14990320080731
Brida, Juan Gabrieal, Luis Moreno-Izquierdo, and Sandra Zapata-Aguirre. 2016. “Customer perception of service quality: The role of Information and Communication Technologies (ICTs) at airport functional areas.” Tourism Management Perspectives 20 :209-216.
Chin, W.W., and Dibbern, J. 2010. “A permutation based procedure for multi-group PLS analysis: Results of tests of differences on simulated data and a cross cultural analysis of the sourcing of information system services between Germany and the USA.” In Handbook of partial least Squares: Concepts, methods and applications, edited by V. Esposito, W.W. Chin, J. Henseler and H. Wang, 171-193. Eidelberg, Germany: Springer.
Choo, Hyungsuk., and James F Petrick. 2014. “Social interactions and intentions to revisit for agritourism service encounters.” Tourism Management,40 :372-381.
Clarkson, N. 2015. Are airports the most important hubs in the world? Retrieved 10 July 2015, from https://www.virgin.com/travel/are-airports-most-important-hubs-world
Colm, Laura., Andrea Ordanini, and A Parasuraman. 2017. “When Service Customers Do Not Consume in Isolation: A Typology of Customer Copresence Influence Modes (CCIMs).” Journal of Service Research 20(3): 223-239.
Cordina, Renzo, Martin Joseph Gannon, and Ross Croall. 2019. "Over and over: local fans and spectator sport tourist engagement." The Service Industries Journal 39(7-8): 590-608.
Dagger, Tracey S., and Peter J Danaher. 2014. “Comparing the Effect of Store Remodeling on New and Existing Customers.” Journal of Marketing 78(May): 62-80.
Daunt, Kate L., and Dominique A Greer. 2015. “Unpacking the perceived opportunity to misbehave: The influence of spatio-temporal and social dimensions on consumer misbehavior.” European Journal of Marketing 49(9-10): 1505-1526.

35
Daunt, Kate L., and Lioyd C Harris. 2012. “Exploring the forms of dysfunctional customer behaviour: A study of differences in servicescape and customer disaffection with service.” Journal of Marketing Management,28(1-2): 129-153.
Daunt, Kate L., and Lioyd C Harris. 2014. “Linking employee and customer misbehaviour: The moderating role of past misdemeanours.” Journal of Marketing Management 30(3-4): 221-244.
Dedeoğlu, Bekir Bora., Babak Taheri., Fevzi Okumus, and Martin Gannon. 2020. “Understanding the importance that consumers attach to social media sharing (ISMS): Scale development and validation.” Tourism Management: doi.org/10.1016/j.tourman.2019.103954
Dekker, Sidney, Paul Cilliers, and Jan-Hendrik Hofmeyr. 2011. "The complexity of failure: Implications of complexity theory for safety investigations." Safety science 49(6): 939-945.
Dijkstra, Theo K., and Jorg Henseler. 2015. “Consistent partial least squares path modeling.” MIS Quarterly 39(2): 297-316.
Dong, Ping., and Noel Yee-Man Siu. 2013. “Servicescape elements, customer predispositions and service experience: The case of theme park visitors.” Tourism Management 36: 541-551.
Dos Santos, Manuel Alonso, Ferran Calabuig Moreno, Francisco Rejon Guardia, and Carlos Perez Campos. 2016. “Influence of the Virtual Brand Community in Sports Sponsorship.” Psychology and Marketing 33(12): 1091–1097.
Dul, Jan. 2016. “Identifying single necessary conditions with NCA and fsQCA.” Journal of Business Research 69(4): 1516-1523.
Ferguson, Jodie L., and Wesley J Johnston. 2011. “Customer response to dissatisfaction: A synthesis of literature and conceptual framework.” Industrial Marketing Management 40: 118–127.
Fullerton, R.A., and G Punj. 2004. “Repercussions of promoting an ideology of consumption: consumer misbehavior.” Journal of Business Research 57(11): 1239-1249.
Gannon, Martin Joseph, Ian WF Baxter, Elaine Collinson, Ross Curran, Thomas Farrington, Steven Glasgow, Elliot M. Godsman … and Ozge Yalinay. 2017. “Travelling for Umrah: destination attributes, destination image, and post-travel intentions.” The Service Industries Journal 37(7-8), 448-465.
Gannon, Martin Joseph, Babak Taheri and Hossein GT Olya. 2019. “Festival quality, self-connection, and bragging”. Annals of Tourism Research 76, 239-252.
Garson, D. 2016. Partial Least Squares: Regression and Structural Equation Models, Statistical Associates Blue Book Series.
Getz, Donald., Martin O’Neill, and Jack Carlsen. 2001. “Service quality evaluation at events through service mapping.” Journal of Travel Research 39(4): 380-390.
Grove, Stephen J., and Raymond P Fisk. 1997. “The impact of other customers on service experiences: a critical incident examination of “getting along”.” Journal of Retailing 73(1): 63-85.
Go, Mijeong., and Kim, Insin. 2018. “In- flight NCCI management by combining the Kano model with the service blueprint: A comparison of frequent and infrequent flyers.” Tourism Managaement 69:471-486.
Hair, Jo F Jr., Willian C Black, Barry J Babin, and Rolph E Anderson. 2010. Multivariate Data Analysis: A Global Perspective (7th ed.). USA: Pearson.
Hair, Jo F Jr., G tomas Hult, Christian M Ringle, and Marko Sarstedt. 2017. A primer on Partial Least Squares Structural Equation Modeling (PLS-SEM) (2nd ed.). Los Angeles, CA: Sage.

36
Hanks, Lydia., Nathan Line, and Woo Goo Kim. 2017. “The impact of the social servicescape, density, and restaurant type on perceptions of interpersonal service quality.” International Journal of Hospitality Management 61: 35-44.
Harris, Loyd C., and Reynolds, Kate. L. 2004. “Jaycustomer behaviour: An exploration of types and motives in the hospitality industry.” Journal of Services Marketing, 18(5), 339–357.
Harris, Loyd C., and Chris Ezeh. 2008. “Servicescape and loyalty intentions: an empirical investigation.” European Journal of Marketing 42(3/4): 390-422.
Henseler, Jorg., Geoffrey Hubona, and Pauline Ash Ray. 2016. “Using PLS path modeling in new technology research: Updated guidlines.” Industrial Management and Data Systems 116(1): 2-20.
Henseler, Jorg., Christain M Ringle, and Marko Sarstedt. 2015. “A New Criterion for Assessing Discriminant Validity in Variance-based Structural Equation Modeling.” Journal of the Academy of Marketing Science 43(1): 115-135.
Henseler, Jorg., Christain M Ringle, and Marko Sarstedt. 2016. “Testing Measurement Invariance of Composites Using Partial Least Squares.” International Marketing Review 33(3): 405-431.
Henseler, Jorg., Christain M Ringle, and Rudolf R Sinkovics. 2009. “The use of partial least squares path modeling in international marketing.” Advances in International Marketing 20: 277-319.
Hernandez-Perlines, Felipe. 2016. “Entrepreneurial orientation in hotel industry: Multi-group analysis of quality certification.” Journal of Business Research,60(20): 4714-4724
Herzberg, F. I. 1996. Work and the nature of man: World Publishing: Cleveland Hoffman, K Douglas., and Beth G Chung. 1999. “Hospitality recovery strategies: customer
preference versus firm use.” Journal of Hospitality and Tourism Research 23(1): 71–84.
Hosany, Sameer., and Mark Witham. 2010. “Dimensions of cruisers’ experiences, satisfaction, and intention to recommend.” Journal of Travel Research 49(3): 351-364.
Hunter, Joyce A. 2016. Anger in the air: Combating the air rage phenomenon. New York: Routledge.
IAC. 2017. Iran Airports Company (IAC)- Statistics. May 2017, from https://statistics.airport.ir/ and http://www.cao.ir/statistical-yearbook
Jensen, Øystein., Yuan Li, and Muzaffer Uyal. 2017. “Visitors’ satisfaction at managed tourist attractions in Northern Norway: Do on-site factors matter?” Tourism Management 63: 277-286.
Kano, N., Seraku, N., Takahashi, F., and Tsuji, S. 1984. “Attractive quality and must-be quality”, Hinshitsu.” The Journal of the Japanese Society for Quality Control April :39-48.
Kim, Bona., Seongseop Kim, and Cindy Heo Yoonjoung. 2017. “Consequences of customer dissatisfaction in upscale and budget hotels: focusing on dissatisfied customers’ attitude toward a hotel.” International Journal of Hospitality and Tourism Administration, September :1-32.
Kotler, Philip. 1967. Marketing management: Analysis, planning, and control. Englewood Cliffs,NJ: Prentice-Hall.
Kotler, Philip. 1973. “Atmospherics as a marketing tool.” Journal of Retailing 49(4) :48-64. Lee, Yong-Ki., Choong-Ki Lee, Joowon Choi, Seol-Min Yoon, and Robert John Hart. 2014.
“Tourism's role in urban regeneration: examining the impact of environmental cues on emotion, satisfaction, loyalty, and support for Seoul's revitalized Cheonggyecheon stream district.” Journal of Sustainable Tourism 22(5): 726-749.

37
Mari, Michela., and Sara Poggesi. 2013. “Servicescape cues and customer behavior: a systematic literature review and research agenda.” The Service Industries Journal,33(2): 171-199.
Mattila, Anna S., and Jochen Wirtz. 2001. “Congruency of scent and music as a driver of in-store evaluations and behavior.” Journal of Retailing 77(2): 273-289.
Mehrabian, A., and Russell, J. 1974. An approach to environmental psychology: England: The MIT Publisher.
Mikalef, Patrick., and Adamantia Pateli.2017. “Information technology-enabled dynamic capabilities and thier indirect effect on competitive performance: Findings from PLS-SEM and fsQCA.” Journal of Business Research 70: 1-16.
Min, Hyounae., Jeongdoo Park, and Hyun Jeong Kim. 2016. “Common method bias in hospitality research: A critical review ofliterature and an empirical study”, International Journal of Hospitality Management 56: 126-135.
Moody. 2017. “Rating action follows the sovereign ratings' review announcement”. Moody's Investors Service Ltd, Nov 28. https://www.moodys.com/research/Moodys-places-ACSAs-Baa3-ratings-on-review-for-downgrade--PR_375986
Olfat, Laya., Maghsoud Amiri, Jahanyar Bamded-Soufi, and Mahsa Pishdar. 2016. “A dynamic network efficiency measurement of airports performance considering sustainable development concept: A fuzzy dynamic network-DEA approach.” Journal of Air Transport Management 57: 272-290.
Olya, Hossein GT, and Amr Al-ansi. 2018. “Risk assessment of halal products and services: Implication for tourism industry.” Tourism Management 65: 279-291.
Olya, Hossein GT., and Javaneh Mehran. 2017. “Modelling tourism expenditure using complexity theory.” Journal of Business Research 75: 147-158.
Olya, Hossein GT., Esmaeil Khaksar Shahmirzdi, and Habib Alipour, H. 2017. “Pro-tourism and anti-tourism community groups at a world heritage site in Turkey.” Current Issues in Tourism, 1-23.
Olya, Hossein GT, Habib Alipour and Yaqub Gavilyan. 2018. "Different voices from community groups to support sustainable tourism development at Iranian World Heritage Sites: evidence from Bisotun." Journal of Sustainable Tourism 26(10), 1728-1748.
Osman, Hanaa, Nick Johns, and Peter Lugosi. 2014. "Commercial hospitality in destination experiences: McDonald's and tourists' consumption of space." Tourism Management 42, 238-247.
Pappas, Nicolas., and Andras Papatheodorou. 2017. “Tourism and the refugee crisis in Greece: Perceptions and decision-making of accommodation providers.” Tourism Management 63: 31-41.
Parther, Daniel C., and Richard N Steele. 2015. Airport Management. USA: Ingram Publisher Services
Podsakoff, Philipe M., Scott B MacKenzie, Jeong-Yeon Lee, and Podsakoff, Nathan P. 2003. “Common method variance in behavioral research: a critical review of the literature and recommended remedies.” Journal of Applied Psychology 88(5): 879-903.
Rasoolimanesh, S.Mostafa., Christian M Ringle, Mastura Jaafar, and T Ramayah. 2017. “Urban vs. rural destinations: Residents’ perceptions, community participation and support for tourism development.” Tourism Management 60: 147-158.
Rasoolimanesh, S. Mostafa, Babak Taheri, Martin Gannon, Ali Vafaei-Zadeh and Haniruzila Hanifah. 2019. “Does living in the vicinity of heritage tourism sites influence residents’ perceptions and attitudes?.” Journal of Sustainable Tourism 27(9):1295-1317.

38
Reimer, Anja., and Ricahrd Kuehn. 2005. “The impact of servicescape on quality perception.” European Journal of Marketing 39(7/8): 785-808.
Ragin, Charles. C. 2008. “Redesigning social inquiry” . Chicago, IL: University of Chicago Press. Reynolds, Kate L., and Lioyd C Harris. 2009. “Dysfunctional Customer Behavior Severity: An Empirical Examination.” Journal of Retailing 85: 321-335. Ro, Heejung. 2015. “Customer dissatisfaction responses to restaurant service failures:
Insights into noncomplainers from a relational perspective.” Journal of Hospitality Marketing and Management 24(4): 435-456.
Ryu, Kisang, Hye-Rin Lee, and Woo Gon Kim. 2012. “The influence of the quality of the physical environment,food, and service on restaurant image, customer perceived value, customer satisfaction, and behavioral intentions.” International Journal of Contemporary Hospitality Management 24(2): 200-223.
Sarstedt, Marco., Chritina M Ringle and Joe F Hair. 2017. “Treating unobserved heterogeneity in PLS-SEM: A multi-method approach.” In Partial Least Squares Path Modeling (pp.197-217). Springer, Cham.
Sheng, Xiaojing., Penny M Simpson, and Judy A Siguaw. 2017. “Communities as Nested Servicescapes.” Journal of Service Research 20(2): 171-187.
SKYTRAX 2016. The World’s Top 100 Airports 2015-2017, from http://www.worldairportawards. com/Awards/world_airport_rating_2015.html
Strizhakova, Yuliya., Yelena Tsarenko, and Julie A Ruth. 2012. ‘‘I’m Mad and I Can’t Get That Service Failure Off My Mind’’: Coping and Rumination as Mediators of Anger Effects on Customer Intentions.” Journal of Service Research 15(4): 414-429.
Stacey, Ralph.D., Griffin, Douglas. and Shaw, Patricia. 2000. “Complexity and Management: Fad or Radical Challenge to Systems Thinking?” London: Routledge.
Syltevik Sigrid., Stavros Karamperidis., Jiju Antony, and Babak Taheri. 2018. “Lean for airport services: a systematic literature review and agenda for future research.” International Journal of Quality & Reliability Management 35(1):34-49.
Tabachnick, Barbara G., and Linda S Fidell. 2013. Using multivariate statistics (Sixth ed.). Boston: Pearson Education.
Taheri, Babak, Umit Bititci, Martin Joseph Gannon, and Renzo Cordina. 2019. "Investigating the influence of performance measurement on learning, entrepreneurial orientation and performance in turbulent markets." International Journal of Contemporary Hospitality Management 31(3), 1224-1246.
Tsaur, Sheng-Hshiung., Cheng, Tien-Ming., and Hong, Ci-Yao. 2019. “Exploring tour member misbehavior in group package tours.” Tourism Management 71 :34-43.
UNWTO. 2017. United Nations World Tourism Organization (UNWTO). UNWTO Tourism Highlights.
Urry, John. 2005. “The complexity turn.” Theory Culture and Society 22(5), 1-14. Wells, Viktoria K., Babak Taheri, Diana Gregory-Smith, and Danae Manika. 2016. “The role
of generativity and attitudes on employees home and workplace water and energy saving behaviours.” Tourism Management 56: 63-74.
Wells, Viktoria K., Danae Manika, Diana Gregory-Smith, Babak Taheri, and McCowlen, C. 2015. “Heritage tourism, CSR and the role of employee environmental behaviour.” Tourism Management 48: 399-413.
Wetzels, Martin., Gaby Odekerken-Schröder, and Claudia van Oppen. 2009. “Using PLS path modeling for assessing hierarchical construct models: guidelines and empirical illustration.” MIS Quarterly 33: 177-195.
Woodside, Arch G. 2014. “Embrace• perform• model: Complexity theory, contrarian case analysis, and multiple realities.” Journal of Business Research 67(12): 2495-2503.

39
Woodside, Arch G. 2017 “The complexity turn: Cultural, management, and marketing applications” Springer. Massachusetts: USA.
Wu, Pei-Ling., Shih-Shuo Yeh, Tzung-Cheng Huan, and Arch G Woodside. 2014. “Applying complexity theory to deepen service dominant logic: Configural analysis of customer experience-andoutcome assessments of professional services for personal transformations.” Journal of Business Research 67(8): 1647–1670.
Yalinay, O., Ian W F Baxter, Elaine Collonson, Ross Curran, Martin J. Gannon, Sean Lochrie, Babak Taheri, and Jamie Thompson. 2018. “Servicescape and shopping value: the role of negotiation intention, social orientation, and recreational identity at the Istanbul Grand Bazaar, Turkey”, Journal of Travel & Tourism Marketing 35(9):1132-1144.
Zourrig, Haithem., Jean-Charles Chebat, and Roy Toffoli. 2009. “Consumer revenge behavior: a cross-cultural perspective.” Journal of Business Research 62(10): 995-1001.

40
Figure 1. Proposed structural and configurational models
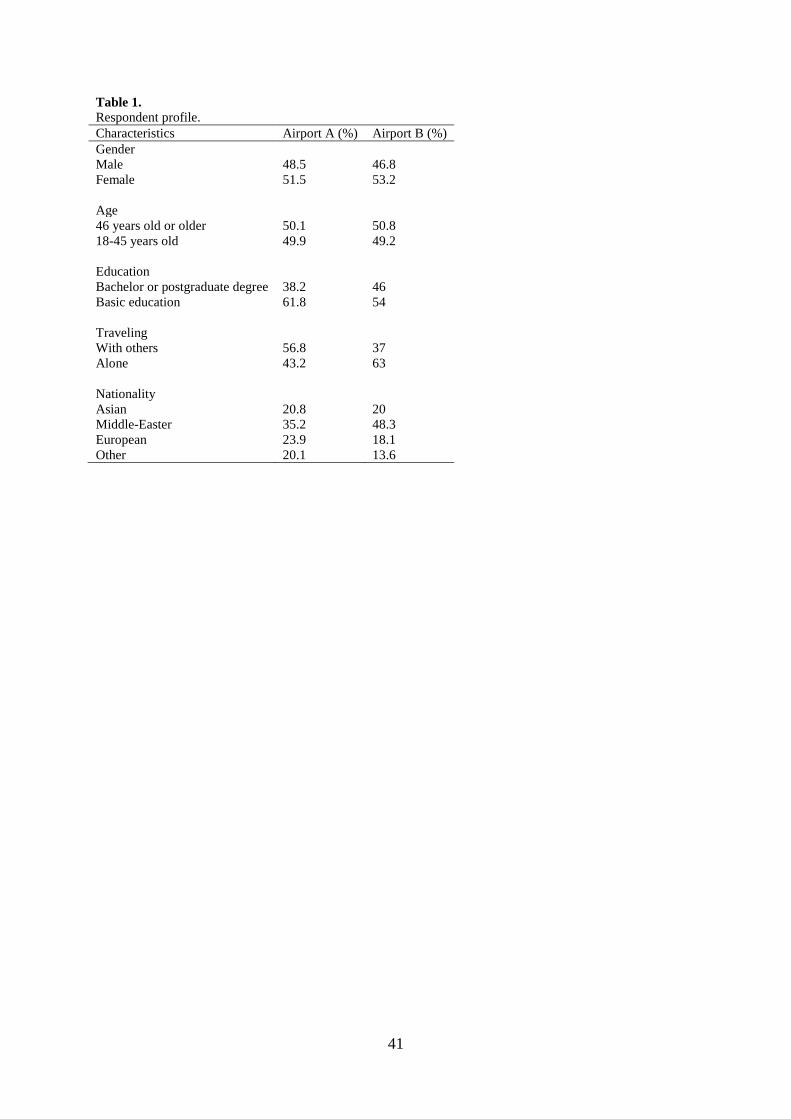
41
Table 1. Respondent profile. Characteristics Airport A (%) Airport B (%) Gender Male
48.5
46.8
Female 51.5 53.2 Age 46 years old or older 50.1 50.8 18-45 years old 49.9 49.2 Education Bachelor or postgraduate degree 38.2 46 Basic education 61.8 54 Traveling With others 56.8 37 Alone 43.2 63 Nationality Asian 20.8 20 Middle-Easter 35.2 48.3 European 23.9 18.1 Other 20.1 13.6

42
Table 2. Metric invariance test with permutation-based procedure for MGA. Constructs and items Diff P Sign Mean SD Physical servicescape: Second order Layout: First order The furniture at this airport is comfortable. .063 .458 No 4.72 1.483 I like the interior decorating (e.g., style of furniture) at this airport. .122 .262 No 4.20 1.544 I like the layout of this airport. .078 .444 No 3.69 1.419 The airport is kept clean. .053 .433 No 3.77 1.521 The airport looks attractive. .044 .674 No 3.92 1.395 The interior of the airport was appealing. .063 .423 No 3.82 1.472 Atmosphere: First order The atmosphere at this airport is pleasing. .073 .439 No 3.89 1.1829 This airport has an appealing atmosphere. .078 .127 No 4.03 1.819 The level of noise at this airport is appropriate for this setting. .111 .812 No 3.34 2.125 The lighting in this airport is appropriate for this setting. .112 .162 No 2.92 1.928 The music played in this airport was appropriate. .162 .090 No 3.77 1.792 Physical environment: First order I believe the physical environment at the airport is excellent. .151 .555 No 2.76 1.880 I am impressed with the quality of the airport’s physical environment.
.053 .423 No 3.87 2.012
The physical environment at the airport is of a high standard. .102 .657 No 3.66 1.803 Social servicescape: Second order Fellow traveler: First order Fellow travelers behaved in a pleasant manner. .060 .233 No 3.83 1.647 Fellow travelers behaved in a way that I was expecting. .163 .193 No 4.12 1.259 I enjoyed being around the other travelers in the airport. .151 .191 No 4.17 1.642 Fellow travelers conducted themselves in a manner that I find appropriate.
.143 .010 Yes 4.06 1.258
Fellow travelers behaved in a way that I found to be pleasant. .153 .673 No 4.09 1.551 Fellow travelers behaved in a way that I agree with. .173 .168 No 4.55 1.315 Employee service: First order I was very satisfied with the way that the employee treated me .072 .263 No 4.58 1.171 The employee gave me good reason to trust them. .043 .338 No 4.47 1.601 I was very satisfied with the employee’s ability to satisfy my needs. .071 .431 No 4.08 1.364 I was very satisfied with the employee’s ability to help me. .073 .878 No 3.93 .961 The employee appeared to be very enthusiastic. .158 .091 No 3.91 .801 The employee behaved in a manner that I found acceptable .119 .160 No 3.86 1.002 Airport vulnerability: First order Overall, I think that this airport is not gullible. .120 .262 No 4.40 1.951 Overall, I think that this airport is strong when dealing with travelers.
.075 .441 No 4.57 1.766
Overall, I think that this airport is not easy to fool. .069 .450 No 4.49 1.861 Overall, I think that this airport is very security conscious. .058 .437 No 4.91 1.694 Dissatisfaction I was not satisfied with the level of service that I received from the airport.
.062 .429 No 4.08 2.076
My expectations were not met. .072 .431 No 3.81 2.210 I was dissatisfied with the quality of service that I received. .018 .172 No 3.49 1.695 I was not very satisfied with the airport. .062 .814 No 3.91 1.918 Traveler misbehavior Failing to tell an employee when a mistake had been made in the respondent’s favor.
.161 .013 No 3.50 2.032
Complaining without genuine cause .155 .199 No 3.72 2.069 Using/consuming the facilities of a service without intending to pay. .151 .552 No 3.76 2.197 Knowingly stealing an item from the airport. .144 .010 Yes 4.13 2.188 Arguing with or being openly rude to a service employee or fellow travelers.
.102 .652 No 4.85 1.774
Knowingly damaging or vandalizing the airport’s property. .128 .163 No 4.89 1.802 Physically touching/striking a service employee or fellow traveler. .022 .238 No 4.91 1.907

43
Table 3. Reliability, convergent and discriminant validity of reflective constructs. First-order constructs
Loadings range*** CR g AVE ȡA
A B A B A B A B A B Lay .735,
.847(.777,
.855)
.714,
.822(.734,.801)
.761 .822 .735 .789 .533
.553
.877
.801
Atm .734, .900(.770,.832)
.720,
.887(.742,.892)
.922 .822 .869 .834 .649
.589
.900
.865
Env .867, .901(.811,.876)
.812,
.957(.842,.877)
.922 .822 .916 .869 .857
.828
.905
.872
Fell .646, .775(.721,.801)
.616,
.892(.701,.888)
.845 .801 .722 .791 .589
.581
.887
.821
Emp .716, .821(.701,.832)
.695,
.793(.723,.823)
.809 .878 .836 .878 .545
.523
.906
.886
Vul .731, .870(.754,.843)
.670,
.872(.723,.880)
.723 .805 .804 .844 .515
.513
.843
.821
Dissat .701, .822(.752,.843)
.637,
.867(.751,.789)
.915 .859 .855 .851 .718
.641
.771
.792
Misb .674, .833(.711,.851)
.731,
.800(.752,.821)
.945 .868 .883 .823 .590
.559
.911
.877
Airport Constructs (1) (2) (3) (4) (5) (6) (7) (8) Airport A Atm (1) .80
5
Lay(2) .322(.501)
.730
Env(3) .178(.350)
.230(
.333) .925
Fell(4) .521(.478)
.517(
.501) .433(.501)
.767
Dissat(5) .401(.457)
.471(
.520) .588(.472)
.215(.221)
.847
Misb(6) .146(.257)
.450(
.329) .322 .047(.1
98) .289(.292) .768
Emp(7) .246(.321)
.256(
.378) .334(.421)
.501(.451)
.555(.431) .252(.329)
.707
Vul(8) .299(.321)
.246(
.431) .379(.547)
.198(.231)
.272(.157) .238(.188)
.089(.032)
..717
Airport B Atm(1) .76
7
Lay(2) .189(.192)
.861
Env(3) .21 .227( .909

44
1(.303)
.278)
Fell(4) .577(.432)
.411(
.378) .444(.387)
.762
Dissat(5) .465(.387)
.222(
.239) .257(.289)
.189(.268)
.800
Misb(6) .090(.202)
.355(
.402) .289(.234)
.290(.305)
.440(.523) .747
Emp(7) .359(.376)
.092(
.123) .370(.234)
.389(.339)
.319(.236) .211(.237)
.710
Vul(8) .212(.302)
.179(
.389) .267(.459)
.256(.278)
.351(.321) .423(.337)
.333(.289)
.843
Note: Bolded values (diagonal) are square root of the AVEs. ***3.29 (p<.001); **2.58 (p<.01); *1.96 (p<.05). lay: layout, atm: atmosphere, env: environment quality, fell: fellow travelers, emp: employee service, vul: airport vulnerability, dissat: dissatisfaction, misb: traveler misbehavior. PLS (PLSc)

45
Table 4. Multicollinearity and weights of first-order constructs on second-order construct. Second-order constructs First-order constructs Airport A Airport B Weight t-value VIF Weight t-value VIF Physical servicescape Layout .401 10.091 2.201 .356 9.302 1.579 Atmosphere .436 11.321 2.622 .465 20.120 1.489 Environment quality .373 10.439 2.129 .249 10.411 2.179 Social servicescape Fellow traveler .481 10.123 1.366 .511 9.923 2.019 Employee service .586 10.418 1.439 .478 10.341 1.792 Airport vulnerability .198 9.329 2.201 .177 10.479 2.389 Note: t-value: 3.29 (p<.001); t-value: 2.58 (p<.01); t-value: 1.96 (p<.05). Weight PLS/PLSc.

46
Table 5. Results of compositional invariance and scalar invariance. Composite c-Value (0=1) 95% CI Permutation p-value Compositional invariance? Atm .996 [.989;1.000] .333 Yes Lay .975 [.965,1.000] .127 Yes Env .999 [.998,1.000] .133 Yes Fell .974 [.974,1.000] .461 Yes Dissat .999 [.999,1.000] .525 Yes Mis .999 [.997,1.000] .501 Yes Emp .998 [.996,1.000] .367 Yes Vul 1.000 [.999,1.000] .577 Yes Composite Variance difference 95% CI Permutation p-value Equal variance? Atm -.018 [-.123,.121] .171 Yes Lay -.091 [-.170,.176] .262 Yes Env -.032 [-.024,.215] .513 Yes Fell -.033 [-.051,0.175] .652 Yes Dissat -.158 [-.186,.190] .723 Yes Mis -.165 [-.216, .151] .532 Yes Emp -.142 [-.236, .151] .434 Yes Vul .171 [-.202,.200] .632 Yes Composite Mean difference 95% CI Permutation p-value Equal mean value? Atm -.002 [-.044,.041] .822 Yes Lay -.003 [-.041,.041] .762 Yes Env -.003 [-.045,.037] .239 Yes Fell .019 [-.123,.121] .345 Yes Dissat -.004 [-.187,.192] .523 Yes Mis .001 [-.023,.038] .432 Yes Emp -.045 [-.126,.122] .479 Yes Vul -.025 [-.045,.043] .820 Yes Note: CI = Confidence Interval. lay: layout, atm: atmosphere, env: environment quality, fell: fellow travelers, emp: employee service, vul: airport vulnerability, dissat: dissatisfaction, misb: traveler misbehavior

47
Table 6. MGA findings. Relationships
Airport A
Airport B
ȕ differences
Henseler’s MGA p-value
test
Permutation p-value test
Result
Physical servicescapeTraveler dissatisfaction
-.389*** -.232*** .157 .002*** .003*** Airport
A>Airport B
Physical servicescapeTraveler Misbehavior
-.570*** -.368*** .202 .001*** .006*** Airport
A>Airport B
Social servicescapeTraveler dissatisfaction
-.045 -.098** .053 .578 .362 Airport
AൎAirport B
Social servicescapeTraveler Misbehavior
-.107** -.203** .096 .135 .137 Airport
AൎAirport B
Traveler dissatisfactionTraveler Misbehavior
.632*** .507*** .125 .000*** .000*** Airport
A>Airport B
Note: *** ( p<.001); ** (p<.01); *(p<.05).

48
Table 7. The results of fsQCA for predicting dissatisfaction and misbehavior in two airports. Models for arrow a: dissat = f(lay, atm, env): Model of dissatisfaction based on physical servicescape conditions Airport A Airport B Causal model RC UC Con Causal model RC UC Con M1: lay*~env .620 .070 .915 M1: ~atm*~phy .873 .873 .808 M2: lay*~atm .671 .121 .877 solution coverage .873 solution coverage .742 solution consistency .808 solution consistency .858 Models for arrow b: dissat = f(fell, emp, vul): Model of dissatisfaction based on social servicescape conditions Airport A Airport B Causal model RC UC Con Causal model RC UC Con M1:~vul .447 .032 .823 M1:~vul .750 .044 .873 M2:~emp .664 .034 .828 M2:~emp 824 .022 .951 M3:~fell .658 .038 .827 M3:~fell .816 .033 .927 solution coverage .742 solution coverage .941 solution consistency .774 solution consistency .862 Models for arrow c: misb = f(lay, atm, env): Model of misbehavior based on physical servicescape conditions Airport A Airport B Causal model RC UC Con Causal model RC UC Con M1: lay*~ env .610 .057 .854 M1: ~atm*~ env .868 .868 .918 M2: lay*~atm .690 .137 .856 solution coverage .868 solution coverage .748 solution consistency .918 solution consistency .820 Models for arrow d: misb = f(fell, emp, vul): Model of misbehavior based on social servicescape conditions Airport A Airport B Causal model RC UC Con Causal model RC UC Con M1:~vul .460 .033 .805 M1:~vul .708 .066 .942 M2:~emp .679 .031 .804 M2:~emp .747 .023 .986 M3:~fell .672 .037 .802 M3:~fell .754 .042 .978 solution coverage .756 solution coverage .899 solution consistency .748 solution consistency .942 Note: RC: raw coverage, UC: unique coverage, Con: consistency. lay: layout, atm: atmosphere, env: environment quality, fell: fellow travelers, emp: employee service, vul: airport vulnerability, dissat: dissatisfaction, misb: traveler misbehavior. ~: negation.

49
Table 8. fsQCA results using a combination of physical and social servicescape conditions to predict dissatisfaction (arrow e in configurational model: Figure 1) and misbehavior (arrow f in configurational model: Figure 1). Models for dissatisfaction (arrow e) Airport A Causal model: dissat = f(lay, atm, env, fell, emp, vul) RC UC Con M1: lay*~atm*~ env*fell*vul .517 .006 .966 M2: lay*atm* env*emp*~vul .380 .023 .866 M3: lay*atm* env*~fell*emp .528 .025 .818 M4: lay*~ env*fell*emp*vul .567 .038 .956 M5: lay*~atm*fell*emp*vul .621 .040 .915 M6: lay*atm* env*fell*~emp*vul .501 .005 .825 solution coverage: .809 solution consistency: .808 Airport B Causal model: dissat = f(lay, atm, env, fell, emp, vul) RC UC Con M1: ~atm*~ env*~fell*~emp*~vul .565 .039 .978 M2: lay*~atm*~ env*~fell*~emp .588 .072 .987 M3: ~atm*~ env*fell*emp*~vul .378 .062 .966 solution coverage: .699 solution consistency: .957
Models for misbehavior (arrow f) Airport A Causal model: misb = f(dissat, lay, atm, env, fell, emp, vul) RC UC Con M1: dissat*lay*atm* env*emp*vul .586 .097 .897 M2: dissat*lay*~atm*~ env*fell*vul .520 .090 .954 M3: lay*atm*~ env*fell*emp*vul .453 .020 .918 M4: lay*~atm* env*fell*emp*vul .522 .041 .894 M5: lay*atm* env*fell*emp*~vul .392 .042 .861 solution coverage: .836 solution consistency: .831 Airport B Causal model: misb = f(dissat, lay, atm, env, fell, emp, vul) RC UC Con M1: dissat*~atm*~ env*~fell*~emp*~vul .494 .042 .998 M2: dissat*lay*~atm*~ env*~fell*~emp .514 .063 .998 M3: dissat*lay*~atm*~ env*fell*emp*~vul .301 .033 .999 solution coverage: .590 solution consistency: .998 Note: RC: raw coverage, UC: unique coverage, Con: consistency. lay: layout, atm: atmosphere, env: environment quality, fell: fellow travelers, emp: employee service, vul: airport vulnerability, dissat: dissatisfaction, misb: traveler misbehavior. ~: negation.

50
Table 9. Results of NCA for achieving low dissatisfaction and misbehavior in both airports.
Condition Outcome condition:~dissat
Airport A
Airport B Consistency Coverage
Consistency Coverage
lay 0.986 0.639
0.878 0.463 atm 0.865 0.753
0.458 0.596
env 0.914 0.733
0.287 0.661 fell 0.868 0.725
0.838 0.643
emp 0.868 0.728 0.894 0.668
vul 0.908 0.630
0.725 0.535
Condition Outcome variable: ~misb
Airport A
Airport B Consistency Coverage
Consistency Coverage
lay 0.974 0.663 0.945 0.318
atm 0.854 0.780
0.632 0.526 env 0.872 0.733
0.411 0.605
fell 0.856 0.750 0.927 0.455
emp 0.856 0.754 0.953 0.455
vul 0.903 0.658
0.805 0.380 ~dissat 0.877 0.919
0.936 0.599 Note: lay: layout, atm: atmosphere, env: environment quality, fell: fellow travelers, emp: employee service, vul: airport vulnerability, dissat: dissatisfaction, misb: traveler misbehavior. ~: negation.