white paper evai general cryptocurrency rating …
TRANSCRIPT

1
White Paper
EVAI GENERAL CRYPTOCURRENCY RATING FRAMEWORK
Abstract
Evai are pioneering a world-class decentralised rating system for Crypto, DeFi and NFTs that can be
used by anyone to evaluate these new asset classes. Through a combination of peer-reviewed financial
research and economic modelling, Evai provides decentralised and impartial ratings based on a multi-
factor AI & ML model without human intervention.
Introduction
Evai was created as a response to the financial crisis of 2008 which initiated the phenomenon of
‘Quantitative Easing’ (QE). QE has expanded money supply at the fastest rate since records began
and has become a policy response to all economic headwinds that we face, including the economic
downturn brought about by the Covid pandemic.
When we look back at the 2008 financial crisis, we can see that one of the major causes was the
misallocation of assets resulting from incorrect ratings being attached to high-risk assets. It is
therefore apparent that accurate ratings play a key role in fostering stability within our financial
system.
With the advancement of technology, we are now able to harness the power of Artificial intelligence
and Machine Learning to deliver truly decentralised ratings, free from human bias, based upon a solid
foundation of universally accepted academic theory.
Evai are delivering an unbiased financial ratings system that can theoretically be applied to all liquid
asset classes. When accurate ratings are applied to the current, approximately 12,000 digital assets
that make up the crypto ecosystem, the resultant ratings can be used to reliably inform asset allocation
and furthermore, Evai Ratings have been empirically tested and proven to offer predictive value, with
the implication that investors may be able to exploit exceptions to the widely accepted “Efficient
Market Hypothesis”.
Such an advancement in ratings technology adds value at every level from educational and regulatory
through to market efficiency and profitability.

2
Problems Identified
• The absence of an impartial rating system
• Ratings often determined by human analysts
• There is no universally accepted source of reliable data
Evai Solution
Evai provides an unbiased cryptoasset rating platform to identify the true underlying value of assets
in an emerging marketplace through AI and ML. Evai are further using these ratings to exploit
potential exceptions to the Efficient Market Hypothesis to deliver abnormal market returns.
1. OVERVIEW OF THE RATINGS PROCESS
The first level of financial ratings is univariate, where the rating will be based on a single factor.
The second level of financial ratings is more complicated, represented by the multi factor model,
developed in Gregoriou (2011) and Gregoriou (2019) on asset pricing. In the multifactor model, the
cryptocurrencies are rated on excess returns, after accounting for multiple factors. Evai will use both
rating levels for comparison purposes in constructing a unique, comprehensive digital asset rating
model.
In terms of data, we will use multiple data sources which will be in tandem with our own proprietary
data gathering techniques. The resultant ‘clean’ data is then used to update the ratings model
frequently. In instances where we do not have a full information set, we will provide a shadow rating,
which will be based on incomplete data and make this clear to the market. In instances where the data
is not rich enough or we deem it to be unreliable, we will not rate and will explain the reasons for
this.

3
2. UNIVARIATE (SINGLE FACTOR) RATINGS
We will have a univariate set of models that we use for individual ratings, these are single factor
models which are the following thus far:
• Liquidity: Composed by the following indicators: Turnover Ratio, Adjusted Turnover Ratio,
Amihud Ratio, FKG ratio (Gregoriuet al. ,2011), Roll Spread, Effective spreads, Quoted
Spreads, overall 7 indicators.
• Sentiment: Composed by Fear & Greed index, social development History Index, overall 2
factors.
• Risk: Sharpe Ratio, Sortino Ratio, overall 2 indicators.
• Momentum: Moving Average, Rate of Change, overall 2 indicators.
• Utility: Firm Profitability- Proxy ROI, overall 1 indicator.
• Bias: Peak End Value Demand, overall 1 indicator.
• Overextension: Fibonacci retracements, Ichimoku Cloud, Bollinhger Band, Stochastic
Oscillator, overall 4 indicators.
• Market Risk: Market Factor, overall 1 indicator.
• Capitalisation: Size, overall 1 indicator.
We will have 9 main factors in the univariate framework, multivariate framework, so overall we will
have 21 factors.

4
During the ratings analysis, each of these criteria is rated on the A to D scale.
Univariate Cryptocurrency Rating
SECURE
A1 Exceptionally Strong
A2 Very Strong
A3 Strong
B1 Good
VULNERABLE
B2 Moderately weak
B3 Weak
C1, C2, C3 Very weak
D Distressed
The following table gives the details of deciding the rating scale of cryptocurrencies according to the
value of each rating criteria.
Indicator Variable Description
LIQUIDITY MEASURES
Turnover
Ratio
Turnover ratio is the volume of cryptocurrency traded relative to the outstanding
currency. The higher the turnover ratio, the more frequently the cryptocurrency is
being exchange. The easier it is to exchange, the more liquidity and consequently the
higher the value of the asset.
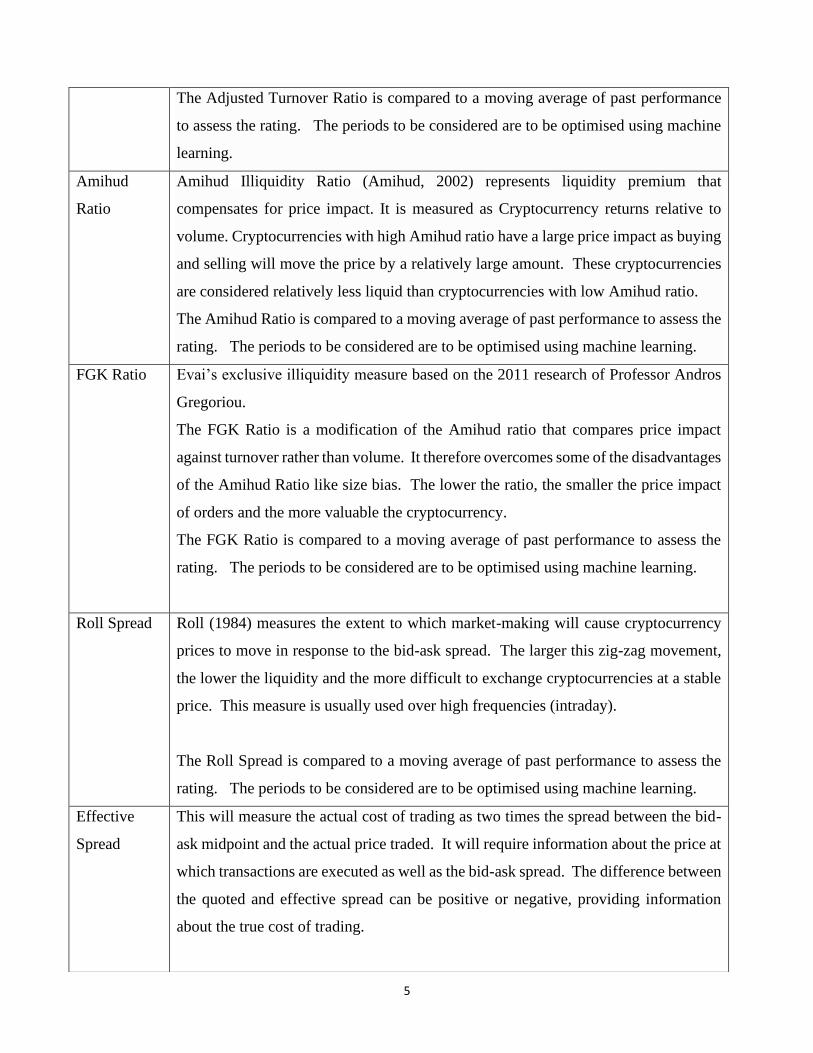
The Turnover Ratio is compared to a moving average of past performance to assess
the rating. The periods to be considered are to be optimised using machine learning.
Adjusted
Turnover
Ratio
This measure is defined as the standardized turnover-adjusted number of zero-trading
volume days over one month. A cryptocurrency with higher number of zero daily
volume is less likely to be traded and thus less liquid. (Liu, 2006).
5
The Adjusted Turnover Ratio is compared to a moving average of past performance
to assess the rating. The periods to be considered are to be optimised using machine
learning.
Amihud
Ratio
Amihud Illiquidity Ratio (Amihud, 2002) represents liquidity premium that
compensates for price impact. It is measured as Cryptocurrency returns relative to
volume. Cryptocurrencies with high Amihud ratio have a large price impact as buying
and selling will move the price by a relatively large amount. These cryptocurrencies
are considered relatively less liquid than cryptocurrencies with low Amihud ratio.
The Amihud Ratio is compared to a moving average of past performance to assess the
rating. The periods to be considered are to be optimised using machine learning.
FGK Ratio Evai’s exclusive illiquidity measure based on the 2011 research of Professor Andros
Gregoriou.
The FGK Ratio is a modification of the Amihud ratio that compares price impact
against turnover rather than volume. It therefore overcomes some of the disadvantages
of the Amihud Ratio like size bias. The lower the ratio, the smaller the price impact
of orders and the more valuable the cryptocurrency.
The FGK Ratio is compared to a moving average of past performance to assess the
rating. The periods to be considered are to be optimised using machine learning.
Roll Spread Roll (1984) measures the extent to which market-making will cause cryptocurrency
prices to move in response to the bid-ask spread. The larger this zig-zag movement,
the lower the liquidity and the more difficult to exchange cryptocurrencies at a stable
price. This measure is usually used over high frequencies (intraday).
The Roll Spread is compared to a moving average of past performance to assess the
rating. The periods to be considered are to be optimised using machine learning.
Effective
Spread
This will measure the actual cost of trading as two times the spread between the bid-
ask midpoint and the actual price traded. It will require information about the price at
which transactions are executed as well as the bid-ask spread. The difference between
the quoted and effective spread can be positive or negative, providing information
about the true cost of trading.

6
The Effective Spread is compared to a moving average of past performance to assess
the rating. The periods to be considered are to be optimised using machine learning.
Quoted
Spread
Quoted bid-ask spread is the difference between the best bid and best ask price. A
narrow spread implies lower trading costs and more liquidity.
The Bid-Ask Spread is compared to a moving average of past performance to assess
the rating. The periods to be considered are to be optimised using machine learning.
SENTIMENT ANALYSIS
Indicator Variable Description
Fear and
Greed Index
The Crypto Fear & Greed Index is evaluated as an equally weighted index of five
indicators, i.e., Volatility, Market Momentum, Volume, cap factor and crypto Social
Media history.
The indicator quantifies the simple yet important element of investing psychology,
i.e., most investments happen mainly due to greed or fear, and most sell-offs similarly
happen mainly due to either greed or fear.
The Fear and Green Index is constructed to run from 0 to 100. A score of 100 is a top
rating and a score of 0 equates to the lowest rating.
Social
Development
History
Index
Evai.io understands the importance of social media ranking. The Evai.io cross-
platform cryptocurrency online performance Index represents a holistic view of crypto
coin performance in Facebook, Twitter, Reddit and GitHub.
This index allows investors to track the specific information they need to drive their
unique investing strategies.
The Social Development Index is constructed to run from 0 to 100. A score of 100 is
a top rating and a score of 0 equates to the lowest rating.
RISK INDICATORS
Indicator Variable Description
Sharpe Ratio The Sharpe Ratio measures the return on the Cryptocurrency above that of the risk-
free rate, relative to the standard deviation of those returns. It is the return per unit of
risk and the higher the measure the better the investment. Sharpe (1966).
The Sharpe Ratio is compared to a moving average of past performance to assess the
rating. The periods to be considered are to be optimised using machine learning.
7
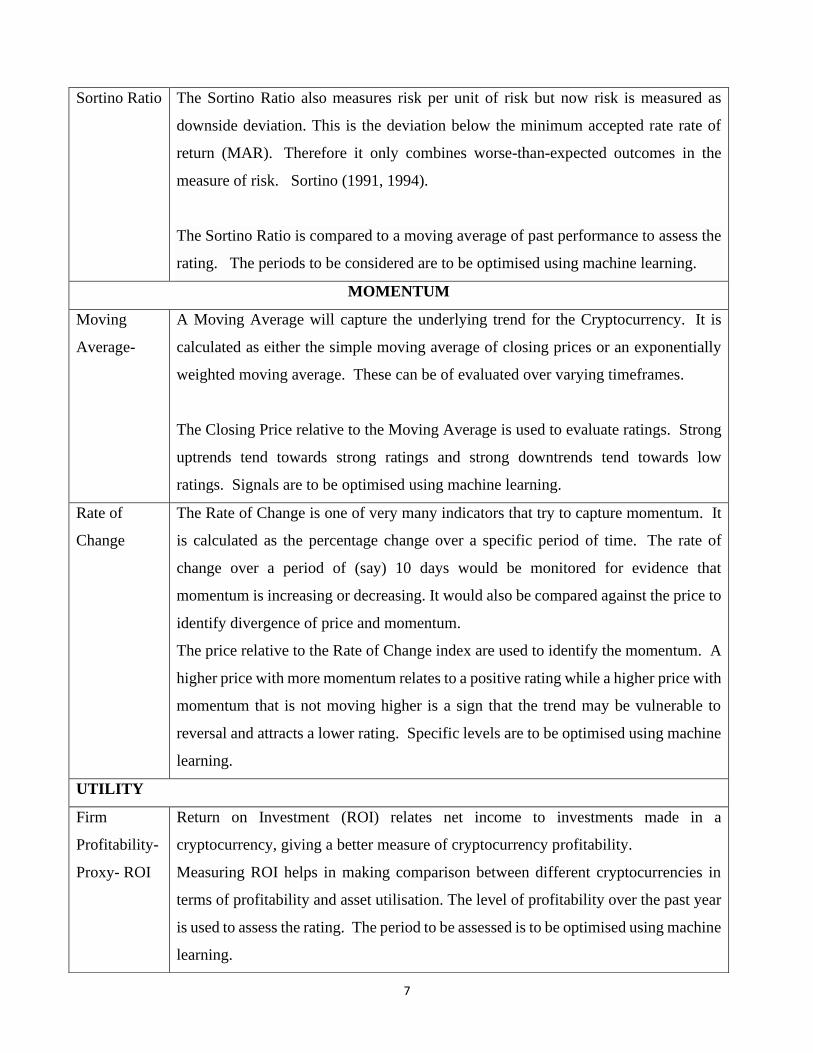
Sortino Ratio The Sortino Ratio also measures risk per unit of risk but now risk is measured as
downside deviation. This is the deviation below the minimum accepted rate rate of
return (MAR). Therefore it only combines worse-than-expected outcomes in the
measure of risk. Sortino (1991, 1994).
The Sortino Ratio is compared to a moving average of past performance to assess the
rating. The periods to be considered are to be optimised using machine learning.
MOMENTUM
Moving
Average-
A Moving Average will capture the underlying trend for the Cryptocurrency. It is
calculated as either the simple moving average of closing prices or an exponentially
weighted moving average. These can be of evaluated over varying timeframes.
The Closing Price relative to the Moving Average is used to evaluate ratings. Strong
uptrends tend towards strong ratings and strong downtrends tend towards low
ratings. Signals are to be optimised using machine learning.
Rate of
Change
The Rate of Change is one of very many indicators that try to capture momentum. It
is calculated as the percentage change over a specific period of time. The rate of
change over a period of (say) 10 days would be monitored for evidence that
momentum is increasing or decreasing. It would also be compared against the price to
identify divergence of price and momentum.
The price relative to the Rate of Change index are used to identify the momentum. A
higher price with more momentum relates to a positive rating while a higher price with
momentum that is not moving higher is a sign that the trend may be vulnerable to
reversal and attracts a lower rating. Specific levels are to be optimised using machine
learning.
UTILITY
Firm
Profitability-
Proxy- ROI
Return on Investment (ROI) relates net income to investments made in a
cryptocurrency, giving a better measure of cryptocurrency profitability.
Measuring ROI helps in making comparison between different cryptocurrencies in
terms of profitability and asset utilisation. The level of profitability over the past year
is used to assess the rating. The period to be assessed is to be optimised using machine
learning.

8
BIAS
Peak End
Value
Demand
This is the peak return that has been achieved over the last month and the final return
for the month or preceding months for the lagged version.
It is a variable that seeks to capture well-known behavioural biases in decision-making
related to the importance attached to peak and end experience by investors.
Positive peak and end readings provide a high rating. Negative peak and end readings
provide a low rating. Machine learning will be used to fine tune intermediate
indications.
A simple two factor Peak-End model can more comprehensively explain the variations
in returns between portfolios sorted by firm size and momentum than popular factor
models (the single-factor CAPM, the Fama-French Three-Factor Model, the Carhart
Four-Factor Model, and the Fama-French Five-Factor Model). This is ground-
breaking with respect to crypto currencies.
OVEREXTENSION
Fibonacci
retracements
Fibonacci retracement levels can help to quantify levels of retracement risk. They are
based on the Golden Ratio (0.618) and are considered to be levels where profit-taking
or re-evaluation may naturally have taken place. The greater the retracement risk, the
more vulnerable the Cryptocurrency.
Retrenchments across currencies are ranked and used to assess the level or retracement
risk. Where the potential retracement is small, the rating will be high; where the
potential retracement is high, the rating will be low.
Ichimoku
Cloud
Ichimoku cloud is part of the Japanese collection of technical tools. It is based on a
combination of multiple moving averages and trading ranges. It provides information
about trend as well as support and resistance levels.
Ichimoku cloud produces numerous indicators that feed into the rating process. These
indicators are optimised for particular Cryptocurrencies and market conditions.
Bollinger
Band
The Bollinger Band is one method of identifying extreme price movements. It is a
trademarked property of John A. Bollinger. The Bollinger Band consists of a moving
average of the price combined with upper and lower bands that are based on multiples
of the standard deviation of the moving average. The bands identify price extremes
and the relative performance of the bands (converging or diverging) will help to

9
determine market conditions: consolidation or trending. They can be used to identify
risk, reversal potential or the relative weight to apply to consolidation-trending tools.
Bollinger Bands can identify initiation of a trend (a positive rating if positive and a
negative rating if negative). They can also show risk of a pull back if the extreme is
reached and not sustained (negative rating for a negative pullback and a positive rating
for a positive pull back). Extremes and parameters are to be identified and optimised
with machine learning.
Stochastic
Oscillator
The Stochastic Oscillator is another momentum indicator. This indicator compares the
current price to the price range over a given period. High readings show strong
upward momentum and low reading strong downward momentum. Divergence
between the Cryptocurrency price and the momentum indicator are also used.
The price relative to the Stochastic Oscillator is used to identify the momentum. A
higher price with more momentum relates to a positive rating while a higher price with
momentum that is not moving higher is a sign that the trend may be vulnerable to
reversal and attracts a lower rating. Specific levels are to be optimised using machine
learning.
MARKET RISK
Market
Factor
The Market Factor shows the relationship between the return on a Cryptocurrency and
the return on a basket of Cryptocurrencies. It is a measure of Systematic Risk, and it
shows how much this Cryptocurrency would be affected by shocks that affect the
whole Crypto currency market. This is sometimes called the beta. A beta of 1
indicates that the return on this Cryptocurrency is very similar to the overall market; a
beta above 1 means that the Cryptocurrency is very sensitive and will react more in
both positive and negative way to changes in the Cryptocurrency market; a beta below
1 shows that the reaction to the market is muted. A higher beta is considered to be
higher risk.
The Market factor is compared to a moving average of past performance to assess the
rating. The periods to be considered are optimised using machine learning.
CAPITALISATION

10
3. MULTIFACTOR RATINGS
The multi variate financial rating models will be the unique contribution of Evai.io, aiming to design
a multifactor model for Cryptocurrencies. The model will be based on Gregoriou et al (2019), where
financial ratings are a function of systematic risk, firm size, profit, investment, sentiment, peak, end
and liquidity. This 7-Factor model has been developed for the equity market (Gregoriou A., J.V.
Healy, H. Le, 2019).
Initially, the rating model will include only the following indicators: Amihud Ratio, (Liquidity), Fear
& Greed Index (Sentiment), Sharpe Ratio (Risk), Moving Average (Momentum), Firm Profitability-
Proxy - ROIi ,(Utility), Peak End (Bias). The rating model will be constantly improving, more factors
will be added, and the methodology will be tested across different digital assets and portfolios. Our
model will optimise against the daily return on investment.
Size Size is a measure of capitalisation. There is a size factor for equities with strong
evidence that firms with lower capitalisation have a relatively high return even when
risk has been accounted for. Our research suggests that for Cryptocurrencies, there is
a positive size effect with the Cryptocurrencies with a larger capitalisation making
higher returns, even when other risks have been accounted for.
The rating is assessed by comparing Market Capitalisation across
Cryptocurrencies. Those with the highest Capitalisation have the highest rating and
those with the lowest have the lowest rating.

11
Evai Ratings Model Flow Chart
4. MACHINE LEARNING AND AUTO-ML
The reason for applying Machine Learning (ML) techniques to financial data is that ML methods
model non-linear relationships in the data. Non-linear techniques are required when outputs are not
directly proportional to the inputs. Traditional analytical methods (e.g. OLS) assume a linear
relationship, exists, or utilises non-linear functions that can be simplified to a linear model. Machine
Learning is a sub field of Artificial Intelligence (AI), and encompasses a large and varied set of
algorithms, suited to different tasks.
Here, we are concerned only with one of these categories, Supervised Learning, and the task is
regression. Even so, there are many algorithms suitable for this task, and even more variants of each
of these algorithms. Typically, ML algorithms have numerous hyper-parameters that require tuning.

12
This is especially true of Deep Learning (Deep Neural Networks), which require considerable
expertise to implement effectively. In order to make ML more accessible to non-expert users, speed
up model development and deployment, automate data pre-processing and hyper-parameter tuning,
and provide a performance ranking of different algorithms, Automated Machine Learning (AutoML)
has been developed. AutoML is a set of algorithms that provide a unified interface to diverse ML
algorithms as well as performing some or all of the aforementioned tasks, and more. AutoML is state-
of-the-art technology still in its early evolution. There are several rival AutoML systems offered by
various vendors. Commercial examples are; AutoAI in IBM Watson Studio, Google Cloud AutoML,
and AutoML Microsoft Azure cloud service. There also exist several open-source versions of
AutoML, such as: Neural Network Intelligence, Microsoft's open-source AutoML toolkit,
TransmogrifAI, end-to-end AutoML toolkit for structured data, and H2O AutoML.
For our work it was necessary to select a specific instantiation of AutoML, and we elected to use the
latter of the above, H2O Automl. We chose this because it is open source, meaning that the source
code for all of the algorithms used is in the public domain. Thus, we avoid problems inherent in using
proprietary “black-box" systems. Also, it offers a selection of up-to-date ML algorithms, and is among
the industry leaders in the field.
4.1 H2O AutoML
H2O AutoML (LeDell and Poirier 2020) provides an interface that automates the process of training
a large selection of candidate models, by providing a simple wrapper function that performs a number
of modelling-related tasks. These include; Automatic training and tuning of many models within a
user-specified number or time-limit. Production of Stacked Ensembles – one based on all previously
trained models, another one on the best model of each family – are automatically trained on
collections of individual models to produce highly predictive ensemble models which, in most cases,
will be the top performing models in theAutoML Leaderboard. Several model explainer methods are
provided. These apply to AutoML objects (groups of models), as well as individual models (e.g.
leader model). Explanations can be generated automatically with a single function call, providing a
simple interface to explore and explain the AutoML models. The H2O AutoML interface is designed
to have as few parameters as possible so that all the user needs to do is point to their dataset, identify
13
the response column and optionally specify a time constraint or limit on the number of total models
trained.
The following algorithms are currently supported by AutoML; Distributed Random Forest (DRF),
Extremely Randomised Trees (XRT), General Linearised Models (GLM), Gradient Boosting
Machine (GBM), Deep Learning (Neural Networks), Stacked Ensembles. There follows a brief
description of each algorithm.
4.2 How we Use Machine Learning
We will use the AutoML machine learning algorithm to better learn the true data generating process
linking the individual predictive factors included in our models. The AutoML algorithm will train
(fits) the ML algorithms we select as being most appropriate for the learning task at hand. It will also
train two ensemble models, optimally combining the best performing individual ML algorithms. The
trained models will be presented in a “Leaderboard", ranked in order of performance, as determined
by different statistical performance indicators. This will allow identification of the best performing
model. Also provided will be tables that allow identification of the relative importance and percentage
contribution of each individual factor (independent variable) in explaining the variance of the
dependent variable in the model. The Out-Comparison of model Predicted v. Actual values, also will
allow us to determine whether the models we train provide a statistically significant economic
advantage compared to reference linear models. Real-time adjustments are implemented to optimise
weightings with the objective of maximising the accuracy of the model.
5. RATING ASSESSMENT
5.1 Introduction
The evai ratings are used to create a portfolio of digital assets. This portfolio is compared to a variety
of benchmarks. The ratings improve the performance of the portfolio relative to the benchmarks
outside of specific cases. The results are robust to alternative benchmark specifications, alternative
time periods and alternative risk measurements. There is strong evidence that evai ratings can improve

14
investment performance.
5.2 Results
Table 1 shows annualised returns, annualised volatility and the Sharpe Ratio, return per unit of risk,
for the Rating-based portfolio and a number of benchmarks.
The rating-based portfolio has the highest return of the benchmarks against which it is tested. This
provides a compensation for the increased risk. The return per unit of risk, as measured by the Sharpe-
Ratio, is more-or-less the same as that for the equally-weighted portfolio.
Table 2 reports a number of daily performance metrics for the four portfolios over the period from
the beginning of 2020 to mid-July. The advantage of the diversified portfolio of Crypto assets is clear
from the performance of rating-weighted and equally-weighted portfolios. BTC has a weight of 60%
in the capitalisation weighted portfolio.
The worst day for the rating-weighted portfolio is 12 March 2020 when the fund loses 43% of its
value. There is a lot of risk in Crypto and the rating-based portfolio does not seem to avoid this. The
portfolio suffers the maximum drawdown, the greatest 5% VaR and some negative skew. These
metrics would be improved if the SAND coin were incorporated into the portfolio. SAND was
removed as an outlier as a consequence of the 4000 percent increase that was experienced on 14

15
August 2020.
5.3 The portfolios
• The rating-based portfolio is based on weights calculated according to the ratings at the
beginning of 2020. The weight for each coin is determined by:
𝑤𝑒𝑖𝑔ℎ𝑡𝑖 =𝑅𝑇𝑖
∑ 𝑅𝑖=𝑁𝑖=1 𝑇𝑖
,
where 𝑅𝑇𝑖 is the ten scale rating for the nth currency where A3 = 1 and U = 10.
• The equally weighted portfolio weights all coins equally.
• The capitalisation-weighted portfolio weights coins according to the capitalisation at the
beginning of 2020. The weight for each coin is determined by:
𝑤𝑒𝑖𝑔ℎ𝑡𝑖 =𝐶𝑃𝑖
∑ 𝐶𝑖=𝑁𝑖=1 𝑃𝑖
,
where 𝐶𝑃𝑖 is the capitalisation of the nth currency. Coins without capitalisation data at the
beginning of 2020 are excluded.
• BTC is also used as a benchmark of performance.
Extensions
Additional testing needs to be done with alternative specifications. These will include:
• a more dynamic weighting process that will assess performance when portfolios are rebalanced
once per year.
• An adjustment of the weighting mechanism that will increase the importance of the rating
system, boosting the highly rated currencies and reducing the weight of the low rated currencies.
• At the moment there are 39 currencies being assessed over a two year period. The results do not
change significantly when the portfolios are assessed over the period 2017 to the present day.
They do not change significantly when SAND is included. For the current study SAND was
excluded as it had a near 4000 percent increase in value on 14 August 2020 when it began trading

16
on Binance. With SAND, the rating-based portfolio has a more positive risk profile with a
positive skew to the distribution of returns.
• Creation of smart beta portfolios. A momentum portfolio, based on those coins with the best
performance over the last 6 to 12 months; a minimum-variance portfolio, based on those
portfolios with the lowest variance over the last 6 to 12 months. If some validation metrics can
be discovered, growth and value portfolios can be created.
• Long-short portfolios can be created. For example, the portfolio could be long 50% based
highest rating and short 50% based on the lowest rating. It is also possible to have a 130% long,
30% short strategy to maintain market neutrality. These will depend on the cost of shorting.
• It is also possible to examine a correlation matrix of the returns of these 38 coins for the period
since the beginning of 2020. Doing that reveals the following:
References
Al-Mwalla, M., & Karasneh, M. (2011). Fama & French Three Factor Model: Evidence from
Emerging Market. European Journal of Economics, Finance and Administrative Sciences.
Arghyrou, M.G. and Gregoriou, A., (2007), Testing for purchasing power parity correcting for non-
normality using the wild bootstrap. Economics Letters, 95(2), pp.285-290.
Arghyrou, M.G. and Gregoriou, A., (2008). Non-linearity versus non-normality in real exchange rate
dynamics. Economics Letters, 100(2), pp.200-203.
Bitstamp, Bitfinex, BTC-e, HitBTC, and itBit (2018). “The_Liquidity_of_Bitcoin”. International
Journal of Economics and Finance
Erin LeDell and Sebastien Poirier. “H2O AutoML: “Scalable Automatic Machine Learning.” 7th
ICML Workshop on Automated Machine Learning (AutoML), July 2020. URL
https://www.automl.org/wp-content/uploads/2020/07/AutoML_2020_paper_61.pdf.
Fama, E.& K. French, (1993), Common Risk Factors in the Returns on Stocks and Bonds, Journal of
Financial Economics, 33, pp.3-56
Fama, E.& K. French, (2015), A five-factor Asset Pricing Model, Journal of Financial Economics,
116, pp.1-22
FITCH (2020) “Rating process.”
17
Florackis, C., Gregoriou, A. and Kostakis, A., 2011. Trading frequency and asset pricing on the
London Stock Exchange: Evidence from a new price impact ratio. Journal of Banking &
Finance, 35(12), pp.3335-3350.
Florackis, C., Gregoriou, A. and Kostakis, A., 2011. Trading frequency and asset pricing on the
London Stock Exchange: Evidence from a new price impact ratio. Journal of Banking &
Finance, 35(12), pp.3335-3350.
Friedman, Jerome, Trevor Hastie, and Robert Tibshirani. “Additive Logistic Regression: A Statistical
View of Boosting (With Discussion and a Rejoinder by the Authors).” The Annals of Statistics 28.2
(2000): 337-407
Geurts, P., Ernst, D. & Wehenkel, L. “Extremely randomized trees". Mach Learn 63, 3–42 (2006).
https://doi.org/10.1007/s10994-006-6226-1
Gregoriou A., J.V. Healy, H. Le, (2019), Prospect Theory and Stock Returns: A Seven Factor Pricing
Model, Journal of Business Research, 101, pp.315-322.
Gregoriou, A., (2019). Cryptocurrencies and asset pricing. Applied Economics Letters, 26(12),
pp.995-998.
Gregoriou, A., Healy, J.V. and Le, H., 2019. Prospect theory and stock returns: A seven factor pricing
model. Journal of Business Research, 101, pp.315-322.
J. Assunção, P. Fernandes, L. Lopes and S. Normey, "Distributed Stochastic Aware Random Forests
-- Efficient Data Mining for Big Data," 2013 IEEE International Congress on Big Data, 2013, pp.
425-426, doi: 10.1109/BigData.Congress.2013.68.
Jerome Friedman, Trevor Hastie, and Rob Tibshirani. “Regularization Paths for Generalized Linear
Models via Coordinate Descent". Journal of Statistical Software, 33(1), 2009.
LeDell, E. “Scalable Ensemble Learning and Computationally Efficient Variance Estimation”
(Doctoral Dissertation). University of California, Berkeley, USA. (2015).
Mark J van der Laan, Eric C Polley, and Alan E Hubbard. “Super Learner.” Journal of the American
Statistical Applications in Genetics and Molecular Biology. Volume 6, Issue 1. (September 2007).
Moody's (2020). “Procedures and Methodologies Used to Determine Credit Ratings.”
Moodys-Ratin (2020). “Ratings Disclosures_Moodys-Rating-Symbols-and-Definitions”
Morningstar (2013) “Quantitative Equity Credit Ratings Methodology”
Parea.io (2018) “Why no one should trust the Weiss Cryptocurrency Ratings”

18
Samira Pouyanfar, Saad Sadiq, Yilin Yan, Haiman Tian, Yudong Tao, Maria Presa Reyes, Mei-Ling
Shyu, Shu-Ching Chen, and S. S. Iyengar. 2018. “A Survey on Deep Learning: Algorithms,
Techniques, and Applications”. ACM Comput. Surv. 51, 5, Article 92 (January 2019), 36 pages.
DOI:https://doi.org/10.1145/3234150