white oak reportdnr.wi.gov/topic/forestbusinesses/documents/whiteoakreport.pdf · change in acreage...
TRANSCRIPT
Division of Forestry WI Dept of Natural Resources 2016
How has the white oak resource changed? Volume and diameter class distribution:
Where is white oak found in Wisconsin? Growing stock volume by region with map
What kind of sites does white oak grow on? Habitat type and site index distribution
How fast is white oak growing? Average annual net growth: trends and ratio of growth to volume
How healthy is white oak in Wisconsin? Average annual mortality: trends and ratio of mortality to volume
How much white oak do we harvest? Roundwood production by product and ratio of growth to removals
How much white oak biomass do we have? Tons of aboveground biomass by region of the state
Can we predict the future of white oak? Modelling future volumes
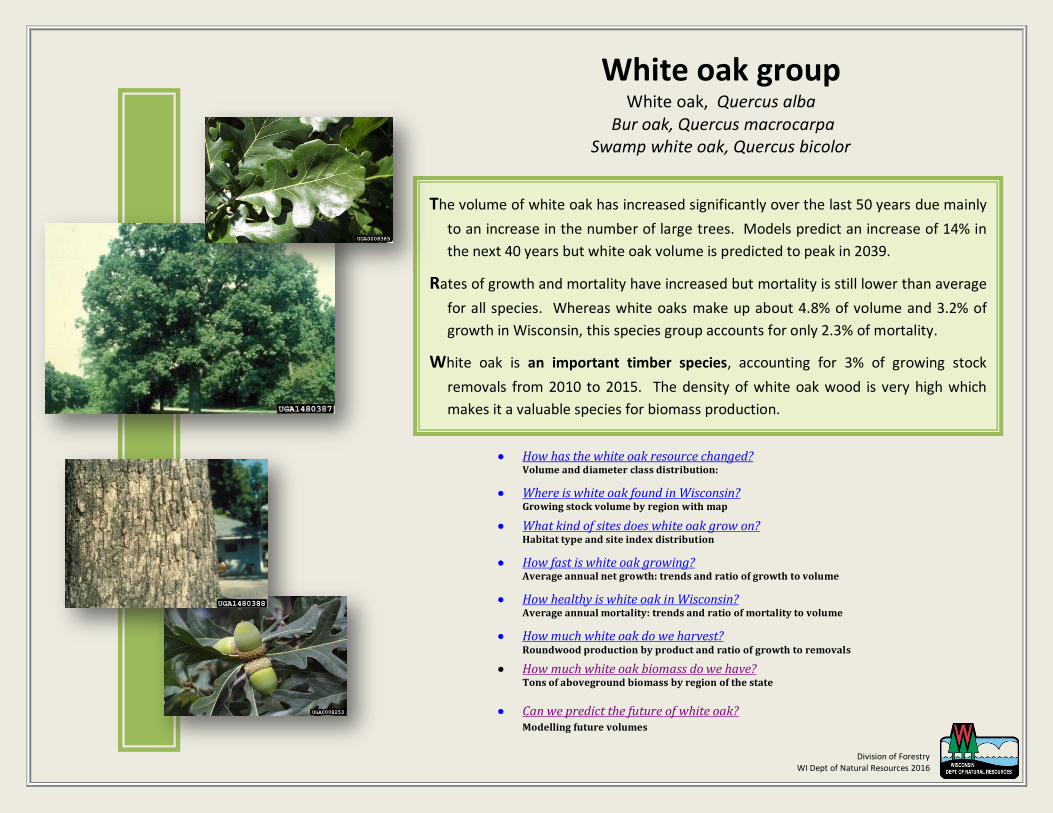
White oak group White oak, Quercus alba
Bur oak, Quercus macrocarpa Swamp white oak, Quercus bicolor
The volume of white oak has increased significantly over the last 50 years due mainly
to an increase in the number of large trees. Models predict an increase of 14% in
the next 40 years but white oak volume is predicted to peak in 2039.
Rates of growth and mortality have increased but mortality is still lower than average
for all species. Whereas white oaks make up about 4.8% of volume and 3.2% of
growth in Wisconsin, this species group accounts for only 2.3% of mortality.
White oak is an important timber species, accounting for 3% of growing stock
removals from 2010 to 2015. The density of white oak wood is very high which
makes it a valuable species for biomass production.

0
50
100
150
200
250
0-19 20-39 40-59 60-79 80-99 100-119
Change in acreage of red pine forest type
1983
1996
2005
The growing stock volume of white oaks is approximately 1.0 billion cubic
feet or about 4.8% of total statewide volume (chart on right). Volume rose steadily from 1938 to 1996 but has remained statistically unchanged since 1996.
Growing stock volume in all size classes has increased since 1983 but
especially in larger trees (chart below left). The volume in small trees (5 to 12.9 inches) has decreased 24% since 1996 while volume in large trees (13+ inches) has increased by 20% in the same period.
The number of poles has decreased by 27% for all white oaks and 39% for
white oak since 1996 (chart below right). The number of saplings and sawtimber has increased slightly.
Growing stock volume (million cubic feet) by diameter class (inches). Source: USDA Forest Inventory and Analysis data
“How has the white oak resource changed?” Growing stock volume and diameter class distribution by year
Percentage change in the number of live trees by size class between 1996 and 2015. Source: USDA Forest Inventory and Analysis data 1996 and 2015.
Growing stock volume (million cubic feet) by inventory year. Source: USDA Forest Inventory and Analysis data
0
50
100
150
200
250
300
350
1983 1996 2015
Mill
ion
cft
Volume of white oaks by diameter class
5-8.9
9-12.9
13-16.9
17-20.9
21-24.9
25+
8%
68%
-8%
2%
0%
5%
-39%
-27%
24%
-38%
7%10%
-50%
-25%
0%
25%
50%
75%
bur oak swamp whiteoak
white oak Total white oaks
Percentage change in tree numbersSapling Pole Sawtimber
1,042
0
300
600
900
1200
1938 1943 1948 1953 1958 1963 1968 1973 1978 1983 1988 1993 1996 2004 2009 2015
Mill
ion
cft
Growing stock volume of white oaks

Two thirds of the white oak group is white oak with bur oak
making up most of the remainder (Table 1).
White oaks occur throughout Wisconsin but are much more
common in the western and central parts of the state. The
northeast has only 3% of all white oak volume. The majority
of white oak occurs on the oak hickory forest type.
Table 1. Growing stock volume (million cft) by species and region of the state.
Species Central North east
North west
South east
South west
Total Percent of total
Bur oak 61 8 82 79 92 322 31%
Swamp white oak 11 3 1 11 7 33 3%
White oak 234 11 86 114 238 684 66%
Total white oaks 306 22 169 204 341 1,042 100%
Percent of total 29% 2% 16% 20% 33% 100%
Source: USDA Forest Service, Forest Inventory and Analysis
For a table of Volume by County go to: http://dnr.wi.gov/topic/ForestBusinesses/documents/tables/VolumeCountySpecies.pdf
“Where do white oaks grow in Wisconsin?”
Growing stock volume by region with map

“What kind of sites does white oak grow on?”
Habitat type1 and site index distribution
The three white oak species have different habitat preferences (chart below). Almost 40% of white oak volume
The majority of white oak and bur oak growing stock volume is
found in stands with slightly poorer site indices (chart on left).
Swamp white oak occurs on sites with a slightly higher average
site index (sampling error is quite high).
The average site index by volume for white oak and bur oak is
about 64, slightly lower than the average for all species, 66.
The average index for swamp white oak is 68 slightly higher
than the average for all species.
occurs on dry habitat types. About 60% of swamp white oak volume is found on wetter habitat types. Bur oak occurs on a broad range of sites.
Percent distribution of growing stock volume by habitat type group (USDA Forest Inventory & Analysis data).
Percent distribution of growing stock volume by site index class (USDA Forest Inventory & Analysis data).
1 For more information on habitat types see Schmidt, Thomas L. 1997. Wisconsin forest statistics, 1996. Resource Bulletin NC-183. St. Paul, MN: U.S. Dept. of Agriculture, Forest Service, North Central
Habitat type group1
3%Dry-mesic,
13%
Dry-mesic to Mesic,
22%Mesic, 23%
Mesic to Wet-mesic,
13%
2% 22%
Bur Oak
8%
Dry-mesic,
30%
Dry-mesic to Mesic,
18%
Mesic, 22%
6%
1%
14%
White Oak
Very Dry to Dry, 13%
6%
3%Mesic to
Wet-mesic, 14%
Wet, 46%
19%
Swamp White OakVery Dry to Dry
Dry to Dry-mesic
Dry-mesic
Dry-mesic to Mesic
Mesic
Mesic to Wet-mesic
Wet
Undefined
0%
5%
10%
15%
20%
25%
30%
35%
<41 41 - 50 51 - 60 61 - 70 71 - 80 81 - 90 91+
Site index class
Percent of volume by site index
Bur Oak
White Oak
All Species
Swamp white oak

“How fast are white oaks growing?”
Average annual net growth by region and year
Region Net
growth Percent of total
Ratio of growth to volume
Northeast 0.4 2% 1.8%
Northwest 3.4 19% 2.0%
Central 6.4 35% 2.1%
Southwest 4.6 25% 1.3%
Southeast 3.6 20% 1.8%
Statewide 18.4 100% 1.8%
Source: USDA Forest Inventory and Analysis
Table 2. Average annual net growth (million cft/year) of growing stock and the ratio of growth to volume by region of the state.
The greatest volume of white oak growth is in southern and central
Wisconsin. The average ratio of growth to volume for white oaks
is 1.8%, much lower than the statewide average of 2.7% for all
species (Table 2). White oaks represent 4.8% of volume but only
3.2% of volume growth in the state.
Average annual net growth (million cubic feet). Source: USDA Forest Inventory & Analysis data
For a table of Average annual growth, mortality and removals by region go to:
http://dnr.wi.gov/topic/ForestBusinesses/documents/tables/GrowthMortalityRemovals.pdf
Average annual net growth of white oaks was about 18.4 million
cubic feet per year between 2010 and 2015, representing
3.2% of statewide volume growth (chart on right). Growth
rates have increased 60% since 1983 but have remained
unchanged since 2009.
11.2 11.5 16.7 20.7 18.40
5
10
15
20
25
1968 1983 1996 2009 2015
Mill
ion
cft
Average annual net growth of white oaks
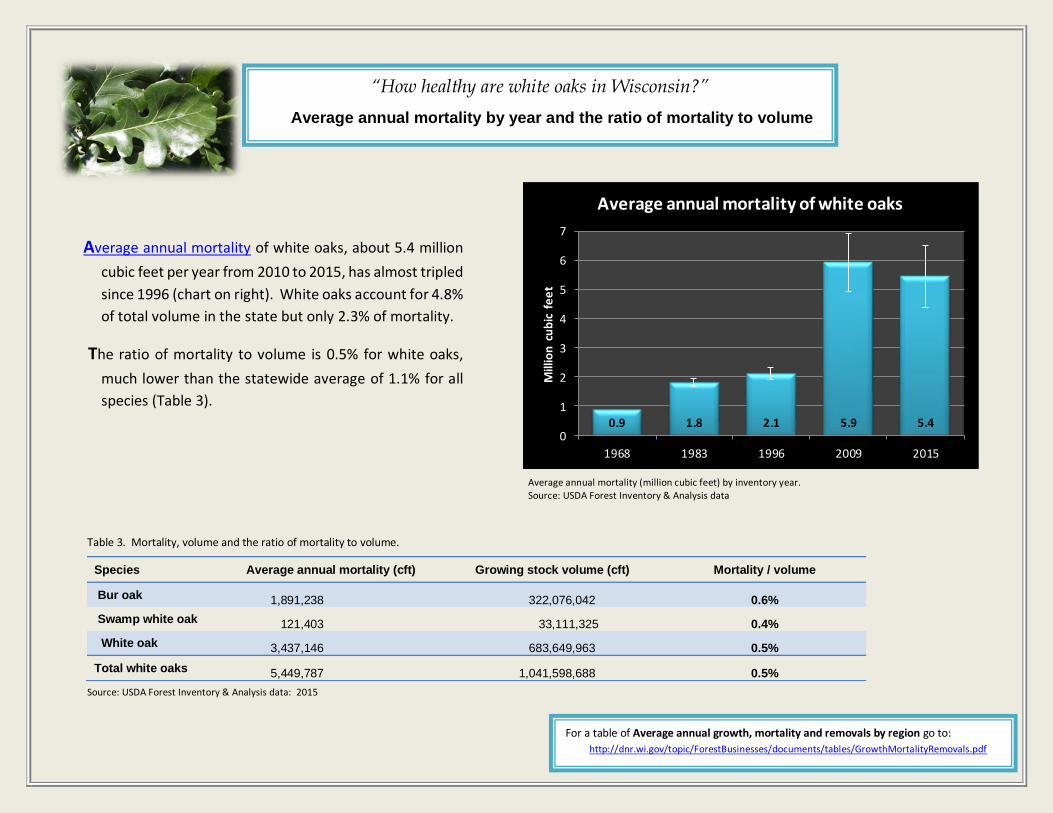
“How healthy are white oaks in Wisconsin?”
Average annual mortality by year and the ratio of mortality to volume
Average annual mortality of white oaks, about 5.4 million
cubic feet per year from 2010 to 2015, has almost tripled
since 1996 (chart on right). White oaks account for 4.8%
of total volume in the state but only 2.3% of mortality.
The ratio of mortality to volume is 0.5% for white oaks,
much lower than the statewide average of 1.1% for all
species (Table 3).
Source: USDA Forest Inventory & Analysis data: 2015
Species Average annual mortality (cft) Growing stock volume (cft) Mortality / volume
Bur oak 1,891,238 322,076,042 0.6%
Swamp white oak 121,403 33,111,325 0.4%
White oak 3,437,146 683,649,963 0.5%
Total white oaks 5,449,787 1,041,598,688 0.5%
Table 3. Mortality, volume and the ratio of mortality to volume.
Average annual mortality (million cubic feet) by inventory year. Source: USDA Forest Inventory & Analysis data
For a table of Average annual growth, mortality and removals by region go to:
http://dnr.wi.gov/topic/ForestBusinesses/documents/tables/GrowthMortalityRemovals.pdf
0.9 1.8 2.1 5.9 5.40
1
2
3
4
5
6
7
1968 1983 1996 2009 2015
Mill
ion
cu
bic
fe
et
Average annual mortality of white oaks

“How much white oak do we harvest?”
Roundwood production and removals by product and year
Average annual removals were 8.4 million cubic feet per year from 2010-2015
or 2.7% of statewide removals. The vast majority of this, 79%, was white
oak.
The ratio of average annual net growth to removals is 2.2 for white oaks,
slightly higher than the statewide average ratio of 1.7 (chart on left).
Removals have fallen 37% since 2009 while growth has changed only
slightly.
In 2009-2012, white oak accounted for 12.3 million cubic feet or
3.2% of Wisconsin’s total roundwood, a decrease of 43% since
2004. About 60% is in fuelwood, 30% in veneer and sawlogs
and 12% pulpwood (chart on right).
From 2004 to 2009-2012, pulpwood production decreased by
76% while sawlog production decreased by 60%. White oak
supplies less than 1% of pulpwood but 4.8% of sawlogs.
Source: USDA Forest Inventory & Analysis data
For a table of Average annual growth, mortality and removals by region go to:
http://dnr.wi.gov/topic/ForestBusinesses/documents/tables/GrowthMortalityRemovals.pdf
6.8 2.5 1.1 2.20
1
2
3
4
5
6
7
8
9
1983 1996 2009 2015
Ratio of growth to removals: White oaks
0.0
2.0
4.0
6.0
8.0
10.0
Pulpwood Compositeproducts
Saw / veneerlogs
Fuelwood Misc products*
Mil
lio
n c
ft
Volume of roundwood by product: White oaks
1999 2004 2009-2012
Volume of roundwood. Most recent figures for pulpwood and composite products are from 2012 while other product volumes are from 2009. * Miscellaneous products include poles, posts and pilings.
Source: Ronald Piva, USDA Forest Service, Northern Research Station, St. Paul MN

There were 40.1 million tons of aboveground biomass in live trees of the
white oak group in 2015, an increase of 50% from 1983. This is
equivalent to approximately 20 million tons of carbon and represents
6.4% of all aboveground biomass statewide. As with volume, most
white oak biomass is located in southwest and central Wisconsin
(chart below).
The density of white oak wood is much
higher than average with a ratio of
biomass to volume of 43 oven-dry lbs. per
cubic foot, second only to hickory. The
average for all hardwoods is about 36
ODP/cubic feet and for all species is 33
ODP/cubic feet.
Approximately, 78% of all white oak
biomass is located in the main stem and
18% in the branches.
“How much white oak biomass do we have?”
Aboveground carbon by region of the state
Biomass (above ground dry weight of live trees >1 in dbh, short tons) by year and region of the state.
Source: USDA Forest Inventory & Analysis data
For a table of Biomass by County go to:
http://dnr.wi.gov/topic/ForestBusinesses/documents/tables/BiomassByCounty.pdf
-
2
4
6
8
10
12
14
16
Northeast Northwest Central Southwest Southeast
Mil
lio
n o
ven
dry
to
ns
Biomass of all live trees: White oaks
1983 1996 2015

Compared to other species, the ratios of growth, mortality and removals to volume is
much lower for both bur oak and white oak (chart on right). The difference between
the growth to volume ratio and the removals to volume ratio is very low is quite low
for white oak indicating that volume may not increase significantly in the future.
FVS (Forest Vegetation Simulator1) was used to predict future volumes of white oaks
through 2054 based on these rates of mortality and removals. As predicted, the
volume of white oak increases only 3% and peaks in 2039. Bur oak increases 31% and
swamp white oak increases 72%. Both have a much higher difference between the
growth to volume ratio and the removals to volume ratio.
1 The Forest Vegetation Simulator is a forest growth and yield simulation model created by the USDA Forest Service, see http://www.fs.fed.us/fmsc/fvs/.
Ratios of growth, mortality and removals to volume of growing stock Source: USDA Forest Inventory & Analysis
0%
2%
4%
6%
8%
10%
12%
14%
16%
Growth/volume Mortality/volume Removals/volume
White oak Bur oak Swamp white oak All species
681 704
325
425
33 57
-
100
200
300
400
500
600
700
800
2014 2019 2024 2029 2034 2039 2044 2049 2054
Mil
lio
n c
ub
ic f
eet
Predicted future volume of white oak, bur oak and swamp white oak
White oak
Bur oak
Swamp white oak
“Can we predict the future of white oaks?”
Predicted volumes based on current rates of mortality and harvest