white color standards and color gamut analysis for ceramic tiles
TRANSCRIPT
White Color Standards and Color Gamut Analysis for Ceramic
Tiles and the GretagMacbeth ColorChecker Chart
John W. Root, Ph.D. Mt. Baker Research L.L.C.
2921 Sylvan Street Bellingham, Washington 98226–4314 USA
Tel: (360) 650–0771 E-Mail: <[email protected]> Web: <http://www.mtbakerresearch.com>
Release 2.0, June 6, 2008 (©All Rights Reserved)

1. New White Color Standards
Introduction
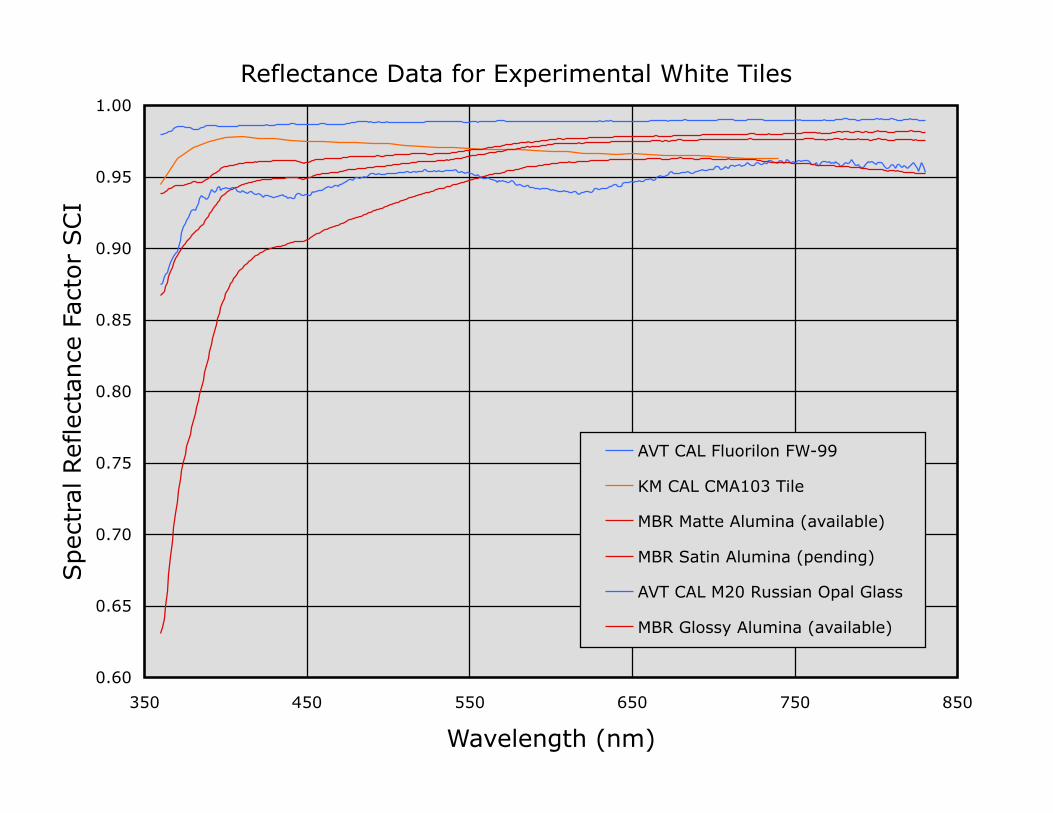
Since 2005 Mt. Baker Research L.L.C. has pursued the development of white color standards. We are pleased to announce the availability of the new synthetic, alumina-based ceramics shown on the next chart. These materials are durable, cleanable, and stable following exposure to ultraviolet light.
The spectra for Matte Alumina (upper red curve) and Glossy Alumina (lower red) represent actual tiles. Art Springsteen (Avian Technologies L.L.C.) measured these spectra in the (8/t) hemispherical specular-included ("SCI") geometry. (For additional details download reference 1 from the Documentation page of our Website: <http://www.mtbakerresearch.com/appendix.html>)
The spectrum for Satin Alumina (middle red) represents predicted (8/t) SCI reflectance data for a new tile that we are developing.
The spectra for Fluorilon FW-99 (upper blue) and M-20 Russian White Opal Glass ("RWOG") (lower blue) represent actual tiles measured by Art Springsteen (see above).
The spectrum for our Konica-Minolta CM-A103 White Reference Tile (orange) represents Konica-Minolta reference data measured in the (8/t) SCI geometry.
Reflectance Data for Experimental White Tiles
0.60
0.65
0.70
0.75
0.80
0.85
0.90
0.95
1.00
350 450 550 650 750 850
Wavelength (nm)
Spec
tral
Ref
lect
ance
Fac
tor
SCI
AVT CAL Fluorilon FW-99
KM CAL CMA103 Tile
MBR Matte Alumina (available)
MBR Satin Alumina (pending)
AVT CAL M20 Russian Opal Glass
MBR Glossy Alumina (available)

1. New White Color Standards
Conclusions
Fluorilon FW-99W (light blue spectrum) remains the whitest and the most neutral among this group of white reflectance standards.
Our new Matte Alumina (upper red) exhibits higher reflectivity than M-20 Russian White Opal Glass ("RWOG") (lower blue). Matte Alumina also exhibits higher reflectivity than the Konica-Minolta CM-A103 White Reference Tile at wavelengths above 550 nm.
Although our Glossy Alumina standard (lower red) exhibits roughly comparable reflectivity to RWOG, RWOG is whiter. (Glossy Alumina exhibits a yellow color cast.)
RWOG is more neutral than Glossy Alumina, but slightly less neutral than the Konica-Minolta White Reference Tile.
We are developing a Satin Alumina standard (middle red) that should closely approach Matte Alumina in reflectivity and neutrality.

2. Compare New Standards vs. CERAM White Tiles
Introduction
The next chart compares our Matte Alumina and Glossy Alumina standards (red spectra) to 4 CERAM White Tiles (blue spectra).
The data for Matte Alumina (upper red) and Glossy Alumina (lower red) are the same as shown on the preceding data chart.
Art Springsteen measured 1 nm reflectance spectra in the (8/t) SCI geometry for CERAM Tiles #1 (middle blue spectrum at long wavelengths) and #2 (upper blue spectrum at long wavelengths).
In comparison with the other CERAM White Tiles, CERAM White #2 exhibits a pronounced decrease in reflectivity at wavelengths below 550 nm.
The data for CERAM White Tile #3 (blue with diamonds) correspond to X-Rite calibration data measured at 10 nm intervals in the (8/t) SCI geometry. The individual plot points correspond to the reported absolute reflectance values.
The data for CERAM White Tile #4 (lower blue) correspond to the CERAM master data set for Series II tiles. We thank Chris Williamson (Ceram Technology Ltd.) for sharing this information.

Reflectance Data for Experimental White Tiles
0.60
0.65
0.70
0.75
0.80
0.85
0.90
0.95
1.00
350 450 550 650 750 850
Wavelength (nm)
Spec
tral
Ref
lect
ance
Fac
tor
SCI
MBR Matte Alumina (available)
MBR Glossy Alumina (available)
AVT CAL CERAM White #1
AVT CAL CERAM White #2
XRT CAL CERAM White #3
NPL CAL CERAM White REF
2. Compare New Standards vs. CERAM White Tiles
Conclusions
In comparison with the other 5 white standards shown on the preceding chart our Matte Alumina (upper red) exhibits higher reflectivity and better neutrality.
At all wavelengths our Glossy Alumina (lower red) exhibits higher reflectivity than the CERAM White Tiles.
Glossy Alumina is less white than 3 of the CERAM White Tiles. (Glossy Alumina and CERAM White Tile #2 exhibit yellow color casts.)
Glossy Alumina is less neutral than 3 of the CERAM White Tiles.

3. Compare CERAM White Tiles at 3 Geometries
Introduction
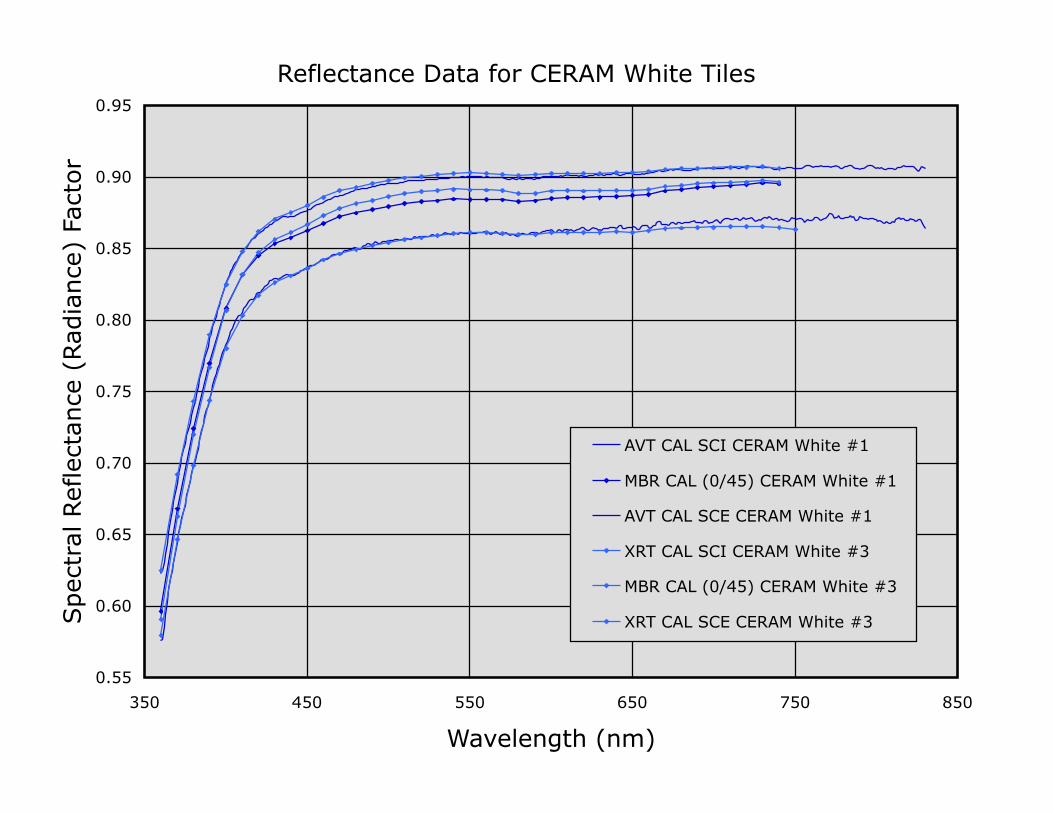
The next 2 charts compare absolute reflectance data for 3 CERAM White Tiles measured in 3 geometries.
In each series of spectra the upper and lower plots show spectral reflectance factors measured in the (8/t) SCI geometry and the (8/d) SCE geometry, respectively.
The accompanying middle spectrum shows spectral radiance factors measured in the (0/45) bi-directional geometry.
If individual data points are shown, the data were measured at 10 nm intervals using an abridged spectrophotometer.
Reflectance Data for CERAM White Tiles
0.55
0.60
0.65
0.70
0.75
0.80
0.85
0.90
0.95
350 450 550 650 750 850
Wavelength (nm)
Spec
tral
Ref
lect
ance
(Rad
iance
) Fa
ctor
AVT CAL SCI CERAM White #1
MBR CAL (0/45) CERAM White #1
AVT CAL SCE CERAM White #1
XRT CAL SCI CERAM White #3
MBR CAL (0/45) CERAM White #3
XRT CAL SCE CERAM White #3

Reflectance Data for CERAM White Tiles
0.55
0.60
0.65
0.70
0.75
0.80
0.85
0.90
0.95
350 450 550 650 750 850
Wavelength (nm)
Spec
tral
Ref
lect
ance
(Rad
iance
) Fa
ctor
AVT CAL SCI CERAM White #1
MBR CAL (0/45) CERAM White #1
AVT CAL SCE CERAM White #1
AVT CAL SCI CERAM White #2
MBR CAL (0/45) CERAM White #2

3. Compare CERAM White Tiles at 3 Geometries
Conclusions
The absolute reflectance data measured at Avian Technologies L.L.C., Mt. Baker Research L.L.C., and X-Rite, Inc. exhibit good consistency.
Although the reflectance characteristics of CERAM White Tiles #1 and #3 are nearly identical, CERAM White Tile #2 is different.
The SCI spectrum for CERAM White Tile #2 exhibits a sharp absorption peak at 653 nm. As shown by the associated radiance factor spectrum, this feature cannot be reproduced using an abridged instrument.
In the (8/t) SCI geometry at 550 nm CERAM White Tiles #1, #2 and #3 achieve 90.0% ± 0.2% reflectance.
In the (8/d) SCE geometry at 550 nm CERAM White Tiles #1 and #3 achieve 86.1% ± 0.2% reflectance. (The SCE data are not available for CERAM White Tile #2.)
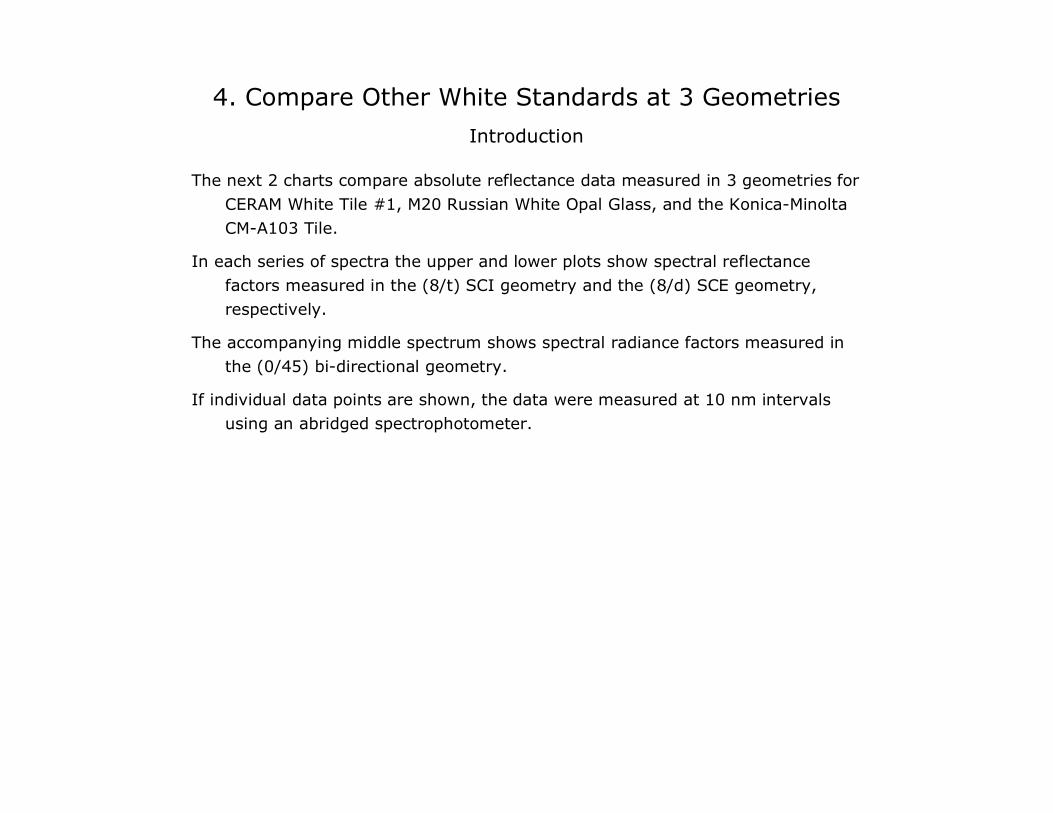
4. Compare Other White Standards at 3 Geometries
Introduction
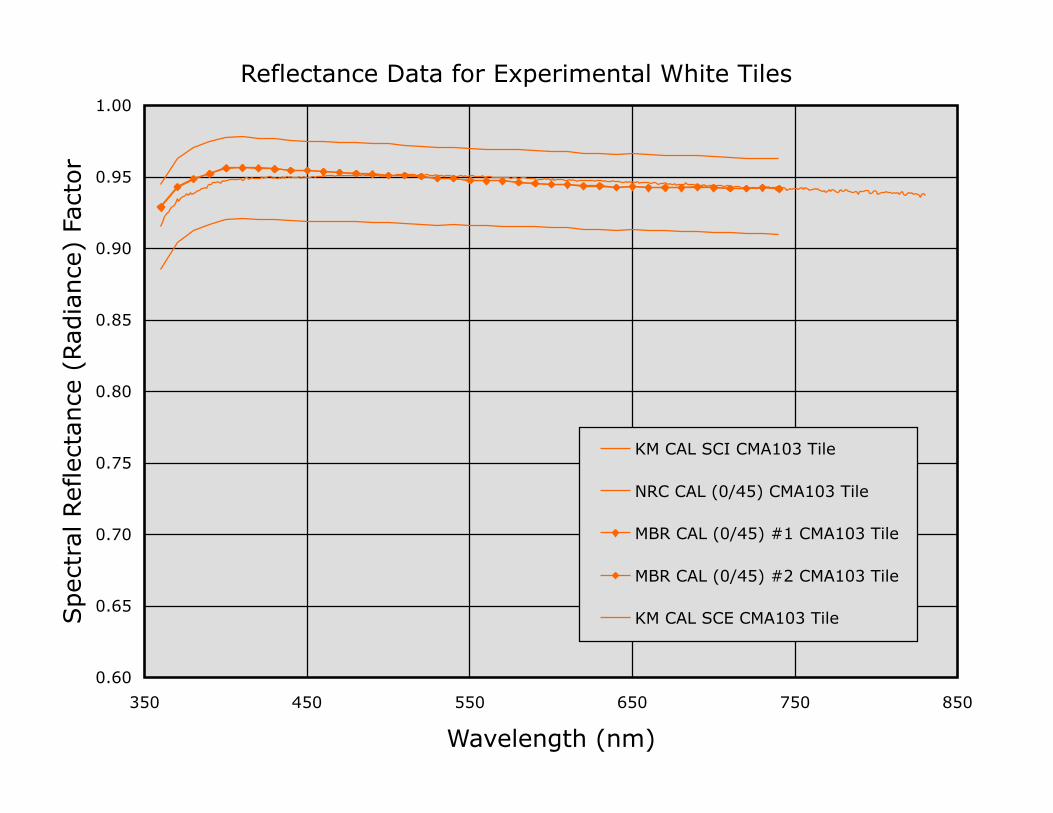
The next 2 charts compare absolute reflectance data measured in 3 geometries for CERAM White Tile #1, M20 Russian White Opal Glass, and the Konica-Minolta CM-A103 Tile.
In each series of spectra the upper and lower plots show spectral reflectance factors measured in the (8/t) SCI geometry and the (8/d) SCE geometry, respectively.
The accompanying middle spectrum shows spectral radiance factors measured in the (0/45) bi-directional geometry.
If individual data points are shown, the data were measured at 10 nm intervals using an abridged spectrophotometer.

Reflectance Data for M20 RWOG & CERAM White Tiles
0.60
0.65
0.70
0.75
0.80
0.85
0.90
0.95
1.00
350 450 550 650 750 850
Wavelength (nm)
Spec
tral
Ref
lect
ance
(Rad
iance
) Fa
ctor
AVT CAL SCI Russian Opal Glass
MBR CAL (0/45) Russian Opal Glass
AVT CAL SCE Russian Opal Glass
AVT CAL SCI CERAM White #1
MBR CAL (0/45) CERAM White #1
AVT CAL SCE CERAM White #1
Reflectance Data for Experimental White Tiles
0.60
0.65
0.70
0.75
0.80
0.85
0.90
0.95
1.00
350 450 550 650 750 850
Wavelength (nm)
Spec
tral
Ref
lect
ance
(Rad
iance
) Fa
ctor
KM CAL SCI CMA103 Tile
NRC CAL (0/45) CMA103 Tile
MBR CAL (0/45) #1 CMA103 Tile
MBR CAL (0/45) #2 CMA103 Tile
KM CAL SCE CMA103 Tile

4. Compare Other White Standards at 3 Geometries
Conclusions
The absolute reflectance data measured at Avian Technologies L.L.C., Mt. Baker Research L.L.C., Konica-Minolta, Inc. and the National Research Council of Canada exhibit good consistency.
Statistically indistinguishable results were measured at Mt. Baker Research L.L.C. using 2 Konica-Minolta CM-2500c spectrophotometers (middle orange spectra with individual plot points). (For additional information download reference 10 from our Website: <http://www.mtbakerresearch.com/appendix.html>)
At 550 nm the estimated specular components for CERAM White Tiles, M20 Russian White Opal Glass, and the Konica-Minolta CM-A103 Tile are as follows: 4.1% ± 0.2%, 4.7% ± 0.2%, and 5.4% ± 0.2%, respectively. (At a particular wavelength the specular component is estimated as the difference between the absolute (8/t) SCI and (8/d) SCE reflectance spectra.)
The preceding charts report absolute reflectance data for 9 white color standards. Eight of them are suitable for use with abridged spectrophotometers. (As noted above CERAM White Tile #2 should not be used as a reference standard with abridged instruments.)

5. Large Color Gamut Collection
Introduction
In this section we introduce a collection of ceramic color standards, which spans the largest gamut of color that we offer. The collection includes 36 glossy ceramic tiles with 16 high-chroma chromatics, 12 reduced-chroma chromatics, and 8 achromatics.
The CIELAB data shown in these charts correspond to the CIE 2° Standard Observer and D65 Standard Illuminant. Art Springsteen (Avian Technologies L.L.C.) measured typical reflectance spectra for these tiles in the (8/t) SCI geometry. (For more information download reference 1 from our Website: <http://www.mtbakerresearch.com/appendix.html>)
This series includes the charts listed below, which are explained on our Website. (See: <http://www.mtbakerresearch.com/infogamut.html>)
CIELAB b* vs. a* Color Gamut Chart. Key to data: 16 Best-chroma tiles (red solid line), 12 Reduced-chroma tiles (other red plot points & light cyan line), & 8 CERAM BCRA Series II chromatic tiles (blue line).
CIELAB Chroma (C*) vs. L* Color Gamut Chart. Key to data: Same as above.
CIELAB L* vs. Median Reflectance Factor Chart (achromatic tiles only). Key to data: 8 standard achromatic tiles (red plot points), 3 optional achromatic tiles (orange/red points), 3 experimental achromatic tiles (orange/green points), 4 BCRA Series II achromatic tiles (blue points), and 6 optional CERAM achromatic tiles (light blue points). The error bars represent the neutrality of each achromatic color standard (CIELAB C* value).

CIELAB b* vs. a* Color Gamut Chart
-40
-20
0
20
40
60
80
-40 -20 0 20 40 60 80
CIELAB a* (8/t) SCI
CIE
LAB b
* (
8/t
) SCI
16 MBR Sat. Chromatics
83 MBR All Chromatics
12 MBR Aux. Chromatics
BCRA Ser. II Chromatics
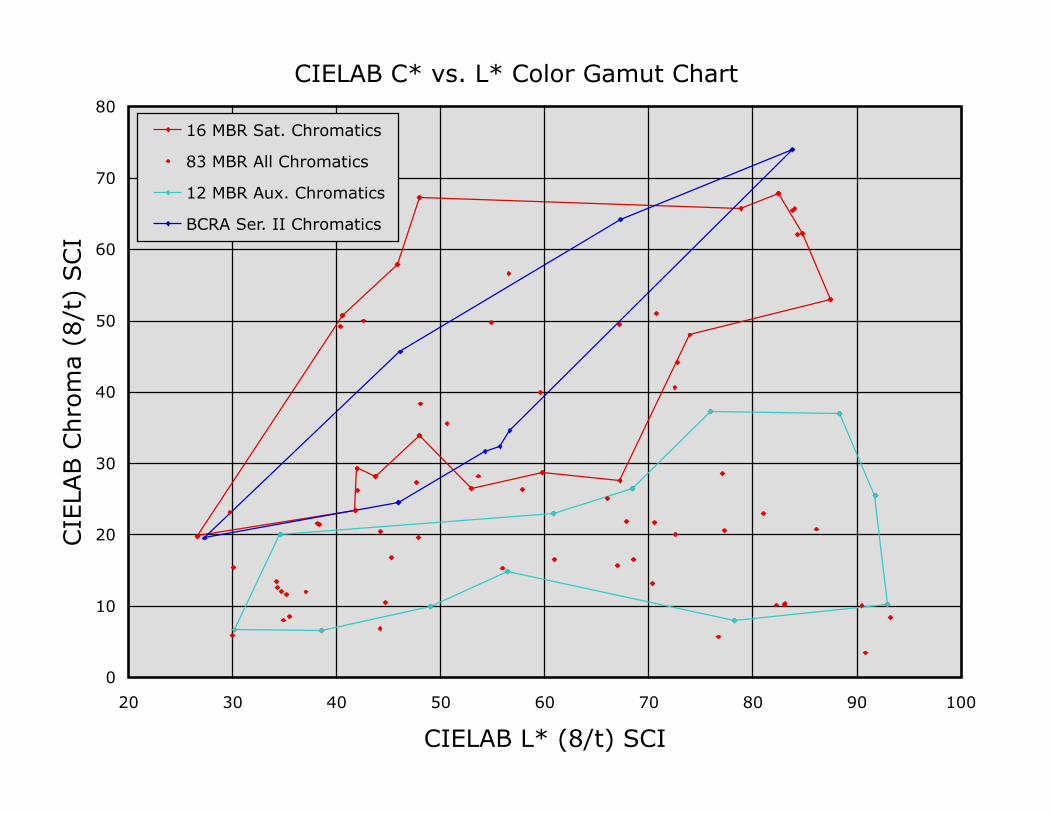
CIELAB C* vs. L* Color Gamut Chart
0
10
20
30
40
50
60
70
80
20 30 40 50 60 70 80 90 100
CIELAB L* (8/t) SCI
CIE
LAB C
hro
ma
(8/t
) SCI
16 MBR Sat. Chromatics
83 MBR All Chromatics
12 MBR Aux. Chromatics
BCRA Ser. II Chromatics

CIELAB L* vs. Median Reflectance Factor Chart
0
10
20
30
40
50
60
70
80
90
100
0.0 0.1 0.2 0.3 0.4 0.5 0.6 0.7 0.8 0.9 1.0
Median (8/t) Reflectance Factor (380 - 730 nm)
CIE
LAB L
* (
8/t
) SCI
8 MBR Achromatics
3 MBR Optional Achromatics
3 MBR Experimental Achromatics
4 CERAM Achromatics
6 CERAM Optional Achromatics

5. Large Color Gamut Collection
Conclusions
On the CIELAB b* vs. a* chart the origin defines perfect neutrality with the lightness ranging from black to white. The CIELAB chroma, C*, corresponds to the scalar distance from the origin to any data point. The a*-axis extends from red (+ values) to green (- values), while the b*-axis extends from yellow (+ values) to blue (- values).
The closed solid lines represent the chroma contours for our chromatic standards (red & light cyan) vs. the CERAM BCRA Series II tiles (blue). The area enclosed within a chroma contour measures the gamut of colors, so the 8 CERAM BCRA Series II chromatic tiles define the gamut enclosed by the blue solid line. (The CERAM data are Art Springsteen's calibrations of the CERAM tiles that we purchased from Avian Technologies L.L.C. in 2005.)
The red plot points show the entire group of 83 chromatic tiles that we have measured to date. Our chromatic tiles fall into 2 subgroups: saturated, or high-chroma colors, and auxiliary pastel and dark, or reduced-chroma colors. The red chroma contour connects the 16 tiles that I chose for the high-chroma subgroup, while the light cyan contour shows the 12 tiles in the reduced-chroma subgroup.
On the CIELAB chroma (C*) vs. lightness (L*) chart the chroma contours show another useful measure of the gamut of color. This chart highlights the differences between our high-chroma and reduced-chroma subgroups and contrasts both subgroups with the CERAM BCRA Series II chromatic tiles.

5. Large Color Gamut Collection Continued
Over the full range of L* the chromatic standards in both of our subgroups increase the gamut of color that is available with CERAM Series II tiles. This more complete coverage of color space will improve results for device testing, characterization, and profiling.
The final chart in this section shows CIELAB L* vs. the Median Spectral Reflectance Factor ("SRF") values for the 8 achromatic tiles included in our new collection (red plot points) and 11 CERAM achromatic tiles (blue and light blue points). The error bars represent the CIELAB chroma, C*, values, which measure the deviation from neutrality. (For a perfectly neutral color standard the value of C* is zero.)
This chart depicts the full range of durable achromatic color standards that are available today. The blue points represent the 4 BCRA Series II achromatic tiles, while the light blue points represent other achromatic tiles that are available from Ceram Technology Ltd.
The CERAM white tile approaches a median SRF value of 0.9. For the 2 examples shown on the chart, its neutrality is marginal and varies from tile to tile.
The red plot point with a median SRF value of 0.95 represents the RWOG standard that we purchased from Avian Technologies L.L.C. in 2005.
The 3 orange/red plot points represent optional achromatic standards that we supply. The point with a median SRF value of 0.043 represents our black glass standard. Because measurements in the (8/t) SCI geometry include the specular component, for black tiles and black glass CIELAB L* falls within the range 26 ± 2.
5. Large Color Gamut Collection Continued
The orange/red plot point with a median SRF value of 0.99 represents Art Springsteen's calibration data for the Fluorilon FW-99 standard that we purchased from Avian Technologies L.L.C. in 2005. (See Section 1.)
Our calibrated Konica-Minolta CM-A103 White Reference Tile (purchased in 2007) should appear as an orange/red plot point with a median SRF value of 0.97. However, this point is obscured by the uppermost orange/green point, which represents our new Matte Alumina color standard (see below). (Note: We calculated the colorimetric data for the Konica-Minolta Tile using the 10 nm (8/t) SCI calibration data shown in Section 1, which was supplied by the manufacturer.)
The 3 orange/green plot points represent our new alumina-based synthetic ceramics, which are described in Sections 1 and 2. The uppermost point, with a median SRF value of 0.97, represents the Matte Alumina color standard.
The orange/green point with a Median SRF value of 0.95 represents the Glossy Alumina color standard, while the point at 0.96 represents predicted data for the Satin Alumina standard that we are developing.
The neutrality value for our Matte Alumina color standard is excellent, while that for the Glossy Alumina standard is comparable to one of the 2 CERAM White tiles shown on the chart.
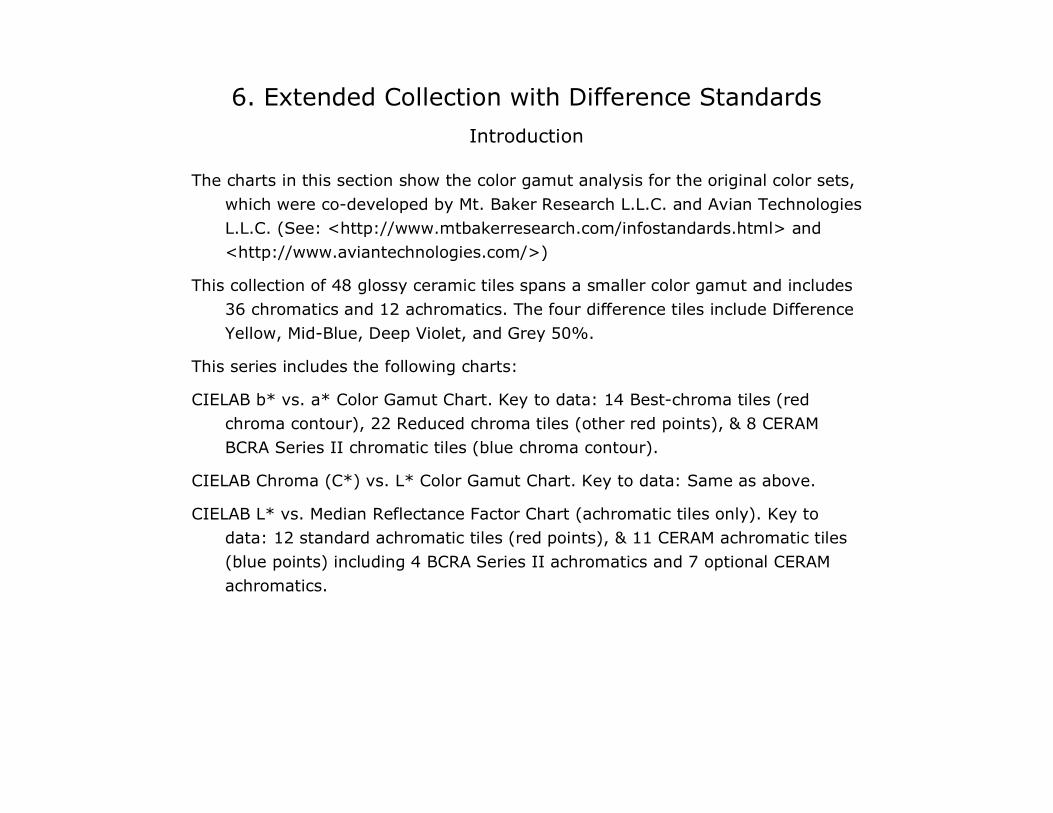
6. Extended Collection with Difference Standards
Introduction
The charts in this section show the color gamut analysis for the original color sets, which were co-developed by Mt. Baker Research L.L.C. and Avian Technologies L.L.C. (See: <http://www.mtbakerresearch.com/infostandards.html> and <http://www.aviantechnologies.com/>)
This collection of 48 glossy ceramic tiles spans a smaller color gamut and includes 36 chromatics and 12 achromatics. The four difference tiles include Difference Yellow, Mid-Blue, Deep Violet, and Grey 50%.
This series includes the following charts:
CIELAB b* vs. a* Color Gamut Chart. Key to data: 14 Best-chroma tiles (red chroma contour), 22 Reduced chroma tiles (other red points), & 8 CERAM BCRA Series II chromatic tiles (blue chroma contour).
CIELAB Chroma (C*) vs. L* Color Gamut Chart. Key to data: Same as above.
CIELAB L* vs. Median Reflectance Factor Chart (achromatic tiles only). Key to data: 12 standard achromatic tiles (red points), & 11 CERAM achromatic tiles (blue points) including 4 BCRA Series II achromatics and 7 optional CERAM achromatics.

CIELAB b* vs. a* Color Gamut Chart
-40
-20
0
20
40
60
80
-40 -20 0 20 40 60 80
CIELAB a* (8/t) SCI
CIE
LAB b
* (
8/t
) SCI
14 MBR Best Chroma
36 MBR Chromatics
BCRA Ser. II Chromatics
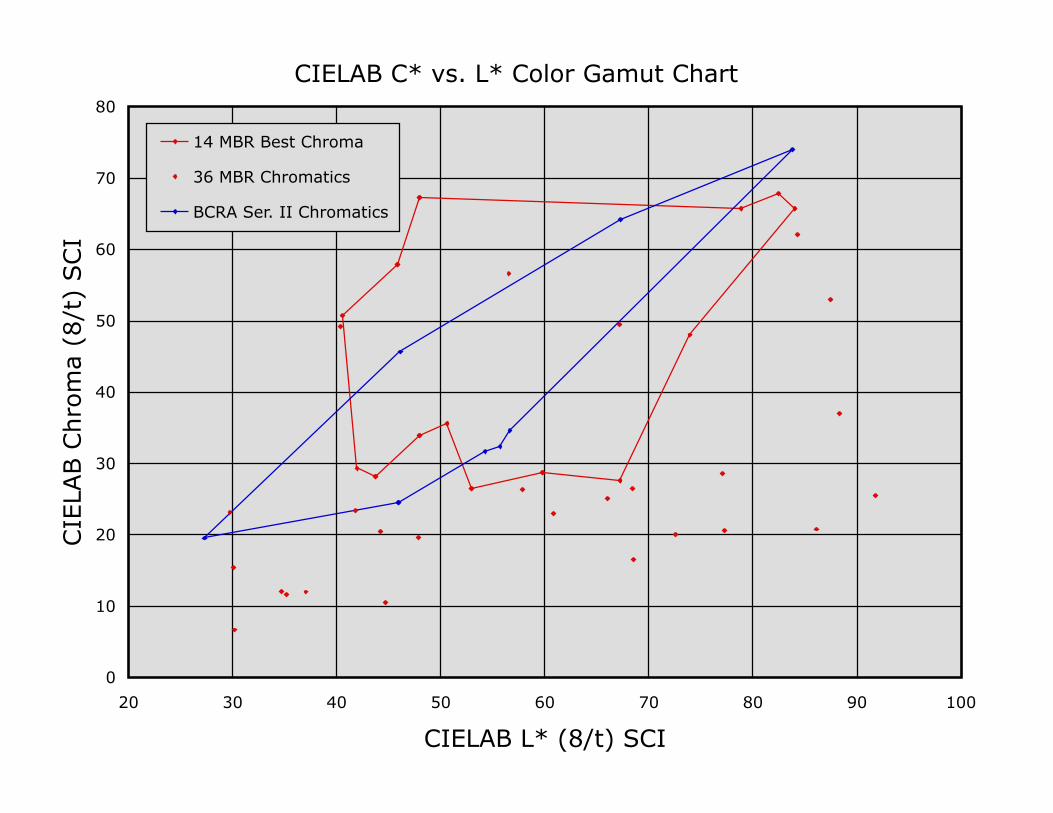
CIELAB C* vs. L* Color Gamut Chart
0
10
20
30
40
50
60
70
80
20 30 40 50 60 70 80 90 100
CIELAB L* (8/t) SCI
CIE
LAB C
hro
ma
(8/t
) SCI
14 MBR Best Chroma
36 MBR Chromatics
BCRA Ser. II Chromatics

CIELAB L* vs. Median Reflectance Factor Chart
0
10
20
30
40
50
60
70
80
90
100
0.0 0.1 0.2 0.3 0.4 0.5 0.6 0.7 0.8 0.9 1.0
Median (8/t) Reflectance Factor (380 - 730 nm)
CIE
LAB L
* (
8/t
) SCI
12 MBR Achromatics
11 CERAM Achromatics

6. Extended Collection with Difference Standards
Conclusions
On the CIELAB b* vs. a* chart the 8 CERAM BCRA Series II chromatic tiles define the gamut of color enclosed by the blue chroma contour.
The gamut of color for our tiles (enclosed by the red chroma contour) is defined by the 14 chromatic standards that exhibit the largest CIELAB chroma, C*, values. The other 22 chromatic standards in this collection are distributed within the red chroma contour. Several of our standards extend the CERAM Series II gamut of color, and all of them span the gamut very well.
On the CIELAB chroma (C*) vs. lightness (L*) chart over the full range of L* our chromatic standards increase the gamut of color that is available with CERAM Series II standards. Only one CERAM standard exhibits a C* value less than 20. Our more complete coverage of color space will improve results for device testing, characterization, and profiling.
The final chart in this section shows CIELAB L* vs. the Median Reflectance Factor for the 12 achromatic tiles included in this collection (red) and 11 CERAM achromatic tiles (blue). The error bars again represent the CIELAB C* values, which measure the deviation from neutrality.
The CERAM BCRA Series II collection includes 4 achromatic tiles. Six other achromatics are available from Ceram Technology Ltd. The chart includes data for 2 CERAM White tiles for which the reflectivity is similar but the neutrality is different. (CERAM White Tiles #1 and #2 are described in Section 3.)
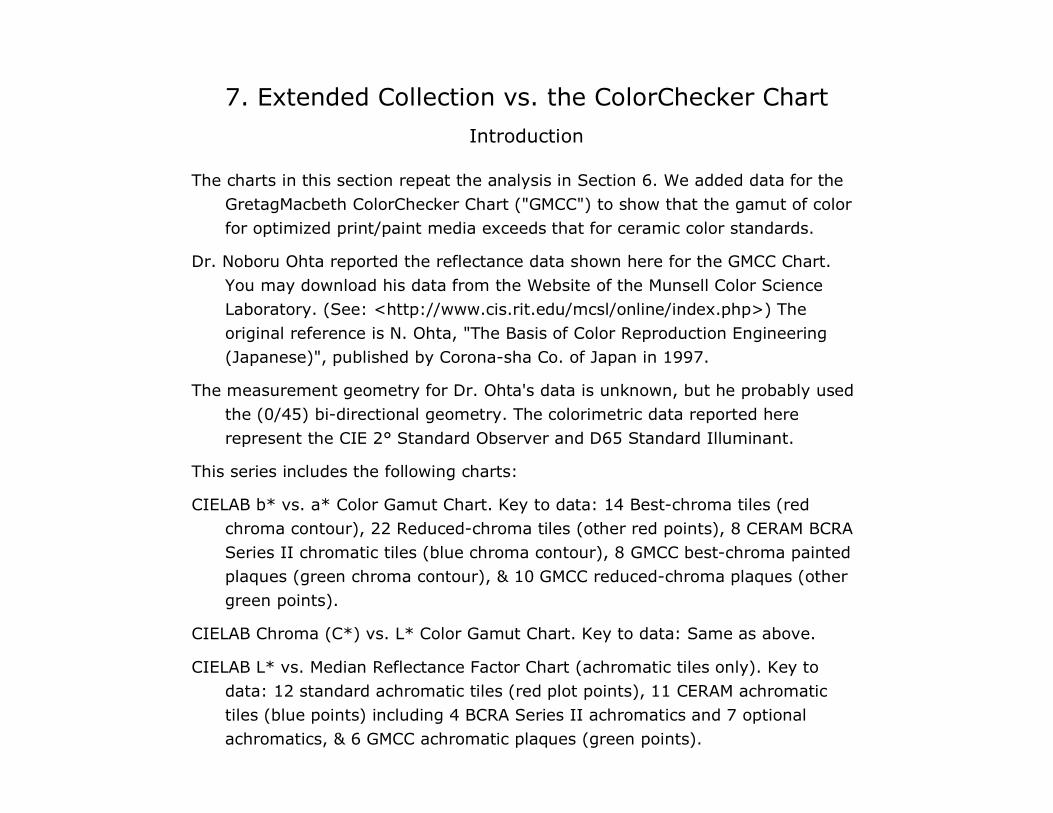
7. Extended Collection vs. the ColorChecker Chart
Introduction
The charts in this section repeat the analysis in Section 6. We added data for the GretagMacbeth ColorChecker Chart ("GMCC") to show that the gamut of color for optimized print/paint media exceeds that for ceramic color standards.
Dr. Noboru Ohta reported the reflectance data shown here for the GMCC Chart. You may download his data from the Website of the Munsell Color Science Laboratory. (See: <http://www.cis.rit.edu/mcsl/online/index.php>) The original reference is N. Ohta, "The Basis of Color Reproduction Engineering (Japanese)", published by Corona-sha Co. of Japan in 1997.
The measurement geometry for Dr. Ohta's data is unknown, but he probably used the (0/45) bi-directional geometry. The colorimetric data reported here represent the CIE 2° Standard Observer and D65 Standard Illuminant.
This series includes the following charts:
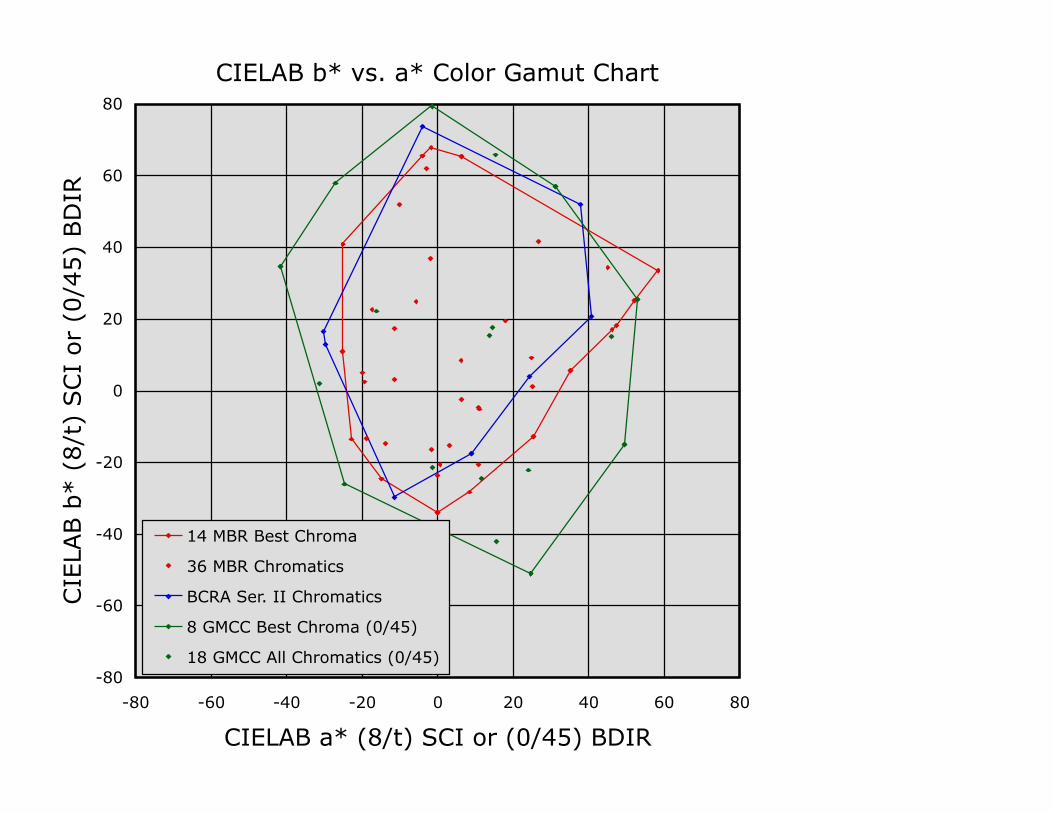
CIELAB b* vs. a* Color Gamut Chart. Key to data: 14 Best-chroma tiles (red chroma contour), 22 Reduced-chroma tiles (other red points), 8 CERAM BCRA Series II chromatic tiles (blue chroma contour), 8 GMCC best-chroma painted plaques (green chroma contour), & 10 GMCC reduced-chroma plaques (other green points).
CIELAB Chroma (C*) vs. L* Color Gamut Chart. Key to data: Same as above.
CIELAB L* vs. Median Reflectance Factor Chart (achromatic tiles only). Key to data: 12 standard achromatic tiles (red plot points), 11 CERAM achromatic tiles (blue points) including 4 BCRA Series II achromatics and 7 optional achromatics, & 6 GMCC achromatic plaques (green points).
CIELAB b* vs. a* Color Gamut Chart
-80
-60
-40
-20
0
20
40
60
80
-80 -60 -40 -20 0 20 40 60 80
CIELAB a* (8/t) SCI or (0/45) BDIR
CIE
LAB b
* (
8/t
) SCI
or
(0/4
5)
BD
IR
14 MBR Best Chroma
36 MBR Chromatics
BCRA Ser. II Chromatics
8 GMCC Best Chroma (0/45)
18 GMCC All Chromatics (0/45)

CIELAB C* vs. L* Color Gamut Chart
0
10
20
30
40
50
60
70
80
20 30 40 50 60 70 80 90 100
CIELAB L* (8/t) SCI or (0/45) BDIR
CIE
LAB C
* (
8/t
) SCI
or
(0/4
5)
BD
IR
14 MBR Best Chroma 36 MBR Chromatics
8 GMCC Best Chroma (0/45) 18 GMCC Chromatics (0/45)
BCRA Ser. II Chromatics

CIELAB L* vs. Median Reflectance Factor Chart
0
10
20
30
40
50
60
70
80
90
100
0.0 0.1 0.2 0.3 0.4 0.5 0.6 0.7 0.8 0.9 1.0
Median Reflectance (Radiance) Factor (380 - 730 nm)
CIE
LAB L
* (
8/t
) SCI
or
(0/4
5)
BD
IR
12 MBR Achromatics
11 CERAM Achromatics
6 GMCC Achromatics (0/45)
7. Extended Collection vs. the ColorChecker Chart
Conclusions
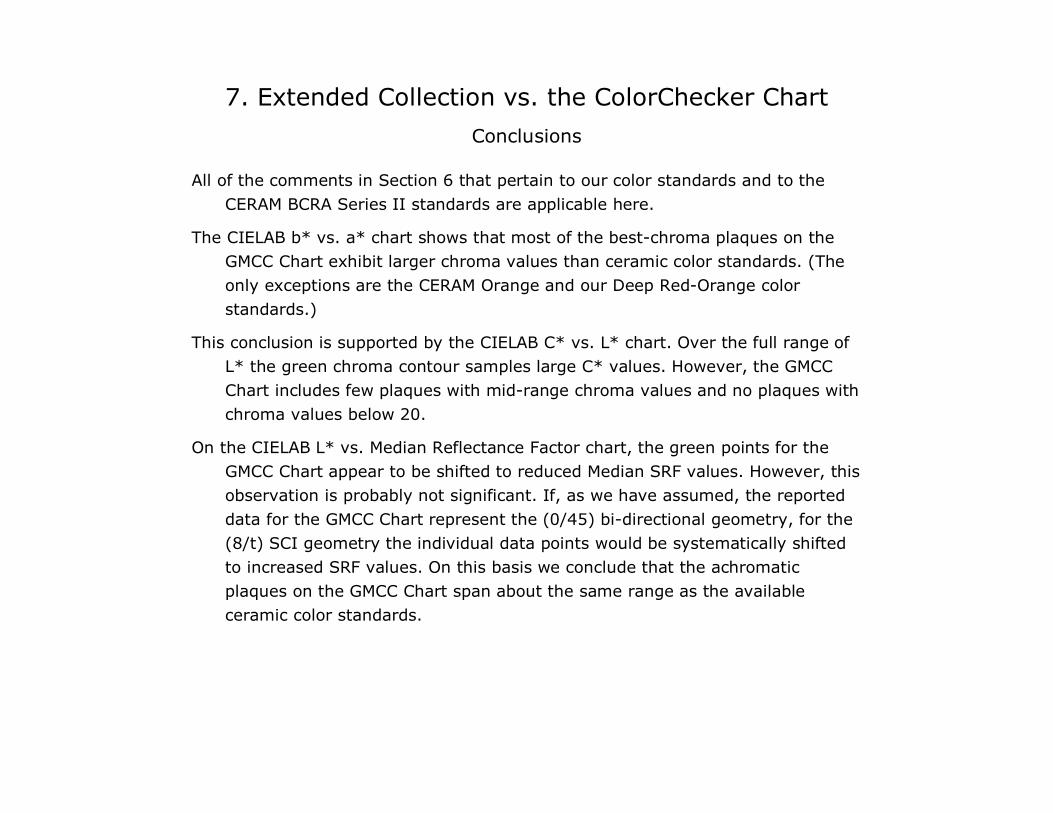
All of the comments in Section 6 that pertain to our color standards and to the CERAM BCRA Series II standards are applicable here.
The CIELAB b* vs. a* chart shows that most of the best-chroma plaques on the GMCC Chart exhibit larger chroma values than ceramic color standards. (The only exceptions are the CERAM Orange and our Deep Red-Orange color standards.)
This conclusion is supported by the CIELAB C* vs. L* chart. Over the full range of L* the green chroma contour samples large C* values. However, the GMCC Chart includes few plaques with mid-range chroma values and no plaques with chroma values below 20.
On the CIELAB L* vs. Median Reflectance Factor chart, the green points for the GMCC Chart appear to be shifted to reduced Median SRF values. However, this observation is probably not significant. If, as we have assumed, the reported data for the GMCC Chart represent the (0/45) bi-directional geometry, for the (8/t) SCI geometry the individual data points would be systematically shifted to increased SRF values. On this basis we conclude that the achromatic plaques on the GMCC Chart span about the same range as the available ceramic color standards.

8. Extended Collection Plus Additional Standards
Introduction
The charts in this section again show the color gamut analysis for the original color sets, which were co-developed by Mt. Baker Research L.L.C. and Avian Technologies L.L.C. (See above and: <http://www.aviantechnologies.com/> and <http://www.mtbakerresearch.com/infostandards.html>)
These charts augment the data reported in Section 6 by adding data points for 47 chromatic tiles and 15 achromatic tiles. We supply all of these color standards on a special-order basis.
Our new collection, which is described in Section 5, spans a larger gamut of color. The original collection includes 48 glossy ceramic tiles with 36 chromatics and 12 achromatics. The 4 difference tiles include Difference Yellow, Mid-Blue, Deep Violet, and Grey 50%.
This series includes the following charts:
CIELAB b* vs. a* Color Gamut Chart. Key to data: 14 Best-chroma tiles (red chroma contour), 69 Reduced chroma tiles (other red points), & 8 CERAM BCRA Series II chromatic tiles (blue chroma contour).
CIELAB Chroma (C*) vs. L* Color Gamut Chart. Key to data: Same as above.
CIELAB L* vs. Median Reflectance Factor Chart (achromatic tiles only). Key to data: 27 achromatic tiles (red plot points), & 11 CERAM achromatic tiles (blue points) including 4 BCRA Series II achromatics & 7 optional achromatics.

CIELAB b* vs. a* Color Gamut Chart
-40
-20
0
20
40
60
80
-40 -20 0 20 40 60 80
CIELAB a* (8/t) SCI
CIE
LAB b
* (
8/t
) SCI
14 MBR Best Chroma
83 MBR All Chromatics
BCRA Ser. II Chromatics

CIELAB C* vs. L* Color Gamut Chart
0
10
20
30
40
50
60
70
80
20 30 40 50 60 70 80 90 100
CIELAB L* (8/t) SCI
CIE
LAB C
hro
ma
(8/t
) SCI
14 MBR Best Chroma
83 MBR All Chromatics
BCRA Ser. II Chromatics

CIELAB L* vs. Median Reflectance Factor Chart
0
10
20
30
40
50
60
70
80
90
100
0.0 0.1 0.2 0.3 0.4 0.5 0.6 0.7 0.8 0.9 1.0
Median (8/t) Reflectance Factor (380 - 730 nm)
CIE
LAB L
* (
8/t
) SCI
27 MBR Achromatics
11 CERAM Achromatics
8. Extended Collection Plus Additional Standards
Conclusions
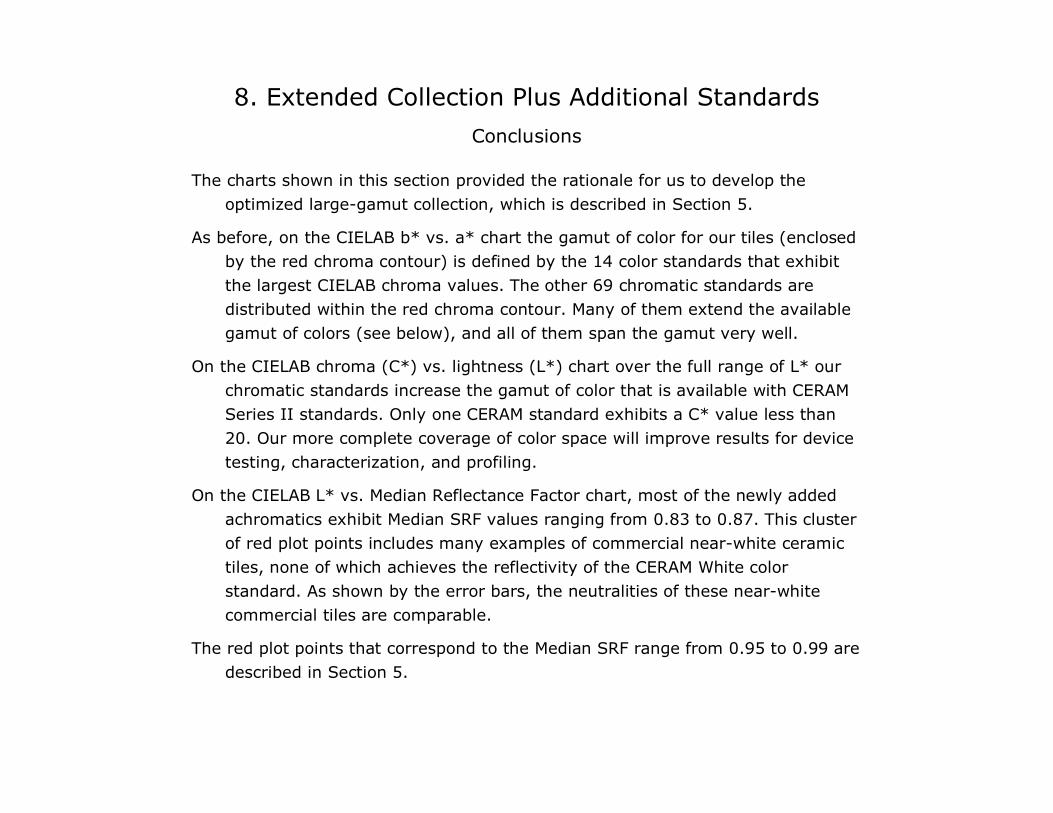
The charts shown in this section provided the rationale for us to develop the optimized large-gamut collection, which is described in Section 5.
As before, on the CIELAB b* vs. a* chart the gamut of color for our tiles (enclosed by the red chroma contour) is defined by the 14 color standards that exhibit the largest CIELAB chroma values. The other 69 chromatic standards are distributed within the red chroma contour. Many of them extend the available gamut of colors (see below), and all of them span the gamut very well.
On the CIELAB chroma (C*) vs. lightness (L*) chart over the full range of L* our chromatic standards increase the gamut of color that is available with CERAM Series II standards. Only one CERAM standard exhibits a C* value less than 20. Our more complete coverage of color space will improve results for device testing, characterization, and profiling.
On the CIELAB L* vs. Median Reflectance Factor chart, most of the newly added achromatics exhibit Median SRF values ranging from 0.83 to 0.87. This cluster of red plot points includes many examples of commercial near-white ceramic tiles, none of which achieves the reflectivity of the CERAM White color standard. As shown by the error bars, the neutralities of these near-white commercial tiles are comparable.
The red plot points that correspond to the Median SRF range from 0.95 to 0.99 are described in Section 5.

9. Other Ceramic Color Standards
Introduction
The charts in this section show the color gamut analysis for the 13 ceramic color standards distributed by X-Rite, Inc., for use with the NetProfiler online spectrophotometer profiling system. For comparison purposes we included the data for the GMCC Chart (see Section 7).
The following charts are included in this series:
CIELAB b* vs. a* Color Gamut Chart. Key to data: 6 best-chroma X-Rite tiles (magenta chroma contour), 3 reduced-chroma X-Rite tiles (other magenta points), 8 best-chroma GMCC painted plaques (green chroma contour), & 10 reduced-chroma GMCC plaques (other green points).
CIELAB Chroma (C*) vs. L* Color Gamut Chart. Key to data: Same as above.
CIELAB L* vs. Median Reflectance Factor Chart (achromatic tiles only). Key to data: 4 X-Rite achromatic tiles (magenta plot points), & 6 GMCC achromatic plaques (green points).

CIELAB b* vs. a* Color Gamut Chart
-80
-60
-40
-20
0
20
40
60
80
-80 -60 -40 -20 0 20 40 60 80
CIELAB a* (8/t) SCI or (0/45) BDIR
CIE
LAB b
* (
8/t
) SCI
or
(0/4
5)
BD
IR
8 GMCC Best Chroma (0/45)
18 GMCC Chromatics (0/45)
6 GMNPT Best Chroma
9 GMNPT Chromatics

CIELAB C* vs. L* Color Gamut Chart
0
10
20
30
40
50
60
70
80
20 30 40 50 60 70 80 90 100
CIELAB L* (8/t) SCI or (0/45) BDIR
CIE
LAB C
* (
8/t
) SCI
or
(0/4
5)
BD
IR
8 GMCC Best Chroma (0/45)
18 GMCC Chromatics (0/45)
GMNPT Best Chroma
9 GMNPT Chromatics

CIELAB L* vs. Median Reflectance Factor Chart
0
10
20
30
40
50
60
70
80
90
100
0.0 0.1 0.2 0.3 0.4 0.5 0.6 0.7 0.8 0.9 1.0
Median Reflectance (Radiance) Factor (380 - 730 nm)
CIE
LAB L
* (
8/t
) SCI
or
(0/4
5)
BD
IR
6 GMCC Achromatics (0/45)
4 GMNPT Achromatics

9. Other Ceramic Color Standards
Conclusions
The 3 charts in this section show the color gamut analysis for the set of 13 tiles that we purchased from Color Control Systems in 2006 for use with X-Rite NetProfiler and our Gretag-Macbeth ColorEye 7000A spectrophotometer.
The reference data for the GMCC Chart are described in Section 7.
On the CIELAB b* vs. a* chart the gamut of color sampled by the X-Rite color standards is very small. This conclusion is supported by the C* vs. L* chart, which also shows that all but one of the X-Rite standards exhibit C* values of 26 or less.
On the CIELAB L* vs. Median Reflectance Factor chart, none of the X-Rite standards exhibits a Median SRF value larger than 0.75. Three of these achromatic standards exhibit marginal neutrality values.