which battery is best? selecting the technically most ... solar 2004... · selecting the...
TRANSCRIPT
Which battery is best? Selecting the technically most suitable and economically best
battery for a renewable energy system - approach, results, outlook
H. Wenzl, I. Baring Gould, H. Bindner, .G. Bopp, N. von der Borg, K. Douglas, A. Jossen, R. Kaiser, P. Lundsager, J. Manwell, F. Mattera, F. Nieuwenhout,
P. Norgaard, A. Perujo, C. Rodrigues, A. Ruddell, D. U. Sauer, V. Svoboda, S. Tselepis, N. Wilmot
Beratung für Batterien und Energietechnik, Am Bergwäldchen 27, 37520 Osterode, Germany
E-mail: [email protected] Abstract
Lead acid batteries are the energy storage system of choice for most renewable energy systems (RES). They are also the single most expensive component when considering the lifecycle cost of the total system. Selecting the most suitable battery is therefore a very important task. Any new battery of appropriate capacity will be able to fulfil all performance requirements of a RES. However, the life expectancy differs greatly because there is a very wide range of conditions of use: the energy supply is site specific and the energy demand depends on the application and user behaviour. Abusive conditions are sometimes the inevitable outcome of sound technical and financial planning. This paper will discuss a method of making specific recommendations and providing a benchmarking process to determine the most suitable battery for any RES, any application and location. The method is based on evaluating field data by means of a Standard Evaluation Report, defining six categories of similar use and a method of assigning one of these categories to any RES, and matching test procedures to each of the categories. Planners and users can then select the most suitable battery for their application and manufacturers can develop products with clearly defined performance requirement. An extension of the method to include other components is also discussed.
1. INTRODUCTION
A battery which is recommended as being the best battery for a specific renewable energy system (RES) needs to fulfil all performance requirements of the user to the highest degree and as cost-efficiently as possible. Renewable energy systems are site specific. Without knowledge of the renewable energy resources it is impossible to optimally plan the system, size its components, plan the operating regime and select the most suitable components. In addition, there are no applications which are absolutely identical and even very small variations may lead to differences in the energy throughput of the system and some critical operating conditions may arise for their components. While making general recommendations for renewable energy systems and the batteries used for them is straightforward, making specific recommendations is impossible without a detailed analysis of the location and the application including a sensitivity analysis concerning the various assumptions that have to be made and their likely variations over time. For cost reasons, such a detailed analysis cannot be made except for large RES or RES with special requirements. Most of the standard renewable energy systems for remote locations, e.g. farmhouses, remote villages, telecommunications and safety installations, are therefore planned based on the experience of the planner and today's state of the art technology that does not differentiate sufficiently between RES for different applications and in different locations. This paper presents a method for making specific recommendations for RES yet avoiding the difficulty and cost of a detailed analysis for each system. The approach is based on creating categories of RES which are characterised by similar conditions of use for the component under investigation. As batteries are the component which usually account for the largest share of the lifecycle cost of a RES (Sauer, 2003), the method has been developed for batteries but with the view of extending it to other components as well. For each category, very specific recommendations can then be made in terms of
Solar 2004, 42nd Annual Conference of the Australian and New Zealand Solar Energy Society1 - 3 December 2004, Perth, Western Australia
Which Battery is Best? Wenzl
type and other technical features of batteries, test procedures relevant to the category, operating regimes, etc. A benchmarking process is then possible which allows battery manufacturers, planners and users to determine which product is particularly suitable for a specific category of RES. Establishing this method has required refining some existing concepts and the development of new concepts, developing software for data analysis and lifetime prediction, battery testing to provide credibility to recommendations which are based on lifetime prediction, and achieving a consensus between the participants of the project as regards detailed recommendations for the selection of batteries, operating regimes and testing. The following steps were necessary:
1. How are batteries used in RES? 2. How to define categories of similar use and derive them from RES data? 3. How to assign a category of similar use to a system which is either operational, i.e. very
detailed data are available or only highly aggregated data exist, or which is planned, i.e. no data of the operation are available?
4. What are the performance requirements of a battery in a certain category and what test procedures can be used to provide a meaningful test concerning the performance requirements which exist in that category?
5. Is it possible to predict the lifetime of a battery using models so that the approach can be used before test results become available for all batteries which are offered for RES?
6. How to present the results in such a way that they will be used in the future as a "best practice" guideline and how to convince planners, manufacturers, users and financial decision makers that this method of selecting and testing batteries for RES and, in future, also other components should be used.
These individual steps will be explained in detail in the paper.
2. THE USE OF BATTERIES IN RENEWABLE ENERGY SYSTEMS
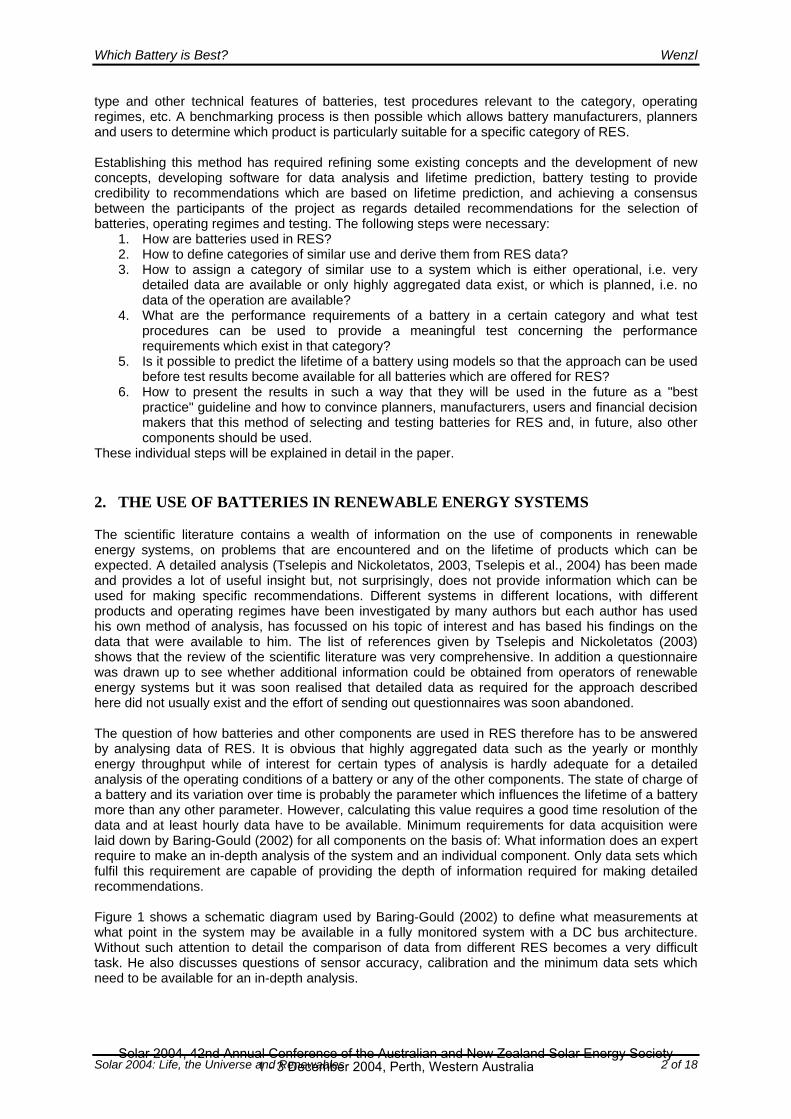
The scientific literature contains a wealth of information on the use of components in renewable energy systems, on problems that are encountered and on the lifetime of products which can be expected. A detailed analysis (Tselepis and Nickoletatos, 2003, Tselepis et al., 2004) has been made and provides a lot of useful insight but, not surprisingly, does not provide information which can be used for making specific recommendations. Different systems in different locations, with different products and operating regimes have been investigated by many authors but each author has used his own method of analysis, has focussed on his topic of interest and has based his findings on the data that were available to him. The list of references given by Tselepis and Nickoletatos (2003) shows that the review of the scientific literature was very comprehensive. In addition a questionnaire was drawn up to see whether additional information could be obtained from operators of renewable energy systems but it was soon realised that detailed data as required for the approach described here did not usually exist and the effort of sending out questionnaires was soon abandoned. The question of how batteries and other components are used in RES therefore has to be answered by analysing data of RES. It is obvious that highly aggregated data such as the yearly or monthly energy throughput while of interest for certain types of analysis is hardly adequate for a detailed analysis of the operating conditions of a battery or any of the other components. The state of charge of a battery and its variation over time is probably the parameter which influences the lifetime of a battery more than any other parameter. However, calculating this value requires a good time resolution of the data and at least hourly data have to be available. Minimum requirements for data acquisition were laid down by Baring-Gould (2002) for all components on the basis of: What information does an expert require to make an in-depth analysis of the system and an individual component. Only data sets which fulfil this requirement are capable of providing the depth of information required for making detailed recommendations. Figure 1 shows a schematic diagram used by Baring-Gould (2002) to define what measurements at what point in the system may be available in a fully monitored system with a DC bus architecture. Without such attention to detail the comparison of data from different RES becomes a very difficult task. He also discusses questions of sensor accuracy, calibration and the minimum data sets which need to be available for an in-depth analysis.
Solar 2004: Life, the Universe and Renewables 2 of 18 Solar 2004, 42nd Annual Conference of the Australian and New Zealand Solar Energy Society
1 - 3 December 2004, Perth, Western Australia
Which Battery is Best? Wenzl
ACDC
ACDC
ChargeControler
ChargeControler
ChargeControler
ISIS_cVS_c
IA_c
wtg_cV IwtgIwtg_c
GVwind
Vdir
Vflow
ChargeControler
Ihydro_c
IU_dc
hydro_cV
IINV
IINVdcV
acV
EINV
EINV
EU
Ihydro
EG
IG_cVG_c
ChargeControler
IG
U_reac,E U,fac,pf
,ITS,IFS
IA
TAm
TS
ChargeControler
U_dcV
Figure 1: Schematic diagram of an renewable energy system with one DC bus (DC system connecting all energy resources) showing a range of energy supplying and energy consuming components and various measurement points The number of systems for which a sufficiently detailed data acquisition has been carried out for a representative time period (in renewable energy systems this is often one year due to seasonal changes of the renewable energy resources and loads) is quite small. What is now available and forms the basis of the further work described here is publicly available under www.benchmarking.eu.org/reports.asp. This list of evaluated data sets is already free of data sets with obvious mistakes which could not be recalibrated (e.g. energy consumption more than energy supply) and only contains research installations if their loads and energy supply are a realistic approximation of real conditions.
Table 1: List of graphs and histograms for batteries in the Standard Evaluation Report. The data is calculated from battery voltage, current and temperature to allow an evaluation of the operating
conditions of a battery in RES.
1 Data availability per month 2 Maximum and minimum battery voltage per day (bar chart), 3 Battery current [I_10] versus mean cell voltage [V], 4 Operation time in % of the year at a given SOC [%], 5 Time series of the state of charge through the year (as calculated by some data
acquisition systems) 6 Time series of the state of charge through the year (recalculated for all systems using one
software program) 7 Operation time in % of the year at a given mean cell voltage [V], 8 Operation time in % of the year at a given battery current in unit I_10 9 Charged and discharged Ah in units of battery capacity per month 10 Charge factor in Ah and Wh per month 11 Operation time in % of the year at a given battery temperature
Solar 2004: Life, the Universe and Renewables 3 of 18 Solar 2004, 42nd Annual Conference of the Australian and New Zealand Solar Energy Society
1 - 3 December 2004, Perth, Western Australia
Which Battery is Best? Wenzl
The differences in the data from different data acquisition systems are large. The point of measurement, e.g. measuring the load before or after the inverter, the time stamp, the averaging methods used, in particular for the battery current, and the format used for storing data all have to be taken into account. As a result, the software program ITHESA that has been created is very flexible and can handle all reasonable methods of data acquisition. ITHESA is publicly available under www.benchmarking.eu.org and it is hoped that it will set the standard for evaluating data of components of RES whenever an in-depth analysis has to be made.
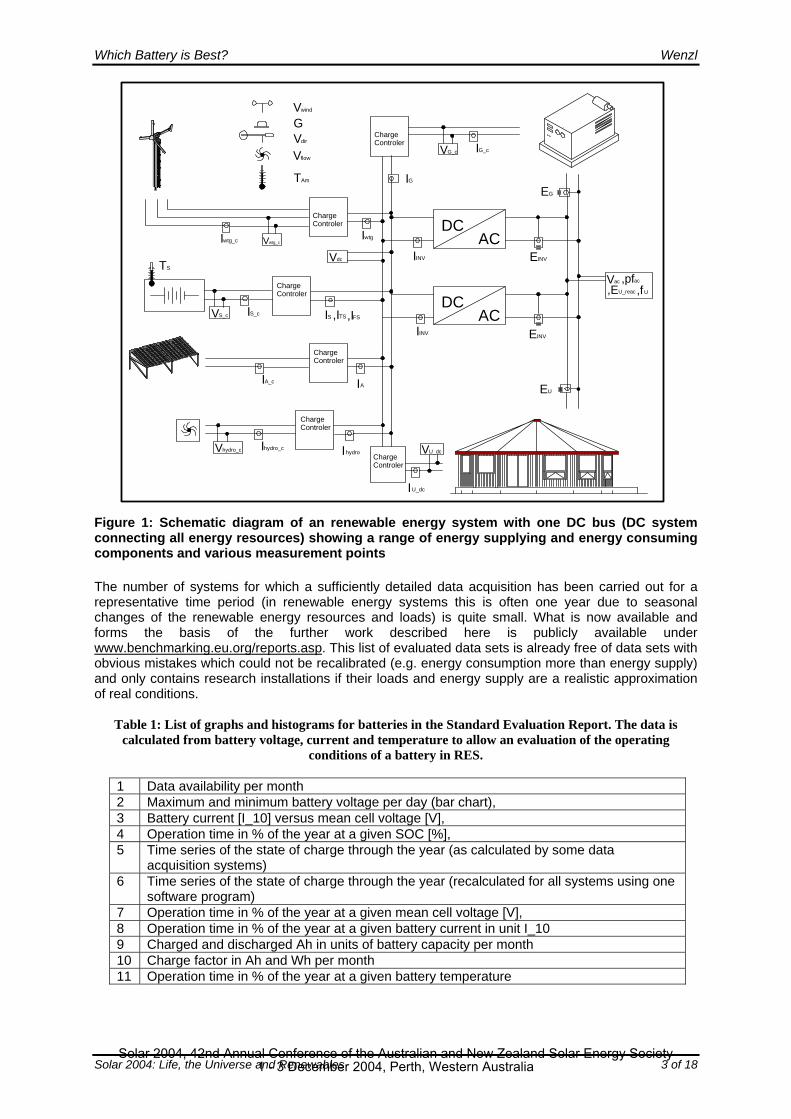
Figure 2: Excerpt of a Standard Evaluation Report of a Hybrid system in the German Black Forest area operated for a farmhouse and restaurant (category G4). Despite the availability of a diesel generator, the battery reaches a very low state of charge in the summer where the load is highest.
Comparing systems is easiest if the data are presented in a standardised manner. The structure of the so called Standard Evaluation Report (SER) which has been used for further analysis has been described in detail by Perujo (2003) and Sauer et al. (2003a). All battery measurements are
Solar 2004: Life, the Universe and Renewables 4 of 18 Solar 2004, 42nd Annual Conference of the Australian and New Zealand Solar Energy Society
1 - 3 December 2004, Perth, Western Australia
Which Battery is Best? Wenzl
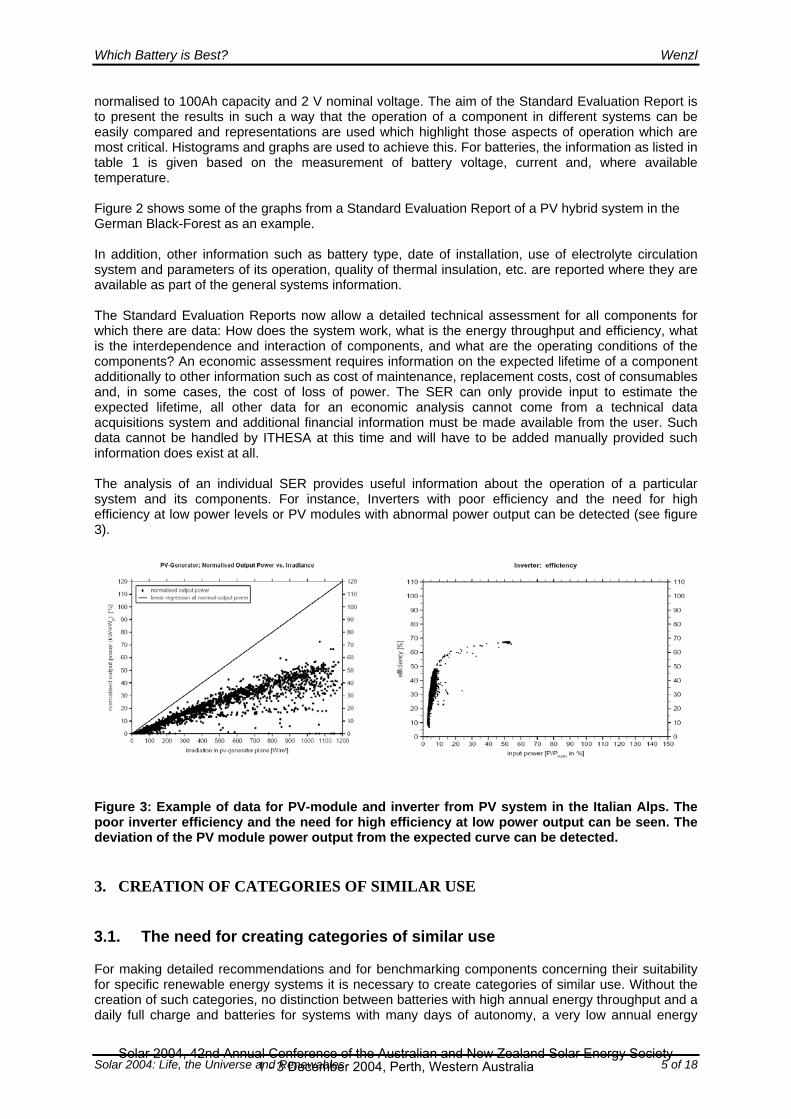
normalised to 100Ah capacity and 2 V nominal voltage. The aim of the Standard Evaluation Report is to present the results in such a way that the operation of a component in different systems can be easily compared and representations are used which highlight those aspects of operation which are most critical. Histograms and graphs are used to achieve this. For batteries, the information as listed in table 1 is given based on the measurement of battery voltage, current and, where available temperature. Figure 2 shows some of the graphs from a Standard Evaluation Report of a PV hybrid system in the German Black-Forest as an example. In addition, other information such as battery type, date of installation, use of electrolyte circulation system and parameters of its operation, quality of thermal insulation, etc. are reported where they are available as part of the general systems information. The Standard Evaluation Reports now allow a detailed technical assessment for all components for which there are data: How does the system work, what is the energy throughput and efficiency, what is the interdependence and interaction of components, and what are the operating conditions of the components? An economic assessment requires information on the expected lifetime of a component additionally to other information such as cost of maintenance, replacement costs, cost of consumables and, in some cases, the cost of loss of power. The SER can only provide input to estimate the expected lifetime, all other data for an economic analysis cannot come from a technical data acquisitions system and additional financial information must be made available from the user. Such data cannot be handled by ITHESA at this time and will have to be added manually provided such information does exist at all. The analysis of an individual SER provides useful information about the operation of a particular system and its components. For instance, Inverters with poor efficiency and the need for high efficiency at low power levels or PV modules with abnormal power output can be detected (see figure 3).
Figure 3: Example of data for PV-module and inverter from PV system in the Italian Alps. The poor inverter efficiency and the need for high efficiency at low power output can be seen. The deviation of the PV module power output from the expected curve can be detected.
3. CREATION OF CATEGORIES OF SIMILAR USE
3.1. The need for creating categories of similar use
For making detailed recommendations and for benchmarking components concerning their suitability for specific renewable energy systems it is necessary to create categories of similar use. Without the creation of such categories, no distinction between batteries with high annual energy throughput and a daily full charge and batteries for systems with many days of autonomy, a very low annual energy
Solar 2004: Life, the Universe and Renewables 5 of 18 Solar 2004, 42nd Annual Conference of the Australian and New Zealand Solar Energy Society
1 - 3 December 2004, Perth, Western Australia
Which Battery is Best? Wenzl
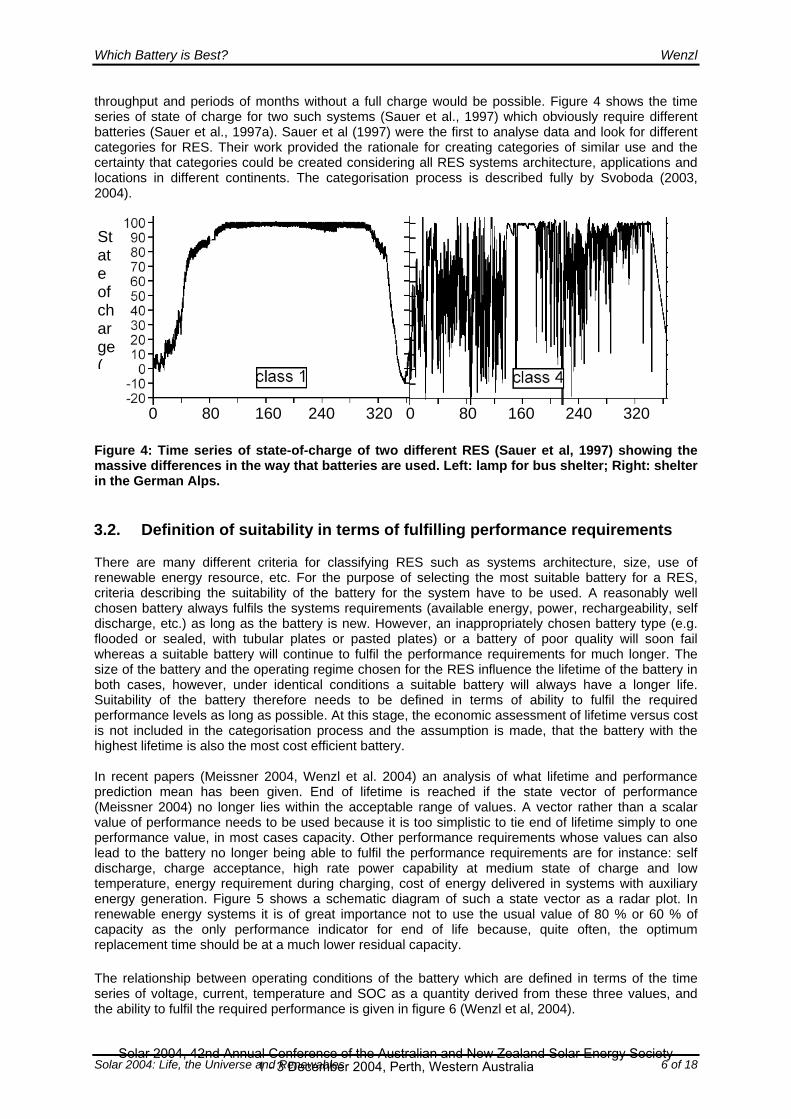
throughput and periods of months without a full charge would be possible. Figure 4 shows the time series of state of charge for two such systems (Sauer et al., 1997) which obviously require different batteries (Sauer et al., 1997a). Sauer et al (1997) were the first to analyse data and look for different categories for RES. Their work provided the rationale for creating categories of similar use and the certainty that categories could be created considering all RES systems architecture, applications and locations in different continents. The categorisation process is described fully by Svoboda (2003, 2004).
State of charge (
F
0 80 160 240 320 0 80 160 240 320
igure 4: Time series of state-of-charge of two different RES (Sauer et al, 1997) showing the
3.2. Definition of suitability in terms of fulfilling performance requirements
There are many different criteria for classifying RES such as systems architecture, size, use of
recent papers (Meissner 2004, Wenzl et al. 2004) an analysis of what lifetime and performance
he relationship between operating conditions of the battery which are defined in terms of the time series of voltage, current, temperature and SOC as a quantity derived from these three values, and the ability to fulfil the required performance is given in figure 6 (Wenzl et al, 2004).
massive differences in the way that batteries are used. Left: lamp for bus shelter; Right: shelter in the German Alps.
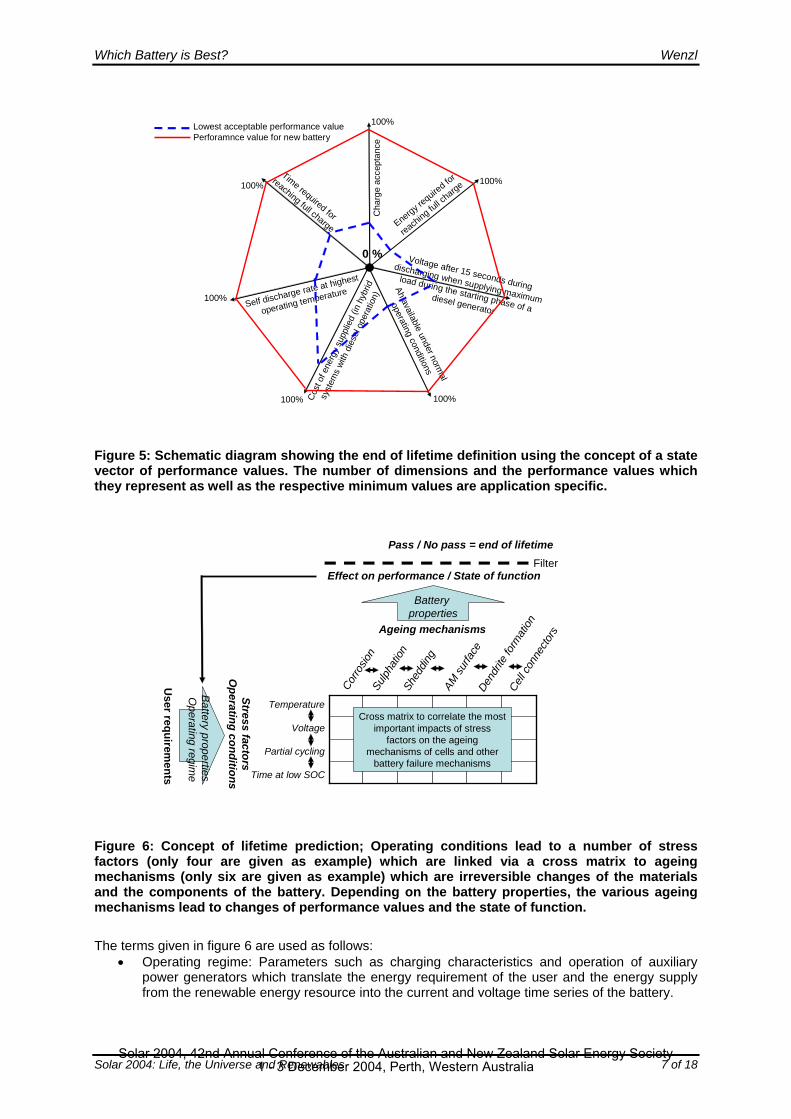
renewable energy resource, etc. For the purpose of selecting the most suitable battery for a RES, criteria describing the suitability of the battery for the system have to be used. A reasonably well chosen battery always fulfils the systems requirements (available energy, power, rechargeability, self discharge, etc.) as long as the battery is new. However, an inappropriately chosen battery type (e.g. flooded or sealed, with tubular plates or pasted plates) or a battery of poor quality will soon fail whereas a suitable battery will continue to fulfil the performance requirements for much longer. The size of the battery and the operating regime chosen for the RES influence the lifetime of the battery in both cases, however, under identical conditions a suitable battery will always have a longer life. Suitability of the battery therefore needs to be defined in terms of ability to fulfil the required performance levels as long as possible. At this stage, the economic assessment of lifetime versus cost is not included in the categorisation process and the assumption is made, that the battery with the highest lifetime is also the most cost efficient battery. Inprediction mean has been given. End of lifetime is reached if the state vector of performance (Meissner 2004) no longer lies within the acceptable range of values. A vector rather than a scalar value of performance needs to be used because it is too simplistic to tie end of lifetime simply to one performance value, in most cases capacity. Other performance requirements whose values can also lead to the battery no longer being able to fulfil the performance requirements are for instance: self discharge, charge acceptance, high rate power capability at medium state of charge and low temperature, energy requirement during charging, cost of energy delivered in systems with auxiliary energy generation. Figure 5 shows a schematic diagram of such a state vector as a radar plot. In renewable energy systems it is of great importance not to use the usual value of 80 % or 60 % of capacity as the only performance indicator for end of life because, quite often, the optimum replacement time should be at a much lower residual capacity. T
Solar 2004: Life, the Universe and Renewables 6 of 18 Solar 2004, 42nd Annual Conference of the Australian and New Zealand Solar Energy Society
1 - 3 December 2004, Perth, Western Australia
Which Battery is Best? Wenzl
Ah available under normal
operating conditions
Self discharge rate at highest
operating temperature
Cha
rge
acce
ptan
ce
Cost
of e
nerg
y su
pplie
d (in
hyb
rid
syst
ems
with
die
sel o
pera
tion)
Voltage after 15 seconds during
discharging when supplying maximum
load during the starting phase of a diesel generator
Energy require
d for
reaching fu
ll charge
Time required for
reaching full charge
100% Lowest acceptable performance valuePerforamnce value for new battery
100%
100% 100%
100%
100%
0 %
Figure 5: Schematic diagram showing the end of lifetime definition using the concept of a state vector of performance values. The number of dimensions and the performance values which they represent as well as the respective minimum values are application specific.
Ageing mechanisms
Effect on performance / State of function
Corro
sion
Shed
ding
Sulph
ation
Battery properties
Temperature
Voltage
Partial cycling
Time at low SOC
Stress factorsO
perating conditions
User requirem
ents
Battery properties O
perating regime
Dend
rite
form
ation
Cell c
onne
ctors
Filter
Pass / No pass = end of lifetime
AM su
rface
Cross matrix to correlate the most important impacts of stress
factors on the ageing mechanisms of cells and other
battery failure mechanisms
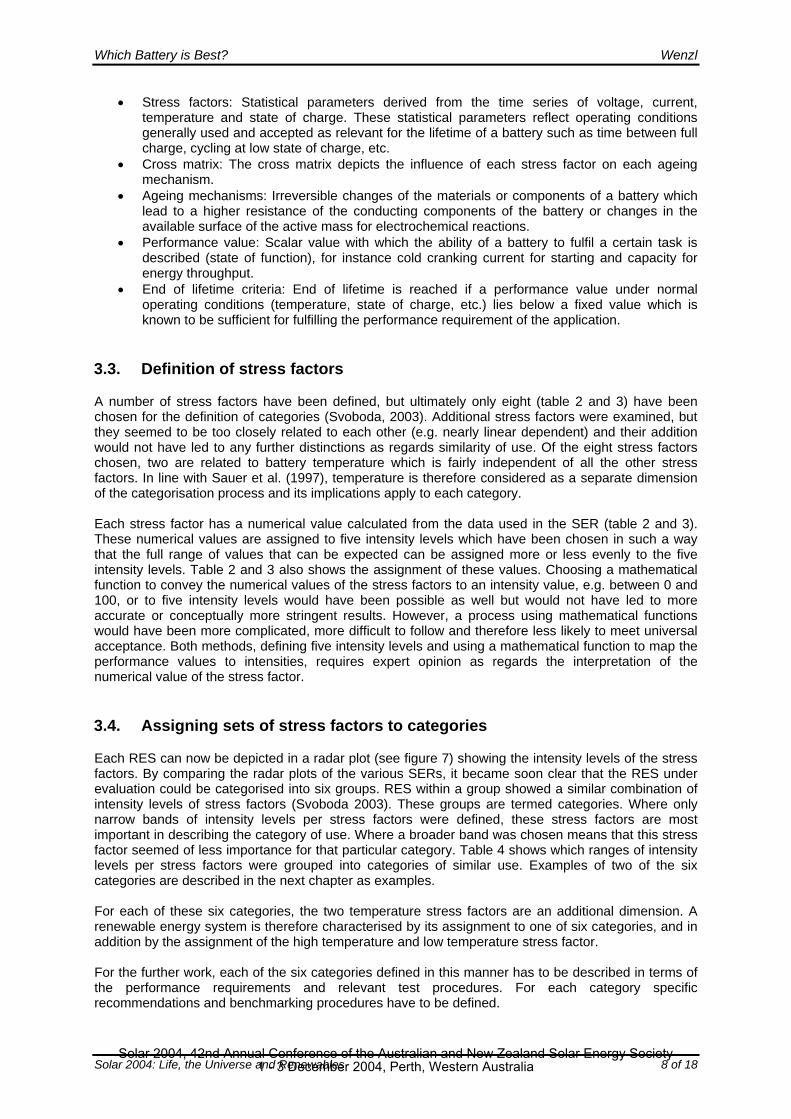
Figure 6: Concept of lifetime prediction; Operating conditions lead to a number of stress factors (only four are given as example) which are linked via a cross matrix to ageing mechanisms (only six are given as example) which are irreversible changes of the materials
tion of auxiliary power generators which translate the energy requirement of the user and the energy supply
the current and voltage time series of the battery.
and the components of the battery. Depending on the battery properties, the various ageing mechanisms lead to changes of performance values and the state of function.
The terms given in figure 6 are used as follows:
• Operating regime: Parameters such as charging characteristics and opera
from the renewable energy resource into
Solar 2004: Life, the Universe and Renewables 7 of 18 Solar 2004, 42nd Annual Conference of the Australian and New Zealand Solar Energy Society
1 - 3 December 2004, Perth, Western Australia
Which Battery is Best? Wenzl
• Stress factors: Statistical parameters derived from the time series of voltage, current, temperature and state of charge. These statistical parameters reflect operating conditions generally used and accepted as relevant for the lifetime of a battery such as time between full
•
• f the materials or components of a battery which
ace of the active mass for electrochemical reactions.
t for fulfilling the performance requirement of the application.
3.3.
but ultimately only eight (table 2 and 3) have been boda, 2003). Additional stress factors were examined, but
they seemed to be too closely related to each other (e.g. nearly linear dependent) and their addition
een chosen in such a way at the full range of values that can be expected can be assigned more or less evenly to the five
s factors to categories
Each RES can now be depicted in a radar plot (see figure 7) showing the intensity levels of the stress e soon clear that the RES under
evaluation could be categorised into six groups. RES within a group showed a similar combination of
assignment to one of six categories, and in ddition by the assignment of the high temperature and low temperature stress factor.
egory specific commendations and benchmarking procedures have to be defined.
charge, cycling at low state of charge, etc. Cross matrix: The cross matrix depicts the influence of each stress factor on each ageing mechanism. Ageing mechanisms: Irreversible changes olead to a higher resistance of the conducting components of the battery or changes in the available surf
• Performance value: Scalar value with which the ability of a battery to fulfil a certain task is described (state of function), for instance cold cranking current for starting and capacity for energy throughput.
• End of lifetime criteria: End of lifetime is reached if a performance value under normal operating conditions (temperature, state of charge, etc.) lies below a fixed value which is known to be sufficien
Definition of stress factors
A number of stress factors have been defined, chosen for the definition of categories (Svo
would not have led to any further distinctions as regards similarity of use. Of the eight stress factors chosen, two are related to battery temperature which is fairly independent of all the other stress factors. In line with Sauer et al. (1997), temperature is therefore considered as a separate dimension of the categorisation process and its implications apply to each category. Each stress factor has a numerical value calculated from the data used in the SER (table 2 and 3). These numerical values are assigned to five intensity levels which have bthintensity levels. Table 2 and 3 also shows the assignment of these values. Choosing a mathematical function to convey the numerical values of the stress factors to an intensity value, e.g. between 0 and 100, or to five intensity levels would have been possible as well but would not have led to more accurate or conceptually more stringent results. However, a process using mathematical functions would have been more complicated, more difficult to follow and therefore less likely to meet universal acceptance. Both methods, defining five intensity levels and using a mathematical function to map the performance values to intensities, requires expert opinion as regards the interpretation of the numerical value of the stress factor.
3.4. Assigning sets of stres
factors. By comparing the radar plots of the various SERs, it becam
intensity levels of stress factors (Svoboda 2003). These groups are termed categories. Where only narrow bands of intensity levels per stress factors were defined, these stress factors are most important in describing the category of use. Where a broader band was chosen means that this stress factor seemed of less importance for that particular category. Table 4 shows which ranges of intensity levels per stress factors were grouped into categories of similar use. Examples of two of the six categories are described in the next chapter as examples. For each of these six categories, the two temperature stress factors are an additional dimension. A renewable energy system is therefore characterised by its a For the further work, each of the six categories defined in this manner has to be described in terms of the performance requirements and relevant test procedures. For each catre
Solar 2004: Life, the Universe and Renewables 8 of 18 Solar 2004, 42nd Annual Conference of the Australian and New Zealand Solar Energy Society
1 - 3 December 2004, Perth, Western Australia
Which Battery is Best? Wenzl
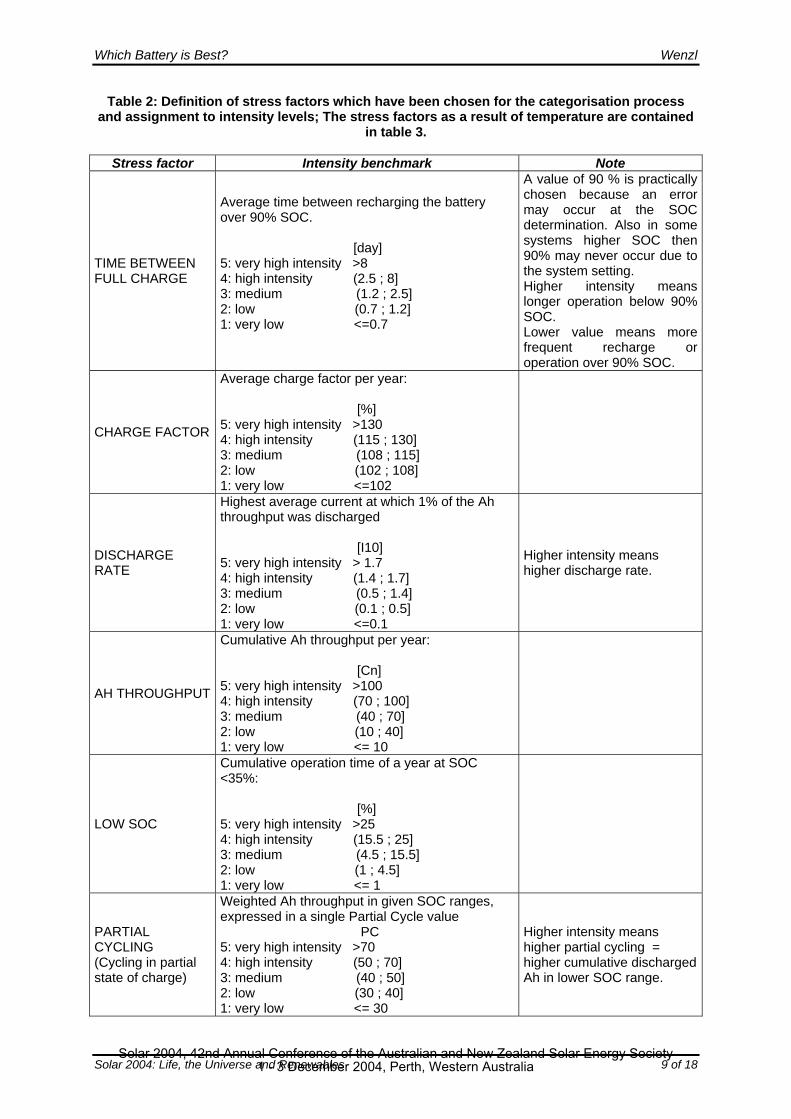
Table 2: Definition of stress factors which have been chosen for the categorisation process and assignment to intensity levels; The stress factors as a result of temperature are contained
in table 3.
Stress factor Intensity benchmark Note
TIME BETWEEN FULL CHARGE
Average time battery over 90% SO
sity >8 : high intensity (2.5 ; 8]
2.5] ; 1.2]
A value of 90 % is practically chosen because an error may occur at the SOC
on over 90% SOC.
between recharging theC.
[day] 5: very high inten43: medium (1.2 ; 2: low (0.71: very low <=0.7
determination. Also in some systems higher SOC then 90% may never occur due to the system setting. Higher intensity means longer operation below 90% SOC. Lower value means more frequent recharge or operati
CHARGE FACTOR
r:
[%]
: high intensity (115 ; 130] ; 115] 108]
A
verage charge factor per yea
5: very high intensity >130 43: medium (1082: low (102 ;1: very low <=102
DISCHARGE RATE
% of the Ah
: high intensity (1.4 ; 1.7] .4]
0.5]
Higher intensity means higher discharge rate.
Highest average current at which 1throughput was discharged [I10] 5: very high intensity > 1.7 43: medium (0.5 ; 12: low (0.1 ; 1: very low <=0.1
AH THROUGHPUT
r:
: high intensity (70 ; 100] 0] 0]
Cumulative Ah throughput per yea [Cn] 5: very high intensity >100 43: medium (40 ; 72: low (10 ; 41: very low <= 10
LOW SOC
ar at SOC
igh intensity >25 : high intensity (15.5 ; 25]
; 15.5]
Cumulative operation time of a ye<35%: [%] 5: very h43: medium (4.5 2: low (1 ; 4.5] 1: very low <= 1
PARTIAL
partial
OC ranges, cle value
50] 40]
Higher intensity means
rged CYCLING (Cycling in state of charge)
Weighted Ah throughput in given Sexpressed in a single Partial Cy PC 5: very high intensity >70 4: high intensity (50 ; 70] 3: medium (40 ; 2: low (30 ;1: very low <= 30
higher partial cycling = higher cumulative dischaAh in lower SOC range.
Solar 2004: Life, the Universe and Renewables 9 of 18 Solar 2004, 42nd Annual Conference of the Australian and New Zealand Solar Energy Society
1 - 3 December 2004, Perth, Western Australia
Which Battery is Best? Wenzl
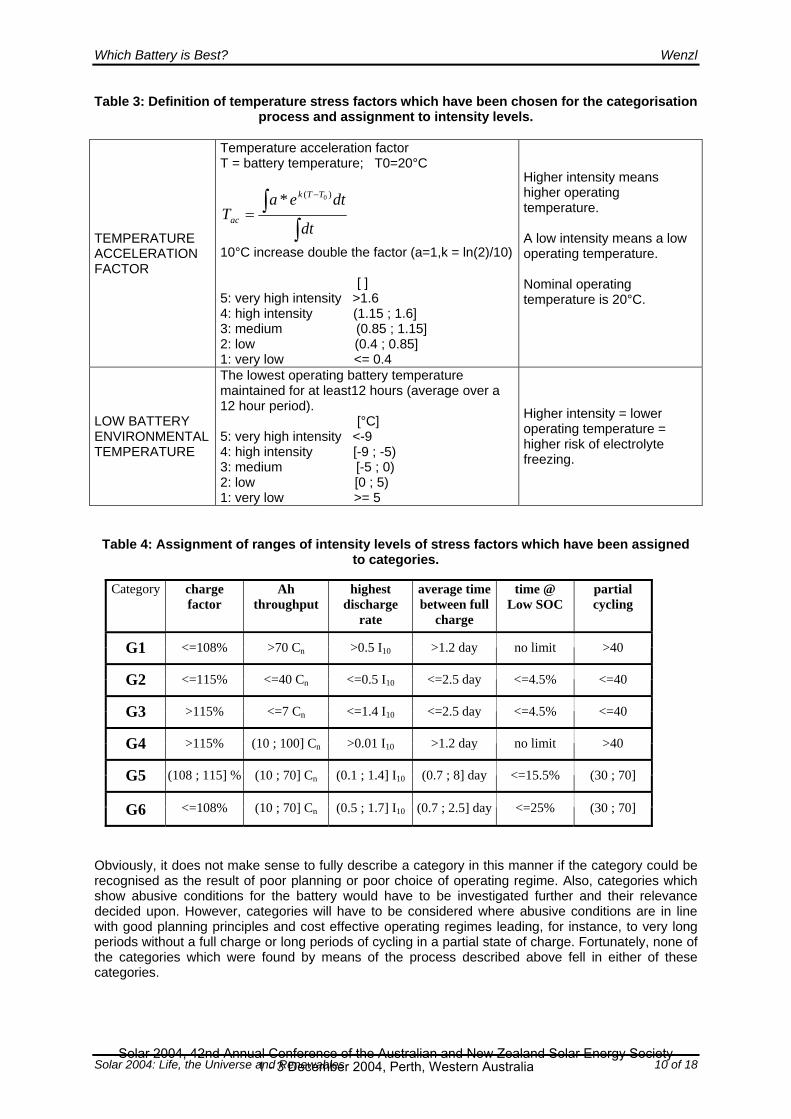
Table 3: Definition o hich have been chosen for the categorisation t to intensity levels.
TEMPERATURE ACCELERATION FACTOR
T = ba
f temperature stress factors wprocess and assignmen
Temperature acceleration factor ttery temperature; T0=20°C
∫∫ − dtea TTk )( 0*
=Tacdt
10°C increase double the factor (a=1,k = ln(2)/10)
: high intensity (1.15 ; 1.6] 5 ; 1.15] 0.85]
Higher intensity means higher operating temperature.
ans a low re.
[ ] 5: very high intensity >1.6 43: medium (0.82: low (0.4 ;1: very low <= 0.4
A low intensity meoperating temperatu Nominal operating temperature is 20°C.
LOW BATTERY ENVIRONMENTAL TEMPERATURE
ature erage over a
[-9 ; -5) )
Higher intensity = lower operating temperature = higher risk of electrolyte
The lowest operating battery tempermaintained for at least12 hours (av12 hour period). [°C] 5: very high intensity <-9 4: high intensity 3: medium [-5 ; 02: low [0 ; 5) 1: very low >= 5
freezing.
Table 4: Assignme els of stress factors which have been assigned to categories.
Obvi , it doe categ recognised as the result of poor planning or poor choice of operating regime. Also, categories hich how abusive conditions for the battery would have to be investigated further and their relevance
rate charge
nt of ranges of intensity lev
Category charge factor
Ah throughput
highest discharge
average time between full
time @ Low SOC
partial cycling
G1 <=108% >70 Cn >0.5 I10 >1.2 day no limit >40
G2 <=115% <=40 Cn <=0.5 I10 <=2.5 day <=4.5% <=40
G3 >115% <=7 Cn <=1.4 I10 <=2.5 day <=4.5% <=40
G4 >115% (10 ; 100] Cn >0.01 I10 >1.2 day no limit >40
G5 (108 ; 115] % (10 ; 70] Cn (0.1 ; 1.4] I10 (0.7 ; 8] day <=15.5% (30 ; 70]
G6 <=108% (10 ; 70] Cn (0.5 ; 1.7] I10 (0.7 ; 2.5] day <=25% (30 ; 70]
ously s not make sense to fully describe a ory in this manner if the category could bew
sdecided upon. However, categories will have to be considered where abusive conditions are in line with good planning principles and cost effective operating regimes leading, for instance, to very long periods without a full charge or long periods of cycling in a partial state of charge. Fortunately, none of the categories which were found by means of the process described above fell in either of these categories.
Solar 2004: Life, the Universe and Renewables 10 of 18 Solar 2004, 42nd Annual Conference of the Australian and New Zealand Solar Energy Society
1 - 3 December 2004, Perth, Western Australia
Which Battery is Best? Wenzl
charge factor
0
1
2
3
4
5
Ah throughput
highest discharge rate(1%Cn)
aver. time between fullcharge
time@ Low SOC
partial cycling
G1
0
1
2
3
4
5
charge factor
Ah throughput
highest discharge rate(1%Cn)
aver. time between fullcharge
time@ Low SOC
partial cycling
G2
0
1
2
3
4
5
charge factor
Ah throughput
highest discharge rate(1%Cn)
aver. time between fullcharge
time@ Low SOC
partial cycling
G3
0
1
2
3
4
5
charge factor
Ah throughput
highest discharge rate(1%Cn)
aver. time between fullcharge
time@ Low SOC
partial cycling
G4
0
1
2
3
4
5
charge factor
Ah throughput
highest discharge rate(1%Cn)
aver. time between fullcharge
time@ Low SOC
partial cycling
G5
0
1
2
3
4
5
charge factor
Ah throughput
highest discharge rate(1%Cn)
aver. time between fullcharge
time@ Low SOC
partial cycling
G6
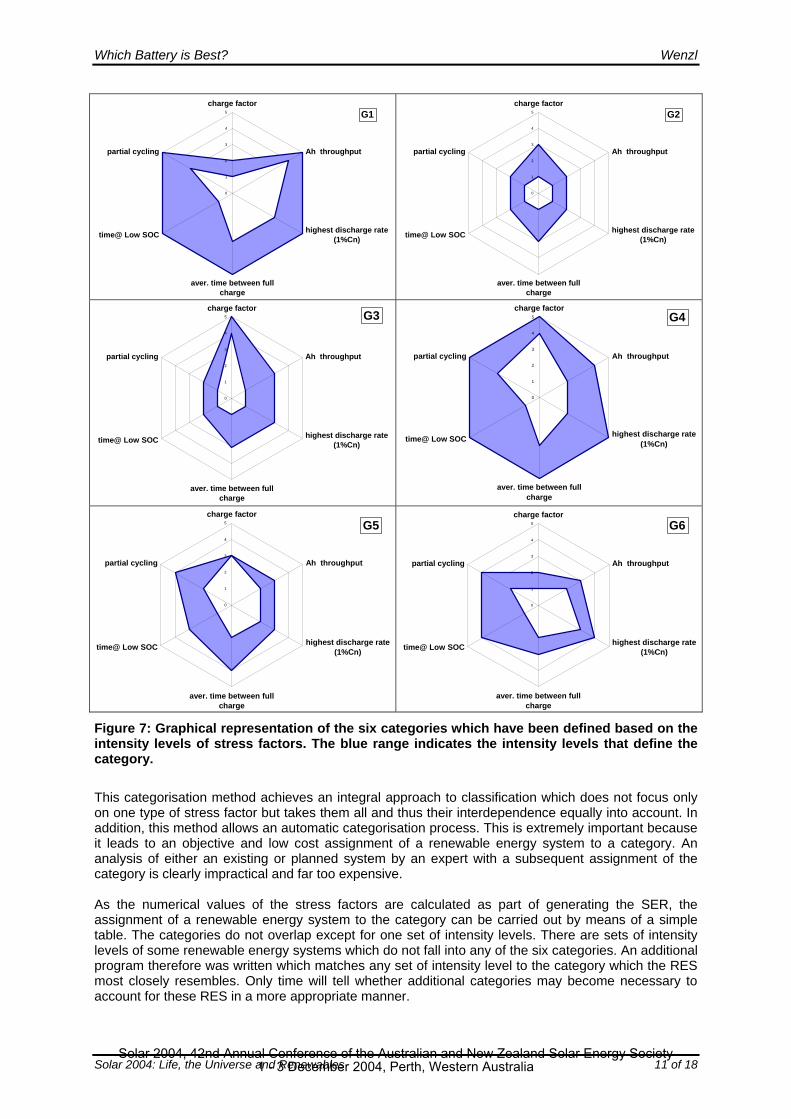
Figure 7: Graphical representation of the six categories which have been defined based on the intensity levels of stress factors. The blue range indicates the intensity levels that define the category.
of stress factor but takes them all and thus their interdependence equally into account. In ddition, this method allows an automatic categorisation process. This is extremely important because
e carried out by means of a simple ble. The categories do not overlap except for one set of intensity levels. There are sets of intensity
This categorisation method achieves an integral approach to classification which does not focus only on one typeait leads to an objective and low cost assignment of a renewable energy system to a category. An analysis of either an existing or planned system by an expert with a subsequent assignment of the category is clearly impractical and far too expensive. As the numerical values of the stress factors are calculated as part of generating the SER, the assignment of a renewable energy system to the category can btalevels of some renewable energy systems which do not fall into any of the six categories. An additional program therefore was written which matches any set of intensity level to the category which the RES most closely resembles. Only time will tell whether additional categories may become necessary to account for these RES in a more appropriate manner.
Solar 2004: Life, the Universe and Renewables 11 of 18 Solar 2004, 42nd Annual Conference of the Australian and New Zealand Solar Energy Society
1 - 3 December 2004, Perth, Western Australia
Which Battery is Best? Wenzl
The categorisation process has shown that systems can fall into different categories if data sets of different years are compared. This is an expected result of the categorisation process as both the
newable resource, the use of the RES and, in some cases, the settings of control parameters for the
lar time series by means of mathematical processes such as attern recognition algorithms of the time series or their Fourier transforms. This method has not been
URES
g a high Ah low charge factor
etc. have to be described (Svoboda 2004a). The performance requirements can be easily and directly
shown in Figure 2 and the RES hown in figure 8 are compared. Figure 2 shows a category G4 system with fairly large variations of
n the manufacturing process and type of battery. Acid stratification will not be a major problem in
experience ained with batteries in renewable energy systems. There simply are not enough batteries from well
reoperating regime may vary from year to year. More importantly is that as the battery ages the current and voltage profile changes even if the same energy requirement and energy availability exists. An aged battery with its apparent lower capacity will reach a lower SOC and when recharged has the potential of a more frequent recharge. An alternative method of classifying the systems is using the time series of current, voltage and temperature to find systems with simipfollowed due to the obvious complexity but also because of two inherent problems and risks. The mathematical analysis will only give numerical values of similarity. Without first having defined reference systems, such values of similarity do not help in defining categories of similar use which occur frequently. A more important reason for rejecting this method is, however, the mathematical nature of the approach. In order to find wide spread acceptance of the categories, it seemed important to find a method which could be used simply and would be easy to understand. A black box approach based on complex mathematical processes is therefore not appropriate.
4. PERFORMANCE REQUIREMENTS AND TEST PROCED
For each category, performance requirements such as the capability of achievinthroughput, operating at partial state of charge without degradation, withstanding a
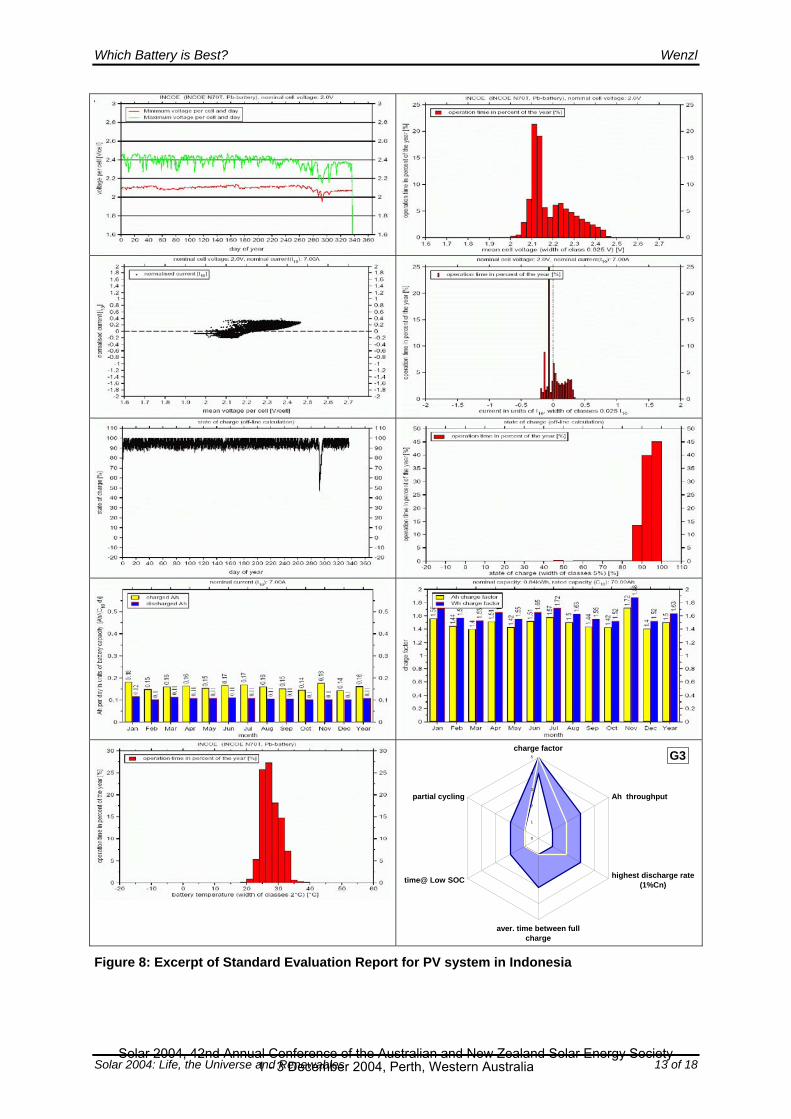
deduced from the categories themselves. In addition, the risk of ageing processes which are likely to take place and damaging conditions which may develop have to be defined so that recommendations can be made. An example of damaging conditions is acid stratification which is likely to occur in most lead acid batteries used in renewable energy systems. Acid stratification in flooded cells does not in itself cause irreversible damage to the battery as it can be simply removed by a period of overcharging or the use of auxiliary equipment (electrolyte circulation systems). Nevertheless, the performance of the battery is reduced and some ageing processes are accelerated. As an example, two of the six categories are described in more detail. A full description of all categories is given by Svoboda (2004a). As an example the RES sstate of charge. The RES is situated in the Black Forest region of Germany. Figure 8 shows a category G3 system with virtually the same Ah throughput in relation to the nominal capacity. The system is located in Indonesia. There is a fairly small variation of state of charge and the battery reaches a full charge virtually every day. Only once does the battery fall below a SOC of approx. 90%. It is important to distinguish between the risk of ageing processes, which are the result of the combination of stress factors in a certain category, and ageing mechanisms themselves which depend obatteries with immobilised electrolyte and corrosion will not occur rapidly if batteries with corrosion resistant alloys and high quality manufacturing process have been used. In addition, the same amount of corrosion (thickness of corrosion layer and/or quantity of material which has corroded) does not lead to the same loss of performance because the thickness of the grid also plays a role. Table 5 (Svoboda, 2004a) shows an assignment of ageing risks to categories as a result of the combination of the various stress factors. This assignment is an expert opinion based ongmonitored systems with subsequent post mortem analysis to base this table on laboratory results. For laboratory tests, a table with a similar structure has been made (Desmettre et al., 2000) has been created which matches test procedures for different types of lead acid batteries to ageing mechanisms which were observed as a result of a post-mortem analysis.
Solar 2004: Life, the Universe and Renewables 12 of 18 Solar 2004, 42nd Annual Conference of the Australian and New Zealand Solar Energy Society
1 - 3 December 2004, Perth, Western Australia
Which Battery is Best? Wenzl
0
1
2
3
4
5
charge factor
Ah throughput
highest discharge rate(1%Cn)
aver. time between fullcharge
time@ Low SOC
partial cycling
G3
Figure 8: Excerpt of Standard Evaluation Report for PV system in Indonesia
Solar 2004: Life, the Universe and Renewables 13 of 18 Solar 2004, 42nd Annual Conference of the Australian and New Zealand Solar Energy Society
1 - 3 December 2004, Perth, Western Australia
Which Battery is Best? Wenzl
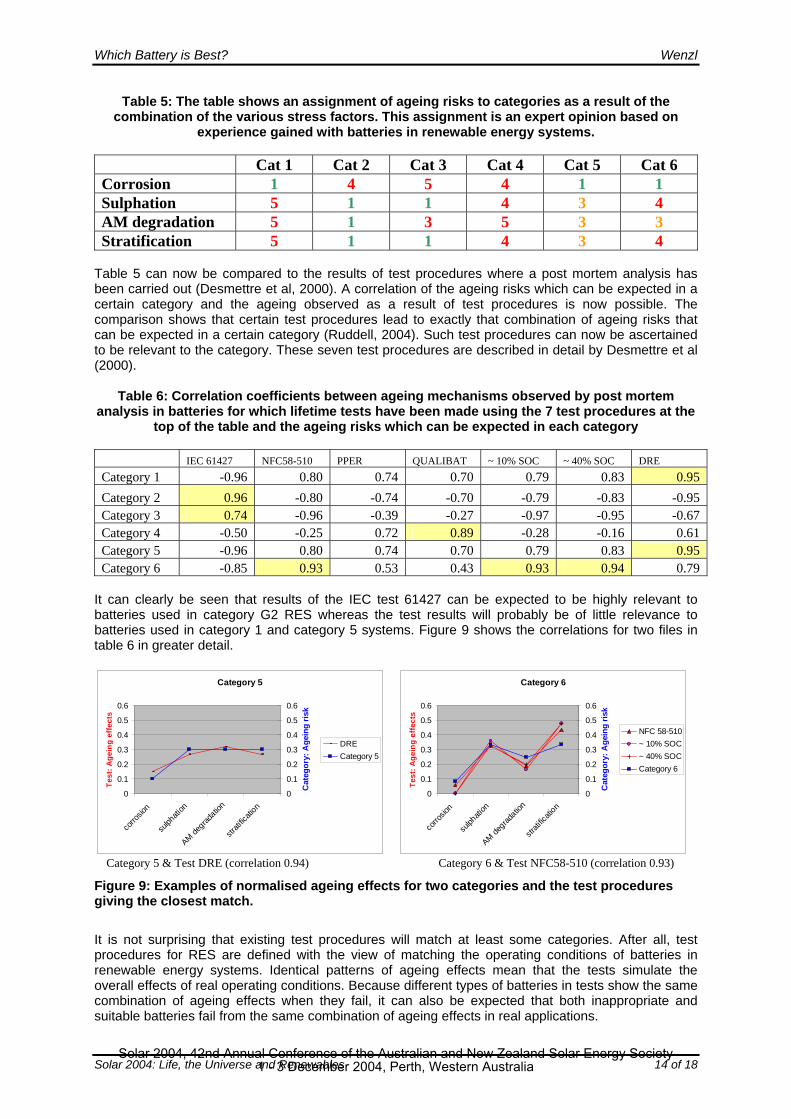
Table 5: The table shows an assignment of ageing risks to categories as a result of the combination of the various stress factors. This assignment is an expert opinion based on
experience gained with batteries in renewable energy systems. Cat 1 Cat 2 Cat 3 Cat 4 Cat 5 Cat 6 Corrosion 1 4 5 4 1 1 Sulphation 5 1 1 4 3 4 AM degradation 5 1 3 5 3 3 Stratification 5 1 1 4 3 4
Table 5 can now be compared to the results of test procedures where a post mortem analysis has been carried out (Desmettre et al, 2000). A correlation of the ageing risks which can be expected in a certain category and the ageing observed as a result of test procedures is now possible. The comparison shows that certain test procedures lead to exactly that combination of ageing risks that can be expected in a certain category (Ruddell, 2004). Such test procedures can now be ascertained to be relevant to the category. These seven test procedures are described in detail by Desmettre et al (2000).
Table 6: Correlation coefficients between ageing mechanisms observed by post mortem analysis in batteries for which lifetime tests have been made using the 7 test procedures at the
top of the table and the ageing risks which can be expected in each category
IEC 61427 NFC58-510 PPER QUALIBAT ~ 10% SOC ~ 40% SOC DRE Category 1 -0.96 0.80 0.74 0.70 0.79 0.83 0.95 Category 2 0.96 -0.80 -0.74 -0.70 -0.79 -0.83 -0.95 Category 3 0.74 -0.96 -0.39 -0.27 -0.97 -0.95 -0.67 Category 4 -0.50 -0.25 0.72 0.89 -0.28 -0.16 0.61 Category 5 -0.96 0.80 0.74 0.70 0.79 0.83 0.95 Category 6 -0.85 0.93 0.53 0.43 0.93 0.94 0.79
It can clearly be seen that results of the IEC test 61427 can be expected to be highly relevant to batteries used in category G2 RES whereas the test results will probably be of little relevance to batteries used in category 1 and category 5 systems. Figure 9 shows the correlations for two files in table 6 in greater detail.
Category 5
0
0.1
0.2
0.3
0.4
0.5
0.6
corro
sion
sulph
ation
AM degrad
ation
strati
ficati
on
Category 6
0
0.1
0.2
0.3
0.4
0.5
0.6
corro
sion
sulph
ation
AM degrad
ation
strati
ficati
on
Test
: Age
ing
effe
cts
0
0.1
0.2
0.3
0.4
0.5
0.6
Cat
egor
y: A
gein
g ris
k
DRECategory 5
Test
: Age
ing
effe
cts
0
0.1
0.2
0.3
0.4
0.5
0.6
Cat
egor
y: A
gein
g ris
k
NFC 58-510~ 10% SOC~ 40% SOCCategory 6
Category 5 & Test DRE (correlation 0.94) Category 6 & Test NFC58-510 (correlation 0.93)
Figure 9: Examples of normalised ageing effects for two categories and the test procedures giving the closest match.
It is not surprising that existing test procedures will match at least some categories. After all, test procedures for RES are defined with the view of matching the operating conditions of batteries in renewable energy systems. Identical patterns of ageing effects mean that the tests simulate the overall effects of real operating conditions. Because different types of batteries in tests show the same combination of ageing effects when they fail, it can also be expected that both inappropriate and suitable batteries fail from the same combination of ageing effects in real applications.
Solar 2004: Life, the Universe and Renewables 14 of 18 Solar 2004, 42nd Annual Conference of the Australian and New Zealand Solar Energy Society
1 - 3 December 2004, Perth, Western Australia
Which Battery is Best? Wenzl
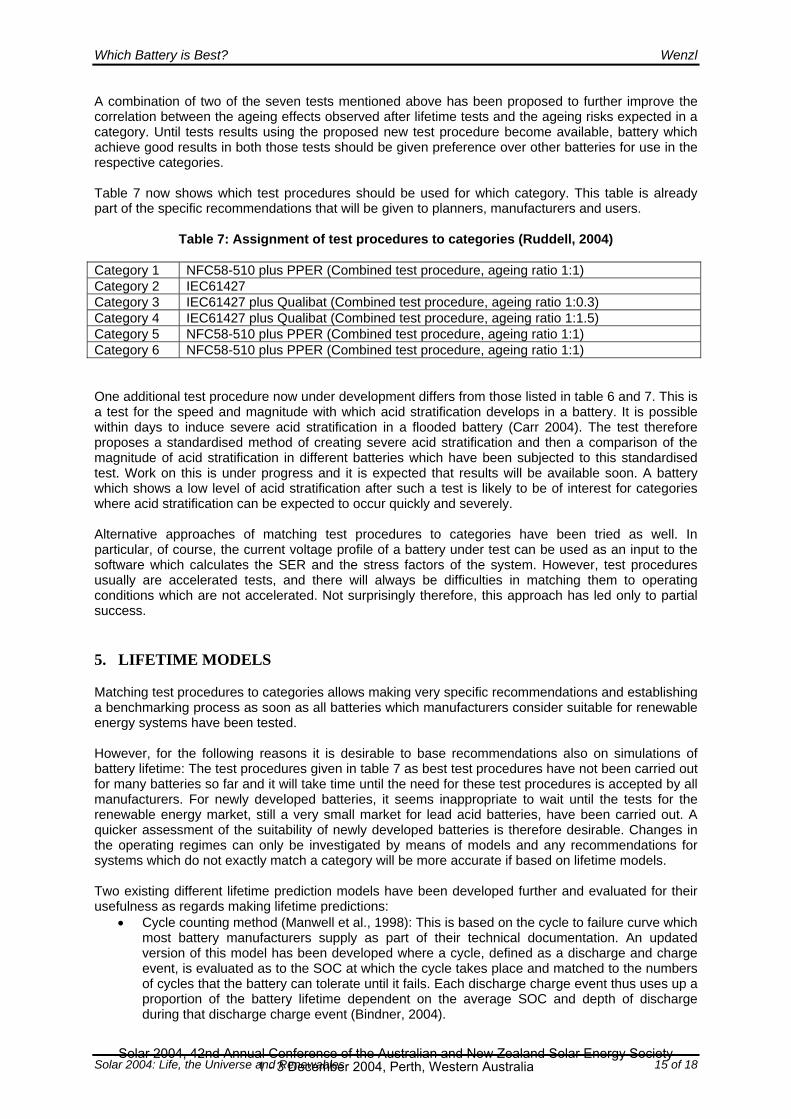
A combination of two of the seven tests mentioned above has been proposed to further improve the correlation between the ageing effects observed after lifetime tests and the ageing risks expected in a category. Until tests results using the proposed new test procedure become available, battery which achieve good results in both those tests should be given preference over other batteries for use in the respective categories. Table 7 now shows which test procedures should be used for which category. This table is already part of the specific recommendations that will be given to planners, manufacturers and users.
Table 7: Assignment of test procedures to categories (Ruddell, 2004) Category 1 NFC58-510 plus PPER (Combined test procedure, ageing ratio 1:1) Category 2 IEC61427 Category 3 IEC61427 plus Qualibat (Combined test procedure, ageing ratio 1:0.3) Category 4 IEC61427 plus Qualibat (Combined test procedure, ageing ratio 1:1.5) Category 5 NFC58-510 plus PPER (Combined test procedure, ageing ratio 1:1) Category 6 NFC58-510 plus PPER (Combined test procedure, ageing ratio 1:1) One additional test procedure now under development differs from those listed in table 6 and 7. This is a test for the speed and magnitude with which acid stratification develops in a battery. It is possible within days to induce severe acid stratification in a flooded battery (Carr 2004). The test therefore proposes a standardised method of creating severe acid stratification and then a comparison of the magnitude of acid stratification in different batteries which have been subjected to this standardised test. Work on this is under progress and it is expected that results will be available soon. A battery which shows a low level of acid stratification after such a test is likely to be of interest for categories where acid stratification can be expected to occur quickly and severely. Alternative approaches of matching test procedures to categories have been tried as well. In particular, of course, the current voltage profile of a battery under test can be used as an input to the software which calculates the SER and the stress factors of the system. However, test procedures usually are accelerated tests, and there will always be difficulties in matching them to operating conditions which are not accelerated. Not surprisingly therefore, this approach has led only to partial success.
5. LIFETIME MODELS
Matching test procedures to categories allows making very specific recommendations and establishing a benchmarking process as soon as all batteries which manufacturers consider suitable for renewable energy systems have been tested. However, for the following reasons it is desirable to base recommendations also on simulations of battery lifetime: The test procedures given in table 7 as best test procedures have not been carried out for many batteries so far and it will take time until the need for these test procedures is accepted by all manufacturers. For newly developed batteries, it seems inappropriate to wait until the tests for the renewable energy market, still a very small market for lead acid batteries, have been carried out. A quicker assessment of the suitability of newly developed batteries is therefore desirable. Changes in the operating regimes can only be investigated by means of models and any recommendations for systems which do not exactly match a category will be more accurate if based on lifetime models. Two existing different lifetime prediction models have been developed further and evaluated for their usefulness as regards making lifetime predictions:
• Cycle counting method (Manwell et al., 1998): This is based on the cycle to failure curve which most battery manufacturers supply as part of their technical documentation. An updated version of this model has been developed where a cycle, defined as a discharge and charge event, is evaluated as to the SOC at which the cycle takes place and matched to the numbers of cycles that the battery can tolerate until it fails. Each discharge charge event thus uses up a proportion of the battery lifetime dependent on the average SOC and depth of discharge during that discharge charge event (Bindner, 2004).
Solar 2004: Life, the Universe and Renewables 15 of 18 Solar 2004, 42nd Annual Conference of the Australian and New Zealand Solar Energy Society
1 - 3 December 2004, Perth, Western Australia
Which Battery is Best? Wenzl
• Weighted Ah-model (Puls und Sauer 1996): The voltage of the battery during charging and discharging is modelled using a Shepherd type voltage model. Corrosion depending on the voltage and loss of capacity as a result of Ah throughput are calculated. Two weighting factors are included in the analysis: time between full charge and maximum depth of discharge between two full charges. The first of these weighting factors can be associated with the formation of hard irreversible sulfation and the other with the formation of acid stratification.
Lifetime prediction works if the results of simulation and of lifetime tests show similar results. Although similar absolute values would of course be ideal, lifetime prediction can also be used if the order with which the lifetime is predicted is the same as the order in which the battery in a test fail. The latter seems to be the case for both models in a satisfactory manner although both miss the absolute values by a wide margin. The details of the results will soon be published (Bindner 2004). The tests used to verify the lifetime models reflect PV applications and wind applications (Mattera et al. 2003) and were carried out for two types of batteries, flooded batteries with tubular plates and flooded batteries with flat plates (Mattera 2004). These test procedures are sufficiently different from the standard tests which were used to parameterise the batteries for the models. At this stage it still seems too early to tell whether the models work sufficiently well to be used for making recommendations. Despite the inherent shortcomings of both models, they offer the best chance so far of making useful predictions in support of the detailed recommendation and the benchmarking process.
6. RECOMMENDATIONS AND BENCHMARKING PROCESS
Making recommendations and benchmarking components by means of the method described so far requires first of all an easy assignment of a category to a RES. If the stress factors are known as a result of data evaluation using ITHESA, then the assignment is straightforward by means of a table and a least square fit for sets of stress factors which are outside the categories (Nieuwenhout, 2004). However, this approach is only possible if very detailed data of RES are available and due to a lack of detailed data cannot be used for many applications. As a result, a simplified method to establishing the appropriate category has been developed which is based on a general questions which try to identify the likely range of intensity levels of stress factors that are likely to exist. These questions have been implemented by means of a web based software RESDAS (Renewable Energy Smart Design Assistant Software) which is freely available under www.ecn.nl/resdas/. Once the category is established, detailed recommendations are provided as regards the battery type, auxiliary equipment such as electrolyte circulation system, charge controller and operating regime. An obviously useful extension of this general approach is to use it in conjunction with simulation tools. To do this, however, it is necessary to obtain the current, voltage and temperature of the battery with a time step of no more than one hour. None of the simulation tools that are presently used allows this. However, a test version of the Hybrid2 software (Baring-Gould, 1996) has been created where all the required data is generated. The data has been used to create a SER, assign a category and thus receive recommendations for the renewable energy system. Further work is required to investigate and improve this further.
7. OUTLOOK
RESDAS allows access to specific recommendations based on either detailed data of the RES or a general description of the RES. As yet, the output of ITHESA has to be entered manually so that RESDAS can be started. As only a few numerical values are required this is not a real barrier of use. For using RESDAS and ITHESA for planned systems, the barriers are much higher. Firstly, only Hybrid 2 in a test version provides the information necessary to create a SER so that the system can be evaluated and recommendations can be received. The output data of the test version of Hybrid 2 can be processed in ITHESA but this requires manual handling of data. It obviously would be interesting to have a closed process whereby the output of simulation tools could be processed
Solar 2004: Life, the Universe and Renewables 16 of 18 Solar 2004, 42nd Annual Conference of the Australian and New Zealand Solar Energy Society
1 - 3 December 2004, Perth, Western Australia
Which Battery is Best? Wenzl
directly by ITHESA. The Standard Evaluation Report generated by ITHESA would enable a detailed evaluation of how the components are likely to be used and this would be in itself a useful result. An integrated planning tool requires a closed loop and iterations which lead to stable results. To achieve this, the economic assessment of components and component sizes made by some simulation tools has to be taken into account. Only then will a stable outcome of the integrated planning tool exist. Another extension of this project is the extension to other components of RES. For small wind turbines this has been done and shows that from wind data and energy output data of the wind turbine stress factors and ageing mechanisms / damage risks for wind turbines can be deduced. Although this process is as yet in need of expert evaluation, it shows that the general approach of making specific recommendations based on data evaluation and categorisation of systems can be extended (Peterschmidt 2004). It is possible that further data is required for an accurate categorisation process of other components based on stress factors and ageing mechanisms.
8. CONCLUSIONS
The analysis of RES data makes it possible to differentiate different systems architecture of RES for different applications and in different locations into categorise of similar use of the battery. In each category, the combination of stress factors is similar and therefore the ageing risks that will occur will also be similar. Batteries suitable for a particular category will withstand these ageing risks longer and their performance values will remain acceptable longer. Test procedures have been identified which are relevant to the individual categories and additional test procedures are suggested. Recommendations on a category by category basis are now possible to advise planners and users how to carry out a benchmarking process for selecting the most suitable battery. Manufacturers are provided with information concerning the requirements which exist in RES so that they can develop batteries specifically for a certain category. All recommendations are accessible via the internet and help is given to identify the category into which a particular RES falls. The overall method can also be extended to other components. The ultimate success of this method described in this paper will only be achieved once planners, manufacturers, operators, financial institutions and researchers start to use the concepts which have been introduced and continue to refine the results further. Dissemination of the results therefore was and will continue to be an important aspect of the work reported here. Extension to other critical components, wind turbines, diesel generators and inverters, and further improvement of lifetime models are important. An ongoing comparison of battery data from test results and field data is required. This is an enormous task as verification of field data requires consistent data evaluation over the whole lifetime of the system and a determination of the performance values at the beginning of installation and the time of replacement.
9. ACKNOWLEDGEMENT:
The work presented here is funded by the European Union (ENK6-CT-2001-80576), some of its member states, Australia, the United States of America and some other public and private organisations.
10. REFERENCES
Baring-Gould, E.I. "Hybrid2; The Hybrid System Simulation Model". NREL/TP-440-21272, Golden, CO: National Renewable Energy Laboratory. 1996. Baring-Gould, E.I. (2002), Deliverable D1.1 of the Benchmarking project, Specification of minimal requirement of measurement procedures, www.benchmarking.eu.org/Publications/Publications.htm Bindner, H. (2004), Deliverable D4.1 of the Benchmarking project, Lifetime prediction of batteries, www.benchmarking.eu.org/Publications/Publications.htm Carr A. (2004), Deliverable D3.3a of the Benchmarking project, Rapid test to determine the development
Solar 2004: Life, the Universe and Renewables 17 of 18 Solar 2004, 42nd Annual Conference of the Australian and New Zealand Solar Energy Society
1 - 3 December 2004, Perth, Western Australia
Which Battery is Best? Wenzl
of acid stratification in lead acid batteries, www.benchmarking.eu.org/Publications/Publications.htm Desmettre D., Mattera F., Malbranche P. and Métais S. (2000), Publishable Final Report of project "Qualibat, Investigations for a QUicker Assessment of Lifetime and other key characteristics of photovotlaic BATteries", GENEC, CEA Cadarache, F-13108 St. Paul-lez-Durance, France Manwell J. F., Rogers A., Hayman G., Avelar C. T., McGowan J.G.: "Hybrid2 – a hybrid system simulation model, Theory manual", National Renewable Energy Laboratory, Subcontract No. XL-1-11126-1-1, 1998 Mattera, F., Bach O., und Wenzl H., (2003), Deliverable D2.1 of the Benchmarking project, Mathematical tools to identify similar Standrd Evaluation Reports, www.benchmarking.eu.org/Publications /Publications.htm Mattera, F. (2004), Deliverable D4.2 of the Benchmarking project, Battery testing for verifcation of lifetime models, www.benchmarking.eu.org/Publications /Publications.htm Meissner E. (2004), Challenge to the automotive battery industry: the battery is becoming an increasingly integrated component within the vehicle electric power system, Proceedings of the 9th European Lead Battery Conference, 9ELBC, Berlin, Sept, 2004 Nieuwenhout, F., (2004), Deliverable D4.4 of the Benchmarking project, "Classificator" software to match both planned and existing RES to categories, www.benchmarking.eu.org/Publications/Publications.htm Perujo A. (2003), Deliverable D1.2a of the Benchmarking project, Standard Evaluation Report, www.benchmarking.eu.org/Publications/Publications.htm Peterschmidt N. (2004), Integrated Planning Tool for Renewable Energy Systems, Master Thesis, Institute of Electrical Engineering, Clausthal University of Technology, Germany Puls H.-G, Sauer D. U. (1996), Optimisation of Stand Alone PV System Design and Control Strategy, EuroSun '96, Freiburg, 1996 Ruddell A. (2004), Deliverable D3.2 of the Benchmarking project, Definition of test procedures for batteries used in different categories, www.benchmarking.eu.org/Publications /Publications.htm Sauer, D. U., Baechler M., Bopp G., Hoehe W., Mittermeier J., Sprau P., WIller B., Wollny M. (1997), Analysis of the performance parameters of lead/acid batteries in photovoltaic systems, J. Power Sources, 64 (1997) 197-201 Sauer, D. U., Bopp G., Baechler M., Hoehe W., Jossen A., Sprau P., WIller B., Wollny M. (1997a), What happens to Batteries in PV Systems or Do we Need one Special Battery for Solar Applications?, 14th European Photovoltaic Solar Energy Conference, Barcelona, Spain, 1997 Sauer, D. U. (2003), Electrochemical Storage for Photovoltaics, in Luque A. and Hegedus S., Editors, "Handbook of Photovoltaic Science and Engineering", ISBN: 0-471-49196-9, April 2003 Sauer, D. U., Kaiser, R., Wenzl H., Baring-Gould I., Wilmot N., Mattera F., Tselepis S., Nieuwenhout F., Rodrigues C., Perujo A., Ruddell A., Lundsager P., and Svoboda V. (2003a), Data monitoring and evaluation or renewable energy systems, in particular energy storage systems, and definition of categories of similar use IEE Powertech 2003 in Bologna, Italy, 23 – 26 June 2003 Svoboda, V. (2003), Deliverable D2.2 of the Benchmarking project, Categorisation of batteries in RES applications, www.benchmarking.eu.org/Publications/Publications.htm Svoboda, V., Wenzl H., Jossen A. (2004), Operating conditions of batteries in off-grid renewable energy systems, to be published. Svoboda V. (2004a), Deliverable D3.1 of the Benchmarking project, Definition of performance requirements for energy storage systems in each category, www.benchmarking.eu.org/Publications /Publications.htm Tselepis S. and Nickoletatos J. (2003), Deliverable D1.4 of the Benchmarking project, Survey about lifetime expectancy of components, in particular the energy storage systems in existing RES applications, http://www.benchmarking.eu.org/Publications/Publications.htm Tselepis, S., Nickoletatos I., Sauer D. U. and Wenzl H., (2004), Literature Survey about Lifetime Expectancy of Components, in particular the Energy Storage System in Existing PV Applications, 19th European PV Conference, Paris, June 2004 Wenzl H., Baring-Gould I., Kaiser R., Liaw B.Y., Lundsager P., Manwell J., Ruddell A., Svoboda V., (2004) Life Prediction OF BatterIES For Selecting the technically most suitable and cost effective battery, Proceedings of the 9th European Lead Battery Conference, 9ELBC, Berlin, Sept, 2004 and Journal of Power Sources, to be published
Solar 2004: Life, the Universe and Renewables 18 of 18 Solar 2004, 42nd Annual Conference of the Australian and New Zealand Solar Energy Society
1 - 3 December 2004, Perth, Western Australia