where does your waste go?
DESCRIPTION
Where does your waste go?. Where does your waste go?. BYU garbage truck. Where does your waste go?. BYU garbage truck. Drives to Springville (10 miles). Dumps. Where does your waste go?. BYU garbage truck. Drives to Springville (5 miles). Dumps. Reloaded. Driven 25 miles to landfill. - PowerPoint PPT PresentationTRANSCRIPT
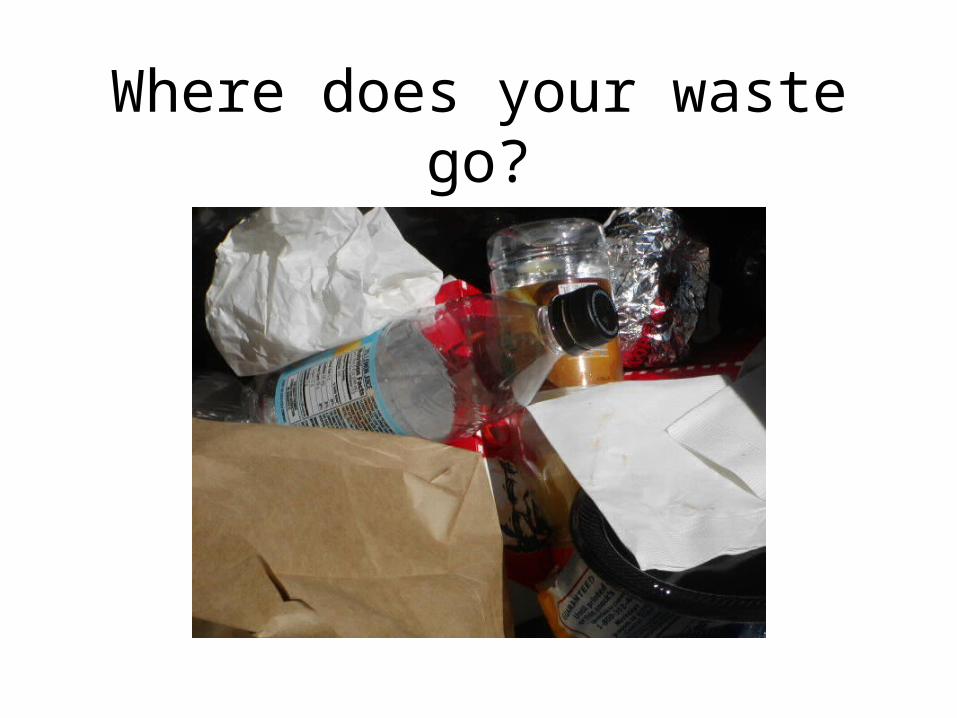
Where does your waste go?

Where does your waste go?
• BYU garbage truck.

Where does your waste go?
• BYU garbage truck.• Drives to Springville
(10 miles). Dumps.

Where does your waste go?
• BYU garbage truck.• Drives to Springville
(5 miles). Dumps.• Reloaded. Driven 25
miles to landfill.

Where does your waste go?
• BYU garbage truck.• Drives to Springville
(5 miles). Dumps.• Reloaded. Driven 25
to landfill.• Pushed into piles.

Where does your waste go?
• BYU garbage truck.• Drives to Springville
(5 miles). Dumps.• Reloaded. Driven 25
to landfill.• Pushed into piles.• Covered with dirt.

What happens to the paperyou put in a BYU recycling bin?

What happens to the paperyou put in a BYU recycling bin?
• We collect the paper

What happens to the paperyou put in a BYU recycling bin?
• We collect the paper
• Make sure it is sorted

What happens to the paperyou put in a BYU recycling bin?
• We collect the paper
• Make sure it is sorted
• Bale the paper

What happens to the paperyou put in a BYU recycling bin?
• We collect the paper
• Make sure it is sorted
• Bale the paper
• Ship it by the truck load to a paper mill

What happens to the paperyou put in a BYU recycling bin?
• We collect the paper• Make sure it is sorted• Bale the paper• Ship it by the truck load to
a paper mill
Annually BYU recycles over• 100 tons of junk mail• 400 tons of newspaper• 1,300 total tons of paper

Why don’t we have recycling in Provo?
We do!

Recycling in ProvoPaper Drop-offs
Newspaper only• Supermarkets
– Smith’s (300 N 200 W)
– Allen’s (600 E 300 S)
• Movies 8 (Univ. Parkway) • Kiwanis Park (950 N 1100 E)
• Glenwood Apartments

Recycling in ProvoPaper Drop-offs
All types of paper
Elementary Schools• Wasatch (900 E 1000 N)
• Jouaqin (500 N 500 E)
• Provost (630 S 900 E)

Recycling in ProvoGreen Waste Drop-off
Takes: • grass clippings• leaves• branchesNo stumpsNo large tree trunks
Free to Provo residentsLocated in East Bay
(1400 S Industrial Pkwy – approx 1400 S 650 E)

Recycling in ProvoCurbside Recycling
Green bins take:
• Grass
• Leaves
• Branches
As of May 2004 there were 2200 green bins in Provo. Cost is $4 per month.

Recycling in ProvoCurbside Recycling
Christmas trees are picked up curbside throughout the city during last week in December and the first week of January

Recycling in ProvoCurbside Recycling
Blue bins take:• Paper• Plastic (#1 and #2)• MetalBut NOT glass
As of May 2004 there were 1700 blue bins in Provo. Cost is $5 per month.

Recycling in ProvoResults
• The yard waste program diverts 7,000 tons per year from the landfill– 5,800 tons from drop-off – 1,200 tons from curbside pick-up
• Household recycling (blue cans) divert 54 tons per month (650 tons per year)
• Provo City landfills about 2,000 tons per month (approximately 24,000 tons per year)

What happens tocurbside recycling?

Curbside Recycling
• It gets delivered to a sorting facility

Curbside Recycling
• It gets delivered to a sorting facility.
• Then dumped into a big pile.

Curbside Recycling
• It gets delivered to a sorting facility.
• Then dumped into a big pile.
• Sorted by hand from a conveyor belt.

Curbside Recycling
• It gets delivered to a sorting facility.
• Then dumped into a big pile.
• Sorted by hand from a conveyor belt.
• Pushed into piles.

Curbside Recycling
• It gets delivered to a sorting facility.
• Then dumped into a big pile.
• Sorted by hand from a conveyor belt.
• Pushed into piles.
• Stacked in bales.

Curbside Recycling
• It gets delivered to a sorting facility.
• Then dumped into a big pile.
• Sorted by hand from a conveyor belt.
• Pushed into piles.
• Stacked in bales.
• And then shipped to a paper making plant.

Waste Economics
How to figure the cost of recycling?
Does recycling have to make a profit or does it just need to cost less than garbage
collection and disposal?

Waste Economics - Garbage
1. Waste placed in trash can
2. Custodian collects and puts in dumpster – cost of custodian
3. Garbage truck picks up – cost of truck operation ($100/hr)
4. Drives 10 miles to transfer station – cost of truck operation
5. Garbage dumped and repacked on larger truck – cost of “tipping” ($27 per ton here)
6. Garbage driven 25 miles to landfill – cost of truck operation
7. Garbage buried – cost of land use

Waste Economics - Recycling
1. Paper put in recycling bin2. Custodian collects – cost of custodian3. Recycling truck picks up – cost of truck operation4. Drives 2 miles to BYU recycling facility – cost of truck
operation5. Paper is dumped, sorted and baled – cost of sorting6. Paper is sold and shipped to paper mills on west coast or
overseas – revenue from paper, savings of not paying to put in landfill, cost of shipping
7. Made into new paper – how does cost of recycled paper compare to cost of cutting trees down for paper?

Generation of Municipal Solid Waste in the United States
• If Provo City puts 24,000 tons of garbage per year in the landfill, and
• BYU puts 4,000 tons of garbage per year in the landfill, and
• Private waste haulers add more from what they pick up at apartments
• Then how much waste is generated and put in landfills each year?

Municipal Solid Waste in US(Pounds per person per day)
1960 2001
Generation 2.68 4.41
Recycling 0.17 0.99
Composting 0.00 0.32
Discards 2.51 3.10
Population 180 million 285 million

Waste Producedpounds per person each day
1st = Lowest South Dakota 3.73 pounds/day
2nd Idaho 4.44
12th Utah 5.86
42nd California 8.49
47th = Highest Kansas 9.48 National Avgerage 7.18

Waste Recycledpounds per person each day
47th = Lowest Mississippi 0.02 pounds/day
42nd Utah 0.28
40th Idaho 0.37
2nd Oregon 3.10
1st = Highest California 3.41National Average 1.92

Waste Landfilledpounds per person each day
1st = Lowest Maine 0.97 pounds/day
16th Idaho 4.07
25th California 4.93
30th Utah 5.30
47th = Highest Kansas 8.39 National Average 4.71

Lowest Landfilling States
Landfilled Recycled Burned
Maine 17% 49% 33%
Minnesota 29% 46% 25%
Massachusetts 31% 31% 38%
Connecticut 36% 19% 45%
Oregon 46% 49% 5%
Utah (36th) 90% 5% 5%National Average 65% 27% 8%

Waste Incineratedpounds per person each day
1st = Lowest Idaho and 20 other states
0.00 pounds/day
26th California 0.14
29th Utah 0.29
45th Maine 1.91
47th = Highest Connecticut 3.38 National Average 0.55
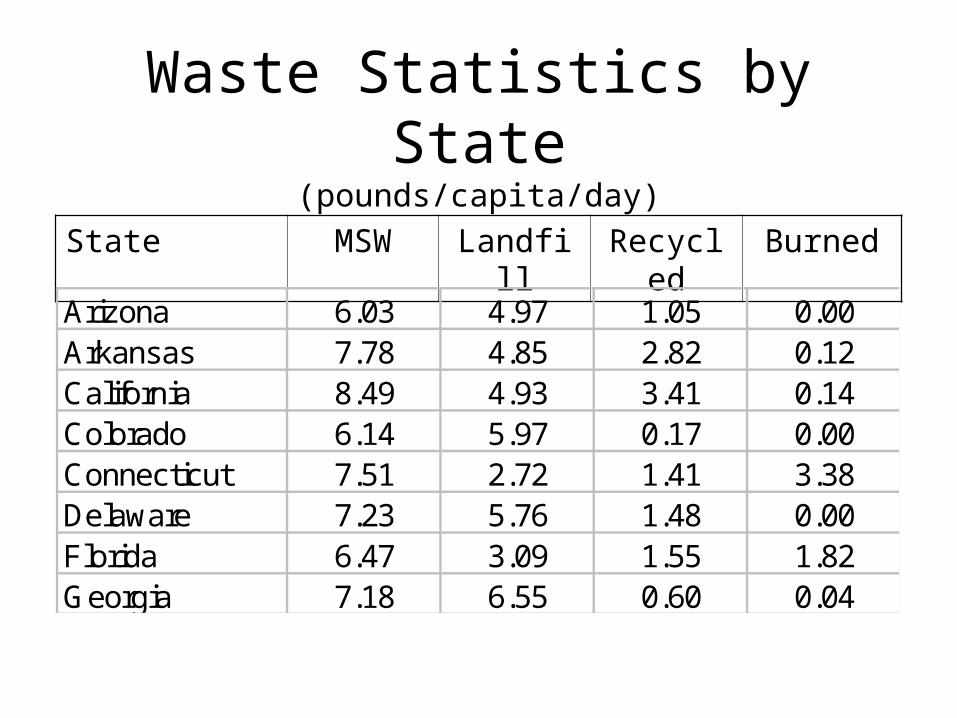
Waste Statistics by State(pounds/capita/day)
State MSW Landfill Recycled Burned
Arizona 6.03 4.97 1.05 0.00Arkansas 7.78 4.85 2.82 0.12California 8.49 4.93 3.41 0.14Colorado 6.14 5.97 0.17 0.00Connecticut 7.51 2.72 1.41 3.38Delaware 7.23 5.76 1.48 0.00Florida 6.47 3.09 1.55 1.82Georgia 7.18 6.55 0.60 0.04

Waste Statistics by State(pounds/capita/day)
State MSW Landfill Recycled Burned
Hawaii 7.51 3.78 1.89 1.83Idaho 4.44 4.07 0.37 0.00Illinois 6.96 4.70 2.26 0.00Indiana 8.49 4.93 2.97 0.59Iowa 6.36 3.64 2.65 0.06Kansas 9.48 8.39 1.09 0.00Kentucky 7.34 6.50 0.84 0.00Louisiana 6.03 5.54 0.49 0.00

Waste Statistics by State(pounds/capita/day)
State MSW Landfill Recycled Burned
Maine 5.64 0.97 2.77 1.91Maryland 8.93 4.89 2.61 1.43Massachusetts 7.07 2.21 2.20 2.66Michigan 9.21 7.17 1.39 0.64Minnesota 5.48 1.61 2.50 1.38Mississippi 5.59 5.57 0.02 0.00Montana 7.01 4.26 2.73 0.02Nebraska 7.62 6.44 1.17 0.00

Waste Statistics by State(pounds/capita/day)
State MSW Landfill Recycled Burned
Nevada 8.49 7.15 1.34 0.00New Hampshire 5.21 3.09 1.23 0.88New Jersey 6.74 3.58 2.55 0.61New Mexico 6.19 5.79 0.40 0.00New York 7.07 3.75 2.11 1.21North Carolina 5.92 5.18 0.65 0.08North Dakota 5.53 5.01 0.52 0.00Ohio 7.78 5.95 1.83 0.00

Waste Statistics by State(pounds/capita/day)
State MSW Landfill Recycled Burned
Oklahoma 7.01 6.94 0.07 0.00Oregon 6.36 2.94 3.10 0.31Pennsylvania 5.64 3.20 1.51 0.93Rhode Island 6.41 5.59 0.82 0.00South Carolina 7.95 5.38 2.26 0.31South Dakota 3.73 3.61 0.11 0.00Tennessee 6.96 4.98 1.84 0.14Texas 7.18 5.39 1.79 0.00

Waste Statistics by State(pounds/capita/day)
State MSW Landfill Recycled Burned
Utah 5.86 5.30 0.28 0.29Vermont 5.42 3.30 1.62 0.50Virginia 8.16 4.18 2.38 1.62Washington 7.84 4.72 2.67 0.44West Virginia 5.32 4.95 0.37 0.00Wisconsin 5.64 4.06 1.39 0.19Wyoming 7.62 7.49 0.13 0.00Nat. Avg. 7.18 4.71 1.92 0.55

Composition of Municipal Solid Waste(before recycling)
Paper 35.7%
Yard trimmings 12.2%
Food scraps 11.4%
Plastics 11.1%
Metals 7.9%
Clothing 7.1%
Glass 5.5%

2001 US Recycling RatesMaterial Recycling
Percentage
Newspaper 60%
Yard Waste 57%
Office paper 55%
Aluminum cans 49%
Junk mail 32%
Glass containers 22%
Plastics containers 10%
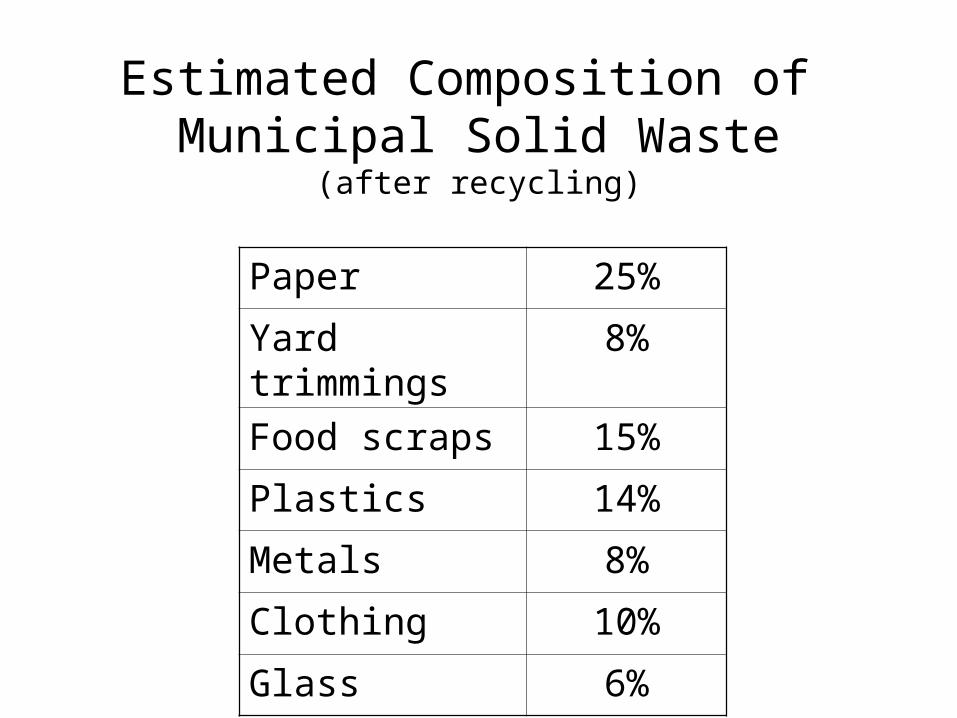
Estimated Composition of Municipal Solid Waste
(after recycling)
Paper 25%
Yard trimmings 8%
Food scraps 15%
Plastics 14%
Metals 8%
Clothing 10%
Glass 6%

Where do we go from here?
What options do we have?

Where do we go from here?Make no changes?
• In 1988 the US had 7,924 landfills (dumps)• In 2001 the US had 1,858 landfills• “At the national level, capacity does not
appear to be a problem, although regional dislocations sometimes occur.” (EPA)
• The landfill for the southern half of Utah County has approximately 75 years worth of space left.

Where do we go from here?Make no changes?
March 2001: Spanish Fork residents began battling a developer and the city when it was discovered that asbestos, contaminated water and potentially explosive concentrations of methane gas were detected under and around their homes sitting atop the former county landfill. The homes were two years old.
April 2002: Ten homes were moved to a neighboring subdivision.
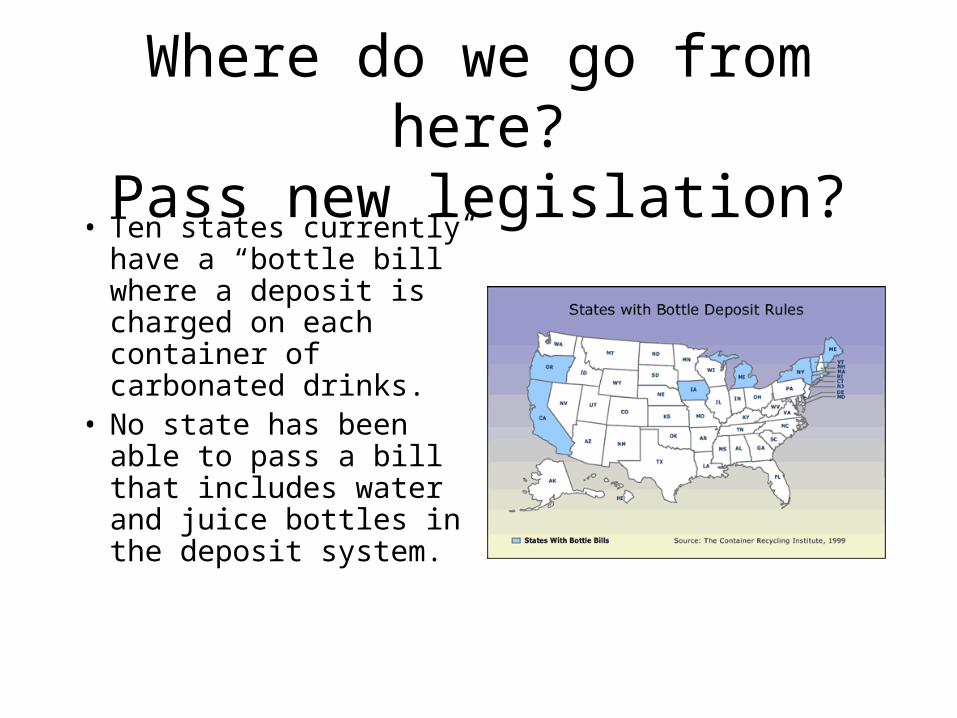
Where do we go from here?Pass new legislation?
• Ten states currently have a “bottle bill” where a deposit is charged on each container of carbonated drinks.
• No state has been able to pass a bill that includes water and juice bottles in the deposit system.
Where do we go from here?Pass new legislation?
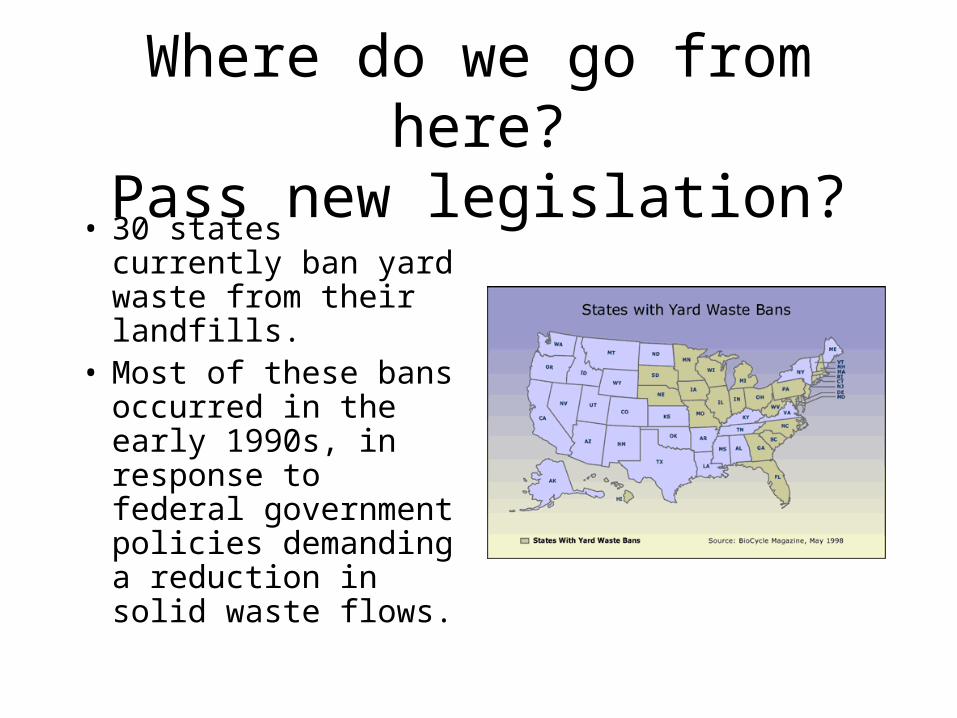
• 30 states currently ban yard waste from their landfills.
• Most of these bans occurred in the early 1990s, in response to federal government policies demanding a reduction in solid waste flows.

Where do we go from here?Lead by Example?
• Tear-A-Part Auto Recycling in Salt Lake sells salvaged auto parts but also recycles car fluids (gas, anti-freeze, etc.) and gives them away to their customers.
• They also voluntarily remove and recycle mercury switches which are a significant pollutant when left in cars.

Where do we go from here?Research and Development?
• New technology may make plastic sorting unnecessary– ReSyk, a Utah
company with ties to BYU, has developed a process to recycle mixed plastic.

What is your stewardship?

What is your stewardship?
Doctrine and Covenants 104: 13-17For it is expedient that I, the Lord, should make every man accountable,
as a steward over earthly blessings, which I have made and prepared for my creatures.
I, the Lord, stretched out the heavens, and built the earth, my very handiwork; and all things therein are mine.
And it is my purpose to provide for my saints, for all things are mine.But it must needs be done in mine own way; and behold this is the way
that I, the Lord, have decreed to provide for my saints, that the poor shall be exalted, in that the rich are made low.
For the earth is full, and there is enough and to spare; yea, I prepared all things, and have given unto the children of men to be agents unto themselves.
