where did all the growth go? external shocks, social
TRANSCRIPT

Journal of Economic Growth, 4: 385–412 (December 1999)c© 1999 Kluwer Academic Publishers, Boston.
Where Did All the Growth Go?External Shocks, Social Conflict, and GrowthCollapses
DANI RODRIK
John F. Kennedy School of Government, Harvard University, Cambridge, MA 02138
This article argues that domestic social conflicts are a key to understanding why growth rates lack persistenceand why so many countries have experienced a growth collapse since the mid-1970s. It emphasizes, in particular,the manner in which social conflicts interact with external shock on the one hand, and the domestic institutionsof conflict-management on the other. Econometric evidence provides support for this hypothesis. Countries thatexperienced the sharpest drops in growth after 1975 were those with divided societies (as measured by indicatorsof inequality, ethnic fragmentation, and the like) and with weak institutions of conflict management (proxied byindicators of the quality of governmental institutions, rule of law, democratic rights, and social safety nets).
Keywords:economic growth, social conflict, political economy
JEL classification: O4
1. Introduction
This article is motivated by several related puzzles in the comparative experience witheconomic growth. First, what accounts for the instability in economic performance that hascharacterized most developing countries over the last few decades? Second, why did somany countries that grew at satisfactory rates during the 1960s and 1970s, mostly in LatinAmerica and the Middle East, do so badly thereafter? Third, why were some countrieshardly affected by the volatility in their external environment during the second half of the1970s while others suffered extensively for a decade or more before starting to recover?Finally, why do external shocks often cripple economic performance to an extent that isvastly disproportionate to the direct economic consequences of these shocks?
The hypothesis advanced in this article is that domestic social conflicts are a key tounderstanding these phenomena. I emphasize, in particular, the manner in which socialconflicts interact with external shocks on the one hand and the domestic institutions ofconflict management on the other. These interactions play a central role in determiningthe persistence of a country’s economic growth, its response to volatility in the externalenvironment, and the magnitude of the growth collapse following a negative shock. Whensocial divisions run deep and the institutions of conflict management are weak, the economiccosts of exogenous shocks—such as deteriorations in the terms of trade—are magnified bythe distributional conflicts that are triggered. Such conflicts diminish the productivitywith which a society’s resources are utilized in a number of ways: by delaying needed

386 RODRIK
adjustments in fiscal policies and key relative prices (such as the real exchange rate or realwages), by generating uncertainty in the economic environment, and by diverting activitiesfrom the productive sphere to the redistributive one.
To fix ideas, think of an economy that is suddenly and unexpectedly confronted with adrop in the price of its main export. The textbook prescription for this economy is a com-bination of expenditure-switching and expenditure-reducing policies—a devaluation andfiscal retrenchment. But the precise manner in which these policy changes are administeredcan have significant distributional implications. Should the devaluation be accompanied bywage controls? Should import tariffs be raised? Should the fiscal retrenchment take placethrough spending cuts or tax increases? If spending is to be cut, which types of expenditureshould bear the brunt of the cuts?
Because each of these options had distributional consequences, in practice much dependson the severity of the social conflicts that lie beneath the surface. If the appropriate policychanges can be undertaken without upsetting prevailing social bargains and causing anoutbreak of distributional conflict, the shock can be managed with no long-lasting effectson the economy. If they cannot, the economy can by paralyzed for years as inadequateadjustment condemns the country to foreign-exchange bottlenecks, import compression,debt crises, and bouts of high inflation.
The core idea in this article is that the effect of external shocks on growth is largerthe greater the latent social conflicts in an economy and the weaker its institutions ofconflict management. From the standpoint of empirical analysis, the main difficulty is tooperationalize these concepts. External shocks are relatively easy to quantify. But latentsocial conflict and institutions of conflict management are considerably more problematic.
I use the termlatent social conflictto indicate the depth of preexisting social cleavages ina society, along the lines of wealth, ethnic identity, geographical region, or other divisions.I proxy for this term by using measures of inequality, ethnic and linguistic fragmentation,and social trust. Byinstitutions of conflict management, I understand institutions thatadjudicate distributional contests within a framework of rules and accepted procedures—that is, without open conflict and hostilities. Democratic institutions, an independent andeffective judiciary, an honest and noncorrupt bureaucracy, and institutionalized modes ofsocial insurances are among the most significant of conflict-management institutions. Iproxy for the strength of such institutions by using measures of civil liberties and politicalrights, the quality of governmental institutions, the rule of law, competitiveness of politicalparticipation, and public spending on social insurance.
My empirical analysis focuses on the differences in rates of economic growth between1960 to 1975 and 1975 to 1989.1 The 1970s were an exceptionally turbulent time for theworld economy, and therefore 1975 presents an appropriate midpoint for testing these ideas.The bottom line is that my framework contributes to an understanding of the growth col-lapse that was the common fate of so many countries in the latter period. Countries thatexperienced the sharpest drops in GDP growth after 1975 were those with divided societiesand weak institutions of conflict management. The severity of the external shocks them-selves is distinctly secondary as a determinant of cross-country differences in growth acrossperiods. Furthermore, once latent social conflict and the quality of conflict-managementinstitutions are controlled, I find that various measures of government policy at the outset

EXTERNAL SHOCKS, SOCIAL CONFLICT, AND GROWTH COLLAPSES 387
of the crisis, such as trade policies, debt-export ratios, or government consumption levels,contribute practically nothing to explaining the growth differential across periods. The ev-idence suggests that social conflict has played a role primarily by inducingmacroeconomicmismanagement.
The outline of the article is as follows. I begin with a background discussion expandingon the puzzles noted above. Next, I sketch a simple model that clarifies the interactionsamong shocks, domestic conflict, and institutions of conflict management that were brieflydiscussed above. The rest of the article is devoted to the presentation of the empiricalevidence.
2. Background
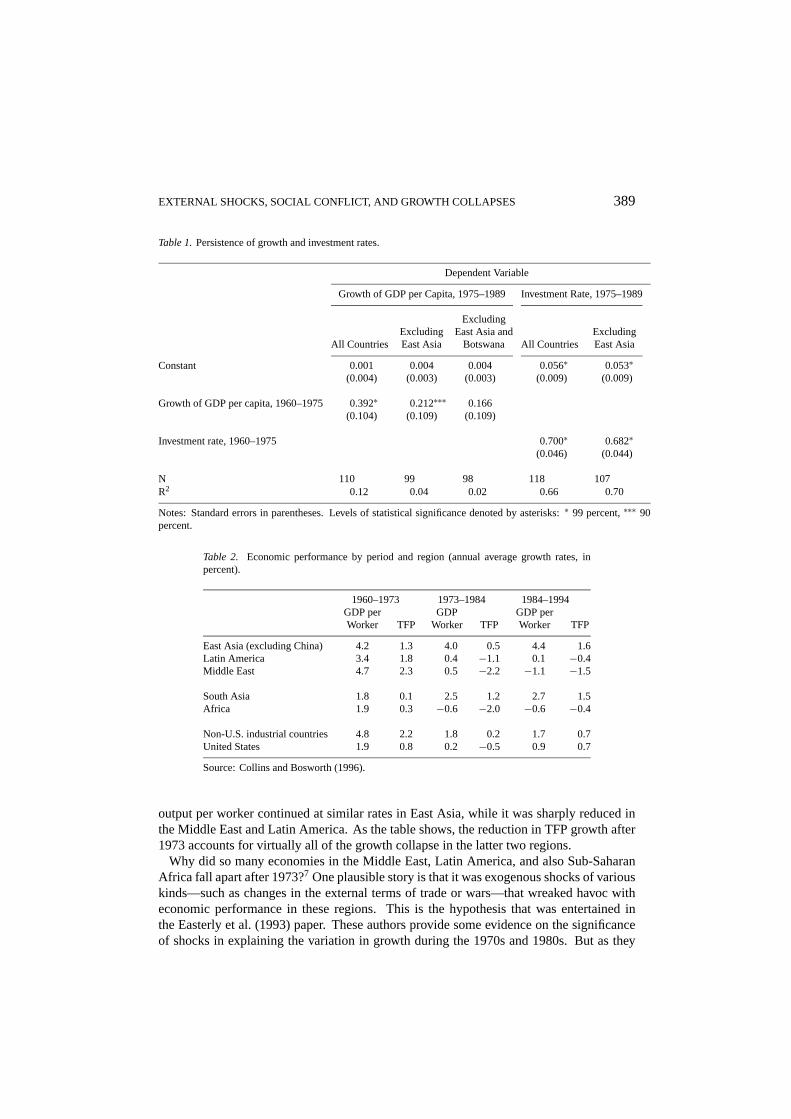
In a well-known paper, which has spawned surprisingly little further work, Easterly, Kremer,Pritchett, and Summers (1993) were the first to point out the puzzle that economic growthvaries considerably decade by decade, while country characteristics and policy configura-tions are quite persistent. Easterly et al. focused mostly on the decades of the 1960s, 1970s,and 1980s, but the same point can be made by comparing growth rates over the two periods1960 to 1975 and 1975 to 1989. As shown in Figure 1, growth during the first of thesetwo periods was a very poor predictor of growth during the subsequent period. Regressinggrowth in 1975 to 19892 on growth in 1960 to 1975 and a constant term yields an R2 of only0.12 (and a coefficient on lagged growth of 0.39; see Table 1).3 The point becomes evenmore dramatic when East Asian countries are excluded from the sample (see Figure 1B): inthis case, the R2 of the regression shrinks to 0.04 (and the coefficient on lagged growth fallsto 0.21). If one other country—Botswana—is also excluded from the sample, the coefficienton lagged growth is no longer statistically significant at any conventionally accepted levelof confidence. As Easterly et al. point out, the notion that countries can be neatly separatedinto high-, medium-, and low-growth groups over the longer term is an illusion created bysustained high growth in a small sample of mostly East Asian countries.4
By contrast, investment rates tend to be significantly more persistent over time. Figure 2displays the analogous scatter plots for investment during the two subperiods. WhetherEast Asia is excluded from the sample or not, investment in the first period is very stronglycorrelated with investment in the subsequent period. The R2’s are of the order of 0.65 to0.70 (compared to 0.04 to 0.12 before), and the point estimate on lagged investment is morethan three times larger than in the case of the lagged coefficient for growth (see Table 1).Whatever it is that drives the variation in growth rates over shorter horizons, it is not thevariation in investment.5 What seems to vary considerably over time is theproductivitywithwhich a society’s resources are utilized.
Consider more specifically the changing fortunes of Latin America, the Middle East, andEast Asia over the period in question. Table 2, adapted from Collins and Bosworth (1996),shows regional averages in growth rates of GDP per worker and of total factor productivity(TFP) for the three subperiods 1960 to 1973, 1973 to 1984, and 1984 to 1994. We note thatduring the early period of 1960 to 1973, economic performance in Latin America and theMiddle East was on average not only comparable to that in East Asia but actually superiorin some respects. The Middle Eastern countries in the sample6 had higher rates of labor

388 RODRIK
Figure 1. Per-capita GDP growth, 1960 to 1975 and 1975 to 1989, all countries and excluding East Asia.
and total-factor-productivity growth than the East Asian tigers. Latin America similarlysurpassed East Asia in the TFP performance. The reputation of the East Asian miraclerests entirely on the fact that productivity growth—and hence output growth—collapsedin the Middle East and Latin America after 1973 but not in East Asia. The growth of
EXTERNAL SHOCKS, SOCIAL CONFLICT, AND GROWTH COLLAPSES 389
Table 1.Persistence of growth and investment rates.
Dependent Variable
Growth of GDP per Capita, 1975–1989 Investment Rate, 1975–1989
ExcludingExcluding East Asia and Excluding
All Countries East Asia Botswana All Countries East Asia
Constant 0.001 0.004 0.004 0.056∗ 0.053∗(0.004) (0.003) (0.003) (0.009) (0.009)
Growth of GDP per capita, 1960–1975 0.392∗ 0.212∗∗∗ 0.166(0.104) (0.109) (0.109)
Investment rate, 1960–1975 0.700∗ 0.682∗(0.046) (0.044)
N 110 99 98 118 107R2 0.12 0.04 0.02 0.66 0.70
Notes: Standard errors in parentheses. Levels of statistical significance denoted by asterisks:∗ 99 percent,∗∗∗ 90percent.
Table 2. Economic performance by period and region (annual average growth rates, inpercent).
1960–1973 1973–1984 1984–1994GDP per GDP GDP perWorker TFP Worker TFP Worker TFP
East Asia (excluding China) 4.2 1.3 4.0 0.5 4.4 1.6Latin America 3.4 1.8 0.4 −1.1 0.1 −0.4Middle East 4.7 2.3 0.5 −2.2 −1.1 −1.5
South Asia 1.8 0.1 2.5 1.2 2.7 1.5Africa 1.9 0.3 −0.6 −2.0 −0.6 −0.4
Non-U.S. industrial countries 4.8 2.2 1.8 0.2 1.7 0.7United States 1.9 0.8 0.2 −0.5 0.9 0.7
Source: Collins and Bosworth (1996).
output per worker continued at similar rates in East Asia, while it was sharply reduced inthe Middle East and Latin America. As the table shows, the reduction in TFP growth after1973 accounts for virtually all of the growth collapse in the latter two regions.
Why did so many economies in the Middle East, Latin America, and also Sub-SaharanAfrica fall apart after 1973?7 One plausible story is that it was exogenous shocks of variouskinds—such as changes in the external terms of trade or wars—that wreaked havoc witheconomic performance in these regions. This is the hypothesis that was entertained inthe Easterly et al. (1993) paper. These authors provide some evidence on the significanceof shocks in explaining the variation in growth during the 1970s and 1980s. But as they

390 RODRIK
Figure 2. Investment ratios, 1960 to 1975 and 1975 to 1989, all countries and excluding East Asia.
acknowledge, this cannot be the full story. First, the additional explanatory power that comesfrom introducing measures of shocks into their regression is modest (with partial R2’s forshock variables of 0.14 to 0.15). Second, the estimated coefficient on their most significantshock variable—the change in the terms of the trade—is implausibly large. According tothe Easterly et al. regressions, an unfavorable terms-of-trade shock amounting to 1 percent

EXTERNAL SHOCKS, SOCIAL CONFLICT, AND GROWTH COLLAPSES 391
Table 3.Experience of three countries with external shocks (annual averages, in percent).
Income LossChange in Share of Total Due to Growth of Growth of
the Terms of Trade in Changes in per-Capita per-CapitaTrade, 1970– GDP, 1970– the Terms of GDP, 1960– GDP, 1975–
1979 1979 Trade 1975 1989
South Korea −1.4 57.2 −0.51 6.5 7.0Turkey −6.2 17.3 −0.41 3.8 1.2Brazil −2.3 16.6 −0.25 4.6 1.3
of GDP per annum is associated with a reduction in the growth rate of 0.85 percentagepoints per annum. This is too large, as Easterly et al. note, considering that changes in theterms of trade have no direct effect on the quantum of output (real GDP). It is too largeeven when Keynesian and other channels are taken into account (see Easterly et al., 1993,pp. 471–472).
Looking at the experience of individual countries, it becomes clear why external shocksalone cannot account for the different paths taken after the mid-1970s. Many of the EastAsian countries were hit with external shocks that were of comparable magnitude to thoseexperienced in Latin America, if not even stronger. Compare, for example, South Korea toBrazil and Turkey. As Table 3 shows, Korea was hit harder by the changes in world pricesduring the 1970s than either of the other two economies. This is largely because tradeconstitutes a much lager share of national income in Korea. The income loss associatedwith a rise in the price of imported oil is correspondingly larger in Korea than in Brazil orTurkey. Yet Korea grew even faster after 1975, while Turkey and Brazil both experiencedan economic collapse.
At one level, it is not a great mystery why these experiences differ. Consider the experienceof these three countries.
The South Korean government undertook a textbook adjustment in 1980 as soon as signs ofa payments imbalance appeared. There was a devaluation, a tightening of monetary policy,and a program aimed at increasing energy efficiency in the economy. The result was a singleyear or sharp recession (exacerbated by a poor harvest and political strife) and moderateinflation. Growth picked up very quickly thereafter, to the point that Korea’s growth trendwas completely unaffected by the events of 1980 (see Aghevli and Marquez-Ruarte, 1985).
The Turkish response was quite different. A populist government reacted to the growingcurrent-account deficit in the mid-1970s by going on an unsustainable external-borrowingbinge. Once foreign bank loans dried up in 1977 to 1978 as a result of concerns aboutrepayment capacity, fiscal and exchange-rate adjustments were delayed. Between 1978and 1980, inflation rose, and the economy went into a tailspin. Some semblance of macroe-conomic balance was restored in 1980 but with huge distributional consequences broughtabout by changes in key relative prices (the real exchange rate, real wages, and the rural-urban terms of trade). These relative-price changes had the effect of transferring incomefrom farmers and workers to the public sector (see Celasun and Rodrik, 1989), and weregreatly facilitated by military rule during 1980 to 1983. These distributional shifts have

392 RODRIK
created a legacy of macroeconomic cycles in Turkey, with real wages going through periodof recovery followed by bust. Largely due to this legacy of instability, inflation has remain-ing high since the early 1980s, and the Turkish economy has underperformed relative to itspotential.
In Brazil, widespread indexation prevented an adjustment in relative prices of the kindthat eventually took place in Turkey. Even withoutformal indexation, strategic interactionamong social groups resulting in wage-price rigidities appears to have made orthodoxadjustment policies of demand restraint extremely costly in terms of output (Simonsen,1988). Consequently, fiscal and monetary restraint was tried only half-heartedly. Theresult was a succession of high-inflation plateaus: inflation jumped from 50 percent peryear to 100 percent in 1979, 200 percent in 1983, 400 percent in 1987, 1,000 percent in1988, and more than 2,000 percent in 1990. Each failed stabilization resulted in higherinflation rates than previously, until thereal plan of 1994 finally brought price stability.
These country vignettes underscore the importance of the way in which different societiesreact to external shocks. In Korea, adjustment was swift and somehow nonpoliticized. InTurkey, adjustment was delayed, and when it eventually took place, it was undertaken in amanner that imposed disproportionate costs on certain segments of society, undercutting thesustainability of macro balances in the longer run. In Brazil, strategic competition amongdifferent social groups gave prices a life of their own and rendered traditional remedies forexcess demand costly and ineffective. The latter two economies were still paying the priceof inadequate adjustment in the late 1980s, long after shocks of the 1970s had reversedthemselves. In short, social conflicts and their management—whether successful or not—appear to have played a key role in transmitting the effects of external shocks to economicperformance.
3. Social Conflict as Coordination Failure
Motivated by the experiences of Turkey, Brazil, and many other similar cases, we can viewsocial conflict as arising from a coordination failure among social groups. For concreteness,think of two groups that act independently and face a shrinking pie as a result of an externalshock. Let us normalize the preexisting level of resources in the economy to unity andassume that these resources were initially split evenly between the two groups. The externalshock reduces the economy’s resources to 1− 1. Each group must subsequently decidebetween one of two strategies. The “cooperative” strategy consists of scaling down thegroup’s demand in proportion to the lost income—that is, to claim only 1/2(1 − 1).Alternatively, each group can choose to “fight” by holding onto its previous stake of 1/2.
Unless both groups choose to cooperate, the available resources will fall short of thedemands made by the groups. This triggers social conflict, with the result that the economy’sperformance suffers, and the costs of the shock are magnified. One can think, for example,of the damage done to economic activity by macroeconomic instability and delayed fiscaland exchange-rate adjustments. With the onset of social conflict, the size of the pie shrinksfurther to 1− 1 − K . Note that while noncooperative behavior is inefficient, it leavesopen the possibility that the recalcitrant group will end up with a larger slice of a smallerpie.

EXTERNAL SHOCKS, SOCIAL CONFLICT, AND GROWTH COLLAPSES 393
When will the two groups not agree and choose to inflict the extra cost on the economy?Two types of considerations come into play in answering this question. First, the groupsare less likely to cooperate when it is difficult to coordinate on a “fair” distribution ofresources. This will be the case in societies that are highly polarized—where, using myterminology, latent social conflict is high.8 Second, the noncooperative strategy will appearmore appealing when the potential return to unilateral action is high—that is, when itis possible to exclude other groups from the pie. This possibility is most salient whenthe society’s institutions of conflict management are weak—when the rule of law does notprevent an opportunistic grab for resources, for example, or when civil and political libertiesare too fragile to protect the interests of minorities, the disenfranchised, and those withoutpolitical connections.
One could parameterize latent social conflict in a model of this kind by the priors held byeach group regarding how cooperative its rival will be. When social divisions run deep, therewill be greater suspicion about others’ motives, and a higher probability will be attached toopportunistic action by the rival group. The strength of conflict-management institutions,on the other hand, can be captured by the degree to which potential inequalities arisingfrom asymmetric claims are moderated by the rules that govern the ex-post distribution ofresources. When conflict-management institutions are strong, distributional outcomes willbe less sensitive to any group’s opportunistic behavior aimed at obtaining a disproportionateshare of the available resources. Social conflict and economic disruption are more likelyto be the equilibrium outcome when priors regarding rivals’ behavior are more pessimisticand the ex-post distribution of resources is less constrained.9
Note that this line of reasoning applies not only to countries that are hit with adverseexternal shocks but also those that receivepositiveshocks. An increase in the terms oftrade, for example, can also set off a costly scramble for resources. As long as the costs ofsocial conflict (K ) are large relative to the size of external shocks (1), the onset of socialconflict can leave such economies worse off despite the external windfall (see Tornell andLane, 1999).
4. The Evidence: A First Look
In general, shocks, latent social conflicts, and institutions interact in complicated ways indetermining changes in economic performance. In addition, there is the thorny issue oflocating adequate empirical proxies for the abstract categories I have thus far employed. Asmentioned in the introduction, I use a range of indicators to capture latent social conflictsand the quality of conflict-management institutions. I begin by presenting a few suggestiveresults that demonstrate the potential of the framework considered here. A broader exam-ination, using alternative proxies, follows in the next two sections. In the final analysis,confidence in the results is increased by the finding that a wide range of proxies yieldsresults that are statistically significant and in the direction predicted by my story.
Table 4 displays the initial results. The dependent variable in the regressions is thegrowth differential between the two subperiods, 1960 to 1975 and 1975 to 1989. All theregressions contain the following independent variables in addition to conflict indicators:regional dummies for Latin America, East Asia, and sub-Saharan Africa, lagged growth

394 RODRIK
Table 4.Explaining the growth collapse in less developed countries.
Dependent Variable: Per Capita Growth 1975–1989Minus Per-Capita Growth 1960–1975
(1) (2) (3) (4) (5) (6)
constant 3.73∗∗∗ 4.66∗∗ 10.33∗ 12.93∗ 11.91∗ 7.92∗(1.91) (2.09) (2.58) (2.83) (2.15) (1.90)
Latin America −1.96∗ −1.35∗ −0.17 −0.23 −1.42∗ −2.16∗(0.50) (0.63) (0.85) (0.71) (0.52) (0.41)
East Asia 2.11∗∗ 2.94∗ 3.08∗ 1.98∗ 1.93∗ 2.53∗(0.97) (0.92) (0.79) (0.64) (0.59) (0.78)
SSA −3.16 0.51 1.80 −4.16∗ −2.73∗ −1.89∗∗(2.41) (2.83) (2.78) (1.33) (0.65) (0.73)
growth 1960–1975 −0.92∗ −0.79∗ −0.67∗ −0.69∗ −0.75∗ −0.80∗(0.19) (0.16) (0.16) (0.12) (0.14) (0.15)
log (GDP/cap.), 1975 −0.23 −0.30 −0.55∗∗ −1.94∗ −1.65∗ −0.84∗(0.21) (0.22) (0.24) (0.45) (0.39) (0.31)
external shocks −0.17∗ −0.15∗ −0.03 −0.02 −0.01(0.06) (0.05) (0.04) (0.03) (0.03)
income inequality −0.12∗ −0.02(0.04) (0.02)
institutions (ICRG) 0.74∗ 0.55∗(0.17) (0.16)
ELF60 −1.33∗∗ −1.68∗∗(0.64) (0.66)
democracy 1.93∗∗(0.95)
N 52 51 51 48 90 97Adj. R2 0.48 0.60 0.65 0.85 0.62 0.54
Notes: Robust standard errors reported in parentheses. Levels of statistical significance indicated byasterisks:∗ 99 percent,∗∗ 95 percent,∗∗∗ 90 percent.
(during 1960 to 1975), and per-capita GDP in 1975. The lagged-growth term is included toallow for convergence effects or mean reversion in growth (and is usually highly significantwith a large negative coefficient).10 Per-capita GDP and regional dummies are includedto control for structural characteristics (other than those that are conflict-related) that arecorrelated with income levels and geographical location. In the first four columns of Table 4,the sample is restricted to countries for which high-quality data on income inequality—mypreferred indicator of latent social conflict—is available for the 1970s. (Regressions withlarger samples will be discussed later on.) Column (1) shows the results when the growthdifferential is regressed only on these variables. The estimated coefficients on the regionaldummies confirm our earlier discussion: East Asia, unlike Latin America and sub-SaharanAfrica, did not suffer a growth decline after 1975.
In column (2), I include a measure of external shocks during the 1970s. This measure iscalculated by multiplying the standard deviation of the first log-differences of the terms oftrade (during 1971 to 1980) with the average share of total trade in GDP (during 1970 to1974). It is meant to capture the unexpected component of the volatility of the streams ofincome associated with foreign trade. Assuming that the terms of trade follow a random

EXTERNAL SHOCKS, SOCIAL CONFLICT, AND GROWTH COLLAPSES 395
walk (possibly with drift), this is the theoretically appropriate indicator of external volatility(Rodrik, 1998b).11 The estimated coefficient on the external shock variable is negative andhighly significant. As expected, greater exposure to external turbulence during the 1970sis associated with larger reductions in growth after 1975. The adjusted R2 rises from 0.48in column (1) to 0.60 in column (2).
The next regression (shown in column 3) adds income inequality. I use the Gini coefficientfrom the high-quality sample in Deininger and Squire (1996) and include only countriesfor which there is a data point sometime during the 1970s. (A simple average is used ifthere is more than one observation during the 1970s.) Income inequality enters with ahighly significantnegativecoefficient and raises the explanatory power of the regression(with the adjusted R2 rising further to 0.65). According to the point estimate, a differencein inequality of 10 Gini points is associated with slower growth of 1.2 percentage pointsper annum. The coefficient on external shocks remains significant.
The regression in column (4) includes a proxy for conflict-management institutions: thequality of governmental institutions from Knack and Keefer (1995), with the raw data com-ing from the International Country Risk Guide (ICRG).12 This index is based on underlyingnumerical evaluations relating to the rule of law, bureaucratic quality, corruption, expropri-ation risk, and governmental repudiation of contracts. It ranges from 0 to 10, with highervalues indicating superior institutions. The estimated coefficient on institutional quality ispositive and highly significant, and the adjusted R2 now rises to 0.85. In fact, once theICRG index is included in the regression, income inequality and external shocks contributevery little additional explanatory power.13 This finding parallels one of the implicationsof the theoretical model discussed above: when institutions of conflict management aresufficiently strong to ensure that ex post distributions follow the “rule of law” rather thanopportunistic grabs by social groups, neither the severity of the shocks nor the extent oflatent social conflicts might play a role in determining the productivity of an economy.
However, the result in column (4) that institutional quality “trumps” latent social conflictis not a general one. Using larger samples and alternative proxies for latent conflict, I findthat both types of variables enter significantly. In column (5), for example, I replace incomeinequality with ethnolinguistic fragmentation, which allows the sample size to increase to90 countries. The index of ethnolinguistic fragmentation(ELF60)measures the likelihoodthat any two randomly drawn individuals in a country willnot be members of the sameethnolinguistic group (Mauro, 1995). (Note thatELF60 is not strongly related to incomeinequality: the correlation coefficient is only 0.13.) In this regression, bothELF60 andinstitutional quality enter with statistically significant coefficients (the former negative, andthe latter positive). Hence, the evidence suggests that ethnic cleavages matter to the abilityto manage shocks, even when the quality of institutions is controlled for.
The final column in Table 4 (column (6)) shows the results with an alternative proxyfor the quality of conflict-management institutions. Here, I replace the ICRG index witha composite index of democracy for the 1970s, constructed from the indicators of civilliberties and political rights compiled by Freedom House. This index ranges from 0 to1, with 1 indicating a fully democratic system. Democratic institutions—political parties,elected representatives, free speech, and the like—can be viewed as the ultimate institutionsof conflict management, in that they allow for differences among social groups to be resolved

396 RODRIK
Figure 3. Partial scatter plot of growth differential against income inequality (based on Table 4, column (3)).
in a predictable, inclusive, and participatory manner. The sample size in this regression is97. The estimated coefficient on the democracy index is positive and statistically significant,with the coefficient onELF60remaining negative and significant. Democratic institutionsturn out to have been good for managing the shocks of the 1970s.14
I note several additional things about the results summarized in Table 4. First, it is worthemphasizing that the proxies used for conflict and institutions are highly persistent over time.The correlation coefficients across decades for both Gini indices and the democracy indexare 0.90 or higher. Therefore, it is difficult to think of a priori reasons for why these variablesshould contribute to our understanding of thedifferencesin growth performance before andafter 1975—except for the explanation emphasized in this article that these variables play animportant role in determining different economies’ response to the turbulence of the 1970s.15
Moreover, the persistence over time of institutional ratings makes reverse-causation lesslikely: these ratings cannot be endogenous to changes in economic performance if theypredate the shocks of the 1970s.
Second, my results are robust across different samples and are not driven by outliers.Partial scatter plots based on the results in Table 4 are shown in Figures 3 and 4. I reportsimilar results for larger samples later in the article.
Third, controlling for the change in investment rates between the two periods does notaffect our conclusions. The change in investment typically enters with a coefficient thatis significant at 90 percent or better (results not shown), but it does not greatly improvethe fit of the regressions. This is consistent with my earlier finding that the differentialgrowth performance after 1975 cannot be explained by what happened to investment. Theprimary channel through which social conflict and institutions affect changes in growth isproductivity, not investment.

EXTERNAL SHOCKS, SOCIAL CONFLICT, AND GROWTH COLLAPSES 397
Figure 4. Partial scatter plot of growth differential against institutional quality (based on Table 4, column (4)).
5. Composite Indicators of Social Conflict
Next, I combine the variables used above and others to construct fourcompositeindicators ofsocial conflict triggered by the external shocks of the 1970s. As I show in this section, theseindicators correlate negatively and quite strongly with economic performance followingthese shocks (compared to earlier performance).
The central argument of this article is that the extent of social conflict triggered duringthe 1970s was a function of three determinants: (1) the severity of the external shocks, (2)the depth of latent social conflicts, and (3) the quality of conflict management institutions.Accordingly, our synthetic indicators are the product of three proxies, one for each of thesedeterminants:
conflict1 = shock70s× ELF60× (1− democ70s) (n= 105)
conflict2 = shock70s×Gini(hq)70s × (1− democ70s) (n= 56)
conflict3 = shock70s×Gini(all )70s × (10− IC RG) (n= 71)
conflict4 = shock70s×homelang×(1− democ70s) (n= 113)
All four employ the same measure of shocks (shock70s), which was the measure used in theprevious section. They differ only in the combination of the other two terms.
As a proxy for latent social conflicts, I use the following variables: (1)ELF60,(2) Gini(hq)70s, the high-quality income inequality measure used in the previous sec-tion, (3) Gini(all )70s, which usesall available Gini coefficients for the 1970s (from theDeininger and Squire, 1996, data set), and (4)homelang, which measures the proportion ofthe population that does not speak the country’s official language at home (from Easterlyand Levine, 1996). My proxies for institutions of conflict management are the two used

398 RODRIK
previously: (1)democ70s, the index of democratic institutions, and (2)IC RG, the qualityof governmental institutions.
I have constructed these four indicators with an eye toward mixing and matching dif-ferent proxies while keeping the sample size reasonably large. Note that where possi-ble, conflict measures are constructed using data from the 1970s to avoid reverse causal-ity. I use standardized transformations of these synthetic indicators (dividing the actualvalues by their standard deviation), so that coefficient estimates can be interpreted moreeasily.
Each of the four composite indicators is then entered in two regressions (for a total ofeight regressions). The dependent variable in the first type of regression is the same as inthe previous section: the growth rate in 1975 to 1989 minus the growth rate in 1960 to 1975.In the second set of regressions, I have used a break year that is specific to each countryrelying on recent work by Pritchett (1997). Pritchett’s research yields for each country ayear in which the trend growth rate appears to have changed.16 The dependent variable in thesecond set of regressions is the difference in growth centered around this country-specificbreak year. All the control variables included in the previous set of regressions are includedhere as well.17
Table 5 displays the results.18 The bottom line is that the composite indicators enter withnegative and significant coefficients in all cases. Their levels of statistical significance are99 percent or better in most instances. The magnitude of the estimated coefficients suggeststhat an increase of one standard deviation in the conflict indicator is associated with a growthreduction (relative to earlier performance) of 0.75 to 1.65 percent per year. Note also thatthe sample size varies from 49 to 103 countries, indicating that we are picking up a broadphenomenon going beyond the experience of a small group of countries.
In fact, the results display remarkable robustness across various subsamples. The partialcorrelation between growth collapse andconflict1 remains statistically significant whenthe sample is restricted to (1) poorer countries (defined as countries with 1989 per-capitaGDP < $5,000 at 1985 prices), (2) countries other than those in sub-Saharan Africa, (3)countries other than those in sub-Saharan Africaand east Asia, (4) sub-Saharan Africancountries, and (5) Latin American countries. The estimated slope coefficients change verylittle either.
6. Probing Further
In this section I present results with a broader range of proxies for latent conflicts and forthe quality of conflict-management institutions. To render the analysis manageable, I donot attempt to combine the various proxies in the manner used previously but simply showwhat happens when they are each entered one by one in the same basic regression. Theconclusion is that these additional proxies enter the regression significantly and with thepredicted sign also. I then examine some competing explanations for the growth collapseafter 1975 to see whether my results are robust against these alternatives. Finally, I providemore direct evidence that implicates macroeconomic management and its relationship tosocial conflict as the chief culprits.

EXTERNAL SHOCKS, SOCIAL CONFLICT, AND GROWTH COLLAPSES 399
Table 5.Regressions with composite indices of social conflict.
Dependent Variable: Growth Rate After Year TMinus Growth Rate Before Year T
T = 1975 T = Break Year from Pritchett (1997)
(1) (2) (3) (4) (5) (6) (7) (8)
constant 6.63∗ 4.11∗∗ 5.88∗ 5.45∗ 2.83 7.47∗∗ 4.88∗∗ 2.54(1.17) (1.81) (1.32) (1.28) (2.41) (3.19) (2.28) (2.13)
Latin America −2.29∗ −1.83∗ −1.65∗ −2.32∗ −2.10∗ −1.58∗∗ −1.22∗∗∗ −2.29∗(0.38) (0.41) (0.46) (0.40) (0.53) (0.60) (0.65) (0.55)
East Asia 2.33∗ 1.70∗∗ 2.00∗ 1.68∗∗ 5.56∗ 3.79∗ 4.34∗ 4.35∗(0.71) (0.81) (0.64) (0.74) (0.86) (1.29) (0.82) (1.05)
SSA −1.89∗ −3.14∗∗ −1.99∗∗ −1.38∗∗∗ −1.22 −0.09 −2.54∗∗ −0.97(0.70) (1.19) (0.90) (0.72) (0.81) (1.58) (1.05) (0.79)
growth prior to T −0.69∗ −0.48∗ −0.58∗ −0.71∗ −0.95∗ −0.50∗ −0.78∗ −0.93∗(0.15) (0.16) (0.18) (0.14) (0.11) (0.13) (0.16) (0.11)
log (GDP/cap.), 1975 −0.57∗ −0.41∗∗∗ −0.57∗ −0.48∗ −0.14 −0.84∗∗ −0.44∗ −0.13(0.15) (0.21) (0.17) (0.16) (0.28) (0.37) (0.28) (0.25)
conflict1 −1.33∗ −1.47∗(0.33) (0.42)
conflict2 −1.06∗∗ −1.65∗(0.47) (0.57)
conflict3 −0.77∗ −0.75∗∗(0.27) (0.34)
conflict4 −1.38∗ −1.45∗(0.46) (0.51)
N 92 49 63 97 96 50 66 103R2 .57 .62 .57 .48 .65 .65 .59 .59
PartialR2
for conflict variable 0.17 0.09 0.13 0.10 0.12 0.15 0.07 0.07
Notes: Robust standard errors reported in parentheses. Levels of statistical significance indicated by asterisks:∗ 99 percent,∗∗ 95 percent,∗∗∗ 90 percent.
6.1. Other Measures of Conflict and Institutions
With regard to latent social conflicts, I use four indicators in addition to those alreadymentioned. The first new variable is the Gini coefficient for land, taken from Alesinaand Rodrik (1994). The second is a measure of racial tension, measured on a scale of1 (low tension) to 6 (high tension), taken from Knack and Keefer (1995). Third, I usethe murder rate, from Kurian (1991). Finally, I use an index of social trust in a societythat has been used by Knack and Keefer (1996) and that comes from the World ValuesSurvey (Inglehart, 1994). The indicatornotrust is 100 minus the percentage of respon-dents who replied “most people can be trusted” when asked: “Generally speaking, wouldyou say that most people can be trusted or that you can’t be too careful in dealing withpeople?”19 The main disadvantage of this indicator is that it is available for 29 countriesonly.

400 RODRIK
Table 6.Correlation matrix for indicators of latent social conflict.
gini70 giniland ELF60 homelang racialt murder notrust
gini70 1.00giniland 0.49 1.00ELF60 0.13 −0.07 1.00homelang 0.27 −0.16 0.76 1.00racialt 0.14 −0.09 0.71 0.55 1.00murder 0.25 −0.13 0.09 −0.02 0.17 1.00notrust 0.74 0.41 0.09 0.26 0.37 0.19 1.00gdpsh575 −0.46 −0.05 −0.38 −0.48 −0.49 −0.17 −0.65
Note that I do not use measures of political instability (or of violence other than murderrates), even though they may be good indicators of conflict, because of concern aboutendogeneity: deteriorating economic performance is likely to be an independent cause ofgovernmental turnover and domestic unrest. Measures of income distribution, ethnic andlinguistic differences, and social trust, by contrast, tend to be more persistent characteristicsof societies.
The correlation matrix for the proxies used for latent social conflict is shown in Table 6.Note that all of the indicators are inversely related to per-capita GDP but that the correlationis not always strong. As expected,ELF60, homelang, and racial tension are highly corre-lated with each other, but none is strongly related to measures of inequality (see Table 4).Income inequality is strongly correlated with inequality in land holdings but is not stronglyassociated with murder rates. The latter are generally weakly correlated with everythingelse. Finally,notrustis highly correlated with income inequality but not with the measuresof ethnic and linguistic divisions. The broad pattern that emerges from these correlationsis that each of the indicators is likely to contribute additional information about socialdivisions.
Table 7 displays the results, with each indicator entered individually. The dependentvariable is the growth differential between the two periods 1975 to 1989 and 1960 to 1975,as before. The independent variables include the usual controls as well as the shock variable.The sample size ranges from 26(notrust)to 103(homelang). In each case, the estimatedcoefficient on the latent-conflict proxy is negative and statistically significant—at the 90percent level in the case of racial tension and the murder rate, at the 95 percent level in thecase of Gini coefficient for land,homelang, andnotrust,20 and at the 99 percent level in thecase of income inequality andELF60. These results are quite supportive of the importanceplayed on latent social conflicts in this article. A representative partial scatter plot (forELF60) is shown in Figure 5.
I next turn to proxies for institutions of conflict management. I use five measures inaddition to democracy and institutional quality. The first is a measure of the rule of law,defined as the degree to which citizens are treated as equal under the law and the judiciary(Gwartney, 1996). Measured on a scale from 0 (minimum) to 4 (maximum), this is oneof the component indices used in constructing the Freedom House index of democracy.Second, I use an index that measures the extent of competitiveness of political participationin a country during the 1970s(participation). This index is taken from the Polity III data

EXTERNAL SHOCKS, SOCIAL CONFLICT, AND GROWTH COLLAPSES 401
Figure 5. Partial scatter plot between growth differential and ethnolinguistic fragmentation (based on Table 7,column (4)).
set of Jaggers and Gurr (1995), who define it as the “extent to which non-elites are able toaccess institutional structures for political expression” (it is rescaled to range from 0 to 1).21
Third, I use an index of bureaucratic efficiency(bemauro)computed by Mauro (1995). It isbased on a simple average of three subindices on the efficiency of the judiciary system, theextent of red tape, and the extent of corruption, as reported by correspondents of BusinessInternational, a private firm. The fourth is a measure of lack of corruption(nocorr), alsofrom Mauro (1995), based on the relevant subindex only. The two measuresbemauroandnocorrrange from 1 to 10, with higher values indicating better-quality institutions. The finalmeasure is of quite a different type and is meant to quantify the extent of social insurancein place. The motivation behind this last measure is the idea that distributional conflictsare easier to mediate when compensation—through social insurance schemes—is built intothe system. I use the share of public expenditures on social security and welfare in GDP,averaged over 1975 to 1979, as my measure of this(social).
All of my institutional indicators are very highly correlated with per-capita GDP, withthe correlation coefficients ranging from 0.71(nocorr) to 0.84 (ICRG index of institutionalquality), and consequently with each other. Since I control for per-capita GDP in the re-gressions, a more interesting correlation in this context is the pairwise correlation afterpartialing out the effect of per-capita GDP. These correlations are shown in Table 8. Thepartial correlations are quite weak in a large number of instances. For example, democracyis strongly correlated only withparticipation(partialr = 0.79). It is weakly correlated withbemauro(partialr = 0.10), practically uncorrelated withsocial, and negatively correlatedwith nocorr. Generally, the variablesocial is also quite weakly correlated with the otherindicators. This suggests that there may be value added in using these additional indicators.

402 RODRIK
Table 7.Regressions using indicators of latent social conflict.
Dependent Variable: Per Capita Growth 1975–1989Minus Per-Capita Growth 1960–1975
(1) (2) (3) (4) (5) (6) (7) (8)
constant 4.20∗∗ 10.33∗ 7.23∗ 5.68∗ 5.83∗ 6.66∗ 4.45 3.20∗(1.69) (2.58) (2.09) (1.67) (2.02) (1.40) (3.39) (0.92)
Latin America −2.20∗ 0.18 −0.88 −2.33∗ −2.26∗ −2.31∗ −0.77(0.44) (0.85) (0.73) (0.40) (0.42) (0.42) (0.82)
East Asia 1.23 3.08∗ 1.66 2.36∗ 2.26∗ 2.26∗ 1.97∗∗∗(0.92) (0.79) (1.22) (0.70) (0.76) (0.76) (0.92)
SSA −2.23∗ 1.80 −1.39∗∗∗ −2.16∗ −1.46∗∗∗ −2.63∗ −1.64(0.66) (2.78) (0.82) (0.73) (0.76) (0.68) (1.44)
growth, 1960–1975 −0.82∗ −0.67∗ −0.70∗ −0.82∗ −0.80∗ −0.76∗ −0.82∗ −0.66∗∗(0.14) (0.16) (0.15) (0.16) (0.14) (0.16) (0.22) (0.26)
log (GDP/cap.), 1975 −0.31 −0.55∗∗ −0.36 −0.39∗∗∗ −0.46∗∗∗ −0.67∗ −0.27(0.20) (0.24) (0.24) (0.20) (0.24) (0.22) (0.36)
external shocks, 1970s −0.15∗ −0.14∗∗∗ −0.01 −5.90E-03 −0.08∗∗ −0.03(0.05) (0.08) (0.03) (0.04) (0.03) (0.05)
gini70s −0.12∗(0.04)
giniland −0.04∗∗(0.02)
ELF60 −1.76∗(0.64)
homelang −0.02∗∗(8.76E-03)
racialt −0.21∗∗∗(0.13)
murder −0.07∗∗∗(0.04)
notrust −0.04∗∗(0.02)
N 110 51 45 98 103 86 60 29Adj R2 .40 .65 .53 .52 .47 .59 .39 .35
Notes: Robust standard errors reported in parentheses. Levels of statistical significance indicated by asterisks:∗ 99 percent,∗∗ 95 percent,∗∗∗ 90 percent.
The regression results using these proxies for conflict management institutions are shownin Table 9 (with some associated partial scatter plots in Figures 6 to 9). Columns (1)and (2) are the results for regressions in which my original indicators of democracy andinstitutions are entered separately. They differ from previous regressions in that incomeinequality orELF60 is not included, so the sample size is larger. Column (3) displaysthe results withparticipation, and columns (4) to (6) display the results for the rule oflaw index,bemauroandnocorr, respectively. Finally, column (7) shows the results withsocial. In each case the estimated coefficient on the variable of interest is positive andhighly significant (at the 95 or 99 percent level). The evidence is strongly suggestivethat countries with greater democracy, more participatory institutions, stronger rule of

EXTERNAL SHOCKS, SOCIAL CONFLICT, AND GROWTH COLLAPSES 403
Table 8.Pairwise correlations between indicators of conflict-management institutions (components orthogonalto 1975 per-capita GDP).
democracy ICRG rule of law participation bemauro nocorr social
democracy 1.00institutions (ICRG) 0.20 1.00rule of law 0.29 0.35 1.00participation 0.79 0.32 0.30 1.00bemauro 0.10 0.54 0.33 0.04 1.00nocorr −0.07 0.38 0.30 −0.09 0.86 1.00social 0.01 −0.15 0.28 0.07 0.11 0.25 1.00
Figure 6. Partial scatter plot between growth differential and democracy (based on Table 9, column (1)).
law, higher-quality governmental institutions, and higher levels of social insurance haveexperienced less economic disruption after the mid-1970s.
6.2. Alternative Explanations
Next, I consider some other variables that are often thought to be associated with growthcollapses in the 1980s to see whether they affect my conclusions. In Table 10, I look forevidence for three types of explanations. First, it is often argued that countries that wereoutward-oriented and had more open trade regimes were better positioned to avoid gettinginto trouble. To test for this possibility, I include the following three variables on the right-hand side: the Sachs-Warner index of “openness,”swindex(Sachs and Warner, 1995);22 theexport share in GDP, averaged for 1970 to 1974; and the average tariff rate on intermediate

404 RODRIK
Figure 7. Partial scatter plot between growth differential and quality of institutions (based on Table 9, column (2)).
Figure 8. Partial scatter plot between growth differential and rule of law (based on Table 9, column (3)).

EXTERNAL SHOCKS, SOCIAL CONFLICT, AND GROWTH COLLAPSES 405
Figure 9. Partial scatter plot between growth differential and spending on safety nets, excluding Sub-SaharanAfrica (based on Table 9, column (7)).
imports (from the Barro and Lee data set). None of these variables enters with a statisticallysignificant coefficient. The only one that comes close is the Sachs-Warner indicator, whichis actually significant at the 90 percent level whenconflict1is excluded from the regression(not shown). When bothconflict1andswindexare included, however, the latter becomesinsignificant. Indeed,conflict1, which is included in all the regressions, remains highlysignificant in all cases.
Next, I look for evidence that the worse-hit countries were those with larger public sectors.Column (5) of Table 10 suggests that there is some indication that this might have been thecase. The share of government consumption in GDP during the early 1970s(cgavg7074)enters with an estimated coefficient that is negative and significant at the 90 percent level.However, controlling for social conflict appears to make a large difference in this case:whenconflict1 is excluded from the regression, the estimated coefficient oncgavg7074doubles in absolute value and becomes significant at the 99 percent level (not shown). Bycontrast, the magnitude and significance of the coefficient onconflict1is unaffected by theinclusion ofcgavg7074.
The third hypothesis is that countries that got into trouble were those that had borrowedrecklessly prior to the shocks of the late 1970s. The final regression in Table 10 showsthat there was no relationship between the level of indebtedness in 1975 (measured by thedebt-exports ratio,detexp75) and subsequent performance.23 The results using debt-GNPratios for the mid-1970s are similar (not shown).
To summarize the discussion on the results in Table 10, my hypothesis centering on socialconflict is quite robust against alternative explanations for the growth collapse. Indeed,

406 RODRIK
Table 9.Regressions using proxies for conflict-management institutions.
Dependent Variable: Per Capita Growth 1975–1989Minus Per-Capita Growth 1960–1975
(1) (2) (3) (4) (5) (6) (7)
constant 7.48∗ 11.20∗ 10.17∗ 6.65∗ 9.23∗ 9.35∗ 6.22∗∗(2.01) (2.20) (2.16) (1.93) (1.69) (1.91) (2.39)
Latin America −1.95∗ −1.30∗∗ −1.40∗ −1.75∗ −1.26∗∗ −1.22∗∗ −1.35∗∗(0.47) (0.50) (0.46) (0.47) (0.50) (0.56) (0.57)
East Asia 1.85∗∗∗ 1.69∗∗ 2.11∗ 2.18∗∗ 2.81∗ 3.08∗ 2.17∗∗(0.94) (0.65) (0.76) (0.88) (0.77) (0.80) (1.07)
SSA −1.83∗∗ −3.16∗ −2.35∗ −1.87 −3.07∗ −3.06∗ −0.97(0.71) (0.59) (0.67) (0.65) (0.51) (0.48) (1.02)
growth, 1960–1975 −0.75∗ −0.72∗ −0.72∗ −0.76∗ −0.83∗ −0.79∗ −0.67∗(0.15) (0.14) (0.15) (0.15) (0.10) (0.10) (0.19)
log (GDP/cap.), 1975 −0.92∗ −1.64∗ −1.24∗ −0.79∗∗ −1.31∗ −1.27∗ −0.68∗∗(0.33) (0.40) (0.31) (0.33) (0.28) (0.32) (0.28)
external shocks −0.02 −0.03 −0.03 −0.06 −0.10∗ −0.10∗ −0.05(0.04) (0.03) (0.03) (0.04) (0.03) (0.04) (0.05)
democracy 2.48∗∗(1.09)
institutions (ICRG) 0.58∗(0.16)
rule of law 0.78∗(0.20)
participation 2.25∗∗(1.12)
bureaucratic efficiency 0.51∗(bemauro) (0.11)no corruption 0.43∗(nocorr) (0.11)log social spending 0.48∗∗(social) (0.23)
N 104 93 92 97 63 63 75Adj R2 .45 .61 .56 .58 .72 .70 .39
Notes: Robust standard errors reported in parentheses. Levels of statistical significance indicated by asterisks:∗ 99 percent,∗∗ 95 percent,∗∗∗ 90 percent.
once I control for social conflict using the composite indicator, I find that none of the otherconventional explanations contributes much explanatory power.24
6.3. The Role of Macroeconomic Mismanagement
I have argued that that social conflict influences economic performance and that it does soin large part because it hampers macroeconomic adjustment to changed circumstances. InTable 11, I provide some direct evidence on the role of macroeconomic adjustment in thegrowth collapses after 1975. First, I construct an index of macroeconomic mismanagementafter 1975 for each country(“bad policy”) by taking a linear combination of the increases

EXTERNAL SHOCKS, SOCIAL CONFLICT, AND GROWTH COLLAPSES 407
Table 10.Regressions with additional determinants.
Dependent Variable: Per Capita Growth After TMinus Per-Capita Growth Before T
(1) (2) (3) (4) (5) (6)
constant 2.83 3.48 1.77 1.78 5.58∗ 0.46(2.41) (2.97) (2.71) (3.27) (2.08) (3.68)
Latin America −2.10 −1.75∗ −1.97 −2.01∗ −2.40∗ −1.98∗(0.53) (0.50) (0.53) (0.58) (0.50) (0.64)
East Asia 5.56∗ 5.57∗ 5.71∗ 5.58∗ 5.04∗ 5.82∗(0.86) (0.85) (0.99) (0.89) (0.87) (1.17)
SSA −1.22 −0.92 −0.96 −1.28 −1.46∗∗ −0.68(0.81) (0.79) (0.85) (0.98) (0.73) (0.90)
growth prior to T −0.95∗ −0.98∗ −0.96∗ −0.95∗ −0.94∗ −0.99∗(0.11) (0.11) (0.11) (0.12) (0.11) (0.12)
log (GDP/cap.), 1975 −0.14 −0.27 −0.00 −0.02 −0.34 0.10(0.28) (0.38) (0.34) (0.36) (0.24) (0.50)
conflict1 −1.47∗ −1.54∗ −1.52∗ −1.31∗ −1.23∗ −1.62∗(0.42) (0.42) (0.43) (0.43) (0.43) (0.47)
swindex 0.90(0.66)
exports/GDP, 1970–1974 −0.74(1.80)
tariff rate −0.05(1.29)
cgavg7074 −0.06∗∗∗(0.04)
detexp75 0.00(0.00)
N 96 91 90 81 96 67R2 .65 .67 .67 .65 .67 .68
Notes: Robust standard errors reported in parentheses. Levels of statistical significance indicatedby asterisks:∗ 99 percent,∗∗ 95 percent,∗∗∗ 90 percent. Year T is the break year from Pritchett(1997).
in the rates of inflation and black-market premia for foreign currency between the twoperiods. The weights on the two components are selected such that a unit increase in theindex is associated with a one-percentage point drop in growth. This index is very stronglycorrelated with the declines in growth; it enters the equation with a t-statistic exceeding 6(see column (1)).
Next, I regress the index of macroeconomic mismanagement on the measures of socialconflict used above. Columns (2) to (6) show the main results. Income inequality, democ-racy, institutional quality, and a composite measure of social conflict all turn out to bestrongly correlated with“bad policy” in the direction predicted by the hypothesis. Coun-tries with greater inequality and social conflict were significantly worse at managing themacroeconomy, while countries with democratic and high-quality governmental institutionswere better. Among our main indicators, the only one that does not enter with a significantcoefficient isELF60; it has the right sign but is insignificant at conventional levels.

408 RODRIK
Table 11.Determinants of macroeconomic mismanagement.
Dependent Variablegrdiff Bad Policy(1) (2) (3) (4) (5) (6)
“bad policy” −1.00(0.16)
Gini70s 0.04∗(0.01)
ELF60 0.27(0.28)
democracy (1970s) −0.99∗∗(0.49)
institutions (ICRG) −0.33∗(0.09)
conflict1 0.56∗(0.21)
N 79 42 82 79 72 77R2 0.63 0.71 0.16 0.36 0.48 0.33
Notes: Robust standard errors reported in parentheses. Levels of statistical significance indicatedby asterisks:∗ 99 percent,∗∗ 95 percent,∗∗∗ 90 percent. Additional explanatory variables notshown here: gr6075, log GDP per cap. 1975, shock70s (except in columns (1) and (6)), and regionaldummies. “Bad policy” represents a linear combination of the increase in rates of inflation andblack-market premia over the two periods.
7. Concluding Remarks
The idea that societies react to external shocks differently, depending on the underlyingsocial and political conditions, is certainly not novel, even in the economic literature. Thesame theme was developed, for example, in an early paper by Sachs (1985), which examinedthe reasons that most of Latin America became engulfed in a protracted debt crisis in theearly 1980s while East Asia did not, and in Ozler and Rodrik (1992), which looked atthe “political transmission mechanism”—that is, the political determinants of the privateinvestment response to shocks. What is new here is a more systematic empirical analysisthat focuses on the interaction of shocks with both latent social conflicts and the institutionsof conflict management, as well as the suggestion that this approach can help shed light onseveral important puzzles in the comparative experience with growth.
Much remains to be done. In particular, it is disappointing that the regional dummiesfor East Asia and/or Latin America typically remain significant after the introduction ofproxies for social conflict. One possible (and plausible) reason is that the proxies used inthis article are highly imperfect. Hence there is a need to develop better, more finely tunedindicators to calibrate latent conflict and the quality of institutions in different societies.
Nonetheless, I hope to have demonstrated that latent social conflicts and the institutionsof conflict management matter to the persistence of economic growth and that their effectsare measurable. This is an important conclusion not only in retrospect—as we try to under-stand what went wrong in so many countries after the mid-1970s—but also prospectively.

EXTERNAL SHOCKS, SOCIAL CONFLICT, AND GROWTH COLLAPSES 409
An increasing number of developing countries are integrating themselves with the interna-tional economy. As the Asian financial crisis demonstrates vividly, this will increase theirexposure to shocks. Therefore, it will be all the more important to develop institutions thatmediate social conflicts. The results of this article indicate that participatory and democraticinstitutions, the rule of law, and social insurance are all components of a strategy to enhanceresilience to volatility in the external environment.
Acknowledgments
I thank an anonymous referee, Daron Acemoglu, Bill Easterly, Jeff Frieden, Michael Gavin,Ed Glaeser, Phil Keefer, Robert Lawrence, Lant Pritchett, Jeffrey Sachs, Andrei Shleifer,and seminar participants at Harvard University, Princeton University, the MassachusettesInstitute of Technology, the World Bank, the New School of Social Research, and theUniversity of Toronto for very helpful comments, Chad Steinberg for excellent researchassistance, Joanna Veltri for editorial suggestions, and the Weatherhead Center for In-ternational Affairs and the Harvard Institute for International Development for financialsupport.
Notes
1. As shown below, an alternative approach using country-specific break years (with dates based on Pritchett,1997) yields very similar results.
2. I use 1975 to 1989 rather than 1975 to 1990 throughout the article as my second period because this allowsme to increase the number of countries in the sample. None of the results reported is affected if I use 1975 to1990 instead.
3. Growth rates are measured by taking the log differences of GDP per capita in the initial and final years anddividing by the number of intervening years. This may impart a downward bias on the estimated coefficientof lagged growth, as the log of GDP per capita in 1975 enters the two sides of the regression equation withopposite signs. However, carrying out the exercise using nonoverlapping endpoints yields identical results,both for R2s and for estimated coefficients. And using trend growth rates, rather than endpoints, actuallyreduces both the R2 and the estimated coefficient on lagged growth.
4. Countries in Sub-Saharan Africa are usually thought to have experienced low growth throughout most ofthe post-1960 period. Yet there areeight Sub-Saharan African countries in addition to Botswana that haveexperienced average growth in GDP per capita exceeding 3 percent per annum during 1960 to 1975. Thesecountries are Gabon, Cote d’Ivoire, Lesotho, Nigeria, South Africa, Swaziland, Tanzania, and Togo. None ofthese countries repeated this performance in the subsequent period 1975 to 1989.
5. For a recent paper that demonstrates that investment rates are a very poor predictor of growth in the short run,see Easterly (1997).
6. These are Algeria, Cyprus, Egypt, Iran, Israel, Jordan, Malta, Morocco, and Tunisia.
7. Note from Table 1 that one region improved its performance noticeably after 1973: South Asia.
8. The importance of social conflict and polarization as reasons for inefficient outcomes has been emphasized inAlesina and Drazen (1991), Tornell and Velasco (1992), Benabou (1996), and Tornell and Lane (1999).
9. A full blown model of this sort is presented in the working-paper version of this article (Rodrik, 1998a).

410 RODRIK
10. In some instances, the estimated coefficient on lagged growth turns out to be very close to one. This impliesthat the results differ very little from those for a conventional growth regression for 1975 to 1989. In suchcases, what the results seem to indicate is that the conflict/institutions variables enter very significantly ingrowth regressions for the 1975 to 1989 period, but not for the 1960 to 1975 period. A plausible reason is thatthese variables mattered a lot when the environment was unstable (subsequent to 1975), but much less whenit was not (the earlier period).
11. Note that this measure treats positive terms-of-trade shocks identically as negative shocks. The reasoning isthat positive income shocks could also trigger the kind of distributional conflicts discussed previously. Asan empirical matter, a volatility measure (of the type used here) is virtually indistinguishable from a measurebased on rates of change. This is because countries that have experienced large increases in their terms of tradeduring part of the 1970s have also experienced terms-of-trade deteriorations subsequently. Consequently, theresults are unchanged when I use as the shock variable the income effect of the changes in the external termsof trade during boom or bust periods.
12. My source for the ICRG data is Easterly and Levine (1996), who average observations for the years 1980–1989.
13. Note that this result is entirely consistent with the idea that external shocks act as atrigger for social conflictsthat hamper growth. To the extent that there was a common element to the external shocks that confronted allcountries during the 1970s, the trigger effect itself cannot be discerned in a cross-section of countries.
14. This result on the positive contribution of democracy to adjustment is obtained for a wide range of indicatorsof democracy and seems quite robust. See Rodrik (1997) for more extensive evidence on this score.
15. A large number of papers have found a role for some of by variables, especially income inequality, institutionalquality, and ethnolinguistic fragmentation (to be used below) in determininglong rungrowth rates. See Alesinaand Rodrik (1994) Persson and Tabellini (1994) on income inequality, Knack and Keefer (1995), Hall and Jones(1996), Barro (1996), and Sachs and Warner (1997) on the ICRG index, and Easterly and Levine (1996) onethnolinguistic fragmentation. There does not seem to be a strong causal relationships going from democracyto long-run growth (Helliwell, 1994; Barro, 1996). The question arises to what extent these findings arepicking up the differential effect of these determinants on growth performanceafter the mid-1970s.
16. The median value of these break years in the Pritchett sample is 1977 (personal communication with Pritchett),which is not far from 1975. In related work, Ben-David and Papell (1997) have also calculated break years intrend growth using time-series techniques, but their sample is limited to 74 countries.
17. Actually, the results are virtually identical without the control variables as well (with much lower R2s).
18. The regressions exclude a small number of countries that are outliers according to the DFITS statistic. Thesecountries are Congo, Mauritius, Togo, Chile, and Gabon in the case of regressions withconflict1andconflict4,and Gabon, Seychelles, Chile, Sri Lanka, and Iran in the case of regressions withconflict2andconflict3.However, including these countries make little difference to the results: while the fit is generally worse, theestimated coefficients on our composite indicators of conflict remain statistically significant (and negative) inall but one instance.
19. The survey dates were 1981 and 1990 to 1991.
20. The coefficient onnotrust is not significant when regional dummies are included.
21. I have averaged annual observations over 1970 to 1979.
22. The index is calculated as the share of years during which a country is judged to be “open” by Sachs andWarner, based on a number of trade policy and other indicators. I recalculated the index for the 1960 to 1974period only and use the modified version in the regression. (Using the original Sachs-Warner version for thewhole period makes no difference to the results.) I thank Andy Warner for making the underlying annualcoding available.
23. The reason I use debt levels in 1975 and not, say, 1981 is that many countries that followed poor macro policiesin response to the shocks of the 1970s subsequently accumulated large amounts of external debt. So a findingthat countries with high debt in 1981 were more likely to experience a debt crisis would not necessarily supporta hypothesis alternative to mine. What we would like to know is whether countries that experienced the debtcrisis were already prepositioned to do so prior to the shocks of the 1970s and their response to them.
24. The results in Table 10 do not change when I use the other composite indicators of social conflict. Nor do theydepend on using a country-specific break year as opposed to 1975.

EXTERNAL SHOCKS, SOCIAL CONFLICT, AND GROWTH COLLAPSES 411
References
Alesina, Alberto, and Allan Drazen. (1991). “Why are Stabilizations Delayed?”American Economic Review82,1170–1188.
Alesina, Alberto, and Dani Rodrik. (1994). “Distributive Politics and Economic Growth.”Quarterly Journal ofEconomics109, 465–490.
Barro, Robert, and Jong-Wha Lee. (1994). “Data Set for a Panel of 138 Countries.” Manuscript, HarvardUniversity.
Barro, Robert. (1998). “Determinants of Economic Growth: A Cross-Country Empirical Study.” NBER WorkingPaper No. 5698.
Benabou, Roland. (1996). “Inequality and Growth.” inNBER Macroeconomics Annual 1996. Cambridge:National Bureau of Economic Research.
Ben-David, Dan, and David H. Papell. (1997). “Slowdowns and Meltdowns: Postwar Growth Evidence fromSeventy-four Countries.” NBER Working Paper 6266.
Bijan Aghevli, and Jorge Marquez-Ruarte. (1985).A Case of Successful Adjustment: Korea’s Experience During1980–84. IMF Occasional Paper 39, Washington, DC.
Celasun, Merih, and Dani Rodrik. (1989). “Debt, Adjustment, and Growth: Turkey.” In J. Sachs and S. Collins(eds.),Developing Country Debt and Economic Performance, Vol. 3, Country Studies: Indonesia, Korea,Philippines, Turkey(bk. 4). Chicago: University of Chicago Press.
Collins, Susan, and Barry Bosworth. (1996). “Economic Growth in East Asia: Accumulation Versus Assimila-tion.” Brookings Papers on Economic Activity2, 135–191.
Deininger, Klaus, and Lyn Squire. (1996). “A New Data Set Measuring Income Inequality.”World Bank EconomicReview565–591.
Easterly, Williams. (1997). “The Ghost of Financing Gap: How the Harrod-Domar Model Still Haunts Develop-ment Economics.” World Bank.
Easterly, William, Michael Kremer, Lant Pritchett, and Larry Summers. (1993). “Good Policy or Good Luck?Country Growth Performance and Temporary Shocks.”Journal of Monetary Economics32, 459–483.
Easterly, William, and Ross Levine. (1996). “Africa’s Growth Tragedy: Policies and Ethnic Divisions.” WorldBank.
Gwartney, John et al. (1996).Economic Freedom Around the World, 1975–95. Toronto: Fraser Institute.Hall, Robert, and Charles Jones. (1996). “The Productivity of Nations.” Stanford University.Helliwell, John. (1994). “Empirical Linkages Between Democracy and Economic Growth.”British Journal of
Political Science24, 225–248.Inglehart, Ronald. (1994).Codebook for World Values Survey. ICPSR Study No. 6160, Institute for Social
Research, University of Michigan, Ann Arbor, MI.Jaggers, K., and T. R. Gurr. (1995). “Tracking Democracy’s Third Wave with Polity III Data.”Journal of Peace
Research32, 469–482.Knack, Stephen, and Philip Keefer. (1995). “Institutions and Economic Performance: Cross-Country Tests Using
Alternative Institutional Measures.”Economics and Politics207–228.Knack, Stephen, and Philip Keefer. (1996). “Does Social Capital Have an Economic Payoff? A Cross-Country
Investigation.” Manuscript.Kurian, George Thomas. (1991).The New Book of World Rankings(3rd ed.). New York: Facts on File Books.Mauro, Paolo. (1995). “Corruption and Growth.”Quarterly Journal of Economics681–712.Ozler, Sule, and Dani Rodrik. (1992). “External Shocks, Politics, and Private Investment: Some Theory and
Empirical Evidence.”Journal of Development Economics39, 141–162.Persson, Torsten, and Guido Tabellini. (1994). “Is Inequality Harmful for Growth?”American Economic Review
84, 600–621.Pritchett, Lant. (1997). “Economic Growth: Hills, Plains, Mountains, Plateaus, and Cliffs.” Paper, World Bank.Rodrik, Dani. (1997). “Democracy and Economic Performance.” Paper, Harvard University.Rodrik, Dani. (1998a). “Where Did All the Growth Go? External Shocks, Social Conflict and Growth Collapses.”
NBER Working Paper 6350.Rodrik, Dani. (1998b). “Why Do More Open Economies Have Bigger Governments?”Journal of Political
Economy106, 997–1032.Sachs, Jeffrey. (1985). “External Debt and Macroeconomic Performance in Latin America and Asia.”Brookings
Papers on Economic Activity2, 523–573.

412 RODRIK
Sachs, Jeffrey, and Andrew Warner. (1995). “Economic Reform and the Process of Global Integration.”BrookingsPapers on Economic Activity1, 1–118.
Sachs, Jeffrey, and Andrew Warner. (1997). “Sources of Slow Growth in African Economies.” Harvard Institutefor International Development.
Simonsen, Mario Henrique. (1988). “Price Stabilization and Incomes Policy: Theory and the Brazilian CaseStudy.” In Michael Bruno et al., (eds.),Inflation Stabilization: The Experience of Isreal, Argentina, Brazil,Bolivia, and Mexico. Cambridge: MIT Press.
Tornell, Aaron, and Philip Lane. (1999). “The Voracity Effect.”American Economic Review89, 22–46.Tornell, Aaron, and Andres Velasco. (1992). “The Tragedy of the Commons and Economic Growth: Why Does
Capital Flow from Poor to Rich Countries?”Journal of Political Economy100, 1208–1231.