where are the trucks? - esri...portmetrovancouver.com • project = smart fleet program, a port...
TRANSCRIPT

portmetrovancouver.com
Shane Pittman
Supervisor, Spatial Data
Port Metro Vancouver
Andrew Stanevicius
Area Manager, Assistant Vice President
TranSystems Corporation
WHERE ARE THE TRUCKS?USING GPS DATA TO DRIVE PORT DECISION-MAKING
portmetrovancouver.com
• Introduction
• Project Background
• Drayage Model
• Analysis Tools
• In-Depth Example
• Conclusion
• Questions
AGENDA

portmetrovancouver.com
• Who We Are: Port Metro Vancouver• Canada’s largest gateway, handling 19 percent of the
value of Canada’s total trade in goods
• Third largest tonnage port in North America
• Most diversified port in North America
• Business sectors include automobiles, breakbulk, bulk, container and cruise
• Facilitates trade with more than 160 world economies
• Handled 140 million tonnes of cargo in 2014
• Responsible for more than 16,000 hectares of water, and more than 1,000 hectares of land and assets along ~350 kilometres of shoreline
INTRODUCTION

portmetrovancouver.com
• Port Metro Vancouver Jurisdiction
INTRODUCTION

portmetrovancouver.com
• Who We Are: TranSystems Corporation• Serving the transit industry since 1966
• Nearly 1,000 professionals in 40 offices throughout the United States
• Listed in Engineering News Record as the country’s 17th largest transportation firm and 10th largest bridge firm
• Comprehensive experience with other port authorities, such as: Port of Long Beach, Port Everglades, Port of Tacoma
INTRODUCTION

portmetrovancouver.com
• Who We Are: TranSystems Corporation• Dedicated Operations Planning and Analysis practice area
• Utilizes simulation modeling and other analytical methods to evaluate transportation projects, facility improvement and goods movement strategies.
• Specializes in integrating other technologies into our modeling including GIS, databases, ESRI Arc Map
• Modeling approach allows us to analyze entire transportation systems
• Not just as a standalone gate or traffic model
• Where multiple modes and facilities can be integrated to test impacts of operating rules and policy
INTRODUCTION

portmetrovancouver.com
• Project = Smart Fleet program, a Port initiative• Started in 2013, with three goals:
1) Improve efficiency & reliability of terminal operations
2) Reduce greenhouse emissions from trucks
3) Strengthen the Port’s competitive advantage
• Four phases of program (we will cover first two):1) GPS installation
2) Drayage Model software implementation
3) Truck Licensing System (TLS) reform
4) Common reservation system implementation
PROJECT BACKGROUND

portmetrovancouver.com
PROJECT BACKGROUND
Container Drayage Efficiency Pilot Program
• 300 trucks 16% of fleet
EARLY 2012
GPS Program Expansion
Drayage Model Project
• 1000 trucks 50% of fleet
EARLY 2013
GPS units installed on all container fleet
• 2000 trucks 100% of fleet
MID-2014
• Program timeline so far

portmetrovancouver.com
• GPS installation• GPS points are recorded in response to certain events
• Ignition On
• Ignition Off
• Start Moving
• Stop Moving
• Turn
• Enter/Leave Geofence
• Time (5-minute intervals)
PROJECT BACKGROUND

portmetrovancouver.com
• Geofences are areas of significant container activity• Terminals and offdock facilities shown below
PROJECT BACKGROUND

portmetrovancouver.com
• Significant GPS attributes collected:• Longitude
• Latitude
• Truck ID
• Speed
• Direction
• Street Name
• Address Number
• Received On (Date/Time)
• Trigger Event
PROJECT BACKGROUND

portmetrovancouver.com
• Drayage Model software• Decision-support tool with several different components
• Reports truck movement and evaluates potential changes in regional transportation policies/regulations
• Forecasts and analyzes potential impacts to stakeholders
• Assessed the effectiveness of change through scenarios
• Evaluates emissions, estimated costs, turn times, volumes, hours of operations, and effects on competitiveness
• Benefits include more informed decision-making, increased predictability, and improved financial outcomes
PROJECT BACKGROUND

portmetrovancouver.com
• TranSystems Corporation• Provided technical background required to utilize GPS, a
renewable data source, to build a user-friendly analysis tool
• Provides performance metrics
• Allows visualization through ESRI ArcMAP
• Built a regional drayage model
• Combined GPS data, discrete event simulation, and data processing
• Unique because the data is renewable on a monthly or more frequent basis allowing for continual and up-to-date scenario planning and monitoring
PROJECT BACKGROUND

portmetrovancouver.com
DRAYAGE MODEL
portmetrovancouver.com
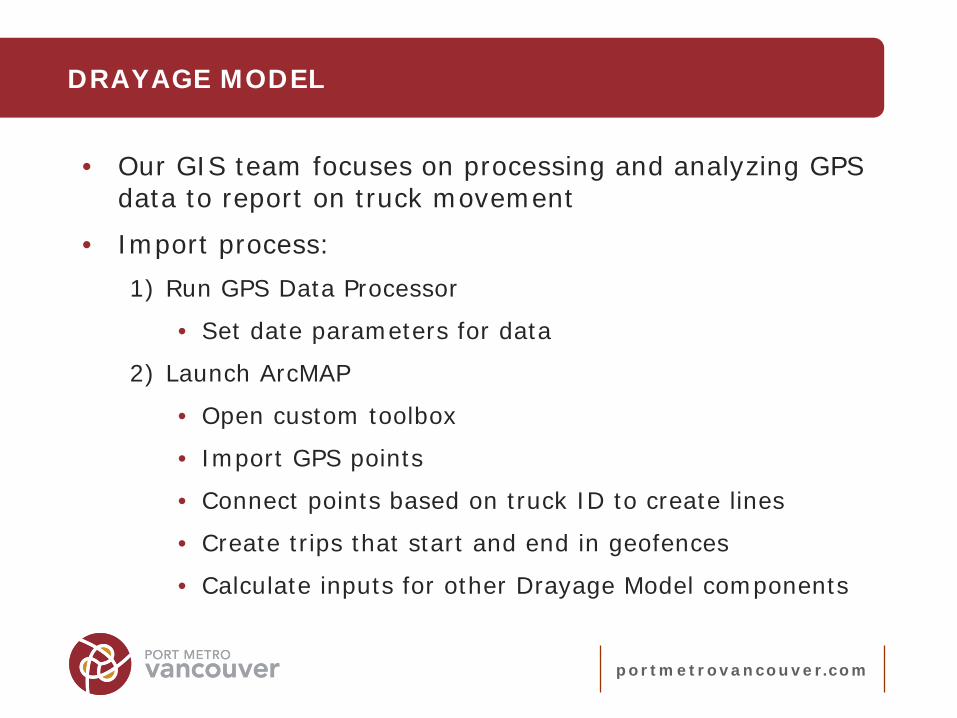
• Our GIS team focuses on processing and analyzing GPS data to report on truck movement
• Import process:1) Run GPS Data Processor
• Set date parameters for data
2) Launch ArcMAP
• Open custom toolbox
• Import GPS points
• Connect points based on truck ID to create lines
• Create trips that start and end in geofences
• Calculate inputs for other Drayage Model components
DRAYAGE MODEL

portmetrovancouver.com
DRAYAGE MODEL
• Process results in more than 200,000 monthly trips (20 million segments total, 15GB file geodatabase)

portmetrovancouver.com
• Each trip line includes:• Truck ID
• Point Received On (Date/Time)
• X & Y Coordinates
• Origin Geofence
• Destination Geofence
• Trip ID
• Bearing
• Trip Type
• Traffic Analysis Zone
• Hour
• Truck Age
• Emission Bin
• Meters From Previous GPS Point
DRAYAGE MODEL

portmetrovancouver.com
ANALYSIS TOOLS
• Once importing is complete, our GIS team uses several tools to analyze the trips• Seven tools total
• Three tools produce monthly reports
• Four tools are run upon request
• Tools were built in two ways:• ModelBuilder for model tools
• Python Programming Language for script tools

portmetrovancouver.com
1. Isolate Truck Movement tool• Produces total trips for an individual truck
ANALYSIS TOOLS

portmetrovancouver.com
ANALYSIS TOOLS
portmetrovancouver.com
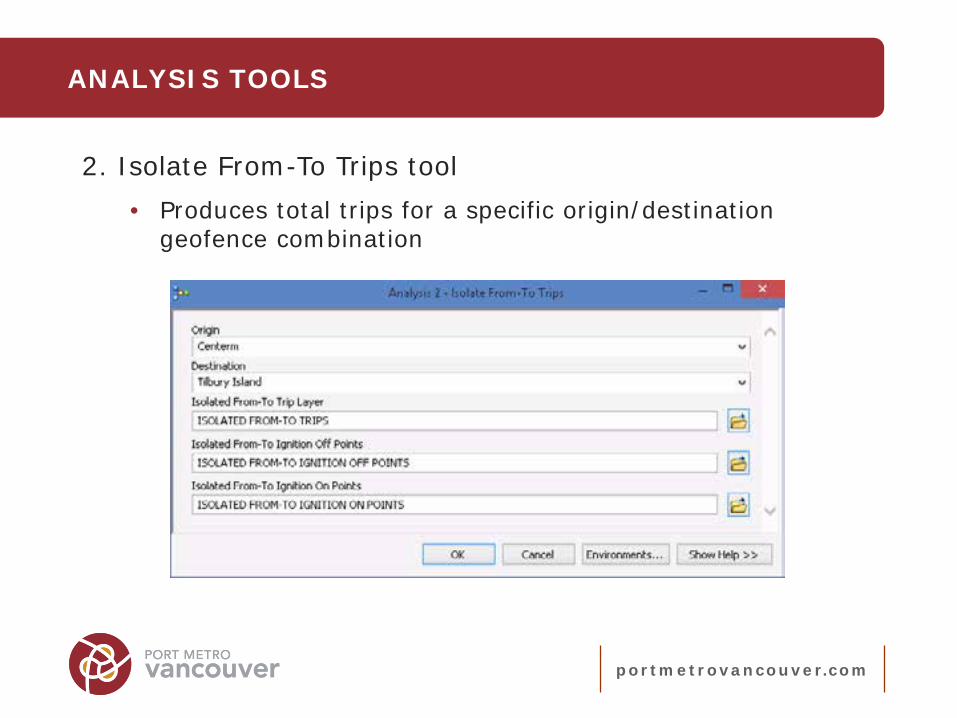
2. Isolate From-To Trips tool• Produces total trips for a specific origin/destination
geofence combination
ANALYSIS TOOLS

portmetrovancouver.com
ANALYSIS TOOLS

portmetrovancouver.com
3. Isolate Individual Trip tool• Produces a specific trip by a single truck
ANALYSIS TOOLS

portmetrovancouver.com
ANALYSIS TOOLS

portmetrovancouver.com
ANALYSIS TOOLS
4. Origin Destination Matrix Table tool• Reports total number of trucks entering and leaving each
geofence

portmetrovancouver.com
ANALYSIS TOOLS
5. Bridge Crossings Map tool• Produces total number of trucks crossing each bridge for
three specific time periods

portmetrovancouver.com
ANALYSIS TOOLS

portmetrovancouver.com
6. Hourly Truck Volumes by Direction tool• Shows total number of trucks intersecting a user-defined
line, broken down by hour and direction
ANALYSIS TOOLS

portmetrovancouver.com
ANALYSIS TOOLS

portmetrovancouver.com
ANALYSIS TOOLS
7. Origin Destination Traffic Volume Maps tool• Shows routes taken to and from each of the geofences
• Produces 50 maps total when run

portmetrovancouver.com
ANALYSIS TOOLS

portmetrovancouver.com
ANALYSIS TOOLS
portmetrovancouver.com
IN-DEPTH EXAMPLE
• Now a behind-the-scenes look at the Origin Destination Traffic Volume Maps tool
• Good example of logic we use in doing these different kinds of analysis
• 5-step automated process for each geofence when user runs the tool

portmetrovancouver.com
IN-DEPTH EXAMPLE
• Query trip lines à Count trucks against road à Calculate volume à Change road colour and labels à Export PDF map

portmetrovancouver.com
IN-DEPTH EXAMPLE
• Query trip lines à Count trucks against road à Calculate volume à Change symbology and labels à Export PDF map
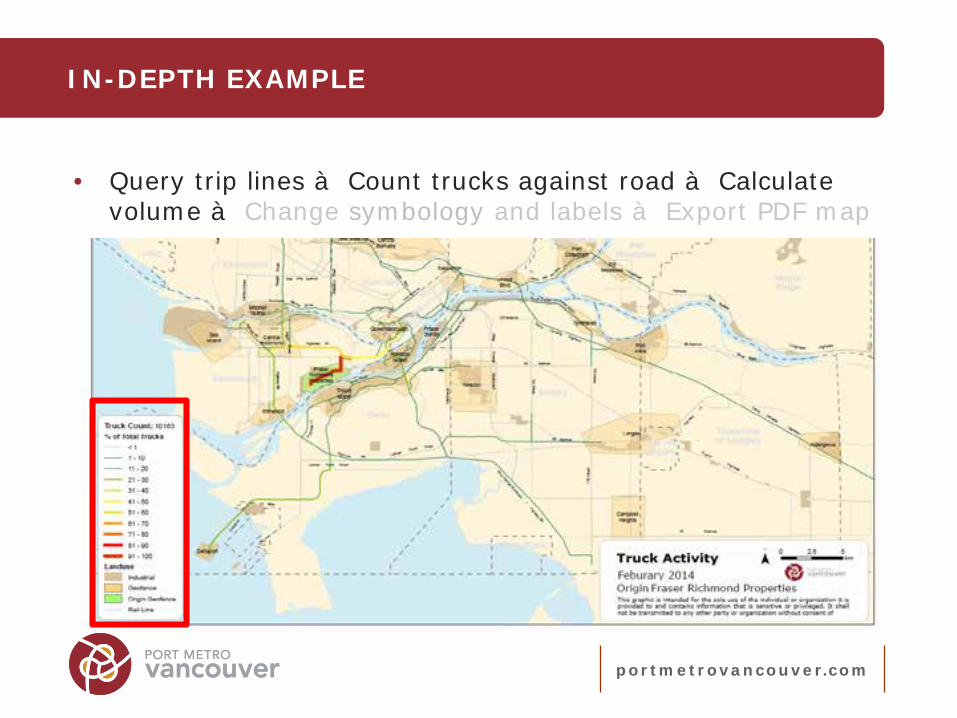
portmetrovancouver.com
IN-DEPTH EXAMPLE
• Query trip lines à Count trucks against road à Calculate volume à Change symbology and labels à Export PDF map

portmetrovancouver.com
IN-DEPTH EXAMPLE
• Query trip lines à Count trucks against road à Calculate volume à Change symbology and labels à Export PDF map

portmetrovancouver.com
IN-DEPTH EXAMPLE
• Query trip lines à Count trucks against road à Calculate volume à Change symbology and labels à Export PDF map

portmetrovancouver.com
• Large volume of data was a challenge• Initial pilot used MS Access
• Due to increasing number of trucks using GPS, we quickly realized data was too large
• Converted to SQL Server for data processing
• Once entire fleet was equipped with GPS, ArcMAP had difficulty processing all the monthly GPS points
• ArcMAP is 32-bit software
• Converted all GPS import tools from Modelbuilder to Python
• Ran successfully in 64-bit Background Geoprocessingenvironment
• Long processing times also a trade-off
CONCLUSION

portmetrovancouver.com
CONCLUSION
• Next steps:• Regional transportation planning
• Make compatible with Translink Traffic Analysis Zones
• Environmental considerations
• Calculate emissions based on truck age, speed, and distance
• Use calculations to create maps of total volumes
• Real-time GPS feed for terminals
• Monitor traffic on-site
• Track how long a truck is on the terminal
• Help terminals avoid paying wait time fees

portmetrovancouver.com
QUESTIONS?
Shane Pittman
Andrew Stanevicius