when should firms share credit with employees? … · when should firms share credit with...
TRANSCRIPT

When should firms share credit with employees?
Evidence from anonymously managed mutual funds*
MASSIMO MASSA
INSEAD
JONATHAN REUTER
Boston College
ERIC ZITZEWITZ
Dartmouth College
April 2009
ABSTRACT
Between 1993 and 2004, the share of mutual funds disclosing manager names to their investors fell significantly.
We argue that the choice between named and anonymous management reflects a tradeoff between the marketing
benefits of naming managers and the costs associated with their increased future bargaining power. Consistent with
this tradeoff, we find that funds with named managers receive more positive media mentions, have greater inflows,
and suffer less return diversion due to within family cross-subsidization, but that departures of named managers
reduce inflows, especially for funds with better past performance. To the extent that the hedge fund boom
differentially increased outside opportunities for successful named managers, we predict that it should have
increased the costs associated with naming managers and led to more anonymous management. Indeed, we find
that the shift towards anonymous management is greater in those asset classes and geographical areas with more
hedge fund activity.
* We would like to thank our anonymous referee, George Aragon, Jim Atkinson, Oriana Bandiera, Daniel
Bergstresser, Keith Brown, Mike Cooper, Diane Del Guercio, Richard Evans, Kenneth French, Matt Gentzkow,
Ilan Guedj, Denis Gromb, Ro Gutierrez, Robert Hall, Campbell Harvey, Thomas Hellman, Ali Hortacsu, Abbott
Keller, Han Kim, Anne Marie Knott, Camelia Kuhnen, Ed Lazear, Niko Matouschek, John Montgomery, Narayan
Naik, M.P. Narayanan, Paul Oyer, Oguzhan Ozbas, Imran Rasul, Nancy Rose, Stefan Ruenzi, Scott Schaefer, Nejat
Seyhun, Kathryn Shaw, Clemens Sialm, Duncan Simester, Christopher Snyder, Laura Starks, Jeremy Stein, Jeroen
Swinkels, Chad Syverson, Sheridan Titman, Peter Tufano, Lu Zheng, and seminar participants at Lipper, Michigan,
Oregon, Stanford, UT-Austin, Utah, Washington University-St. Louis, the 2006 Utah Winter Business Economics
Conference, 2006 European Finance Association meetings, the 2007 American Finance Association meetings, and
the Winter 2007 NBER IO Program Meeting for helpful discussions. We are also grateful to Andrew Clark of
Lipper and Charles Biderman of TrimTabs for sharing daily mutual fund flow data, and to Antti Petajisto and
Martijn Cremers for providing us with their active share measure. We gratefully acknowledge the financial support
of the Q-Group. The paper was previously circulated as “The Rise of Anonymous Teams in Fund Management.”

1
1. Introduction
Mutual fund firms have traditionally chosen to identify a specific individual as the manager of each fund.
For example, Peter Lynch is best known as the manager of Fidelity’s Magellan fund. In 1993, over 70%
of U.S. mutual funds named a single fund manager. Over the next decade, however, funds increasingly
chose to disclose either multiple manager names (co-managers) or that the fund was “team managed”
without naming any specific managers (anonymous managers). The incidence of anonymous
management increases from 4% of the sample in 1993 to 18% in 2004; among newly started funds the
increase is from 3% to 30% (Table 1). In this paper, we use the trend towards anonymous management
to shed light on the costs that mutual fund firms incur and the benefits that they receive from marketing
their managers.
We argue that the choice between named and anonymous management is a strategic decision about
publicly sharing credit for project outcomes with managers. The decision whether to disclose manager
names and share credit is an ex ante decision about the ownership of a track record, a valuable asset.
There are two potential benefits to naming managers. First, if the fund manager “owns” (can credibly
claim credit for) her track record, it can increase her incentive to perform well, increasing manager-firm
joint surplus (Holmström, 1999). Second, as we show, crediting a manager can have marketing benefits.
Just as consumers prefer brands with personalities (Aaker, 1997), the media and investors prefer
investments with plausible stories for why they should outperform (Barber, Heath, and Odean, 2003;
Mullainathan, Schwartzstein, and Shleifer, 2008), and a named manager potentially provides both.
Regardless of whether these preferences are a result of limited attention (Sirri and Tufano, 1998;
Hortascu and Syverson, 2004) or the anticipation of higher quality for rational (or behavioral) reasons, if
investors prefer named managers, naming them can increase joint surplus.
The potential cost to firms from naming managers arises from the increased bargaining power of
successful named managers. In the canonical agency model (Holmström, 1979), a firm chooses a pay-
for-performance scheme that balances the benefits of providing incentives with the cost of inefficiently
sharing risk between a risk-adverse manager and a risk-neutral firm. In our setting, sharing credit
provides incentives for success by increasing the reputation of the manager. However, while sharing
credit increases the bargaining power of successful named managers—allowing them to extract more
rent from the firm—it also exposes managers to greater risk. When success has a significant luck
component, the incentives provided by credit sharing can be stronger than those that would be chosen in
an optimal incentive-pay contract for an unnamed manager. The resulting inefficiency in risk sharing
cannot be eliminated through contracting unless a manager can credibly promise to work for a below-
market wage when successful. If the incentives provided by credit sharing already yield more pay-for-
performance than optimal, firms (and managers) could respond to an increase in outside labor market
2
competition for successful named managers by choosing to share less credit with managers. In our
setting, this would correspond to mutual fund firms responding to the boom in demand for successful
managers from hedge funds by switching to anonymous mutual fund management.
We argue that disclosing manager names involves a tradeoff between marketing benefits, on the one
hand, and costs associated with managerial rent extraction and inefficient risk sharing, on the other. We
study this tradeoff by comparing outcomes for funds that name a sole manager, funds that name multiple
(co-)managers, and funds that keep their managers anonymous. We start by documenting differences in
fund media coverage and demand consistent with named managers providing marketing benefits for
management companies. Funds with one named manager receive significantly more media mentions
than comparable anonymously managed or co-managed funds. For example, the New York Times
“Investing With” column, which profiled a different mutual fund each Sunday, is most likely to feature
sole-managed funds, and more likely to feature co-managed funds than anonymously managed funds. As
one would expect given the existing evidence that media mentions impact fund flows (Sirri and Tufano,
1998; Reuter and Zitzewitz, 2006; Kaniel, Starks, and Vasudevan, 2007), named-manager funds receive
annualized net flows that are approximately 2% of assets higher than received by anonymously managed
funds. The effect is largely driven by funds marketed and sold directly to investors (no-load funds),
where funds with a single named manager receive an additional 3% to 4% of assets per year, depending
on whether we control for the extra media mentions received.1
We also find modest differences in fund returns. Within our sample, the returns of sole-managed and
anonymously managed funds differ by less than 4 basis points per month—whether measured as net
returns, one-factor alphas, or four factor alphas—and none of the differences are statistically significant
at conventional levels. Nevertheless, fund returns are sufficiently noisy that we cannot rule out the
existence of economically meaningful differences. To reduce the impact of this noise, we follow
Grinblatt and Titman (1993) and Kacperczyk, Sialm, and Zheng (2008, hereafter KSZ) and decompose
funds’ pre-expense returns into the future returns of their most recently disclosed equity holdings and the
remainder, which KSZ term the “return gap.” We find that sole-manager funds have return gaps that are
approximately 4 basis points per month more positive than anonymously managed funds.
While positive return gaps are consistent with systematic differences in short-term trading
profitability due to managerial ability or effort, they are also consistent with families strategically
allocating more resources to their named-manager funds. Indeed, additional tests in the spirit of Gaspar,
1 While fund companies may choose whether to name managers in combination with other choices, such as
whether to promote a fund to reporters, in Table 2, we find that a significant fraction of the annual variation in
anonymity is at the level of the mutual fund family. Unreported regressions show that when we use the fraction of a
family’s funds that were anonymously managed in month t-12 to instrument for anonymous management in month
t, OLS and IV estimates of the impact of anonymous management on media mentions and net flows into no-load
funds are quite similar. In these cases, Hausman tests do not allow us to reject the hypothesis of exogeneity.

3
Massa and Matos (2006) suggest that named-manager funds benefit from cross-subsidization. In
particular, return gap differences exist primarily within families. Furthermore, sole-managed domestic
equity funds receive more favorable allocations of underpriced initial public offerings and, within fund
families, sole-managed international equity funds experienced less dilution from market timing or late
trading. Taken together, our evidence suggests that the higher return-gap performance of named
managers is partly due to strategic cross-subsidization by mutual fund firms for marketing purposes.
Interestingly, the differences in net flows are much larger than we would expected given return
differences of just 4 basis points per month, suggesting that the majority of the additional flows into
named-manager funds reflect perceived quality differences that are only partly borne out by differences
in fund returns.
Offsetting the benefits of naming managers are the costs that arise from sharing credit for fund
outcomes. Lacking manager wage data, we provide two alternative sets of tests of whether naming
managers increases their bargaining power when successful. First, we document that net flows into
successful funds are lower following the departure of one or more named manager. Second, we test
whether increases in labor market competition for successful managers are accompanied by accelerated
shifts toward anonymity. Here, we exploit the seven-fold increase in the size of the hedge fund industry
between 1994 and 2004, which created lucrative outside employment opportunities for successful fund
managers, but did so unevenly and asynchronously across asset classes and geographic labor markets.
While the hedge fund boom coincided with the shift to anonymous management, the two time-series
trends need not be related. To address this concern, we adopt a difference-in-difference approach, asking
whether the shift to anonymity was especially pronounced at times when hedge fund asset growth was
especially strong in that asset class or geographical labor market. We find that it was, which is consistent
with the idea that competition from hedge funds increased named managers’ outside options most within
the same asset class or geography. For example, the collapse in 1998 of Long Term Capital
Management, a global macro hedge fund, contributed to the sharp decline of internationally-oriented
hedge fund assets from 28% of total hedge fund assets in 1997 to 4% in 2000. Consistent with this
decline differentially reducing the outside opportunities of named international fund managers, we find
the shift to anonymity slowed substantially more for international mutual funds. Our estimates imply that
the growth in the hedge fund industry between 1994 and 2004 accounted for 10% to 40% of the shift to
anonymous mutual fund management.
Our paper contributes to both the mutual fund literature and a broader literature on employee
contracting and career concerns. We make three contributions to the mutual fund literature. First, we
provide new evidence on mutual fund product differentiation and (indirectly) on the question of how
high fees can coexist with many competitors. When investors face significant search costs and choose to

4
consider only a subset of funds (Hortascu and Syverson 2004), a named manager can provide a “story”
that helps distinguish the fund from its peers. Cooper, Gulen, and Rau (2005) provide related evidence
that flows respond disproportionately to mutual fund name changes, while Jain and Wu (2000) and
Gallaher, Kaniel, and Starks (2007) provide evidence that advertising directly influences fund flows. The
increased product differentiation resulting from naming managers has the potential to increase product
demand and soften price competition. Indeed, the sole-managed funds in our sample receive more media
attention and higher flows, despite charging significantly higher fees.
Second, we contribute to the literature on the strategic behavior of mutual fund families (Nanda,
Wang, and Zheng, 2004; Guedj and Papastaikoudi, 2005; Gaspar, Massa, and Matos, 2006). The fact
that flows into sole-manager funds are the most sensitive to returns gives firms an incentive to favor
these funds, even at the expense of their other funds. Collectively, this literature demonstrates that
families play significant roles in the performance of their funds. Our evidence that sole-managed funds
have significantly higher return gaps, greater holdings of underpriced IPOs, and less return dilution from
stale price arbitrage are consistent with favoritism by families along a previously unexplored dimension.
Moreover, to the extent that named-managed funds have more bargaining power within their families
than anonymously managed funds, our results help to explain why some funds might tolerate cross-
subsidization of other funds within their family.
Third, our study challenges the common (implicit) assumption that manager name disclosures are
informative about the return generating process, rather than strategic disclosures. Examples include
studies of whether certain named managers are more skilled (Chevalier and Ellison, 1999a), as well as a
number of recent papers examining the “team production” of returns (Prather and Middleton, 2002;
Baer, Kempf, and Ruenzi, 2005; Bliss, Potter and Schwarz, 2008). These latter papers compare the
returns of sole-managed and multi-manager funds, find, as we do, that the former are slightly higher, and
conclude that team production leads to inferior results. While it would be excessively cynical to view
manager name disclosures as uninformative about the management process, as one fund firm founder
told us: “fund management always involves multiple people” and disclosure of manager names “are
primarily about what you tell the world.”2 In treating mutual fund disclosures as strategic, we follow
work on window dressing (Lakonishok, Shleifer, Thaler, and Vishny, 1991) and on portfolio disclosure
as a signal of quality (Ge and Zheng, 2006).
More generally, we contribute to the career concerns and optimal contracting literature by
highlighting that the decision to share credit with employees is an important dimension along which
2 We conducted a number of open-ended interviews with fund managers, in which we asked them to explain the
trend in anonymous management. We quote from these interviews occasionally to help to illustrate a point. While
our interviewees’ comments were generally consistent with one another, we recognize that their views need not be
representative of the industry.

5
firms and employees can contract. This literature includes theoretical and empirical work on asset
ownership and hold-up (Williamson, 1979; Grossman and Hart, 1986; Hart and Moore, 1990;
Monteverde and Teece, 1982; Joskow, 1985), asset ownership and incentives (Holmström and Milgrom,
1991; Baker and Hubbard, 2003; Simester and Wernerfeldt, 2005) and career concerns (Holmström,
1999; Chevalier and Ellison, 1999b). We extend this literature by considering the marketing effects of
credit sharing, which are potentially important in other contexts.
Finally, our paper relates to the literature on the economics of superstars (Rosen, 1981; Terviö,
2008). Malmendier and Tate (2009) find that CEOs who win media awards and become “superstars”
earn higher compensation, but that their firms subsequently underperform. In contrast, we find that
named-manager funds earn (weakly) higher returns for their investors and attract more inflows for their
firms but are, nonetheless, becoming less common over our sample period. An important difference
between CEOs and fund managers is that CEOs arguably have more discretion about whether to promote
themselves as stars, and thus CEO stardom could be less an outcome of optimal contracting than a
symptom of suboptimal contracting.
The remainder of the paper is organized as follows. In Section 2 we detail the mutual fund and hedge
fund data used in our analysis. In Section 3, we discuss the empirical determinants of co-management
and anonymous management. In Section 4, we lay out our empirical results: 4.1 presents evidence that
media mentions and investor flows favor named manager funds; 4.2 explores differences in performance
between named-manager and anonymously managed funds; 4.3 presents evidence that the bargaining
power of named managers increases following periods of good relative performance; 4.4 provides
evidence that the use of anonymous management increases with hedge fund assets. In Section 5, we
explicitly consider several alternative hypotheses for our findings on the use of anonymous management.
In Section 6, we offer concluding remarks.
2. Data
Our data come primarily from the CRSP Survivorship-Bias Free Mutual Fund Database. Since the unit
of observation in CRSP is the mutual fund share class, we aggregate data to the portfolio level (using the
prior-period share of assets in each share class) to avoid double counting. In addition, to limit any
potential bias associated with the backfilling of observations in CRSP, we drop observations that lack a
fund name. While CRSP includes a manager name variable, since Morningstar is a more important
source of information for investors than CRSP, we collect manager names from annual Morningstar
Principia CDs (Del Guercio and Tkac, 2008). Merging these data onto CRSP using fund tickers yields a
Morningstar manager name observation for 83.3% of the fund-year observations in CRSP between 1993
and 2004.

6
Both manager name variables allow us to classify a fund as sole-managed (when only one name is
listed), co-managed (when two or more names are listed), or anonymously managed (when the phrase
“Team Managed,” “Multiple Managers,” or “Investment Committee” is listed without any manager
names).3 In Table 1, we summarize the fraction of sole-managed, co-managed, and anonymously
managed funds—and newly introduced funds—according to Morningstar (Panel A) and CRSP (Panel
B).4 To more accurately highlight changes in the form of management, the numbers in both panels are
adjusted for regime changes in the contents of the manager name variables through time. (We describe
these adjustments and report unadjusted numbers in the Appendix.) Both data sources reveal a sharp
increase in the percentage of anonymously managed funds and a decline in the percentage of sole-
managed funds, but the CRSP manager name variable implies significantly higher levels of anonymous
management and significantly lower levels of co-management.5
To determine which data source more accurately reflects the information that funds disclose to their
investors, we compare the Morningstar and CRSP manager name variables to each other and, for a small
random sample of domestic equity funds, to the manager information disclosed in Prospectuses and
Statements of Additional Information filed with the U.S. Securities and Exchange Commission. This
comparison, detailed in the Appendix, reveals several interesting facts. First, between 1993 and 2004,
CRSP rarely reports more than three manager names; during the majority of that time, for most of the
funds for which Morningstar lists four or more manager names, CRSP simply reports “Team Managed.”
This suggests that the CRSP manager name variable does not allow researchers reliably to distinguish
co-managed funds with more than three managers from anonymously managed funds. Since Morningstar
data suggest that the fraction of funds with more than three managers is growing through time, the
fraction of funds that CRSP would lead us to misclassify as anonymously managed is growing as well.
Similarly, between 1997 and 2004, Morningstar reports up to seven manager names per fund, but
between 1993 and 1996 it reports no more than two. The impact of any misclassifications between 1993
3 “Team Managed” is by far the most common entry of the three in either data source. The Morningstar manager
name variable equals “Multiple Manager” in less than 5.0% of the observations that we classify as anonymously
managed according to Morningstar; it never equals “Investment Committee.” The CRSP manager name variable
equals “Multiple Manager” in 2.1% of the observations that we classify as anonymously managed according to
CRSP and it equals “Investment Committee” in another 3.1%. Morningstar defines “Team Managed” as indicating
managers who work together and “Multiple Managers” as indicating those who separately manage portions of the
portfolio. 4 Differences in the number of new funds in Panels A and B of Table 1 are driven by the fact that we use fund
tickers to merge the Morningstar manager name data onto CRSP and fund tickers are most likely to be missing in
the year a fund is started. 5 Using either data source, a small portion of the increase in anonymous management is associated with index
funds. Therefore, to avoid confusing the determinants of anonymous management with the determinants of
indexing, in the analysis that follows, we either include an index fund dummy variable or limit our sample to
actively managed funds. Since CRSP does not identify passively managed (index) funds, we identify index funds
as funds whose name contains the word index, the name of a major index, or some abbreviation thereof.
7
and 1996, however, is limited by the smaller number of funds and smaller fraction of co-managed funds
during these four years.
It is also worth pointing out that the analysis of a random sample of SEC filings for domestic equity
funds suggests that while Morningstar and CRSP both appear to extract manager names from SEC
filings, Morningstar does a significantly better job of capturing the information disclosed to investors. In
2002, we estimate that Morningstar manager name accurately captures whether a fund is anonymously
managed 94.7% of the time, versus 81.3% using the CRSP manager name. For this reason, and the fact
that the Morningstar data are much more likely to inform investor decisions, we use the (unadjusted)
Morningstar manager name variable to classify funds as sole-managed, co-managed, and anonymously
managed.
To ask whether media mentions favor funds with named managers, we use hand-collected data on
mentions of mutual funds in five publications: New York Times, Money, Kiplinger’s Personal Finance,
SmartMoney, and Consumer Reports. For the New York Times, we include funds mentioned in their
Sunday “Investing With” column, which interviewed fund managers and provided details on a fund they
managed. For Money and Consumer Reports, we include only the funds listed in their annual lists of
recommended funds. For Kiplinger’s and SmartMoney, we conduct a Factiva search for articles
including the word “fund” and then categorized the mentions of specific funds as being either positive or
negative. Data on monthly fund family advertising expenditures were purchased from Competitive
Media Research (CMR) and are used in our analysis of media mentions. CMR tracks advertising by firm
and outlet, using its knowledge of published advertising rates and likely discounts to estimate spending.
The media mention and advertising data cover the years 1996 to 2002 and are described further in Reuter
and Zitzewitz (2006).
Data on monthly fund returns come from CRSP. We construct our prior-period holdings return and
return gap variables using the procedure outlined in Kacperczyk, Sialm, and Zheng (2008). Since this
procedure involves merging fund-level equity holdings data from Thomson Financial with mutual fund
data from CRSP, and Thomson Financial does not report debt holdings, we follow KSZ and construct
the return gap only for the sample of non-specialized domestic equity funds. We identify non-specialized
domestic equity funds as those in the CRSP dataset with S&P objective codes of Aggressive Growth
(AGG), Equity USA Midcap (GMC), Equity USA Growth and Income (GRI), Equity USA Growth
(GRO), and Equity USA Small Companies (SCG). To identify recent initial public offerings (IPOs), we
merge the Thomson Financial equity holdings data with the SDC New Issues Database, as described in
Gaspar, Massa and Matos (2006). To study dilution from market timing, we use the daily flow data for a
sample of international equity funds from Lipper and TrimTabs, as described in Zitzewitz (2006). When
8
we estimate risk-adjusted returns, we do so at the fund level, using their prior 24 monthly returns and
factor returns available on Kenneth French’s website.
To ask whether the use of anonymous management is associated with the outside options generated
by the growth of the hedge fund industry, we utilize data on the geographic locations of hedge fund
assets from TASS. Data on the locations of mutual fund families between 1996 and 2002 were hand-
collected from the Nelson Directory of Investment Managers. Data on dollars under management by
hedge funds within each asset class and year between 1994 and 2004 are reported in Getmansky, Lo, and
Wei (2004).
3. Determinants of naming managers
Before testing for differences in outcomes for sole-managed, co-managed, and anonymously managed
funds, we examine the empirical determinants of the disclosure choice. In general, we find that co-
management and anonymous management are chosen by different types of funds. Both types of
disclosure are chosen disproportionately by new funds, however, which is reasonable if changing the
form of disclosure is more difficult to negotiate with ongoing named managers.
In Table 2, we report estimated marginal effects estimated via probit. The first three columns of
each panel estimate determinants of co-management for fund i in year t, while the remaining three
columns do so for anonymous management. The six “level” specifications in Panel A control for the
same set of lagged fund characteristics that we include in later specifications: expense ratios; 12b-1 fees;
portfolio turnover; fund returns, return volatility, and inflows over the prior 12 months; the natural
logarithm of lagged fund and family assets; fund age; and dummy variables for whether the fund is
passively managed (tracks an index) or is a no-load fund (does not charge a sales commission). When
predicting management type, the specifications differ only in the number and type of fixed effects.
Columns 1, 4, 7, and 10 include year fixed effects, columns 2, 5, 8, and 11 include investment objective-
by-year fixed effects, and columns 3, 6, 9, and 12 include family-by-year fixed effects. The “change”
specifications in Panel B mirror those in Panel A except that they add dummy variables that indicate
whether fund i was anonymously managed last year, co-managed last year, or new to the Morningstar
database this year (but not new to the CRSP database because we require lagged values for the other
independent variables). Standard errors are clustered on mutual fund family.
In columns 1-3 and 7-9 of Table 2, we see that the likelihood of co-management increases in fund
size and is higher for actively managed funds. To the extent that larger funds need more managers to
overcome diseconomies of scale, the positive association between fund size and co-management is
consistent with a positive correlation between manager name disclosures and fund production functions
(see also Guedj and Papastaikoudi (2005)). In contrast, in the remaining columns, we see that

9
anonymous management is more common among younger funds, funds with lower expense ratios, and
index funds. In addition, in some specifications, anonymous management is more likely among smaller
funds.
The fact that the determinants of anonymous and co-management are distinct is consistent with our
treatment of anonymous management as being distinct from co-management. That said, one might
expect co-management to provide intermediate levels of the same advantages and disadvantages
provided by anonymity. Sharing credit with multiple managers may not provide as clean a story and thus
may not be as useful for marketing purposes, but it may keep an individual manager from claiming sole
credit for a particular track record. In what follows, we test for differences in outcomes between each of
the three disclosure categories, generally finding that co-managed funds experience outcomes between
those of sole and anonymously managed funds.
4. Benefits and costs of naming managers
We begin by testing for the marketing benefits of naming managers by testing whether named-manager
funds receive extra media coverage and inflows (4.1). Next, we test for performance differences between
named-manager and anonymously managed funds by examining fund returns and their components
(4.2). To shed light on ex post bargaining power, we conduct two types of tests. First, we explore the
extent to which inflows fall when successful named managers depart (4.3). Second, since the growth of
the hedge fund industry should have (exogenously) increased the ex post bargaining power of successful
named managers, we use a difference-in-difference framework to test whether the shift to anonymous
management is greater in those asset classes and geographical areas more affected by the hedge fund
boom (4.4).
4.1. Named managers, the media, and investor demand
Naming managers could benefit funds through increased media attention. In our setting, the financial
media both informs and persuades potential investors. For example, Sirri and Tufano (1998) and Reuter
and Zitzewitz (2006) show that media mentions can significantly increase flows into mutual funds. To
the extent that the financial media prefers to write—or its readership prefers to read—articles about
named managers, families with named-manager funds can expect to benefit. To explore this possibility,
we study the determinants of media mentions and ask whether anonymously managed funds are less
likely to receive mentions than their sole-managed and co-managed peers.
Table 3 presents probit regressions predicting positive media mentions in the New York Times,
Money magazine, Kiplinger’s Personal Finance, SmartMoney, and Consumer Reports, as well as a sixth
specification predicting a positive mention in any of the five publications. The unit of observation is fund

10
i in month t and the sample period is January 1996 through November 2002. In addition to dummy
variables for whether a fund is anonymously managed or co-managed, these regressions control for
expense ratios; 12b-1 fees; portfolio turnover; fund returns, return volatility, and inflows over the prior
12 months; the natural logarithm of lagged fund and family assets; fund age; the number of stars
awarded to the fund by Morningstar in December of the prior year; and an indicator variable for whether
the fund charges a sales commission (load). (Since Morningstar ratings can vary across share classes, we
set our “five star fund” control variable, for example, equal to the share of assets in share classes that
receive a five star rating.) Magazine mentions are treated as having occurred in the month prior to the
issue month and all independent variables are lagged to ensure that no post-mention data is used in their
construction.6
To control for variation in the popularity of different asset classes at different times (and the fact that
not every publication mentions mutual funds in every month), each regression includes a fixed effect for
each investment objective-month combination. Given the finding of Reuter and Zitzewitz (2006) that
advertising influences mentions in some of these publications, we also control for total and own-
publication print advertising expenditure over the prior 12 months. Standard errors are clustered on
mutual fund family.7
We find that anonymously managed funds are less likely to receive positive media mentions than
both sole-managed funds (the omitted category) and co-managed funds. The coefficients on the
anonymous management dummy are negative in all six specifications and statistically significant from
zero in five of the six. Furthermore, in five of the specifications, the coefficient on the anonymous
management dummy is less than the coefficient on the co-managed dummy, and in four of these cases,
we can reject the hypothesis that the coefficients are equal (with p-values ranging from 0.004 to 0.034).
Collectively, these results strongly suggest that the media favors sole-managed funds over co-managed
funds and both types of named-manager funds over anonymously managed funds.8 Since it should be
6 We established this timing based on the fact that, for example, the September issue of a personal finance
magazine almost always appears on newsstands before September 1 and includes return data through July 31,
suggesting that its content was largely written in August. 7 Through the paper, we cluster standard errors on the single dimension (either family or time) that leads to the
largest standard error on the variable of interest. For specifications predicting anonymity, media mentions, or flows
we cluster on family; for specifications predicting returns, we cluster on time. We cluster on family rather than
fund since clustering on family allows for clustering within subgroups of families, including within individual
funds. We have also experimented with two-dimensional clustering (e.g., family and month) and found that
standard errors are quite similar and statistical inferences are unaffected. Conclusions are also unaffected if we use
the procedure outlined in Fama and MacBeth (1973) to estimate coefficients and standard errors. 8 In unreported regressions, we replace the co-management dummy variable with a variable equal to the inverse of
the number of named managers (and zero if the fund was anonymously managed). In this specification, the
anonymous management coefficient estimates the difference between anonymous managed fund and a hypothetical
fund managed by an infinite number of named co-managers. In general, we find results that are consistent with
those in Tables 3, 4, and 5; anonymously managed funds receive significantly fewer media mentions and inflows,

11
more difficult for a journalist to identify and interview anonymous managers, it seems plausible that the
differences we document are causal.9
A comparison of coefficients reveals that the preference for named-manager funds is economically
significant. For instance, relative to being sole-managed, being anonymously managed reduces the
likelihood of a positive mention in any of the five publications (column 6) by about half as much as
being a load fund, or by almost as much as receiving one star (the lowest possible rating) from
Morningstar. In unreported regressions, we find that the preference for named-manager funds is, not
surprisingly, largest in articles profiling a single fund or manager. However, it is still significant for
predicting inclusion in other types of articles and on lists of recommended funds such as the Money 100.
Interestingly, named-manager funds also receive more negative mentions, although this is less of a
disadvantage than one might suppose, since negative mentions are difficult for most investor to act on
(since funds cannot be sold short) and since they are relatively rare. (In our sample of publications, they
are outnumbered by positive mentions by a factor of roughly eight).
In other unreported regressions, we re-estimate the specification predicting any positive media
mention (column 6) separately for each year between 1997 and 2002. We find the strongest preference
for named managers during the bull market between 1998 and 2000. In addition, we find that the
proportion of articles that profiled a single fund and manager was also especially high during this period,
which is consistent with the differences in advertising content during the period documented by
Mullainathan and Shleifer (2006).
As we have argued, the marketing benefits of named managers should not be limited to increased
media mentions, but should extend to higher inflows. To study this issue, in Table 4, we turn from probit
regressions predicting media mentions to linear panel regressions predicting monthly net flows. These
regressions allow us to test whether flows into named-manager funds differ systematically from flows
into anonymously managed funds—both before and after controlling for the impact of media mentions.
The unit of analysis is, again, fund i in month t. For the purposes of this analysis, we restrict our sample
to the 99.84% of observations with continuously compounded monthly flows between -100% and 100%,
and we include the same control variables as in Table 3. In particular, we continue to include fixed
effects for each investment objective-month combination, so that we are effectively measuring each
but their returns are not statistically significantly different from co-managed funds. We thank the referee for
suggesting this alternative specification. 9 In unreported regressions, we find that including co-managed and anonymously managed dummy variables based
on CRSP has little impact on the estimated coefficients on the co-managed and anonymously managed dummy
variables based on Morningstar and provides no additional explanatory power. These findings reinforce our view
that the CRSP manager name variable is essentially just a noisier version of the Morningstar manager name
variable.

12
fund’s flow relative to the average level of flow within the same investment objective and month.
Standard errors are clustered on mutual fund family.
Within our full sample of funds, we find that anonymously managed funds receive monthly net
flows 16.7 basis points lower than those received by comparable sole-manager funds (column 1)
Moreover, we can reject the hypothesis that net flows into anonymously managed funds equal those into
co-managed funds at the 5-percent level (p-value of 0.046). However, the estimates in column 1 mask
significant heterogeneity across mutual fund distribution channels. When we follow Bergstresser,
Chalmers, and Tufano (2008) and allow the impact of anonymous management and co-management on
flows to differ across distribution channels (in columns 2 and 3), we find that anonymity has a greater
impact on flows for those funds marketed and sold directly to retail investors (no-load funds). The
difference between sole-managed and anonymously managed is 23.8 basis points per month for no-load
funds (p-value of 0.028) versus 10.2 basis points for load funds (p-value of 0.249). In column 3, when
we do not control for lagged net flows, the differences are 26.9 basis points per month for no-load funds
(p-value of 0.075) versus 15.1 basis points for load funds (p-value of 0.215).
Under the joint alternative hypothesis that manager name disclosures are nonstrategic and investors
seek to invest in those funds with the highest expected returns, net flows should only favor sole-managed
(or co-managed) funds to the extent that these characteristics proxy for higher expected returns. While
we find some differences in net returns below (in section 4.2), these differences are economically small.
In the remaining columns, we attempt to determine how much of the lower flows into anonymously
managed funds can be explained by the media’s preference for named managers. To do so, we restrict
our sample to 1997-2002, when we possess data on both Morningstar ratings and media mentions.
Columns 4 through 6 include the same control variables as before; columns 7 through 9 add lagged
Morningstar ratings and media mentions. Adding the additional controls reduces the coefficient on
anonymous management by approximately 20% (e.g., from -23.7 basis points in column 4 to -19.4 basis
points in column 7), suggesting that an economically significant fraction—but certainly not all—of the
additional flows into no-load funds are associated with the media mentions in our data. In other words, it
appears that perceived quality differences between named-manager and anonymously managed funds
significantly impact fund flows. Overall, the results in this section lead us to conclude that named
managers benefit their firms through increased media mentions and, especially in the case of no-load
funds, increased flows beyond those simply implied by the increased media attention.
4.2. Named managers and fund performance
We now ask whether named manager funds generate significantly higher returns that their anonymously
managed peers. To the extent that manager name disclosures reflect differences in production functions
which have been optimized across families (Almazan, Brown, Carlson, and Chapman, 2004), mutual
13
fund managers lack skill (Carhart, 1997)), or mutual fund investors equalize expected returns through
their flows (Berk and Green, 2004), we should observe no differences in returns.
Our first set of results on the relation between performance and manager disclosure are reported in
Table 5. In the first three columns of Panel A, we restrict our sample to actively managed domestic
equity funds and use panel regressions to test for differences in the net (after-expense) and risk-adjusted
returns of sole-managed, co-managed, and anonymously managed funds. The set of control variables and
fixed effects mirror those in Table 4, except that in columns 2 and 3, we replace lagged net returns with
lagged one-factor and four-factor alphas, respectively. Standard errors in these (and all other return
regressions) are clustered on month.
We find weak evidence of return differences; coefficients on the anonymously managed dummy
range from -0.7 to -3.4 basis points per month, but are not statistically significant even at the 20-percent
level.10
In columns 4 and 5, we find that anonymously managed funds have significantly lower expense
ratios and portfolio turnover than other funds within the same investment objectives and month.11
(Because expense ratios and portfolio turnover are likely to persist through time, the standard errors in
columns 4 and 5 are clustered on family.) The higher expense ratios on sole-manager funds are
interesting for two reasons. First, they are consistent with sole-managers generating higher revenues for
their firms through increased product differentiation. Second, to the extent that sole-managed funds earn
the same net returns as anonymously managed funds, they do so despite having expense ratios that are
almost 1.5 basis points higher per month.
Given the relatively large standard errors in columns 1 through 3, we cannot rule out the existence of
economically significant differences in performance. To increase the power of our tests, we follow
Grinblatt and Titman (1993) and Kacperczyk, Sialm, and Zheng (2008) and decompose fund net returns
into expense ratios, the gross returns implied by the fund’s previously disclosed holdings, and the
remainder, which KSZ refer to as the “return gap.” Since we possess matched U.S. equity holdings data
for 1994 to 2002, we are able to estimate monthly prior holding returns and monthly return gaps for the
10
This is roughly consistent with other work on returns differences between single and multi-manager funds, a
category that combines co-managed funds together with anonymously managed funds. Using samples that differ in
terms of time periods and types of funds studied Prather and Middleton (2002), Chen, Hong, Huang, and Kubik
(2004), and Bliss, Potter, and Schwarz (2008) find that multi-manager funds underperform sole-managed funds by
between 0 and 4 basis points per month. When we replace our anonymously managed and co-managed dummies
with a multi-manager dummy, and re-estimate the specifications in columns 1 through 3, the coefficients on the
multi-manager dummy are -0.8 (p-value of 0.630), -2.0 (p-value of 0.202), and -2.5 (p-value of 0.063) basis points
per month. Baer, Kempf, and Ruenzi (2005) compare sole-managed funds with anonymously managed funds, as
classified by CRSP, and find slightly larger differences. 11
We classify Potomac, ProFunds, and Rydex funds as specialized domestic equity funds, thereby excluding them
from the analysis in Tables 5 and 6. These funds have exceptionally high portfolio turnover (approximately 20
times the average fund in our sample) and, beginning in 1999, tend to be anonymously managed. Including these
funds changes the sign on the coefficient on the anonymously managed dummy in the analysis of turnover from
negative to positive but does not otherwise alter our results.

14
set of actively managed domestic equity funds over this period (taking care to adjust the prior holdings
return for a fund’s non-stock holdings).12
In the first three columns of Panel B, our dependent variables
are fund i’s net (after-expense) return, the predicted return based on its prior holdings, and its return gap.
We continue to include but do not report coefficients for the control variables.
We find, in column 8, that anonymously managed funds exhibit more negative return gaps than sole-
managed funds. By this less noisy measure of before-expense performance, anonymously managed
funds underperform named-manager funds by 3.5 basis points per month (p-value of 0.084), which is
approximately 42 basis points per year. Moreover, we can reject the hypothesis that the coefficients on
the anonymously managed and co-managed dummies are equal at the 10-percent level (p-value of
0.063). In other words, once we isolate a component of returns that past work has shown to be persistent,
we find evidence that anonymously managed funds underperform their named-manager peers.
What explains the underperformance of anonymously managed funds? One hypothesis, motivated by
the literature on asset ownership and incentives (Holmström and Milgrom, 1991), is that named manager
funds earn higher returns because they attract better managers or induce more effort. Another hypothesis,
motivated by the recent literature on favoritism (Gaspar, Matos, and Massa, 2006), is that named
manager funds earn higher returns because the marketing benefits documented above make it more
profitable for mutual fund families to actively boost the returns of their sole-managed (or co-managed)
funds. To distinguish between these two hypotheses, we explore the determinants of the differences in
return gaps.
As KSZ discuss, a negative return gap can have multiple sources. For example, funds with negative
return gaps could do more trading, thereby paying higher transaction costs in the form of trading
commissions or price impact. We have already seen (column 5), however, that anonymously managed
funds have lower portfolio turnover. When we study the number of stocks that funds report holding at
fiscal year ends (column 10), we find that anonymously managed funds hold less concentrated
portfolios, which is also consistent with anonymously managed funds being less actively managed.
(Almazan et al. (2004) find that multi-manager funds (anonymously managed and co-managed funds
taken together) face more investment restrictions, which is also consistent with anonymously managed
12
When a fund invests less than 100% of its portfolio in common stock, we assume that its non-stock holdings earn
the risk-free rate of return (as reported on Kenneth French's website). To the extent that funds hold long-term bonds
instead of cash, this assumption is imprecise. Fortunately, according to the CRSP database, the bond holdings of
non-specialized domestic equity funds are small (less than 1% of assets on average), and the assumption only
biases our tests to the extent that anonymously managed funds hold a different mix of bonds than named-manager
funds within the same investment objective and month.

15
funds having less active management.) Therefore, the lower returns we find for anonymously managed
funds do not appear to be the result of higher transaction costs arising from active management.13
Does the underperformance of anonymously managed funds reflect favoritism for named-manager
funds? If so, we would expect greater evidence of favoritism in those mutual fund families that have
both anonymously managed and named-manager funds. Indeed, this is what we find. Adding family-
month fixed effects to the return gap regression in column 9 of Table 5 reveals that the named-manager
versus anonymous management difference is larger within families (5.6 basis points per month) than it is
between families. This finding prompts us to conduct two additional sets of tests for favoritism.
Our first set of additional tests is based on the idea that named managers will have to endure less
return diversion in their funds. Specifically, because dilution is one potential contributor to negative
return gaps, we ask whether anonymously managed international funds suffer more dilution due to stale
price arbitrage and late trading. Following Zitzewitz (2006), we use Lipper and TrimTabs daily flow data
to calculate monthly dilution rates for the period 2000 to 2003.14
We find that the average (univariate)
impact of fund arbitrage on returns is 9.2 basis points per month in anonymously managed funds but
only 3.3 basis points per month in named-manager funds. In columns 2 and 3 of Table 6, we report
coefficients from pooled regressions that control for fund characteristics. Without the family-month
fixed effects, we find that the coefficient on the anonymously managed dummy implies 2.7 basis points
more dilution per month than in sole-managed funds (significant at the 1-percent level). Adding family-
month fixed effects, the coefficient increases to 6.1 basis points per month (significant at the 5-percent
level), which suggests that families with a mixture of anonymously managed and named-manager funds
are more willing to permit dilution from stale price arbitrage in their anonymously managed funds.
While we cannot rule out the possibility that named manager funds attract managers who are better able
to prevent stale price arbitrage and late trading, our findings are consistent with families rationally
choosing to favor their named-manager funds.
Our final set of tests is also based on the idea that named manager funds could receive preferential
treatment. Here, we focus on IPOs and ask whether IPO allocations differ across named-manager and
anonymously managed funds. To the extent that families want to boost the performance of their named
13
Whether we should expect active management to be positively or negatively correlated with returns is
controversial. Carhart (1997) finds that a proxy for portfolio transaction costs is negatively correlated with returns,
and Pollet and Wilson (2008) find that holding concentrated portfolios is also negatively correlated with returns. In
contrast, Kacperczyk, Sialm, and Zheng (2005) and Cremers and Petajisto (2008) use different measures and find
that portfolio concentration is positively correlated with returns. 14
Following Zitzewitz (2006), dilution is defined as the sum of the product of daily flows times the difference
between the actual net asset value per share (NAV) used for the transaction and a fair-value NAV as of a time
known to be after the transaction (9 PM Eastern time in this case to allow for possible late trading). Zitzewitz
(2009) discusses alternative methods of measuring dilution. We use the Zitzewitz (2006) method here because it is
the least affected by market returns that follow trading decisions, resulting in the least noisy estimates in short time
periods.

16
manager funds, we expect them to receive more and more valuable IPO allocations. IPO allocations are
not disclosed directly, but funds disclose holdings on a quarterly basis. Following Reuter (2006) and
Gaspar, Massa, and Matos (2006), we use as a proxy for IPO allocations the holdings of an IPO on the
first post-IPO quarterly holdings disclosure. While these holdings would include post-IPO purchases and
exclude IPO shares that were sold before the disclosure date, past work has concluded that this proxy is
likely to be informative about true IPO allocations. To calculate this proxy for IPO allocations, we merge
IPO data from SDC with reported equity holdings data from CDA/Spectrum for our sample of non-
specialty domestic equity funds. To determine the degree of underpricing of each IPO, we use data from
SDC to calculate the percentage increase from the offer price to the first-day closing price.
We consider four (related) measures of the contribution of IPOs to fund performance. In each case,
the unit of observation is fund i in quarter t, and standard errors are clustered on quarter. Recognizing
that reported holdings of recent IPOs are noisy proxies for actual allocations, in column 4, we begin by
focusing on the probability that a fund receives any IPO allocation. The dependent variable is a dummy
variable that equals one if fund i reports holding shares in any of the IPOs that occurred during the past
quarter. We estimate column 4 via probit and report marginal effects. The coefficient on the
anonymously managed dummy variable is -1.8% and statistically significant at the 1-percent level,
suggesting that anonymously managed funds are less likely to receive IPO allocations. Since only 8.9%
of funds report holding shares of any recent IPOs, the size of the difference is economically significant.
In column 5, we explore the relative size of IPO allocations to named-manager and anonymously
managed funds. The dependent variable is the ratio of the value of fund i’s holdings of recent IPOs to the
fund i’s end-of-quarter TNA. Since this variable equals zero much of the time and cannot be negative,
we estimate the coefficients in column 5 via Tobit. The negative and statistically significant coefficient
on the anonymously managed dummy implies that anonymously managed funds receive slightly smaller
IPO allocations than do named-manager funds.
Finding evidence consistent with anonymously managed funds receiving fewer and smaller IPO
allocations than their named-manager peers, we next ask whether anonymously managed funds are less
likely to receive allocations of underpriced IPOs. The dependent variable in column 6 is a dummy
variable that equals one if fund i’s reported holdings suggest that the fund earned positive returns from
underpricing during the past quarter. We estimate column 6 via probit and report marginal effects. The
coefficient on the anonymously managed dummy variable is -2.6% and statistically significant at the 1-
percent level, suggesting that anonymously managed funds are less likely to receive allocations of
underpriced IPOs.
Finally, we attempt to quantity the impact of IPO allocations on fund returns. The dependent
variable in column 7 is the ratio of the total underpricing that we estimate fund i earned over the past

17
quarter based on reported holdings at quarter end to the fund i’s end-of-quarter TNA. This variable is
positive when the fund is estimated to have earned positive underpricing on its IPO holdings, negative
when it is estimated to have earn negative underpricing on its IPO holdings, and zero when the fund does
not report holding shares of any recent IPOs. We estimate the coefficients in column 7 via OLS. The
negative coefficient on the anonymously managed dummy indicates that anonymously managed funds
receive less of a boost to their performance from underpriced IPOs than do sole-managed or co-managed
funds. However, the implied difference in performance is 0.45 basis points per quarter, suggesting that
differences in favorable IPO allocations are but one source of the return gap differences of roughly 4
basis points per month.
Taken as a whole, the results in this section demonstrate that anonymously managed funds earn
slightly lower returns than their named-manager peers and that these lower returns reflect, at least in
part, less favorable IPO allocations and more return dilution from stale price arbitrage. These patterns are
consistent with the family being willing to boost the performance of its named managers to benefit from
the superior marketing impact. They are also consistent with named-manager funds having more
bargaining power within their family than their anonymously managed peers.
In either case, it is interesting to note that these return patterns help to resolve a puzzle raised by the
cross-subsidization literature. This puzzle, first raised in Gaspar, Massa, and Matos (2006), is why
some fund managers would consistently agree to subsidize the funds of other fund managers within
their family. The fact that we find cross-subsidization flowing from anonymously managed funds to
named-manager funds, however, is consistent both with the lower sensitivity of anonymously
managed funds inflows to returns and with the lower bargaining power of anonymous managers.
4.3. Bargaining power and the cost of naming managers
While the above evidence points to several potential benefits of using named managers, their declining
prevalence suggests that using named managers is not costless. In this section, we ask whether named
managers enjoy increased bargaining power following periods of good performance. Ideally, if we
observed wages for both named and anonymous fund managers, we could directly measure the
additional costs of retaining successful named managers. Unfortunately, fund manager wage data are not
publicly available and have proven impossible to obtain. We can, however, draw an inference about
managerial bargaining power from changes in the flow-performance relation when named managers
depart.15
15
According to a pension fund manager that we interviewed, with the rise of hedge funds and private equity funds,
“mutual funds fear that anyone they market based on performance will leave after a year or two, frustrating their
existing investors.” This motivates our analysis in sections 4.3 and 4.4.

18
In Table 7, we extend our earlier analysis of monthly net flows by controlling for the departure of
named managers. In column 1, we replace the fund’s net returns over the prior 12 months with its
within-objective performance ranking over the prior 12 months; this ranking equals zero for the worst
performing fund within the objective and one for the best.16
We also add a dummy variable indicating
whether one or more named managers departed during the prior 12 months. (This dummy variable
equals one if the fund transitioned from named managers to anonymous management. By construction,
the named manager turnover variable is zero for anonymously managed funds because neither investors
nor econometricians are able to observe the turnover of anonymous managers.) To determine whether
flows into anonymously managed and co-managed funds are less sensitive to return rankings, we interact
the return ranking with the anonymously managed and co-managed dummy variables, respectively. To
shed light on the bargaining power of successful named managers, we interact the return ranking with
the named-manager turnover dummy. Column 2 adds controls for the fund’s past return squared and
within-objective rank squared. Column 3 omits the fund’s net flows over the prior 12 months. The
identifying assumption in our tests is that manager turnover is exogenous to future investor demand for
the fund (i.e., managers are not more likely to leave those funds with unexpectedly lower future flows,
conditional on the variables for which we control). As in Table 4, standard errors are clustered on mutual
fund family.
The coefficient on the interaction between within-objective return ranking and named manager
turnover is negative and statistically significant (at the 5-percent level and below) in each of the three
specifications, which suggests that the inflows generated by better performance are attenuated when one
or more named manager departs soon thereafter. The fact that successful named manager departures
reduce fund inflows implies that successful named managers have greater bargaining power with their
firms. This, in turn, implies that named managers should earn more of the rents accruing to good
performance.17
4.4. Hedge fund competition and the anonymous management of mutual funds
According to several industry participants we interviewed, competition from the hedge fund industry for
managers with strong track records increased substantially over the past decade. Despite the fact that
16
We use return rank here only because its zero-to-one scaling makes the coefficients easier to interpret. The
results in Tables 4 and 7 are qualitatively similar regardless of whether we use returns or return rankings. 17
Within a sample of sole-managed equity and bond funds, Khorana (2001) finds that fund performance increases
when managers depart following periods of below-average performance and decreases when managers depart
following periods of above-average performance. Lynch and Musto (2003) find that investors are less likely to
withdraw money from a poorly performing fund when they anticipate that the fund will adopt a new strategy. This
complements our finding in Table 7 that investors’ inflows suggest they expect good performance to be less
persistent when a named manager departs.
19
potential hedge fund employers may be able to identify the managers of anonymously managed funds
through other information channels, when a manager’s role is not acknowledged in databases like
Morningstar, the cost of doing so is increased—for both the potential employer and her clients.18
Therefore, to the extent that the hedge fund boom differentially increased outside opportunities for
successful named managers, it should have increased the costs associated with retaining successful
named managers, reducing ex ante joint surplus when managers are risk averse and leading managers
and firms to prefer more anonymous management. In this section, we test the link between managerial
bargaining power and the incidence of anonymous management by testing whether the use of
anonymous management is greater in those asset classes and geographical areas with more hedge fund
assets.
While the overall growth in hedge fund assets has been close to monotonic, Panel A of Table 8
(based, in part, on data from Getmansky, Lo, and Wei (2004)) reveals that the growth rates of different
asset classes have varied through time. For example, after the crises in Asia, Russia, and Brazil and the
collapse of Long-Term Capital Management in 1997 and 1998, demand for hedge funds in the Emerging
Markets and Global Macro categories declined significantly. Similarly, the asset share of domestic
equity hedge funds peaked with the U.S. stock market, while debt-oriented hedge funds gained share
during the low interest-rate environment between 2002 and 2004. The trends for mutual fund asset
shares, reported in Panel B for comparable asset categories, are much less pronounced. Since a
successful mutual fund manager should be most employable within her broad asset category, the patterns
in Table 8 suggest that competition from the hedge fund industry should have peaked for different
mutual fund asset classes at different times.
In Table 9, to test the impact of hedge fund competition on the labor market for fund managers, we
take two, essentially uncorrelated, difference-in-difference approaches to identification. In the first
approach, we test whether the shift to anonymity was faster in asset classes that experienced faster hedge
fund asset growth. This exploits events such as the collapse in demand for internationally-oriented hedge
funds after LTCM failed in 1998, which was accompanied by a slowdown in the shift to anonymity for
internationally-oriented mutual funds. In the second approach, we test whether the shift to anonymity
was faster in states or cities with faster hedge fund asset growth. In both experiments, we include time
period fixed effects (interacted with either family or investment objective, as appropriate). Since the
general time series growth in hedge fund assets gets absorbed in the time trends, we are exploiting
18
In part, this is for a non-obvious legal reason. In the context of mutual fund prospectuses and advertising,
managers can only take credit for the track record of a prior fund if the management teams, investment objectives,
and strategies of the new and old funds are essentially unchanged. When discussing the precedent set by an SEC
No-Action Letter (dated August 7, 1996) to the Bramwell Growth Fund, Pierce (1999) states that “it would be
difficult to rely on Bramwell to use the performance record of a fund that is run by a committee or by a portfolio
manager whose discretion is limited by supervisory approval or other controls” (p. 25).

20
within-time-period, cross-sectional variation in manager bargaining power. In other words, our test
results are not driven by the fact that the general time-series growth in hedge fund assets coincided with
an increase in anonymity.
First, we test whether funds are more likely to use anonymous teams when same-category hedge
fund assets are higher. The independent variable of interest in columns 1 and 2 of Table 9 is the natural
logarithm of hedge fund assets in the same broad investment objective as fund i, where hedge fund assets
are measured at the end of the prior calendar year. In addition to our standard set of control variables, we
include a separate fixed effect for each investment objective and for each family-year pair. The inclusion
of time period fixed effects ensures that identification comes from cross-sectional variation across hedge
fund asset classes—caused, for example, by the collapse in demand for internationally oriented hedge
funds after LTCM failed in 1998—rather than time-series variation in the overall size of the hedge fund
industry. We also include the natural logarithm of mutual fund assets with the same broad investment
objective as fund i. Column 2 controls for lagged management status, while column 1 does not. Standard
errors are clustered on investment objective.
In both specifications, the coefficients on same-category hedge fund assets are positive and
statistically significant, supporting the hypothesis that the shift to anonymous mutual fund management
was faster in asset classes experiencing faster hedge fund growth. These findings also provide evidence
for our more general hypothesis that mutual funds weigh the expected ex post bargaining costs of
successful managers when deciding whether to use named or anonymous managers.
Second, we test whether the move toward anonymous management was more pronounced in
geographic areas with more overlap between mutual funds and hedge funds, under the assumption that
these are the areas in which labor market competition for successful fund managers should be strongest.
Data from TASS on the business addresses of hedge funds suggest that the U.S. hedge fund industry is
quite concentrated near New York City, with New York State, Connecticut, and New Jersey accounting
for 55%, 7%, and 3% of total assets during our time period.19
Hand-collected data on mutual fund family
locations from the Nelson Directory of Investment Managers reveals that the mutual fund industry is
concentrated in Boston and New York, with these cities accounting for 24% and 16%, respectively, of
the mutual funds assets in our sample.
In columns 3 and 4 of Table 9, we test whether mutual funds in states with more hedge fund assets
are more likely to adopt anonymous management. The new variable of interest is the natural logarithm of
hedge fund assets in the same state as fund i, again measured at the end of the prior calendar year. Since
19
Hedge fund employment appears likewise concentrated in the New York area. For example, of the 175 U.S.-
based jobs in the hedge fund industry listed on efinancialcareers.com on August 14, 2006 for which a location was
provided, 73% were in New York and 11% in suburban New York. Boston had the second most listings of any
major city, with 9%.

21
this variable varies at the state level we are able to include fixed effects for each objective-year pair and
for each family, and the standard errors are clustered on state. The resulting coefficients on same-state
hedge fund assets are positive and statistically significant, confirming our prediction that the shift to
anonymity should have been relatively faster in those states with faster hedge fund asset growth.
Since the majority of hedge fund assets are located in Boston and New York City, as a robustness
check, we focus on the use of anonymous teams in these cities. We include dummy variables indicating
whether fund i is located in Boston or New York City, and we interact these city dummy variables with
the natural logarithm of hedge fund assets at the end of the prior calendar year. These specifications
include objective-year fixed effects and the standard errors are clustered on state.
The coefficients on the Boston and New York City dummies are negative and statistically significant
(at the 10-percent level and below) in both columns. This suggests that, everything else equal, mutual
fund families headquartered in Boston and New York City are less likely to use anonymous
management. However, consistent with our hypothesis that the use of anonymous teams is related to the
level of hedge fund assets, we find that the coefficients on our lagged hedge fund asset-city interaction
terms are positive and statistically significant. The magnitudes of the coefficients are also economically
significant. For example, the coefficients on the interaction terms in column 5 imply that the relative
probability of Boston-based and New York City-based mutual funds reporting anonymous management
increased by 9.7 and 5.6 percentage points from 1996 to 2002, respectively.
Collectively, the results in Table 9 suggest that the move towards anonymous management by
mutual funds was strongest in those asset classes and locations with the most hedge fund assets. It is
worth reiterating that these results are not driven by general time series trends. Rather, because we
include time period fixed effects, we follow a standard difference-in-difference approach and identify off
of cross-sectional differences in the growth of hedge funds in different asset classes or geographical
areas. When we remove the time period fixed effects and use the overall level of hedge fund assets for
identification, our results get much stronger.
5. Discussion
The various coefficients in Table 9 imply that the seven-fold growth of the hedge fund industry explains
between 10% and 40% of the 14 percentage point increase in managerial anonymity reported in Table 1.
While economically significant, there is room for several additional explanations for the rise of
anonymous management. For example, another explanation—which is also consistent with our tradeoff
hypothesis—is that the decline in the media preference for named-manager funds after 2000 reduced the
marketing benefits of naming managers.

22
A second candidate explanation for the rise of anonymous management is that, during our sample
period, mutual fund firms were responding to a growing preference by investors for consistent
management styles—as signaled by consistent management teams. One would expect, however, that a
preference for stable management would lead primarily to increased demand for co-managed funds,
since disclosure of manager names facilitates the monitoring of team stability.
A third possibility is that long-only inefficiencies decreased over our sample period, making it more
difficult to become a star mutual fund manager. Indeed, consistent with this idea, we find evidence (in
unreported regressions) that equity and debt mutual fund returns (risk-adjusted or not) have become less
persistent over our time period. The fact that index funds are likely to be anonymously managed suggests
a fourth (related) candidate explanation for the rise of anonymously managed funds. To the extent that
mutual funds moved towards more mechanical investment strategies over our sample period, they would
have had less need to disclose manager names.20
To explore whether anonymous management proxies
for more mechanical investment strategies we use the measure of active management developed by
Cremers and Petajisto (2008). Active share measures the minimum proportion of the portfolio that
would need to be traded to replicate the benchmark that the fund is supposed to track. To the extent
that funds following mechanical investment strategies can hold more positions and more closely
resemble their index than funds following more traditional stock picking strategies, this alternative
explanation suggests that anonymously managed funds will have significantly lower active shares
than named-manager funds.
In unreported regressions that include the same control variables as the return regressions in
Table 5 (i.e., fund characteristics plus objective-by-month fixed effects), we find that the active
shares of anonymously managed funds are approximately two percentage points lower than the
active shares of sole-managed funds (the omitted category). While this difference is statistically
significant at the 5-percent level, it is economically small given that the cross-sectional standard
deviation of the active share measure is 14%. Moreover, when we add family-by-month fixed
effects, the estimated coefficient on the anonymously managed dummy variable is both attenuated
and no longer statistically significantly different from that of sole-managed funds. In other words,
within families running both sole-managed and anonymously managed funds, the active shares of
the two types of funds are indistinguishable. Overall, we view these findings as being inconsistent
with anonymously managed funds following significantly more mechanical investment strategies
than named-managed funds, especially within the same family.
While the alternative explanations considered above could have contributed to the rise of anonymity
between 1993 and 2004, they are likely to have done so more gradually and uniformly across cities and
20
We thank the referee for suggesting this alternative explanation to us.

23
asset classes. In other words, these alternative explanations are unlikely to explain our findings in Table
9, which exploit within-time-period, cross-sectional variation in manager outside options.
Finally, our interpretation that mutual fund families actively weigh the expected marketing benefits
of named management against the expected rent sharing costs is corroborated by interviews with
numerous mutual fund firms that we conducted at the beginning of the project. When we asked industry
participants to explain the rise of anonymity in Table 1, one CEO stated that “stars are good for
marketing, especially with retail investors, ... but [named] managers are more expensive to pay.”
Providing support for our argument that successful named managers are more valuable to hedge funds,
several industry participants also confirmed that a named manager, especially one who has been
promoted in the media, can more readily attract hedge fund assets than an anonymous manager at an
equally successful fund. This was confirmed in a recent article in the Wall Street Journal, in which
Fidelity described its decision to begin replacing its traditional one manager per fund system with groups
of managers that oversee multiple funds as partly motivated by labor market competition: “the team
approach is also a kind of an insurance policy... so that investors don't flee when a superstar leaves—as
more have in recent years to work for hedge funds.”21
While anecdotal, these statements complement our
statistical evidence that the loss of successful named managers reduces future fund flows and that labor
market competition from hedge funds for successful named managers has increased through time.
6. Conclusion
We study the choice between named and anonymous management in the mutual fund industry and show
that this choice reflects a tradeoff between the marketing benefits of naming managers and the costs
associated with their increased bargaining power. Specifically, we show that the primary benefits of
naming managers arise from additional media mentions and flows. Funds with named managers receive
more positive media mentions, have greater inflows, and suffer less return diversion. Moreover, our
evidence of return differences between named-manager and anonymously managed funds is consistent
with family-level decisions to exploit these marketing benefits. With respect to the added rent-sharing
costs of named managers, we find that inflows decline when successful named managers depart. Finally,
consistent with the growth of the hedge fund industry increasing bargaining power relatively more for
successful named managers, we also find that the shift to anonymous management is greater in those
asset classes and geographical areas with more hedge fund assets.
21
Levitz, Jennifer. “Fidelity, in Reversal, Takes Team Approach --- Group of Managers to Run New Fund Lineup
in Bid to Lift Net-Sales Ranking.” Wall Street Journal 25 Oct 2007: C13.

24
As one of its responses to the mutual fund scandal in 2003, the SEC promulgated a rule requiring the
disclosure of the identity of the five most important members of a portfolio management team.22
These
additional disclosures had not been incorporated into either CRSP or Morningstar data to any significant
extent when we first circulated this paper in March 2006. By December 2006, however, Morningstar was
reporting manager names for almost every fund. While this change technically ends the era of
anonymous management that we study, it appears that anonymity will persist in another form. In
particular, for funds formerly listed as anonymously managed, Morningstar now lists as many as 67
manager names (see the Old Mutual Balanced Fund, OMABX, for example), thereby blurring the
distinction between co-managed and anonymously managed funds.
Our findings have ambiguous implications for the question of whether the mandatory disclosure of
manager names is beneficial for either the industry or the investing public. To the extent that naming
managers results in higher returns, everything else equal, it will benefit investors. The return differences
that we find are fairly small, however, and likely driven by within-family favoritism of named-manager
funds. Consequently, any return benefits of naming formerly anonymous managers—for example in the
form of more equitable allocations of IPOs—likely will come at the expense of less favoritism for their
already named colleagues.
On the other hand, we find that naming managers increases the sensitivity of inflows to their
retention, which should increase their bargaining power and wages. In addition, naming managers likely
increases the differentiation of mutual funds, in that it leads investors to jointly choose firms and
managers. To the extent that these effects help to explain the fact that expense ratios were 17 basis points
higher for named-manager funds, they suggest that eliminating anonymity for any given fund could put
upward pressure on its expenses. The equilibrium consequences for fund expenses of eliminating all
anonymous management are, of course, less clear.
Outside the fund industry, firms also face decisions about whether to share credit with their
employees in ways that allow them to develop reputations independent of the firm. Many CEOs develop
such reputations, as do some engineers (e.g., Steve Wozniak at Apple) and division heads (e.g. Jamie
Dimon while at Citigroup, Carly Fiorina while at Lucent, and Lee Iacocca while at Ford). For some
categories of employees (e.g., print journalists) being allowed such a reputation is the norm, albeit one
from which some employers deviate (e.g., The Economist). When choosing whether to allow their
employees an outside reputation, these firms likely also face a tradeoff between marketing benefits and
retention costs that is similar to the one we document in the context of mutual fund managers.
22
Disclosure Regarding Portfolio Managers of Registered Investment Companies, Security and Exchange
Commission Release 33-8458.

25
At the same time, one might expect the incentive effects of employee stardom to differ depending on
the alignment between an employee’s performance for the firm and what generates stardom. For fund
managers, the route to stardom is generating high returns and a media profile, which also generates
profits for their employer. For journalists, writing high-impact articles likewise serves both the
employer’s and employee’s interests. In contrast, a stardom-seeking CEO, division manager, or engineer
might find that maintaining a public profile is distracting from serving her employer’s goals. Sharing
credit can be in the firm’s interest, but in many cases, firms need to ensure they retain enough credit for
themselves.
26
Appendix. Assessing the accuracy of CRSP and Morningstar manager name data
In this appendix, we compare the Morningstar manager name variable, which retail investors are more
likely to rely upon and which we rely upon in our analysis, with the CRSP manager name variable,
which typically have been relied upon in other academic studies. For a stratified random sample of
domestic equity funds in 2002, we also compare the Morningstar and CRSP manager name variables to
the information disclosed within Prospectuses and Statements of Additional Information.
In Table A1, we summarize the manager name variables from Morningstar (Panel A) and CRSP
(Panel B) for the period 1993-2004. The first six columns indicate the fraction of manager name
variables that report one manager name, two manager names, three manager names, four or more
manager names, anonymous management, or the name of an asset management company (e.g. “Janus
Capital”). These fractions are based on the actual, unadjusted manager name variables. We classify a
fund as anonymously managed when the manager name variable contains a phrase like “Team
Managed,” “Multiple Managers,” or “Investment Committee” and does not list any manager names.23
According to both data sources, there is a substantial decline between 1993 and 2004 in the fraction
of sole-managed funds. For example, according to Morningstar, it falls from 71.0% to 40.6% over our
sample period. The rise in anonymous management is also evident in both data sources, but the increase
is larger and more monotonic using the CRSP manager name variable. The larger number of
anonymously managed funds in CRSP reflects the fact that CRSP rarely reports more than three manager
names, despite evidence from Morningstar that the number of funds with four or more named managers
is increasingly over time. In other words, a significant fraction of the anonymously managed funds
according to CRSP are co-managed funds with four or more named managers. Other differences in the
fraction of anonymous management reflect regime changes in the content of the Morningstar and CRSP
manager name variables.
To more accurately capture the rise in anonymous management, in the last three columns of Table
A1, we adjust the fraction of sole-managed, co-managed, and anonymously managed funds for two such
regime changes. (These adjustments only apply to Tables 1 and A1. The management classification that
we use in all other tables is based on the raw Morningstar manager name variable.) In Panel A, the drop
in the fraction of anonymous management from 17.0% in 1996 to 7.6% in 1997 reflects that the fact that,
prior to 1997, Morningstar classified any fund with more than two named managers as “Team
Managed,” leading us to erroneously classify funds with three or more named managers in the first four
years of our sample as anonymously managed. In the last two columns of Panel A, we use the fact that
23
When the manager name variable includes one or more manager names and the phrase “Team Managed” we use
the number of named managers to classify the fund as sole-managed or co-managed. There are 27 fund-year
observations in which Morningstar reports “No Manager.” The majority of these are index funds and fund of funds.
We classify these funds as being anonymously managed, although none of our results are sensitive to this decision.
27
68.1% of the funds classified by Morningstar as anonymously managed in 1996 are reclassified as co-
managed funds in 1997 to adjust the fractions of co-managed and anonymously managed funds between
1993 and 1996. (Similarly, the drop in the fraction of anonymous management between 2001 and 2002
could reflect Morningstar’s increased propensity in 2002 to list five or more manager names.) In Panel
B, we adjust the fractions of sole-managed, co-managed, and anonymously managed funds for the fact
that CRSP essentially no longer reports firm names in its manager name variable after 1999. Here, we
use the distribution of transitions from “Firm Name” to sole-managed (57.2%), co-managed (20.1%),
and anonymously managed (22.7%) between 1993 and 2000 to re-distribute “Firm Name” funds across
the three categories.
When we examine (in unreported tabulations) how well the CRSP manager classification agrees
with the Morningstar manager classification, we find two interesting patterns. First, agreement on
anonymous management is much higher in 1997-2004 (73.1%) than in 1993-1996 (39.2%), when
Morningstar classifies funds with three or more named managers as anonymously managed. Second, of
the thousands of funds that Morningstar classifies as having four or more named managers, CRSP
classifies 62.6% as being anonymously managed. This reinforces the fact that CRSP tends to misclassify
funds with four or more named managers as anonymously managed.
Our evidence that Morningstar and CRSP both misclassify at least some co-managed funds as
anonymously managed raises a question about the accuracy of either data source. Since our analysis
focuses on a mutual fund’s decision about whether or not to name its managers, we want variation in our
anonymously managed dummy variable to be driven by variation in whether the fund discloses manager
names to its investors—rather than by variation in the rules that Morningstar uses to process the manager
name data.
To assess the extent to which the Morningstar (and CRSP) manager name variables reflect what
mutual funds disclose to their investors, we hand-collect manager data from Prospectuses and Statements
of Additional Information for a random sample of 130 domestic equity funds in 2002. Specifically, we
partitioned the sample into four bins based on whether neither CRSP nor Morningstar classified the fund
as anonymously managed, only CRSP classified the fund as anonymously managed, only Morningstar
classified the fund as anonymously managed, or both CRSP and Morningstar classified the fund as
anonymously managed. We then randomly sampled either 20 or 45 funds from within each bin and
determined the percentage of the funds that report being anonymously managed in their SEC filings.
Table A2 summarizes the findings from this stratified random sample. Overall, we find that
Morningstar more accurately captures the content of the filings than does CRSP. In particular, of the 45
funds that CRSP lists as anonymously managed but that Morningstar does not, we are able to locate one
or more manager name for 37 (82.2%) of the funds. In virtually every one of these cases, the filing states
28
that the fund is team managed but goes on to list manager names, providing further evidence that CRSP
does not reliably distinguish between anonymous management and co-management. In the much less
common case in which Morningstar lists the fund as being anonymously managed but CRSP does not,
Morningstar is correct 60.0% of the time. Extrapolating from the stratified random sample to the full
sample of domestic equity funds in 2002 suggests that Morningstar accurately captures anonymous
management 94.7% of the time versus an 81.3% success rate for CRSP. Thus, it appears that the
Morningstar manager name variable has the double advantages of being better known to investors and
better representative of what mutual funds disclose to investors within their SEC filings.

29
References
Aaker, J., 1997. Dimensions of brand personality. Journal of Marketing Research 34, 347–357.
Almazan, A., Brown, K., Carlson, M, Chapman, D., 2004. Why constrain your mutual fund manager?
Journal of Financial Economics 93, 289–321.
Baer, M., Kempf, A., Ruenzi, S., 2005. Team management and mutual funds. Unpublished working
paper. University of Cologne.
Baker, G., Hubbard, T., 2003. Make versus buy in trucking: Asset ownership, job design and
information. American Economic Review 93, 551–572.
Barber, B., Heath, C., Odean, T., 2003. Good reasons sell: Reason-based choice among individuals and
groups in the stock market. Management Science 49, 1636–1652.
Bergstresser, D., Chalmers, J., Tufano, T., 2008. Assessing the costs and benefits of brokers in the
mutual fund industry. Review of Financial Studies (forthcoming).
Berk, J., Green, R., 2004. Mutual fund flows and performance in rational markets. Journal of Political
Economy 112, 1269–1295.
Bliss, R., Potter, M., Schwarz, C., 2008. Performance characteristics of individual vs. team managed
mutual funds. Journal of Portfolio Management 34, 110-119.
Carhart, M., 1997. On persistence in mutual fund performance. Journal of Finance 52, 57–82.
Chen, J., Hong, H., Huang, M., Kubik, J., 2004. Does fund size erode mutual fund performance? The
role of liquidity and organization. American Economic Review 94, 1276–1302.
Chevalier, J., Ellison, G., 1999a. Are some mutual fund managers better than others? Cross-sectional
patterns in behavior and performance. Journal of Finance 54, 875–899.
Chevalier, J., Ellison, G. 1999b. Career concerns of mutual fund managers. Quarterly Journal of
Economics 114, 389–432.
Cooper, M., Gulen, H., Raghavendra Rau, P., 2005. Changing names with style: Mutual fund name
changes and their effects on fund flows. Journal of Finance 60, 2825–2858.
Cremers, M., Petajisto, A., 2008. How Active is Your Mutual Fund Manager? Review of Financial
Studies (forthcoming).
Del Guercio, D., Tkac, P., 2008. Star power: The effect of Morningstar ratings on mutual fund flow.
Journal of Financial and Quantitative Analysis 43, 907–936.
Fama, E., MacBeth, J., 1973, Risk, return, and equilibrium: Empirical tests. Journal of Political
Economy 81, 607–636.
Gallaher, S., Kaniel, R., Starks, L., 2007. Madison Avenue meets Wall Street. Unpublished working
paper. University of Texas at Austin.

30
Gaspar, J.-M., Massa, M., Matos, P., 2006. Favoritism in mutual fund families? Evidence of strategic
cross-fund subsidization. Journal of Finance 61, 73–104.
Ge, W., Zheng, L., 2006. The frequency of mutual fund portfolio disclosure. Unpublished working
paper. University of Michigan.
Getmansky, M., Lo, A., Wei, S., 2004. Sifting through the wreckage: Lessons from recent hedge fund
liquidations. Journal of Investment Management 2, 6–38.
Grinblatt, M., Titman, S., 1993. Performance measurement without benchmarks: An examination of
mutual fund returns. Journal of Business 66, 47–68.
Grossman, S., Hart, O., 1986. The costs and benefits of ownership. Journal of Political Economy 97,
691–719.
Guedj, I., Papastaikoudi, J., 2005. Can mutual fund families affect the performance of their funds?
Unpublished working paper. University of Texas at Austin.
Hart, O., Moore, J., 1990. Property rights and the nature of the firm. Journal of Political Economy 98,
1119–1158.
Holmström, B., 1979. Moral hazard and observability. Bell Journal of Economics 10, 74-91.
Holmström, B., 1999. Managerial incentive problems, a dynamic perspective. Review of Economic
Studies 66, 169–182.
Holmström, B., Milgrom, P., 1991. Multitask principal-agent analyses: incentive contracts, asset
ownership, and job design. Journal of Law, Economics and Organization 7, 24–52.
Hortascu, A., Syverson, C., 2004. Product differentiation, search costs, and competition in the mutual
fund industry: A case study of S&P 500 index funds. Quarterly Journal of Economics 119, 403–456.
Jain, P.C., Shuang Wu, J., 2000. Truth in mutual fund advertising: Evidence on future performance and
fund flows. Journal of Finance 55, 937–958.
Joskow, P., 1985. Vertical integration and long-term contracts: The case of coal-burning electric
generation plants. Journal of Law, Economics, and Organization 1, 33–80.
Kacperczyk, M., Sialm, C., Zheng, L., 2005. On the industry concentration of actively managed mutual
funds. Journal of Finance 60, 1983–2011.
Kacperczyk, M., Sialm, C., Zheng, L., 2008. Unobserved actions of mutual funds. Review of Financial
Studies 21, 2379-2416.
Kaniel, R., Starks, L., Vasudevan, V., 2007. Headlines and bottom lines: Media coverage and mutual
funds. Unpublished working paper. University of Texas at Austin.
Khorana, A., 2001. Performance changes following top management turnover: Evidence from open-end
mutual funds. Journal of Financial and Quantitative Analysis 36, 371–393.

31
Lakonishok, J., Shleifer, A., Thaler, R., Vishny, R., 1991. Window dressing by pension fund managers.
American Economic Review 81, 227-231.
Lynch, A., Musto, D., 2003. How investors interpret past fund returns. Journal of Finance 58, 2033–
2058.
Malmendier, U., Tate, G., 2009. Superstar CEOs. Quarterly Journal of Economics (forthcoming).
Monteverde, K., Teece, D., 1982. Supplier switching costs and vertical integration in the automobile
industry. Bell Journal of Economics 13, 206–213.
Mullainathan, S., Shleifer, A., 2006. Persuasion in Finance. Unpublished working paper. Harvard
University.
Mullainathan, S., Schwartzstein, J., Shleifer, A., 2008, Coarse thinking and persuasion. Quarterly Journal
of Economics 123, 577-619.
Nanda, V., Wang, J., Zheng, L., 2004. Family values and the star phenomenon. Review of Financial
Studies 17, 667–698.
Pierce, L., 1999. Portability of performance records and the use of related performance information.
Journal of Portfolio Management 3, 22–34.
Pollet, J., Wilson, M., 2008, How does size affect mutual fund behavior? Journal of Finance 63, 2941–
2969.
Prather, L., Middleton, K., 2002. Are N+1 heads better than one? The case of mutual fund managers.
Journal of Economic Behavior and Organization 47, 103–120.
Reuter, J., 2006. Are IPO allocations for sale? Evidence from mutual funds. Journal of Finance 61,
2289–2324.
Reuter, J., Zitzewitz, E., 2006. Do ads influence editors? Advertising and bias in the financial media.
Quarterly Journal of Economics 119, 197–227.
Rosen, S., 1981. The economics of superstars. American Economic Review 71, 845–58.
Simester, D., Wernerfeldt, B., 2005. Determinants of asset ownership: A study of the carpentry trade.
Review of Economics and Statistics 87, 50–58.
Sirri, E., Tufano, P., 1998. Costly search and mutual fund flows. Journal of Finance 53, 1589–1622.
Terviö, M., 2008. Superstars and mediocrities: Market failure in the discovery of talent. Review of
Economic Studies (forthcoming).
Williamson, O., 1979, Transaction-cost economics: The governance of contractual relations. Journal of
Law and Economics 22, 223–261.
Zitzewitz, E., 2006. How widespread was late trading in mutual funds? American Economic Review
Papers and Proceedings 96, 284–289.

32
Zitzewitz, E., 2009. An Eliot effect? Prosecutorial discretion in mutual fund settlement negotiations,
2003-7. Unpublished working paper. Dartmouth College.

Table 1. The use of sole-management, co-management, and anonymous management by U.S. mutual funds, 1993-2004
Panel A. Management Classification According to Morningstar
All Funds Sole Co-managed Anonymous New Funds Sole Co-managed Anonymous
1993 2,102 71.0% 25.1% 3.9% 325 73.2% 24.0% 2.7%
1994 2,572 69.7% 26.4% 3.9% 336 61.0% 32.2% 6.8%
1995 2,866 67.9% 27.7% 4.4% 197 64.5% 31.0% 4.5%
1996 3,094 62.5% 32.1% 5.4% 188 65.4% 28.9% 5.7%
1997 3,345 57.8% 34.6% 7.6% 312 51.9% 33.3% 14.7%
1998 3,827 52.3% 37.0% 10.7% 140 42.1% 41.4% 16.4%
1999 4,082 49.8% 38.2% 12.0% 51 66.7% 17.6% 15.7%
2000 4,300 47.2% 39.7% 13.1% 105 55.2% 21.9% 22.9%
2001 4,423 45.4% 38.2% 16.4% 76 40.8% 38.2% 21.1%
2002 4,388 43.6% 45.3% 11.1% 38 52.6% 31.6% 15.8%
2003 4,726 41.6% 42.0% 16.5% 136 46.3% 26.5% 27.2%
2004 4,937 40.6% 41.1% 18.3% 148 37.8% 31.8% 30.4%
Panel B. Management Classification According to CRSP
All Funds Sole Co-managed Anonymous New Funds Sole Co-managed Anonymous
1993 2,783 79.2% 13.7% 7.1% 408 81.6% 13.7% 4.7%
1994 3,223 76.4% 16.6% 7.0% 406 71.6% 18.6% 9.7%
1995 3,555 74.3% 18.8% 6.9% 317 72.7% 21.3% 6.0%
1996 3,690 68.0% 24.3% 7.7% 261 71.9% 18.6% 9.5%
1997 4,266 62.3% 29.6% 8.1% 471 60.5% 31.5% 8.0%
1998 4,518 59.5% 29.6% 11.0% 233 50.2% 31.3% 18.5%
1999 4,590 53.7% 29.0% 17.3% 76 51.5% 32.1% 16.4%
2000 4,977 49.3% 28.2% 22.4% 135 52.6% 19.3% 28.1%
2001 5,102 46.3% 28.3% 25.4% 94 42.6% 33.0% 24.5%
2002 4,993 43.0% 27.8% 29.2% 60 61.7% 18.3% 20.0%
2003 5,580 40.5% 28.3% 31.2% 175 46.3% 27.4% 26.3%
2004 5,779 39.1% 29.9% 31.0% 331 28.7% 44.1% 27.2%
Notes:
Adjusted Management Classification Adjusted Management Classification
Adjusted Management Classification
This table reports the percentage of both existing and newly started mutual funds that are classified as reporting one manager name (sole-managed), reporting
two or more manager names (co-managed), or reporting no manager names (anonymously managed). We define the newly started funds in year t as those for
which CRSP lists the year organized as t. Since the Morningstar classification likely better reflects the information available to investors, we use the actual values
reported by Morningstar in most of our analysis (see Table A1). However, to better highlight the rise of anonymously managed funds, the numbers and
percentages in this table are adjusted for time-series changes in the rules that CRSP and Morningstar use to classify a mutual fund's management structure. For
the purposes of this table only, in 1993-1996, when Morningstar identified any fund with more than two named managers as anonymous managed, we use the
distribution of transitions in management type between 1996-1997 to impute management type in 1993-1996. From 1993-1999, CRSP's manager name variable
occasionally reports a firm name rather than a manager name. In this table, we use the distribution of transitions from firm names to sole management, co-
management, and anonymous management to adjust the aggregate CRSP statistics.
Adjusted Management Classification

Table 2. Determinants of anonymous management versus co-management, 1994-2004
Panel A. Levels
Dependent Variable:
Index Fund (t-12) -0.204 *** -0.201 *** -0.212 *** 0.072 * 0.055 0.262 ***
(0.037) (0.038) (0.048) (0.047) (0.047) (0.115)
No Load (t-12) 0.025 0.023 0.041 0.013 0.008 0.003
(0.024) (0.024) (0.034) (0.019) (0.019) (0.025)
Expense ratio (t-12) -0.006 -0.019 0.050 ** -0.063 *** -0.077 *** -0.030
(0.018) (0.021) (0.023) (0.019) (0.022) (0.026)
12b-1 fee (t-12) 0.073 0.066 0.021 0.027 0.035 0.034
(0.073) (0.070) (0.059) (0.034) (0.036) (0.056)
Ln Fund TNA (t-1) 0.016 *** 0.017 *** 0.016 ** -0.002 -0.003 -0.006
(0.006) (0.006) (0.007) (0.003) (0.003) (0.005)
Ln Family TNA (t-1) 0.003 0.002 -0.008 * -0.009 *
(0.014) (0.013) (0.000) (0.004) (0.004) (0.000)
Turnover (t-12) -0.000 *** -0.000 *** -0.000 0.000 0.000 ** 0.000
(0.000) (0.000) (0.000) (0.000) (0.000) (0.000)
Fund age (t) 0.000 0.001 0.002 ** -0.002 ** -0.002 ** -0.001
(0.001) (0.001) (0.001) (0.001) (0.001) (0.001)
Net flow (t-12 to t-1) -0.000 0.000 -0.000 0.000 0.000 0.000
(0.000) (0.000) (0.000) (0.000) (0.000) (0.000)
Net return (t-12 to t-1) -0.000 -0.000 -0.001 ** -0.000 -0.001 *** -0.001 ***
(0.000) (0.000) (0.000) (0.000) (0.000) (0.000)
Std dev net return (t-12 to t-1) -0.004 -0.002 -0.006 * 0.001 0.001 0.001
(0.003) (0.003) (0.003) (0.002) (0.002) (0.003)
Fixed effects? Year
Pseudo R2 0.0407 0.0634 0.2015 0.0368 0.0624 0.2450
Sample size 31222 30902 24158 31222 29941 13942
Panel B. Changes
Dependent Variable:
Anonymously managed (t-12) 0.101 *** 0.096 *** 0.134 *** 0.769 *** 0.785 *** 0.857 ***
(0.025) (0.024) (0.029) (0.016) (0.017) (0.019)
Co-managed (t-12) 0.760 *** 0.769 *** 0.787 *** 0.020 *** 0.018 ** 0.027 **
(0.010) (0.009) (0.010) (0.007) (0.007) (0.011)
Fund new to Morningstar database (t) 0.366 *** 0.370 *** 0.353 *** 0.114 *** 0.109 *** 0.229 ***
(0.025) (0.026) (0.040) (0.021) (0.020) (0.058)
Index Fund (t-12) -0.148 *** -0.145 *** -0.164 *** 0.023 0.018 0.106 ***
(0.025) (0.027) (0.034) (0.018) (0.018) (0.051)
No Load (t-12) 0.008 0.006 0.019 0.001 -0.002 -0.001
(0.015) (0.015) (0.021) (0.008) (0.008) (0.017)
Expense ratio (t-12) -0.007 -0.020 0.014 -0.028 *** -0.031 *** -0.022
(0.012) (0.014) (0.016) (0.008) (0.008) (0.014)
12b-1 fee (t-12) 0.042 0.041 0.010 0.001 0.003 0.028
(0.043) (0.043) (0.043) (0.016) (0.016) (0.032)
Ln Fund TNA (t-1) 0.012 *** 0.012 *** 0.011 ** -0.003 * -0.003 ** -0.004
(0.003) (0.004) (0.005) (0.002) (0.002) (0.003)
Ln Family TNA (t-1) 0.001 0.000 -0.003 -0.003
(0.008) (0.007) (0.000) (0.002) (0.002) (0.000)
Turnover (t-12) -0.000 ** -0.000 ** -0.000 0.000 0.000 ** 0.000
(0.000) (0.000) (0.000) (0.000) (0.000) (0.000)
Fund age (t) 0.000 0.001 0.001 ** -0.001 *** -0.001 *** -0.000
(0.000) (0.000) (0.001) (0.000) (0.000) (0.000)
Net flow (t-12 to t-1) 0.000 -0.000 0.000 0.000 0.000 0.000
(0.000) (0.000) (0.000) (0.000) (0.000) (0.000)
Net return (t-12 to t-1) -0.000 0.000 -0.001 -0.000 -0.000 ** -0.000
(0.000) (0.000) (0.000) (0.000) (0.000) (0.000)
Std dev net return (t-12 to t-1) -0.002 -0.001 -0.004 0.001 0.002 0.002
(0.002) (0.003) (0.002) (0.001) (0.001) (0.002)
Fixed effects? Year
Pseudo R2 0.4439 0.4604 0.5163 0.4869 0.5090 0.5831
Sample size 31222 30902 24158 31222 29941 13942
Note: This table reports marginal effects estimated via probit. The unit of observation is fund i in January of year t. The dependent variable equals 1 if M
1)". It is the continuously compounded growth in assets minus the continuously compounded net return. "Std dev net return (t-12 to t-1)" is the
standard deviation of fund i's net return over the prior twelve months. Standard errors are clustered on mutual fund family. Columns 1, 4, 7, and
9 include a separate fixed effect for each year; columns 2, 5, 8, and 10 include a separate fixed effect for each investment objective each year;
columns 3, 6, 9, and 12 include a separate fixed effect for each mutual fund family each year. Significance at the 10-, 5-, and 1-percent levels (in
a two-sided test) is denoted by *, **, and ***.
Objective*Year Family*Year Year Objective*Year Family*Year
Objective*Year Family*Year Year Objective*Year Family*Year
Co-managed (t) Anonymously managed (t)
(1) (2) (3) (4) (5) (6)
Co-managed (t) Anonymously managed (t)
(7) (8) (9) (10) (11) (12)
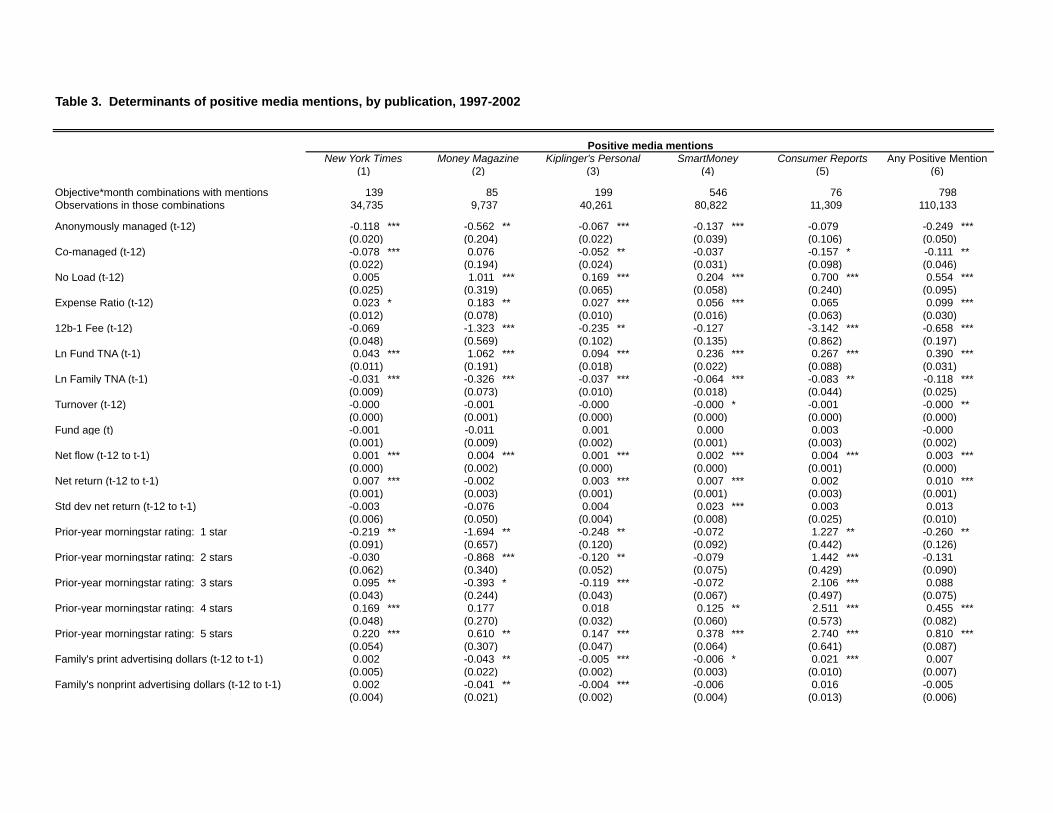
Table 3. Determinants of positive media mentions, by publication, 1997-2002
Objective*month combinations with mentions 139 85 199 546 76 798
Observations in those combinations 34,735 9,737 40,261 80,822 11,309 110,133
Anonymously managed (t-12) -0.118 *** -0.562 ** -0.067 *** -0.137 *** -0.079 -0.249 ***
(0.020) (0.204) (0.022) (0.039) (0.106) (0.050)
Co-managed (t-12) -0.078 *** 0.076 -0.052 ** -0.037 -0.157 * -0.111 **
(0.022) (0.194) (0.024) (0.031) (0.098) (0.046)
No Load (t-12) 0.005 1.011 *** 0.169 *** 0.204 *** 0.700 *** 0.554 ***
(0.025) (0.319) (0.065) (0.058) (0.240) (0.095)
Expense Ratio (t-12) 0.023 * 0.183 ** 0.027 *** 0.056 *** 0.065 0.099 ***
(0.012) (0.078) (0.010) (0.016) (0.063) (0.030)
12b-1 Fee (t-12) -0.069 -1.323 *** -0.235 ** -0.127 -3.142 *** -0.658 ***
(0.048) (0.569) (0.102) (0.135) (0.862) (0.197)
Ln Fund TNA (t-1) 0.043 *** 1.062 *** 0.094 *** 0.236 *** 0.267 *** 0.390 ***
(0.011) (0.191) (0.018) (0.022) (0.088) (0.031)
Ln Family TNA (t-1) -0.031 *** -0.326 *** -0.037 *** -0.064 *** -0.083 ** -0.118 ***
(0.009) (0.073) (0.010) (0.018) (0.044) (0.025)
Turnover (t-12) -0.000 -0.001 -0.000 -0.000 * -0.001 -0.000 **
(0.000) (0.001) (0.000) (0.000) (0.000) (0.000)
Fund age (t) -0.001 -0.011 0.001 0.000 0.003 -0.000
(0.001) (0.009) (0.002) (0.001) (0.003) (0.002)
Net flow (t-12 to t-1) 0.001 *** 0.004 *** 0.001 *** 0.002 *** 0.004 *** 0.003 ***
(0.000) (0.002) (0.000) (0.000) (0.001) (0.000)
Net return (t-12 to t-1) 0.007 *** -0.002 0.003 *** 0.007 *** 0.002 0.010 ***
(0.001) (0.003) (0.001) (0.001) (0.003) (0.001)
Std dev net return (t-12 to t-1) -0.003 -0.076 0.004 0.023 *** 0.003 0.013
(0.006) (0.050) (0.004) (0.008) (0.025) (0.010)
Prior-year morningstar rating: 1 star -0.219 ** -1.694 ** -0.248 ** -0.072 1.227 ** -0.260 **
(0.091) (0.657) (0.120) (0.092) (0.442) (0.126)
Prior-year morningstar rating: 2 stars -0.030 -0.868 *** -0.120 ** -0.079 1.442 *** -0.131
(0.062) (0.340) (0.052) (0.075) (0.429) (0.090)
Prior-year morningstar rating: 3 stars 0.095 ** -0.393 * -0.119 *** -0.072 2.106 *** 0.088
(0.043) (0.244) (0.043) (0.067) (0.497) (0.075)
Prior-year morningstar rating: 4 stars 0.169 *** 0.177 0.018 0.125 ** 2.511 *** 0.455 ***
(0.048) (0.270) (0.032) (0.060) (0.573) (0.082)
Prior-year morningstar rating: 5 stars 0.220 *** 0.610 ** 0.147 *** 0.378 *** 2.740 *** 0.810 ***
(0.054) (0.307) (0.047) (0.064) (0.641) (0.087)
Family's print advertising dollars (t-12 to t-1) 0.002 -0.043 ** -0.005 *** -0.006 * 0.021 *** 0.007
(0.005) (0.022) (0.002) (0.003) (0.010) (0.007)
Family's nonprint advertising dollars (t-12 to t-1) 0.002 -0.041 ** -0.004 *** -0.006 0.016 -0.005
(0.004) (0.021) (0.002) (0.004) (0.013) (0.006)
Consumer Reports Any Positive Mention
Positive media mentions
New York Times Money Magazine Kiplinger's Personal SmartMoney
(5) (6)(1) (2) (3) (4)

Own-publication advertising dollars (t-12 to t-1) -0.049 0.453 *** 0.147 *** 0.275 ***
(0.038) (0.123) (0.054) (0.183)
Ho: Anonymous = Co-managed 0.034 ** 0.004 *** 0.282 0.034 ** 0.500 0.008 ***
Objective*month fixed effects? Yes Yes Yes Yes Yes Yes
Clustering Family Family Family Family Family Family
Pseudo R2 0.182 0.342 0.298 0.260 0.360 0.290
Observed probability (times 100) 0.443 4.591 0.939 1.341 5.474 2.370
Predicted probability (times 100, at x-bar) 0.119 0.667 0.096 0.252 0.364 0.423
Note: Each column reports marginal effects from a probit regression estimated for positive media mentions in a single publication or, in column (6), for a positive media mention in any of the five
publications. We include a separate fixed effect for each investment objective each month. "Anonymously managed (t-12)" is a dummy variable that equals one if Morningstar lists fund i as
being managed by unnamed managers in month t-12. "Co-managed (t-12)" is a dummy variable that equals one if Morningstar lists fund i as being managed by multiple named managers in
month t-12. (Sole-managed funds are the omitted category.) Fund characteristics come from CRSP. "No Load (t-12)" is a dummy variable that equals one if CRSP lists fund i as charging a
sales commission. "Expense ratio (t-12)" and "12b-1 fee (t-12)" are fund's lagged expense ratio and 12b-1 fee. Log Fund TNA (t-1) and "Log Family TNA (t-1)" are the natural logarithm of
dollars under management by fund i and by its family in month t-1. "Turnover (t-12)" is lagged portfolio turnover. "Fund age in years (t)" is the number of years between fund i's inception
(according to CRSP) and month t. "Net Return (t-12 to t-1)" is defined as the natural logarithm of one plus the return of fund~i between months t-12 and t-1. "Net Flow (t-12 to t-1)" is defined
as the natural logarithm of one plus the growth in fund~i's TNA between months t-12 and t-1 minus "Net Returns (t-12 to t-1)". It is the continuously compounded growth in assets minus the
continuously compounded net return. "Std dev net return (t-12 to t-1)" is the standard deviation of fund i's net return over the prior twelve months. Morningstar ratings from December of the
prior year are used to create five dummy variables (corresponding to ratings between one and five stars). Since Morningstar ratings are awarded at the share class level, these dummy
variables are then multiplied by the fraction of fund i's dollars under management that receive each rating. "Family's print advertising to assets ratio (t-12 to t-1)" is defined as family i's total
print advertising expenditures between months t-12 and t-1 divided by the average assets under management in family i during the same twelve-month period. "Own publication advertising
(t-12 to t-1)" is defined as family j's total advertising expenditure in publication between months t-12 and t-1. We exclude this variable when predicting media mentions in Consumer Reports
(which does not accept advertising) and in the set of all five publications. The advertising data were acquired from Competitive Media Research and are described in Reuter and Zitzewitz
(2006); they are measured in millions of dollars. Standard errors are clustered on mutual fund family. Significance at the 10-percent, 5-percent, and 1-percent levels (in a two-sided test) is
denoted by *, **, and ***.

Table 4. Determinants of monthly net flows
Sample Period:
Anonymously managed (t-12) -0.167 ** -0.238 ** -0.269 * -0.237 ** -0.410 *** -0.407 ** -0.194 ** -0.351 *** -0.330 *
(0.073) (0.108) (0.151) (0.096) (0.135) (0.189) (0.095) (0.135) (0.184)
Co-managed (t-12) -0.027 -0.083 -0.134 -0.030 -0.093 -0.118 -0.016 -0.072 -0.081
(0.042) (0.061) (0.083) (0.051) (0.070) (0.095) (0.048) (0.067) (0.088)
Anonymously managed (t-12) x Load (t-12) 0.136 0.118 0.358 * 0.320 0.323 * 0.286
(0.133) (0.187) (0.188) (0.249) (0.189) (0.242)
Co-managed (t-12) x Load (t-12) 0.097 0.161 0.115 0.171 0.103 0.131
(0.077) (0.109) (0.087) (0.125) (0.086) (0.117)
Load (t-12) 0.010 -0.039 -0.096 0.106 0.021 -0.012 0.212 *** 0.134 * 0.152
(0.058) (0.062) (0.085) (0.066) (0.070) (0.098) (0.072) (0.074) (0.100)
Expense ratio (t-12) 0.043 0.041 0.135 * -0.014 -0.018 0.050 -0.001 -0.005 0.077 **
(0.072) (0.073) (0.077) (0.036) (0.037) (0.040) (0.035) (0.035) (0.038)
12b-1 Fee (t-12) -0.072 -0.074 -0.087 -0.046 -0.037 0.053 0.042 0.049 0.136
(0.138) (0.138) (0.195) (0.135) (0.134) (0.215) (0.137) (0.135) (0.200)
Ln Fund TNA (t-1) -0.170 *** -0.171 *** -0.056 * -0.167 *** -0.168 *** -0.047 -0.239 *** -0.239 *** -0.155 ***
(0.022) (0.022) (0.032) (0.024) (0.024) (0.036) (0.027) (0.027) (0.037)
Ln Family TNA (t-1) 0.100 *** 0.100 *** 0.091 *** 0.092 *** 0.092 *** 0.077 *** 0.101 *** 0.101 *** 0.086 ***
(0.017) (0.017) (0.023) (0.018) (0.018) (0.026) (0.018) (0.018) (0.024)
Turnover (t-12) -0.000 -0.000 -0.000 -0.000 -0.000 -0.000 -0.000 -0.000 -0.000
(0.000) (0.000) (0.000) (0.000) (0.000) (0.000) (0.000) (0.000) (0.000)
Fund age (t) -0.005 *** -0.005 *** -0.024 *** -0.004 ** -0.004 ** -0.023 *** 0.002 0.002 -0.008 ***
(0.001) (0.001) (0.002) (0.002) (0.002) (0.003) (0.001) (0.001) (0.002)
Net flows (t-12 to t-1) 0.030 *** 0.030 *** 0.030 *** 0.030 *** 0.028 *** 0.028 ***
(0.002) (0.002) (0.002) (0.002) (0.002) (0.002)
Net return (t-12 to t-1) 0.064 *** 0.064 *** 0.087 *** 0.058 *** 0.058 *** 0.079 *** 0.055 *** 0.055 *** 0.071 ***
(0.003) (0.003) (0.004) (0.003) (0.003) (0.004) (0.003) (0.003) (0.004)
Std dev net return (t-12 to t-1) 0.011 0.011 0.062 *** 0.000 -0.000 0.056 *** -0.004 -0.005 0.038 **
(0.016) (0.016) (0.019) (0.016) (0.016) (0.018) (0.016) (0.016) (0.018)
Ho: Anonymous = Co-managed (All Funds) 0.046 ** 0.023 ** 0.054 **
Ho: Anonymous = Co-managed (No-Load) 0.111 0.337 0.009 *** 0.101 0.025 ** 0.154
Ho: Anonymous = Co-managed (Load) 0.202 0.165 0.589 0.425 0.677 0.585
Objective*Month fixed effects? Yes Yes Yes Yes Yes Yes Yes Yes Yes
Control for prior-year Morningstar ratings? No No No No No No Yes Yes Yes
Control for prior media mentions? No No No No No No Yes Yes Yes
Clustering
R-squared 0.1222 0.1222 0.0923 0.1199 0.12 0.0912 0.1226 0.1227 0.1
Sample size 379,621 379,621 379,621 225,727 225,727 225,727 225,727 225,727 225,727
Note: In this table, we estimate the determinants of monthly net flows in a panel regression with a separate fixed effect for each investment objective each month. The dependent variable is the natural logarithm of 1
plus the change in TNA between months t and t+1 minus the natural logarithm of 1 plus the fund's return between months t and t+1, which is the continuously compounded rate of growth in the fund assets
minus the continuously compounded monthly return. We limit the sample to the 99.84% of fund-month observations with continuously compounded inflows between -100 percent and +100 percent. The
independent variables are defined in the notes to Table 2. Columns (4) through (6) restrict the sample to 1997-2002, when we possess data on both lagged Morningstar ratings and lagged media mentions.
Columns (7) through (9) extend columns (4) through (6) but control for the prior-year's Morningstar ratings and media mentions in NYT, Money, Kiplinger's, SmartMoney, and Consumer Report between months
t-11 and t. Standard errors are clustered on mutual fund family. Significance at the 10-percent, 5-percent, and 1-percent levels (in a two-sided test) is denoted by *, **, and ***.
Family Family Family FamilyFamilyFamilyFamily Family Family
(4) (6)
1997-2002
(9)
1994-2004 1997-2002
(1) (3) (7)(2) (5) (8)
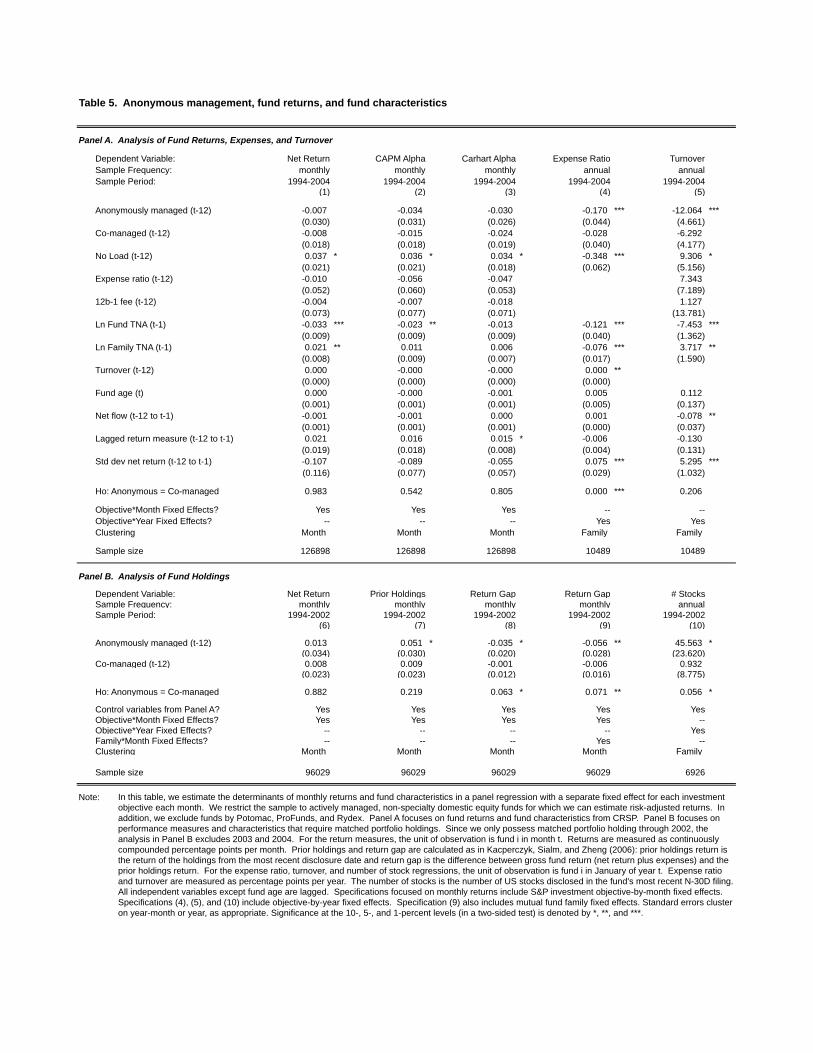
Table 5. Anonymous management, fund returns, and fund characteristics
Panel A. Analysis of Fund Returns, Expenses, and Turnover
Dependent Variable: Net Return CAPM Alpha Carhart Alpha Expense Ratio Turnover
Sample Frequency: monthly monthly monthly annual annual
Sample Period: 1994-2004 1994-2004 1994-2004 1994-2004 1994-2004
(1) (2) (3) (4) (5)
Anonymously managed (t-12) -0.007 -0.034 -0.030 -0.170 *** -12.064 ***
(0.030) (0.031) (0.026) (0.044) (4.661)
Co-managed (t-12) -0.008 -0.015 -0.024 -0.028 -6.292
(0.018) (0.018) (0.019) (0.040) (4.177)
No Load (t-12) 0.037 * 0.036 * 0.034 * -0.348 *** 9.306 *
(0.021) (0.021) (0.018) (0.062) (5.156)
Expense ratio (t-12) -0.010 -0.056 -0.047 7.343
(0.052) (0.060) (0.053) (7.189)
12b-1 fee (t-12) -0.004 -0.007 -0.018 1.127
(0.073) (0.077) (0.071) (13.781)
Ln Fund TNA (t-1) -0.033 *** -0.023 ** -0.013 -0.121 *** -7.453 ***
(0.009) (0.009) (0.009) (0.040) (1.362)
Ln Family TNA (t-1) 0.021 ** 0.011 0.006 -0.076 *** 3.717 **
(0.008) (0.009) (0.007) (0.017) (1.590)
Turnover (t-12) 0.000 -0.000 -0.000 0.000 **
(0.000) (0.000) (0.000) (0.000)
Fund age (t) 0.000 -0.000 -0.001 0.005 0.112
(0.001) (0.001) (0.001) (0.005) (0.137)
Net flow (t-12 to t-1) -0.001 -0.001 0.000 0.001 -0.078 **
(0.001) (0.001) (0.001) (0.000) (0.037)
Lagged return measure (t-12 to t-1) 0.021 0.016 0.015 * -0.006 -0.130
(0.019) (0.018) (0.008) (0.004) (0.131)
Std dev net return (t-12 to t-1) -0.107 -0.089 -0.055 0.075 *** 5.295 ***
(0.116) (0.077) (0.057) (0.029) (1.032)
Ho: Anonymous = Co-managed 0.983 0.542 0.805 0.000 *** 0.206
Objective*Month Fixed Effects? Yes Yes Yes -- --
Objective*Year Fixed Effects? -- -- -- Yes Yes
Clustering
Sample size 126898 126898 126898 10489 10489
Panel B. Analysis of Fund Holdings
Dependent Variable: Net Return Prior Holdings Return Gap Return Gap # Stocks
Sample Frequency: monthly monthly monthly monthly annual
Sample Period: 1994-2002 1994-2002 1994-2002 1994-2002 1994-2002
(6) (7) (8) (9) (10)
Anonymously managed (t-12) 0.013 0.051 * -0.035 * -0.056 ** 45.563 *
(0.034) (0.030) (0.020) (0.028) (23.620)
Co-managed (t-12) 0.008 0.009 -0.001 -0.006 0.932
(0.023) (0.023) (0.012) (0.016) (8.775)
Ho: Anonymous = Co-managed 0.882 0.219 0.063 * 0.071 ** 0.056 *
Control variables from Panel A? Yes Yes Yes Yes Yes
Objective*Month Fixed Effects? Yes Yes Yes Yes --
Objective*Year Fixed Effects? -- -- -- -- Yes
Family*Month Fixed Effects? -- -- -- Yes --
Clustering
Sample size 96029 96029 96029 96029 6926
Note: In this table, we estimate the determinants of monthly returns and fund characteristics in a panel regression with a separate fixed effect for each investment
objective each month. We restrict the sample to actively managed, non-specialty domestic equity funds for which we can estimate risk-adjusted returns. In
addition, we exclude funds by Potomac, ProFunds, and Rydex. Panel A focuses on fund returns and fund characteristics from CRSP. Panel B focuses on
performance measures and characteristics that require matched portfolio holdings. Since we only possess matched portfolio holding through 2002, the
analysis in Panel B excludes 2003 and 2004. For the return measures, the unit of observation is fund i in month t. Returns are measured as continuously
compounded percentage points per month. Prior holdings and return gap are calculated as in Kacperczyk, Sialm, and Zheng (2006): prior holdings return is
the return of the holdings from the most recent disclosure date and return gap is the difference between gross fund return (net return plus expenses) and the
prior holdings return. For the expense ratio, turnover, and number of stock regressions, the unit of observation is fund i in January of year t. Expense ratio
and turnover are measured as percentage points per year. The number of stocks is the number of US stocks disclosed in the fund's most recent N-30D filing.
All independent variables except fund age are lagged. Specifications focused on monthly returns include S&P investment objective-by-month fixed effects.
Specifications (4), (5), and (10) include objective-by-year fixed effects. Specification (9) also includes mutual fund family fixed effects. Standard errors cluster
on year-month or year, as appropriate. Significance at the 10-, 5-, and 1-percent levels (in a two-sided test) is denoted by *, **, and ***.
Month Month Month Family Family
Month Month Month Month Family

Table 6. Anonymous management, return dilution due to stale price arbitrage and late trading, and IPO allocations
Sample:
Dependent Variable:
Returns Dilution Dilution
Any IPOs
Dummy?
IPOs as
Fraction of TNA
Hot IPOs
Dummy?
Underpricing as
Fraction of
Fund TNA
Sample Frequency: monthly monthly monthly quarterly quarterly quarterly quarterly
Estimation: OLS OLS OLS Probit Tobit Probit OLS
Report: coefficients coefficients coefficients marginal effects coefficients marginal effects coefficients
(1) (2) (3) (4) (5) (6) (7)
Anonymously managed (t-12) -0.095 -0.027 *** -0.061 ** -0.018 *** -8.137 *** -0.026 *** -45.146 **
(0.089) (0.009) (0.024) (0.006) (2.309) (0.008) (17.484)
Co-managed (t-12) -0.110 -0.012 * -0.028 * -0.010 *** -2.036 -0.017 *** -13.853
(0.086) (0.007) (0.014) (0.005) (1.532) (0.006) (15.236)
Ho: Anonymous = Co-managed 0.850 0.117 0.050 ** 0.09 * 0.01 *** 0.09 * 0.02 **
Control variables from Table 5? Yes Yes Yes Yes Yes Yes Yes
Objective*Month fixed effects? Yes Yes Yes Yes Yes Yes Yes
Family*Month fixed effects? -- -- Yes -- -- -- --
Clustering
Sample size 6336 6336 6336 37138 45139 30331 44474
Note:
Non-Specialized Domestic Equity, 1994-2002
This table explores two potential explanations for the lower return gaps of anonymously managed funds. In the first three specifications, we focus on dilution due to stale price arbitrage and late trading in
international equity funds. Within the small sample of international equity fund-months for which Lipper and TrimTabs daily flow data are available, dilution is calculated as in Zitzewitz (2006). Estimation is via
OLS, and includes S&P investment objective-by-month fixed effects, as well as the full set of control variables from Table 5; column 3 includes mutual fund family fixed effects as well. In the remaining four
specifications, we focus on IPO allocations to anonymously managed funds. Our sample is restricted to non-specialty domestic equity funds between 1994 and 2002. Following Reuter (2006) and Gaspar, Matos,
and Massa (2006), we construct proxies for IPO allocations from reported holdings of recent IPOs. We consider four (related) measures of the contribution of IPOs to fund performance. The dependent variable in
column 4 is a dummy variable that equals one if fund i reported holding shares in any of the IPOs that occured during the past quarter. We estimate the specifications in column 4 via probit and report marginal
effects. The dependent variable in column 5 is the ratio of the value of fund i's holdings of recent IPOs to the fund's end-of-quarter TNA. Since this variable equals zero much of the time and cannot be negative,
we estimate the specification in column 5 via Tobit. The dependent variable in column 6 is a dummy variable that equals one if fund i's reported holdings suggest that it earned positive returns from underpricing
during the past quarter. We estimate the specifications in column 6 via probit and report marginal effects. Finally, the dependent variable in column 7 is the ratio of the total underpricing that we estimate fund i
earned over the past quarter based on reported holdings at quarter end to the fund's end-of-quarter TNA. Since this variable can be negative, zero, or positive, we estimate specification 7 via OLS; however, we
trim the top 1% of the positive and negative values. Standard errors are clustered on date. Significance at the 10-, 5-, and 1-percent levels (in a two-sided test) is denoted by *, **, and ***.
International Equity, 1998-2003
Month Month Month Quarter Quarter Quarter Quarter
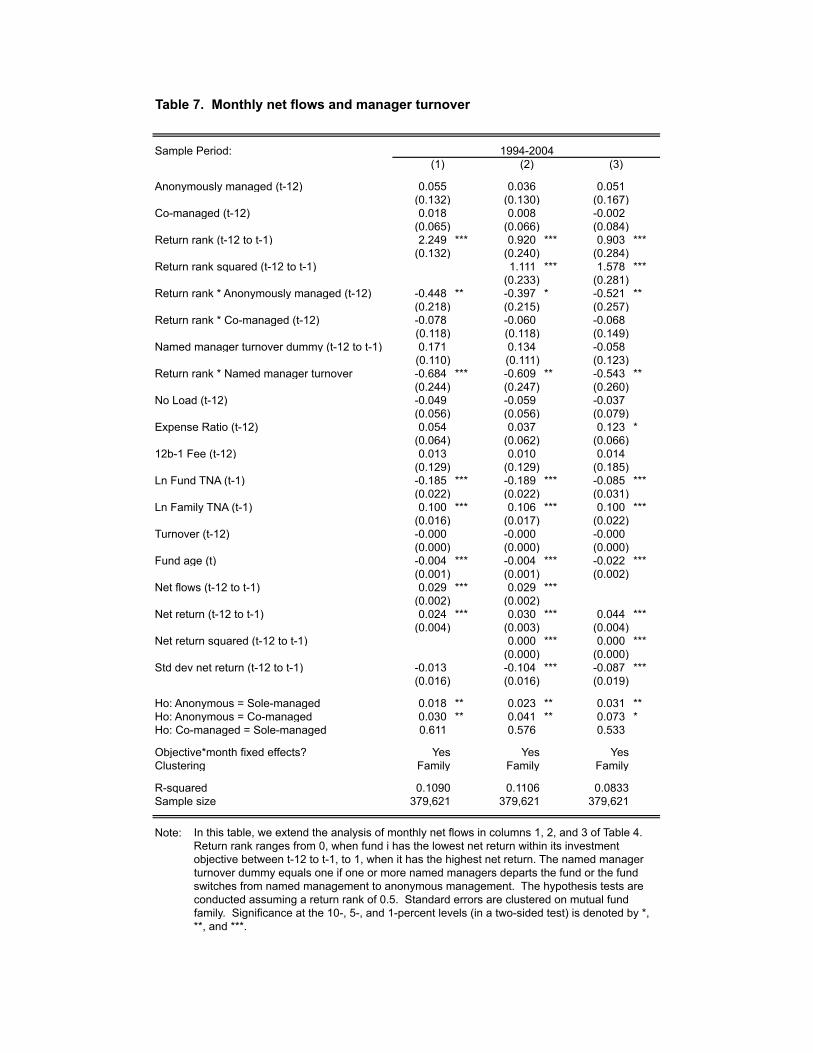
Table 7. Monthly net flows and manager turnover
Sample Period:
Anonymously managed (t-12) 0.055 0.036 0.051(0.132) (0.130) (0.167)
Co-managed (t-12) 0.018 0.008 -0.002(0.065) (0.066) (0.084)
Return rank (t-12 to t-1) 2.249 *** 0.920 *** 0.903 ***(0.132) (0.240) (0.284)
Return rank squared (t-12 to t-1) 1.111 *** 1.578 ***(0.233) (0.281)
Return rank * Anonymously managed (t-12) -0.448 ** -0.397 * -0.521 **(0.218) (0.215) (0.257)
Return rank * Co-managed (t-12) -0.078 -0.060 -0.068(0.118) (0.118) (0.149)
Named manager turnover dummy (t-12 to t-1) 0.171 0.134 -0.058(0.110) (0.111) (0.123)
Return rank * Named manager turnover -0.684 *** -0.609 ** -0.543 **(0.244) (0.247) (0.260)
No Load (t-12) -0.049 -0.059 -0.037(0.056) (0.056) (0.079)
Expense Ratio (t-12) 0.054 0.037 0.123 *(0.064) (0.062) (0.066)
12b-1 Fee (t-12) 0.013 0.010 0.014(0.129) (0.129) (0.185)
Ln Fund TNA (t-1) -0.185 *** -0.189 *** -0.085 ***(0.022) (0.022) (0.031)
Ln Family TNA (t-1) 0.100 *** 0.106 *** 0.100 ***(0.016) (0.017) (0.022)
Turnover (t-12) -0.000 -0.000 -0.000(0.000) (0.000) (0.000)
Fund age (t) -0.004 *** -0.004 *** -0.022 ***(0.001) (0.001) (0.002)
Net flows (t-12 to t-1) 0.029 *** 0.029 ***(0.002) (0.002)
Net return (t-12 to t-1) 0.024 *** 0.030 *** 0.044 ***(0.004) (0.003) (0.004)
Net return squared (t-12 to t-1) 0.000 *** 0.000 ***(0.000) (0.000)
Std dev net return (t-12 to t-1) -0.013 -0.104 *** -0.087 ***(0.016) (0.016) (0.019)
Ho: Anonymous = Sole-managed 0.018 ** 0.023 ** 0.031 **Ho: Anonymous = Co-managed 0.030 ** 0.041 ** 0.073 *Ho: Co-managed = Sole-managed 0.611 0.576 0.533
Objective*month fixed effects? Yes Yes YesClustering Family Family Family
R-squared 0.1090 0.1106 0.0833Sample size 379,621 379,621 379,621
Note: In this table, we extend the analysis of monthly net flows in columns 1, 2, and 3 of Table 4. Return rank ranges from 0, when fund i has the lowest net return within its investment objective between t-12 to t-1, to 1, when it has the highest net return. The named manager turnover dummy equals one if one or more named managers departs the fund or the fund switches from named management to anonymous management. The hypothesis tests are conducted assuming a return rank of 0.5. Standard errors are clustered on mutual fund family. Significance at the 10-, 5-, and 1-percent levels (in a two-sided test) is denoted by *, **, and ***.
1994-2004(1) (3)(2)
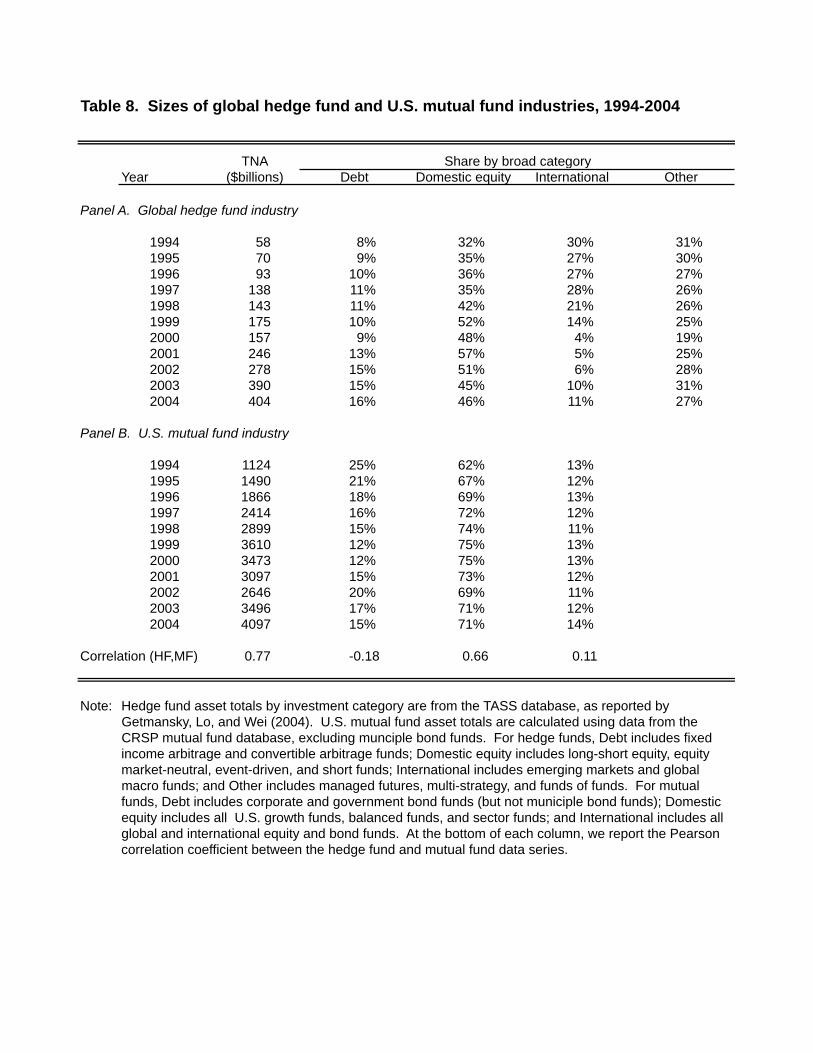
Table 8. Sizes of global hedge fund and U.S. mutual fund industries, 1994-2004
TNA
Year ($billions) Debt Domestic equity International Other
1994 58 8% 32% 30% 31%
1995 70 9% 35% 27% 30%
1996 93 10% 36% 27% 27%
1997 138 11% 35% 28% 26%
1998 143 11% 42% 21% 26%
1999 175 10% 52% 14% 25%
2000 157 9% 48% 4% 19%
2001 246 13% 57% 5% 25%
2002 278 15% 51% 6% 28%
2003 390 15% 45% 10% 31%
2004 404 16% 46% 11% 27%
Panel B. U.S. mutual fund industry
1994 1124 25% 62% 13%
1995 1490 21% 67% 12%
1996 1866 18% 69% 13%
1997 2414 16% 72% 12%
1998 2899 15% 74% 11%
1999 3610 12% 75% 13%
2000 3473 12% 75% 13%
2001 3097 15% 73% 12%
2002 2646 20% 69% 11%
2003 3496 17% 71% 12%
2004 4097 15% 71% 14%
Correlation (HF,MF) 0.77 -0.18 0.66 0.11
Note:
Share by broad category
Hedge fund asset totals by investment category are from the TASS database, as reported by
Getmansky, Lo, and Wei (2004). U.S. mutual fund asset totals are calculated using data from the
CRSP mutual fund database, excluding munciple bond funds. For hedge funds, Debt includes fixed
income arbitrage and convertible arbitrage funds; Domestic equity includes long-short equity, equity
market-neutral, event-driven, and short funds; International includes emerging markets and global
macro funds; and Other includes managed futures, multi-strategy, and funds of funds. For mutual
funds, Debt includes corporate and government bond funds (but not municiple bond funds); Domestic
equity includes all U.S. growth funds, balanced funds, and sector funds; and International includes all
global and international equity and bond funds. At the bottom of each column, we report the Pearson
correlation coefficient between the hedge fund and mutual fund data series.
Panel A. Global hedge fund industry

Table 9. The Growth of Hedge Funds and the Anonymous Team Management of Mutual Funds
Specification:
Sample period:
Ln Hedge Fund AUM in Same Broad Asset Class (t-12) 0.012 ** 0.023 ***
(0.006) (0.009)
Ln Mutual Fund TNA in Same Broad Asset Class (t-12) -0.008 -0.039
(0.010) (0.027)
Ln Hedge Fund AUM in Same State (t-12) 0.009 ** 0.007 **
(0.004) (0.003)
Ln Mutual Fund TNA in Same State (t-12) 0.005 0.000
(0.004) (0.004)
Boston HQ (t) -0.335 ** -0.286 ***
(0.132) (0.135)
Boston HQ * Ln Hedge Fund Industry AUM (t-12) 0.087 ** 0.066 ***
(0.040) (0.025)
NYC HQ (t) -0.306 * -0.270 **
(0.161) (0.157)
NYC HQ * Ln Hedge Fund Industry AUM (t-12) 0.051 * 0.040 **
(0.032) (0.018)
Anonymously managed (t-12) 0.843 *** 0.607 *** 0.611 ***
(0.015) (0.022) (0.023)
Co-managed (t-12) 0.017 0.009 0.009
(0.011) (0.007) (0.007)
Fund new to Morningstar database (t) 0.241 *** 0.093 *** 0.092 ***
(0.049) (0.044) (0.043)
Index Fund (t-12) 0.226 *** 0.094 *** 0.118 ** 0.059 * 0.114 * 0.054 *
(0.042) (0.020) (0.075) (0.041) (0.075) (0.039)
No Load (t-12) -0.014 -0.009 -0.016 -0.013 -0.013 -0.011
(0.019) (0.010) (0.019) (0.012) (0.020) (0.012)
Expense ratio (t-12) 0.075 *** 0.043 *** 0.032 * 0.019 ** 0.030 * 0.018 *
(0.022) (0.011) (0.017) (0.010) (0.017) (0.010)
12b-1 fee (t-12) 0.067 ** 0.045 ** 0.002 -0.002 0.003 -0.002
(0.032) (0.021) (0.032) (0.017) (0.031) (0.016)
Ln Fund TNA (t-1) -0.008 * -0.005 ** -0.008 *** -0.004 ** -0.008 ** -0.004 **
(0.004) (0.003) (0.003) (0.002) (0.003) (0.002)
Ln Family TNA (t-1) -0.008 *** -0.010 ** -0.005 -0.008 **
(0.003) (0.004) (0.004) (0.004)
Turnover (t-12) 0.000 ** 0.000 *** 0.000 ** 0.000 *** 0.000 ** 0.000 ***
(0.000) (0.000) (0.000) (0.000) (0.000) (0.000)
Fund age (t) -0.001 ** -0.000 -0.001 *** -0.000 -0.001 *** -0.000
(0.001) (0.000) (0.000) (0.000) (0.000) (0.000)
Net flow (t-12 to t-1) 0.000 0.000 * 0.000 0.000 0.000 0.000
(0.000) (0.000) (0.000) (0.000) (0.000) (0.000)
(1) (2) (3)
1996-2002 1996-2002 1996-2002 1996-20021994-2004 1994-2004
(4) (5) (6)
Levels Changes Levels Changes Levels Changes

Net return (t-12 to t-1) -0.000 ** -0.000 -0.001 *** -0.001 *** -0.001 *** -0.001 ***
(0.000) (0.000) (0.000) (0.000) (0.000) (0.000)
Std dev net return (t-12 to t-1) 0.000 0.002 -0.000 0.001 0.000 0.001
(0.002) (0.002) (0.002) (0.001) (0.002) (0.001)
Clustering
Pseudo R2 0.2767 0.5926 0.3437 0.5653 0.3413 0.5658
Sample size 11922 11922 13795 13795 13795 13795
Note:
S&P ObjectiveFixed effects
Family*Year, Family*Year,
S&P Objective
This table reports marginal effects estimated via probit, with the goal of testing whether the use of anonymous team management is correlated with growth in the
hedge fund industry. The unit of observation is fund i in January of each year. The dependent variable equals 1 if Morningstar lists fund i as anonymously managed
in the same calendar year. All independent variables except fund age are measured during the prior calendar year. The first hedge fund-related variable is the
natural logarithm of hedge fund assets in the same broad asset class (i.e., debt, domestic equity, or international equity) as fund i. The second hedge fund-related
variable is the natural logarithm of hedge fund assets managed by firms in the same state as fund i. The third set of hedge fund variables are dummy variables
indicating whether fund i is located in Boston or NYC plus interactions with the log of total hedge fund industry assets. All hedge fund assets are measured in billions
of dollar. While the set of fixed effects vary across specifications, all specifications include a full set of year fixed effects. In columns 1-2, standard errors are
clustered on S&P investment objective as reported by CRSP; in columns 3-6, standard errors are clustered on state. Significance at the 10-, 5-, and 1-percent levels
(in a two-sided test) is denoted by *, **, and ***.
State State StateS&P Objective S&P Objective State
FamilyObjective*Year Objective*Year
Objective*Year, Objective*Year,
Family
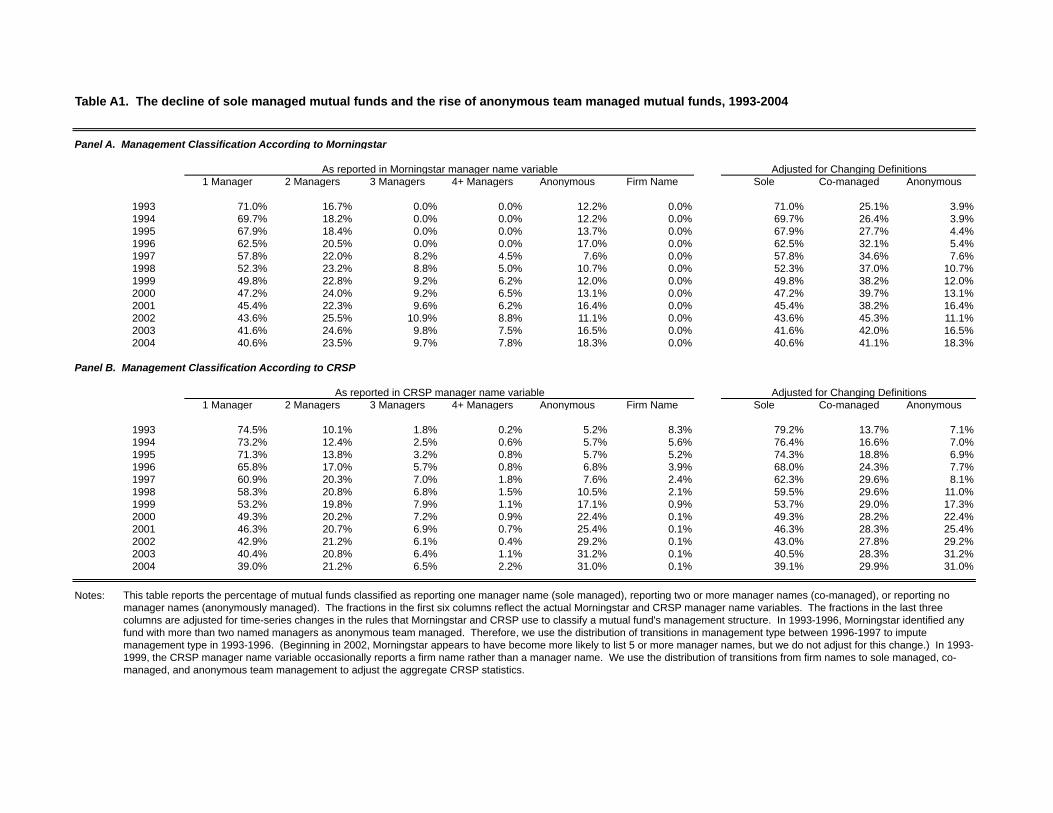
Table A1. The decline of sole managed mutual funds and the rise of anonymous team managed mutual funds, 1993-2004
Panel A. Management Classification According to Morningstar
1 Manager 2 Managers 3 Managers 4+ Managers Anonymous Firm Name Sole Co-managed Anonymous
1993 71.0% 16.7% 0.0% 0.0% 12.2% 0.0% 71.0% 25.1% 3.9%
1994 69.7% 18.2% 0.0% 0.0% 12.2% 0.0% 69.7% 26.4% 3.9%
1995 67.9% 18.4% 0.0% 0.0% 13.7% 0.0% 67.9% 27.7% 4.4%
1996 62.5% 20.5% 0.0% 0.0% 17.0% 0.0% 62.5% 32.1% 5.4%
1997 57.8% 22.0% 8.2% 4.5% 7.6% 0.0% 57.8% 34.6% 7.6%
1998 52.3% 23.2% 8.8% 5.0% 10.7% 0.0% 52.3% 37.0% 10.7%
1999 49.8% 22.8% 9.2% 6.2% 12.0% 0.0% 49.8% 38.2% 12.0%
2000 47.2% 24.0% 9.2% 6.5% 13.1% 0.0% 47.2% 39.7% 13.1%
2001 45.4% 22.3% 9.6% 6.2% 16.4% 0.0% 45.4% 38.2% 16.4%
2002 43.6% 25.5% 10.9% 8.8% 11.1% 0.0% 43.6% 45.3% 11.1%
2003 41.6% 24.6% 9.8% 7.5% 16.5% 0.0% 41.6% 42.0% 16.5%
2004 40.6% 23.5% 9.7% 7.8% 18.3% 0.0% 40.6% 41.1% 18.3%
Panel B. Management Classification According to CRSP
1 Manager 2 Managers 3 Managers 4+ Managers Anonymous Firm Name Sole Co-managed Anonymous
1993 74.5% 10.1% 1.8% 0.2% 5.2% 8.3% 79.2% 13.7% 7.1%
1994 73.2% 12.4% 2.5% 0.6% 5.7% 5.6% 76.4% 16.6% 7.0%
1995 71.3% 13.8% 3.2% 0.8% 5.7% 5.2% 74.3% 18.8% 6.9%
1996 65.8% 17.0% 5.7% 0.8% 6.8% 3.9% 68.0% 24.3% 7.7%
1997 60.9% 20.3% 7.0% 1.8% 7.6% 2.4% 62.3% 29.6% 8.1%
1998 58.3% 20.8% 6.8% 1.5% 10.5% 2.1% 59.5% 29.6% 11.0%
1999 53.2% 19.8% 7.9% 1.1% 17.1% 0.9% 53.7% 29.0% 17.3%
2000 49.3% 20.2% 7.2% 0.9% 22.4% 0.1% 49.3% 28.2% 22.4%
2001 46.3% 20.7% 6.9% 0.7% 25.4% 0.1% 46.3% 28.3% 25.4%
2002 42.9% 21.2% 6.1% 0.4% 29.2% 0.1% 43.0% 27.8% 29.2%
2003 40.4% 20.8% 6.4% 1.1% 31.2% 0.1% 40.5% 28.3% 31.2%
2004 39.0% 21.2% 6.5% 2.2% 31.0% 0.1% 39.1% 29.9% 31.0%
Notes:
Adjusted for Changing DefinitionsAs reported in Morningstar manager name variable
Adjusted for Changing DefinitionsAs reported in CRSP manager name variable
This table reports the percentage of mutual funds classified as reporting one manager name (sole managed), reporting two or more manager names (co-managed), or reporting no
manager names (anonymously managed). The fractions in the first six columns reflect the actual Morningstar and CRSP manager name variables. The fractions in the last three
columns are adjusted for time-series changes in the rules that Morningstar and CRSP use to classify a mutual fund's management structure. In 1993-1996, Morningstar identified any
fund with more than two named managers as anonymous team managed. Therefore, we use the distribution of transitions in management type between 1996-1997 to impute
management type in 1993-1996. (Beginning in 2002, Morningstar appears to have become more likely to list 5 or more manager names, but we do not adjust for this change.) In 1993-
1999, the CRSP manager name variable occasionally reports a firm name rather than a manager name. We use the distribution of transitions from firm names to sole managed, co-
managed, and anonymous team management to adjust the aggregate CRSP statistics.

Table A2. Comparing Morningstar and CRSP classifications to Mutual Fund Filings for Random Sample of Domestic Equity Funds in 2002
Number of Number of Random
Random Sample Filings that Actual Domestic Sample as Implied Implied
Morningstar CRSP of Domestic Do Not Disclose Percentage Equity Funds Percentage Morningstar CRSP
Classification Classification Equity Funds Manager Names Anonymous in 2002 Population Accuracy Accuracy
Named Named 20 0 0.0% 1,316 1.5% 100.0% 100.0%
Named Anonymous 45 8 17.8% 375 12.0% 82.2% 17.8%
Anonymous Named 20 12 60.0% 42 47.6% 60.0% 40.0%
Anonymous Anonymous 45 40 88.9% 135 33.3% 88.9% 88.9%
130 1,868 94.7% 81.3%
Note: To determine whether Morningstar or CRSP provides the more accurate information on management structure, we hand-collected data on management structure for a
sample of domestic equity funds in 2002. Funds were put into four bins based on whether CRSP or Morningstar classified the funds as being anonymously managed. For
the funds chosen at random within each bin, data on the actual management structure were hand-collected from Prospectuses and Statements of Additional Information
available on SEC's EDGAR database. In all but one case, we were able to locate manager names or a phrase like "The Adviser manages the Funds by an investment team
approach" followed by no names. In the one case where we were not able to locate any explicit discussion of how the fund was managed, we followed both CRSP and
Morningstar and classified the fund as anonymously managed.