when it comes to email marketing,
TRANSCRIPT


2
When it comes to email marketing, universities and colleges have always been in a league of their own.
And that’s exactly why we love working with them.
Beginning with the students and going all the way through departments, organizations, faculty, alumni, and more, no two universities or colleges are the same, which means that their email programs aren’t, either. But at the heart of each one is the same goal: The need to communicate with the people who matter most.
To create this report, we looked at hundreds of millions of emails sent from CM Group brands in order to bring you the most complete picture of what universities have been experiencing this year. This research covers a wide variety of university departments and organizations from across the globe to give a big-picture overview of the higher education industry email programs in 2020.

3
Here’s what we found:
2020 has been a strange year for everyone, but the higher education industry has been especially impacted, as they navigate difficult choices that affect every aspect and person associated with the institution. But, while they have had to change plans and shift priorities, this benchmarks report is a clear indication of how hard universities and colleges have worked to continue furthering their missions and relationships.
In March, as COVID-19 continued to spread, countries across the globe locked down, and universities began creating plans of action, open rates increased 10% from February, and 12% from the year prior.
University and college students were standing by at their inboxes around Spring Break to learn answers to questions like “Are we going back to campus?”, “Will all of my classes be remote?,” and, likely, “What the heck is going on?”.
One obvious-yet-important fact about this pandemic is that we don’t know when it will end. Unlike many other crises, the pandemic doesn’t have a defined end-date, and that means that the inbox patterns we saw in the spring will likely change over time as readers (and senders) get fatigued.
1. Open rates correlate with current events.
Combat inbox fatigue by continuing to listen to your audience. Just because they needed constant updates at the beginning of the pandemic doesn’t mean they still find them relevant today. Continue to set a high standard for messaging priorities, determining sends that need to go out immediately (For example, those that pertain to public health), and others that can possibly wait to be combined with other updates (Non-urgent campus news).
This could also be a time to look at audience segments and see if you can pare them down even more to ensure everyone on your list is always getting the most relevant information.
Takeaway:

4
We saw a massive 70% increase in open rates in 2020, from 4.0% in 2019 to 6.8% in 2020. This means that the higher ed industry is almost triple the general average which had an average of 2.6% click-through rate in 2019.
There’s a lot of important information to be learned here. You can study your emails to see where in your emails your readers are engaging. Do they click most often on CTA buttons? Or do they perhaps click on images or hyperlinks? Use these trends and apply them to your greater email strategy to continue to see increased engagement regardless of what happens in the news cycle.
Typically, students are too busy enjoying their vacations, internships, or jobs to open many emails from their university or college during the summer months, but that definitely didn’t hold true in 2020. Because school plans continued to be announced and changed over time, students appeared to be glued to their inboxes to the point that not only did universities not experience a lull in engagement, they also continued to see the numbers rise.
But this information gives us takeaways that reach far past summer break, causing us to realize that seasonality isn’t as much to blame here as relevancy is. Maybe students aren’t interested in the content they normally receive from their school over the summer, or maybe their universities are barely sending at all. There’s only one way to find out—A/B testing.
2. Click-through rates saw a 70% spike this year.
3. We said goodbye to the usual summer lull.
If you’re seeing great results, now is the time to take a look at how your audience engages with your emails so you can build on that and refine your strategy. Learning how people engage with your emails in these high-demand times can offer valuable insight. You can discover the optimal design for your CTAs: Do people click more when your buttons are a certain color or contain certain copy? You can even look at the exact number of CTAs to determine the exact number that will lead to maximum engagement.
Takeaway:
Before you make assumptions about subscriber behavior, be willing to try something different to see how it compares. Maybe it isn’t that your subscribers don’t want to hear from you at all, it’s just that they prefer a different approach. Test a different send cadence, subject line, content format, or image style to learn more about your audience and cater to their needs. Make sure the call-to-action is clear, or add one if you don’t have one. This can be as simple as links for logging into their online learning accounts or visiting a landing page for campus updates.
Takeaway:

5
Almost every industry was affected by COVID-19 in some way, and as a result of closures or changes, email communication increased as in-person interactions and social gatherings decreased. With a month-over-month increase of 20% in open rates for all industries compared to 2019, you probably experienced a volume surge in your personal inbox during this time. (See more COVID-19 benchmark data in this guide from Campaign Monitor.)
However, based on open rates, we see that, even though inbox volume was rising, subscribers were still interested in what universities had to say, proving the power of relevant content; this is probably because many of these emails included information that affected the recipient’s life in a major way. While they may not have been concerned about how a local retail store was handling COVID-19, they definitely care about the future of their own education.
Even in the challenging times of 2020, email proved to be a trustworthy and reliable communication tool for universities. With increased open, click-through, and click-to-open rates in almost every month compared to 2019, it’s clear that higher education had an even bigger need to communicate with students, alumni, donors, and families than before. And, according to our metrics, their messages were received, opened, and engaged with, proving email to once again be a powerhouse of personalized digital communication.
For many institutions, the pivot from in-person teaching and on-campus experiences to remote learning and digital practices resulted in record-breaking email statistics. Read on to see how your university or college’s rates measure up.
4. Universities were not intimidated by inbox competition.
5. Email is there for universities in tough times.
As long as you’re continuing to send relevant content that’s important to your subscribers, you don’t need to worry as much about inbox competition. While it’s always good to test for the best time to send a message so it doesn’t get overlooked, universities do have a slight advantage when it comes to loyalty. Because subscribers have invested time and money in your institution, you’re already one-step ahead of retailers vying for inbox priority. Make sure you keep that trust and loyalty by sending intentional updates.
Takeaway:
Email is a reliable tool for communication. It’s the one place university students, parents, and alumni expect to hear from your institution, and their inboxes are with them wherever they go. Know that no matter what the pandemic and 2021 brings, your Email Service Provider will be a digital marketing tool you can count on.
Takeaway:

6
With this year’s findings diverting from the norm, this could also leave universities feeling a little lost when measuring their success this year and creating goals for next. With the metrics you’ll find below, you can compare your rates to the average of hundreds of our higher ed customers from around the world. But before you get caught up in the numbers, we hope you’ll keep the above points in mind and realize that the patterns, not the actual numbers, are most important this year.
6. Your goals may look a little different this year.
Measure your results first against the patterns described above. Then, after you compare them to the average rates below, take a more granular look at your previous campaigns. What did you learn about your audience? In which ways did you use that knowledge to improve? Once you have a baseline understanding of your audience, you can continue to push yourself to create more engaging emails.
As far as making goals for next year, be prepared that the rates are probably going to be unpredictable yet again, but an understanding of your subscribers helps you remain in control and change your content with the times. Stay close to your audience and their needs, and find ways to measure their engagement amid the ebb and flow of current events. (For example: See if you can increase your click-rates in an otherwise CTA-less email by adding a list of helpful resources for parents or an FAQ page for incoming students, depending on your audience.)
Takeaway:

7
The benchmarks
1. University email open rate
An open rate is a measure of how many email recipients open an email, compared to the total number of emails delivered.
As mentioned before, COVID-19 changed many things for universities and colleges, and open rates are no exception. So far in the year 2020, we found the average open rate for universities to be 34.3%. To compare, the average open rate for universities in 2019 was 23.2%, resulting in an 11.10 increase. The average open rate for all industries in 2019 (from our sister brand Campaign Monitor’s Benchmarks Report, published pre-COVID-19) was 17.8%.
Higher education open rates were unusually high this year, and we credit COVID-19 and its impact on the industry, including learning environment changes and uncertainty amongst constituents.
Your open rates don’t need to be this high to be considered successful, but we wouldn’t be surprised if they’re higher than the year before. Pay attention to any spikes, positive or negative, in open rates, and consider what was happening in the world or on campus, as well as the information sent at that time.
• Start with your subject line. Does it speak directly to your recipient and motivate them to open the email?
• Try A/B testing subject lines. Learn what makes your subscribers tick—or, rather, click!
• Include preheader text. This will help readers when they preview your message.
• Test the sender name and email address. (ex: Your department’s name vs. your dean or director’s name.)
• Use personalization and segmentation. The more relevant your email is to the reader, the more likely they are to open it!
Open rates need a boost? No sweat. Here are some tactics to try:

8
The benchmarks
2. University email click-through rate
The click-through rate measures how many people clicked on a hyperlink, CTA, or image within a specific email. It’s calculated by taking the total number of clicks an email receives, and dividing that number by the total number of delivered messages. This rate can help you identify the strongest parts of your email, as well as those you may need to work on.
While we mentioned that click-through rates didn’t increase as much as open rates did, they still saw improvement from last year. We found the average click-through rate for universities to be 6.80%. In comparison, the average click-through rate for higher education in 2019 was 4.0%, creating a 2.8 increase. The average click-through rate for all industries was 2.6%.
Remember that click-through rates are all about the actions you’re asking your subscriber to take in your email. This is where testing can become your best friend, and you can continue to improve your engagement, regardless of current events.
• Start with your call(s)-to-action. Is the action you’d like a reader to take as clear as it can be?
• Test your call(s)-to-action. Explore switching up your CTA copy or design to ensure maximum clickability.
• Offer an incentive. Clearly communicate what a reader will gain by visiting your website or taking a specific action.
• Maintain messaging consistency. Make sure your subject line is consistent with the action you’ll ask subscribers to take inside the email.
• Follow-through with your incentive. Be careful to deliver on all of your promises so readers will feel motivated to continue taking action within your emails.
Want to increase your click-through rate? We’ve got you. Here are some tactics to try:

9
The benchmarks
3. University email click-to-open rate
The click-to-open rate compares the number of unique clicks to unique opens. It’s important to measure this because it indicates how effective your email message, design, and content performed, and whether it motivated subscribers to take action.
We found the average click-to-open rate for universities to be 19.8%. In comparison, the click-to-open rate for 2019 was 17.2%, which is a 2.6 increase in 2020. The average CTOR for all industries in 2019 was just 14.3%.
• Optimize your email for all devices. How does it look on a mobile device?
• Power your emails with data. Use what you know about your subscribers to create content they’ll love.
• Test your call(s)-to-action. Is your audience more likely to click an inline link? A button? Now’s the time to find out.
• Keep testing. Test individual elements, like graphics, copy, or buttons, to find what works best.
• Find what works, then scale. Use automation to meet your subscribers exactly where they are.
Ready to maximize your click-to-open rate? High-five! Here are some tactics to try:
10
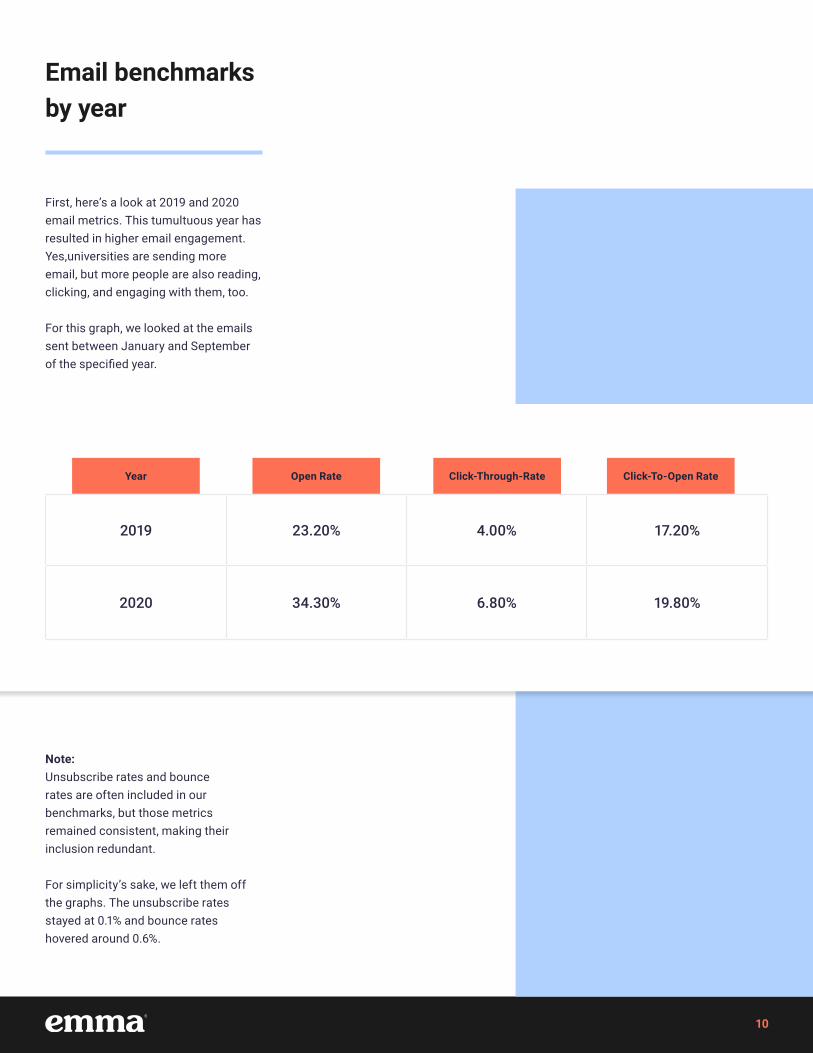
Email benchmarks by year
First, here’s a look at 2019 and 2020 email metrics. This tumultuous year has resulted in higher email engagement. Yes,universities are sending more email, but more people are also reading, clicking, and engaging with them, too.
For this graph, we looked at the emails sent between January and September of the specified year.
Note: Unsubscribe rates and bounce rates are often included in our benchmarks, but those metrics remained consistent, making their inclusion redundant.
For simplicity’s sake, we left them off the graphs. The unsubscribe rates stayed at 0.1% and bounce rates hovered around 0.6%.
2019 23.20% 4.00% 17.20%
2020 34.30% 6.80% 19.80%
Year Open Rate Click-Through-Rate Click-To-Open Rate
11
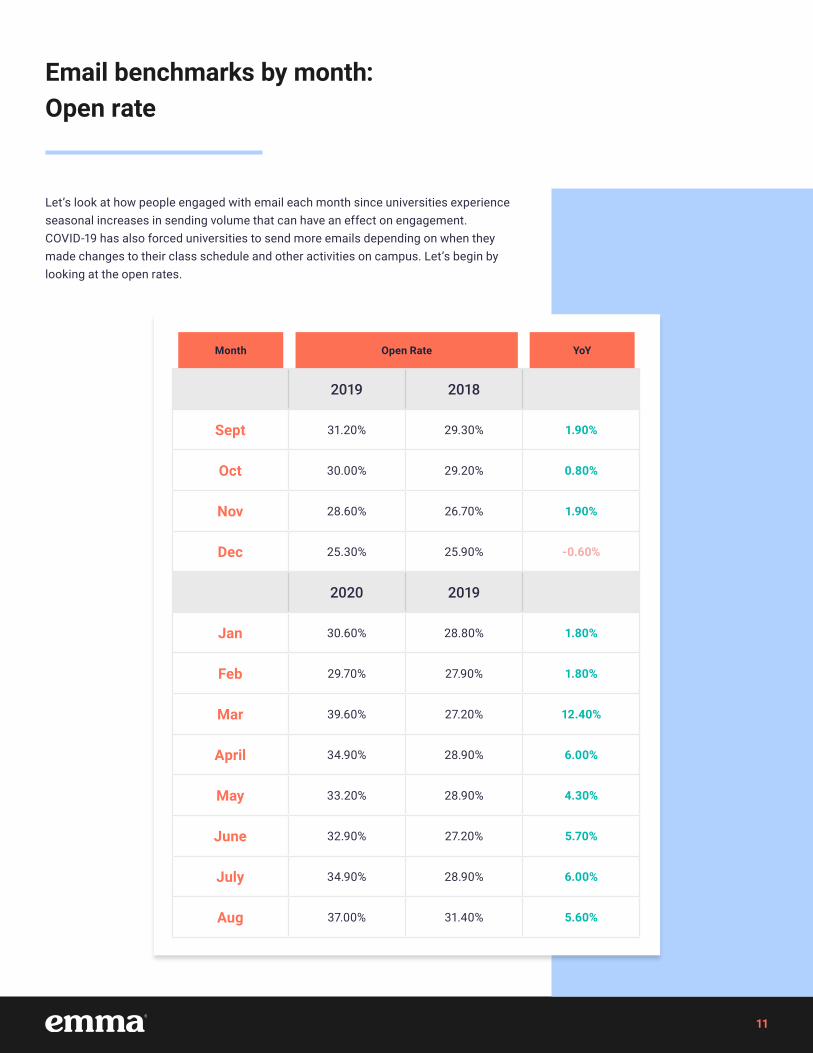
Email benchmarks by month: Open rate
Let’s look at how people engaged with email each month since universities experience seasonal increases in sending volume that can have an effect on engagement. COVID-19 has also forced universities to send more emails depending on when they made changes to their class schedule and other activities on campus. Let’s begin by looking at the open rates.
2019 2018
Sept 31.20% 29.30% 1.90%
Oct 30.00% 29.20% 0.80%
Nov 28.60% 26.70% 1.90%
Dec 25.30% 25.90% -0.60%
2020 2019
Jan 30.60% 28.80% 1.80%
Feb 29.70% 27.90% 1.80%
Mar 39.60% 27.20% 12.40%
April 34.90% 28.90% 6.00%
May 33.20% 28.90% 4.30%
June 32.90% 27.20% 5.70%
July 34.90% 28.90% 6.00%
Aug 37.00% 31.40% 5.60%
Month Open Rate YoY
12
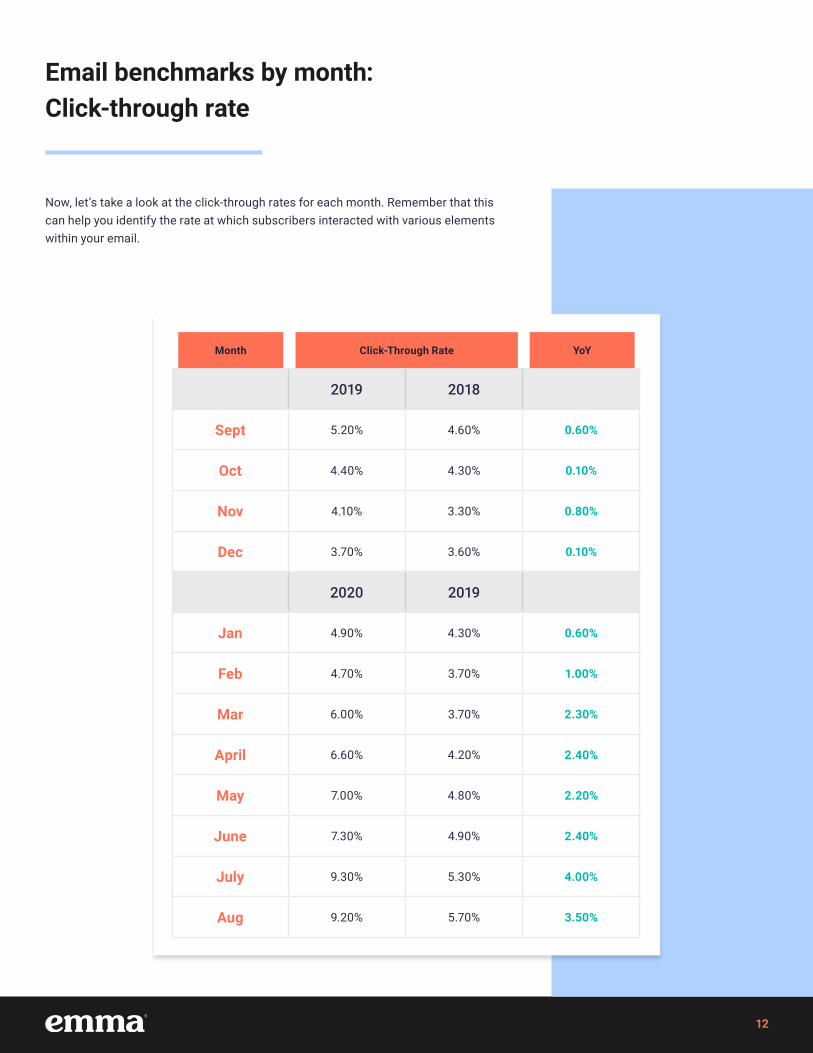
Email benchmarks by month: Click-through rate
Now, let’s take a look at the click-through rates for each month. Remember that this can help you identify the rate at which subscribers interacted with various elements within your email.
2019 2018
Sept 5.20% 4.60% 0.60%
Oct 4.40% 4.30% 0.10%
Nov 4.10% 3.30% 0.80%
Dec 3.70% 3.60% 0.10%
2020 2019
Jan 4.90% 4.30% 0.60%
Feb 4.70% 3.70% 1.00%
Mar 6.00% 3.70% 2.30%
April 6.60% 4.20% 2.40%
May 7.00% 4.80% 2.20%
June 7.30% 4.90% 2.40%
July 9.30% 5.30% 4.00%
Aug 9.20% 5.70% 3.50%
Month Click-Through Rate YoY

13
Email benchmarks by month: Click-to-open rate
Finally, let’s explore the click-to-open rates for each month. Keep in mind that this is a good way to measure subscriber engagement and whether or not your email motivated readers to click on something within the email.
2019 2018
Sept 16.60% 15.30% 1.30%
Oct 14.60% 14.70% -0.10%
Nov 14.10% 12.40% 1.70%
Dec 14.60% 14.00% 0.60%
2020 2019
Jan 15.80% 14.90% 0.90%
Feb 15.80% 13.30% 2.50%
Mar 15.20% 13.60% 1.60%
April 18.90% 14.30% 4.60%
May 21.10% 16.40% 4.70%
June 22.00% 17.80% 4.20%
July 26.50% 18.30% 8.20%
Aug 24.80% 17.90% 6.90%
Month Click-to-Open Rate YoY
14
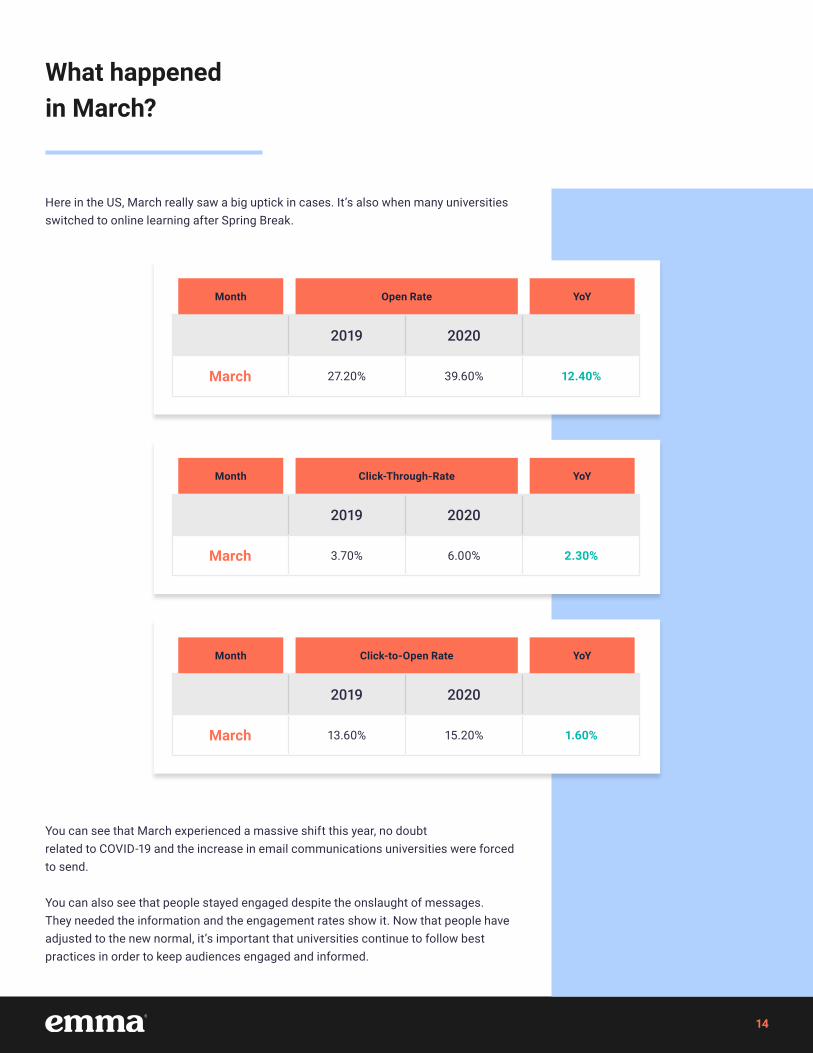
What happened in March?
Here in the US, March really saw a big uptick in cases. It’s also when many universities switched to online learning after Spring Break.
You can see that March experienced a massive shift this year, no doubt related to COVID-19 and the increase in email communications universities were forced to send.
You can also see that people stayed engaged despite the onslaught of messages. They needed the information and the engagement rates show it. Now that people have adjusted to the new normal, it’s important that universities continue to follow best practices in order to keep audiences engaged and informed.
2019 2020
March 27.20% 39.60% 12.40%
Month Open Rate YoY
2019 2020
March 3.70% 6.00% 2.30%
Month Click-Through-Rate YoY
2019 2020
March 13.60% 15.20% 1.60%
Month Click-to-Open Rate YoY

15
Emails universities should be sending in 2020
Because you’re spending time navigating important decisions that significantly impact your campus, we decided to share some of our favorite university email ideas to save you time and spark inspiration. In 10 email campaigns universities should send this fall, you’ll find examples and ideas for the following sends:
• Welcome email: Send this when a student has been admitted to a new program or to a first-time donor. This sets the tone and expectations for the rest of your email relationship.
• Parent and family member email: Keep students’ loved ones in-the-know, especially during the changes of COVID-19.
• Internal staff newsletter: Whether you’re working in the office or remotely, this send provides updates and a sense of camaraderie to your team.
• Student and alumni spotlight email: Show off what your students are up to and encourage applications, donors, and increased engagement.
• Student engagement email: Keep students involved, on or off-campus, helping them to maintain relationships even while social distancing.
• Emergency response email: Think about your crisis response email now, so you’ll be prepared in the future.
• Athletics email: Regardless of your sports team’s status this season, keep fans engaged all year long.
• Annual giving email: Encourage donors to give at a certain time of year, and use effective tactics to solidify your ask.
• Student feedback email: Ask students what they’d like to hear from you and how you can improve email communication.
• “We’re listening” email: Respond to their feedback with changes and let them know you care about their thoughts and opinions.

16
Wrap up
How email benchmarks are calculated
If you work for a university or college experiencing unprecedented numbers (Good or bad!) in these unprecedented times, you’re not alone.
This guide is simply that—a guide—to help you explore industry standards and gain insights and ideas for improving your own email marketing program. We hope you’ll walk away feeling empowered for your next send, and you’ll save or bookmark this to refer back to from time to time.
Ready for more university resources? Visit Emma’s page created especially for higher education here.
Listed below are definitions for the rates we mention in this report. You’ll also find resources available to you if you have specific areas that need improvement.
• Email open rate Open rates are calculated by taking the total number of opens and dividing by total delivered emails. You can explore more resources on improving open rates in this guide.
• Email click-through rate Click-through rates (CTR) are calculated by dividing the number of clicks by delivered emails. You can explore more resources on improving click-through rates in this guide.
• Email click-to-open rate An email click-to-open rate (CTOR) is determined by dividing the number of clicks by the number of opens, showing the engagement rate of subscribers that actually see the content of your email. You can explore more resources on improving click-to-open rates (and overall email engagement) in this guide.
We looked at hundreds of millions of emails sent from all of the CM Group family of brands in order to bring you the most complete picture of what universities have been experiencing this year. While many of these universities are located in the US, our sample consists of universities located across the world. All universities are customers of CM Group brands and all have self-selected “University” as their industry. This data is not separated into individual university departments.
Methodology