when hearing is tricky: speech processing strategies in...
TRANSCRIPT

RESEARCH ARTICLE
When Hearing Is Tricky: Speech Processing
Strategies in Prelingually Deafened Children
and Adolescents with Cochlear Implants
Having Good and Poor Speech Performance
Magdalene Ortmann1,2*, Pienie Zwitserlood3, Arne Knief4, Johanna Baare1,
Stephanie Brinkheetker4, Antoinette am Zehnhoff-Dinnesen4, Christian Dobel1,5
1 Institute for Biomagnetism and Biosignalanalysis, Muenster University Hospital, Muenster, Germany,
2 Jean-Uhrmacher-Institute for Clinical ENT-Research, University of Cologne, Cologne, Germany,
3 Department of Psychology, University of Muenster, Muenster, Germany, 4 Department of Phoniatrics and
Pedaudiology, Muenster University Hospital, Muenster, Germany, 5 Department of Otorhinolaryngology,
Jena University Hospital, Jena, Germany
Abstract
Cochlear implants provide individuals who are deaf with access to speech. Although sub-
stantial advancements have been made by novel technologies, there still is high variability
in language development during childhood, depending on adaptation and neural plasticity.
These factors have often been investigated in the auditory domain, with the mismatch nega-
tivity as an index for sensory and phonological processing. Several studies have demon-
strated that the MMN is an electrophysiological correlate for hearing improvement with
cochlear implants. In this study, two groups of cochlear implant users, both with very good
basic hearing abilities but with non-overlapping speech performance (very good or very
poor speech performance), were matched according to device experience and age at
implantation. We tested the perception of phonemes in the context of specific other pho-
nemes from which they were very hard to discriminate (e.g., the vowels in /bu/ vs. /bo/). The
most difficult pair was individually determined for each participant. Using behavioral mea-
sures, both cochlear implants groups performed worse than matched controls, and the good
performers performed better than the poor performers. Cochlear implant groups and con-
trols did not differ during time intervals typically used for the mismatch negativity, but earlier:
source analyses revealed increased activity in the region of the right supramarginal gyrus
(220–260 ms) in good performers. Poor performers showed increased activity in the left
occipital cortex (220–290 ms), which may be an index for cross-modal perception. The time
course and the neural generators differ from data from our earlier studies, in which the same
phonemes were assessed in an easy-to-discriminate context. The results demonstrate that
the groups used different language processing strategies, depending on the success of lan-
guage development and the particular language context. Overall, our data emphasize the
role of neural plasticity and use of adaptive strategies for successful language development
with cochlear implants.
PLOS ONE | DOI:10.1371/journal.pone.0168655 January 5, 2017 1 / 27
a1111111111
a1111111111
a1111111111
a1111111111
a1111111111
OPENACCESS
Citation: Ortmann M, Zwitserlood P, Knief A, Baare
J, Brinkheetker S, am Zehnhoff-Dinnesen A, et al.
(2017) When Hearing Is Tricky: Speech Processing
Strategies in Prelingually Deafened Children and
Adolescents with Cochlear Implants Having Good
and Poor Speech Performance. PLoS ONE 12(1):
e0168655. doi:10.1371/journal.pone.0168655
Editor: Hanjun Liu, Sun Yat-Sen University, CHINA
Received: July 7, 2015
Accepted: December 5, 2016
Published: January 5, 2017
Copyright: © 2017 Ortmann et al. This is an open
access article distributed under the terms of the
Creative Commons Attribution License, which
permits unrestricted use, distribution, and
reproduction in any medium, provided the original
author and source are credited.
Data Availability Statement: All data are available
from Open Science Framework at https://osf.io/
4uzq4/.
Funding: This work was supported by the
Deutsche Forschungsgemeinschaft [DFG DO 711/
7-1 to C.D., A.Z.D. and P.Z., http://www.dfg.de), the
Konrad- Adenauer-Stiftung (PhD grant to M.O.,
www.kas.de) and the FAZIT-Stiftung (PhD grant to
M.O., www.fazit-stiftung.de). The funders had no
role in study design, data collection and analysis,

Introduction
After their initial development in the 1950s by Djourno and Eryies [1], cochlear implants (CI)
provide individuals who are deaf with access to spoken language. Young children who were
born deaf or became deafened before language development started can–under optimal condi-
tions- even develop language performance within the normal range, enabling them to commu-
nicate with people of typical hearing [2]. There is nevertheless a surprisingly strong variance in
language development in these children. Even when controlling for device experience (number
of years with auditory experience after CI surgery) and age at implantation, a large amount of
variance remains unexplained [3–5]. In this study, we attempt to shed light on phoneme per-
ception in difficult language contrasts in two groups of congenitally deaf or prelingually deaf-
ened CI users. Both groups have very good basic hearing abilities, but differ in their language
perception performance. We were particularly interested in the neural correlates of processing
difficult phoneme contrasts, and used the mismatch negativity (MMN) component from the
EEG. Difficult contrasts (e.g., the vowels in /bu/ and /bo/) were not predefined, but rather
separately established for each participant on the basis of behavioral measures. This research
complements and contrasts with earlier data on easy-to-discriminate contrasts in the same
population [6]. Before explaining the differences between the two studies, we will introduce
the background and methods in more detail.
Phoneme Discrimination and Language Development in CI Users and
Healthy Controls
During the course of development of the human race several thousand languages came into
existence that enable us to express our thoughts and ideas with high precision. Languages
can be characterized by a specific phoneme repertoire which represent the building blocks
for words that may sound very similar, but differ in their meaning. Therefore, not only for
the perception of words, but also in a larger sentential context, correct identification of
phonemes is of crucial importance. “Peter, please start the fan!” leads to other actions than
“Peter, please start the van!”. Interestingly, while adults are unable to distinguish phonemes
that do not belong to their language environment, human babies can easily differentiate all
of the world’s phonemes [7–9]. At around six months of age phoneme perception is altered
by the exposure to the baby’s language environment. At this age, identification of native-
language phonemes becomes facilitated while detection of non-native phonemes declines
[10,11]. Importantly, phoneme discrimination abilities tested at this age are not only a good
predictor of language performance at the age of two [12] but also have been discussed as
possible predictors of language dysfunctions such as Specific Language Impairement (SLI)
[13] or other developmental linguistic impairments in children [14,15]. Children with
cochlear implants often miss a great amount of hearing experience before implantation
leading to less exposure to the phonemes of their native language. With strong relations
between phonological awareness and higher order language abilities as word decoding,
reading or communication mode [16–20], it is not surprising that prelingually deafened CI
users with very good or poor language development do also show strong differences in pho-
neme discrimination [6].
Still, the development of novel technologies, as e.g. better sound coding strategies imple-
mented to the speech processors, improved the development of hearing after implantation
to a substantial degree. Next to these technical improvements, there is increasing evidence
that learning constitutes a crucial component for a successful outcome. In the elderly,
hearing and especially language perception is often not good after initial activation of
the implant, but improves quickly within 10 to 20 weeks [21]. Obviously, a period of
When Hearing Is Tricky: Language Processing in Children with CI
PLOS ONE | DOI:10.1371/journal.pone.0168655 January 5, 2017 2 / 27
decision to publish, or preparation of the
manuscript.
Competing Interests: The authors have declared
that no competing interests exist.

adaptation or adjustment is needed, which may more appropriately be called ‘learning’
when it requires an active engagement of the hearer with her acoustic environment (for a
review, see [22]).
Testing Phoneme Discrimination in CI Users and Healthy Controls with
the Mismatch Negativity
Mechanisms of auditory sensory processing and the consequences of learning were often
investigated electrophysiologically with the mismatch negativity component (MMN). This
component rises to a relatively infrequent stimulus, the so-called deviant, that appears in a
stream of frequent stimuli, the standards [23]. Whenever the neural response evoked by the
deviant does not match the still-available memory trace formed by the preceding standards,
the MMN is triggered [24]. There is now firm evidence that the MMN can be used to monitor
even subtle phonological and phonetic differences between stimuli (e.g., [25,26]) and also
inform about the time course and success of learning novel contrasts (e.g., [27]). In line with
fMRI data [28], there is strong evidence that the MMN is not uniquely evoked in the bilateral
auditory cortices, but also has prefrontal sources in both hemispheres [29–31], especially for
language perception [32,33]. While typical peaks of the MMN arise 150 to 250 ms after change
onset, recent studies have reported that deviant detection indicated by ERPs can already
appear 20 to 40 ms after change onset (for a recent review, see [34]). It is argued on this basis
that novelty detection is a crucial mechanism for the functional organization of the auditory
system.
It is not surprising that the MMN was used to investigate auditory perception in persons
with CIs. Several studies have demonstrated that the MMN is a good indicator of learning–as
e.g. for the improvement of phoneme discrimination abilities after CI implantation [35],
which correlates with language perception abilities [36]. For example, postlingually deafened
CI users with good perceptual abilities after CI implantation revealed a MMN very similar to
controls with normal hearing, while the MMN was absent in CI users with poor hearing abili-
ties [37–39]. Note that these studies investigated language perception in postlingually deafened
CI users and, due to equipment and methods, could not draw conclusions about the cortical
generators of the MMN. Even though source localization of ERP components does not provide
the spatial accuracy of fMRI and PET, it is recommended for CI users because of strong safety
concerns with fMRI (due to the metallic and magnetic components of the implant) as well as
the invasive character of PET. Source localization with distributed models for ERP data of CI
users has been successfully used before [6,40] and is applied frequently to other areas of lan-
guage processing (e.g. [41–43]).
A major advantage of the MMN for research with CI patients lies in the use of an identical
stimulus as both standard and deviant, appearing in different runs. By subtracting brain
responses to these physically identical stimuli, electrophysiological artifacts of the implant can
be removed [6,44]. In the present study, we registered the MMN in response to a particular
phoneme (the deviant) when they were hard to differentiate from the standard by implant
users (e.g. /bu/ vs. /bo/). Importantly, we have used the very same stimuli before, with stan-
dards from which the deviant is more easily differentiated (/bu/ vs. /ba/, [6]): two groups of
prelingually deafened CI users with equally good overall hearing abilities, but who developed
either good or poor language performance after implantation, displayed a MMN, but with
different cortical origins. Source localization revealed an larger MMN for good performers in
the left fronto-temporal cortex from 155 to 225 ms, emphasizing the crucial role of the frontal
cortex in language perception [45]. This was followed by larger MMN for poor than for good
performers, in the left auditory cortex, from 225 to 250 ms. Both groups were individually
When Hearing Is Tricky: Language Processing in Children with CI
PLOS ONE | DOI:10.1371/journal.pone.0168655 January 5, 2017 3 / 27

matched for age at implantation and device experience so that differences between groups
could not be attributed to these factors.
Including our own study, research to date has focused on stimulus material that is easy to
process for CI users. As a consequence, no differences were observed between good perform-
ers and controls with typical hearing [37–39]. Here, we ask how the two CI groups differ
with respect to the time course and origin of the MMN under difficult phoneme perception
conditions.
One possible outcome is that both groups activate similar regions in a comparable time
interval, but strongly attenuated in comparison to controls, and more so for the poor perform-
ers. If this is the case, this argues for similar language processing mechanisms, but with greater
or lesser success. If, however, the groups differ with respect to time course and neural genera-
tors, this is a further indication for different language processing mechanisms associated with
good and poor performance [6]. Importantly, the use of the physically very same stimuli as in
our earlier study allows us to draw conclusions about the brain signature to an identical stimu-
lus appearing in either an easy or difficult context. If we observe profound differences between
these situations, this is evidence for a context-specific adaptation. Both of these aspects depend
on adaptation, learning and neural plasticity. The comparison of groups informs us about the
neural correlates of good and poor performance. The contrast between the difficult and easy
contexts provides information about context-specific adaptation.
Please note that the current study reports on data that were collected at the same time as
those reported in [6]. This implies that the participants, stimuli, pretests, methods of data pro-
cessing and other aspects were the same in both reports, but the data (except for parts of Fig 1)
are different. While [6] concentrated on the phoneme contrast that was most easy to discrimi-
nate, the current study focuses on results for the most difficult contrast. For the sake of com-
pleteness, the following method section includes all relevant information, and thus overlaps
with [6].
Materials and Methods
Participants
CI users. To find pairs of prelingually deafened CI users that could be matched according
to device experience and age at implantation, 64 patient files, stored in the archive of the
Department of Phoniatrics and Pedaudiology of the Muenster University Hospital, were
screened in detail. All CI users had to fulfill predefined logopedic and phoniatric criteria and
have very good overall hearing abilities. Matched pairs differed only in their language perfor-
mance: the group with high language performance was labeled “good performers”, the group
with low performance “poor performers”. All potential candidates were intensively examined
with respect to language perception and production by a speech therapist, who rated their
articulation, syntax, morphology and semantics. An ordinal rating scale from 1 (high) to 6
(low) was used for all four sub-dimensions of language performance. Good performers had to
score 2 or lower, while poor performers had to be rated 4 or higher. Thus, no overlap in lan-
guage performance between good and poor performers was ensured. Information about the
applied tests for all sub-dimensions of language performance is provided in S1 Table of the
supplementary material, describing the characteristics that had to be fulfilled for each step of
the ordinal rating in detail. To establish an index of global language performance, the criteria
of all sub-dimensions were added up for each patient (range: 4–24 points). CI users that did
not fulfil the strict criteria for group membership were excluded from the study and replaced
by others. This way, 18 participants (nine pairs, eight female and ten male; aged 7–19
(mean = 12.9 years)) with equal educational background remained in the study. The mean
When Hearing Is Tricky: Language Processing in Children with CI
PLOS ONE | DOI:10.1371/journal.pone.0168655 January 5, 2017 4 / 27

global language performance was 6 points (4–8 points; std = 1.73) for good performers and
18.2 (16–20 points; std = 1.8) for poor performers. Device experienced was considered
throughout and matched between groups.
All CI users had very good basic hearing abilities according to clinical standard testing. This
was ensured by accepting only those that had at least 70% correct answers in the FreiburgMonosyllable Word Test (FMWT) [46]. This test assesses the ability to correctly repeat fre-
quently used monosyllabic words in quiet, thus testing basic comprehension abilities for high-
frequency words with only little involvement of compensational processes due to the semantic
context. As opposed to producing spontaneous language, the accurate repetition of monosyl-
labic words is easier to manage. Therefore, although poor performers had trouble with articu-
lation in spontaneous language, good results in the FMWT were achieved by all participants. In
addition, we ensured very good hearing abilities by applying the MED-EL Teen-Ears test bat-
tery, a test-box designed to assess hearing in children and young adults after CI implantation
[47]. Three tests were chosen. In test 1, CI users had to identify the number of syllables within
spoken words (one, two or three syllables). In test 2, spoken sentences had to be identified
from a set of written counterparts (“sentences in closed set”). Test 3 required the identification
Fig 1. Performance in the phoneme discrimination test displayed for each subtest and all groups. While good performers
achieved d’ scores that were close to the typical hearing control group (3 out of 4 subtests), poor performers showed significantly
worse phoneme discrimination abilities than the good performers (3 out of 4 subtests). As intended, this changed when phoneme
pairs were sorted for each participant’s most difficult condition. Here, good performers performed significantly worse than the
control group and better than the poor performers, who only achieved a guessing level. T-values ranged from 1.7 to 15.21 with p-
values from 0.05 (marked by an asterisk) to 0.01 (marked by two or more asterisks).
doi:10.1371/journal.pone.0168655.g001
When Hearing Is Tricky: Language Processing in Children with CI
PLOS ONE | DOI:10.1371/journal.pone.0168655 January 5, 2017 5 / 27
of key words of spoken sentences without the help of lip reading or presentation of their writ-
ten counterpart (“sentences in open set”). In test 1 and 2, both groups had 100% correct
answers; in test 3, good performers achieved 99% and poor performers 90% correct answers.
S2 Table of the supplementary material shows the results of all language perception tests for
each participant.
In all CI users, the best possible transmission of signals to the auditory cortex, especially in
the speech relevant dynamic range between 35 and 65 dB, was ensured by optimizing the
aided thresholds of each participant. For this, aided threshold were measured in the frequency
range of the CI between 250 and 8000 Hz with third octave noise. The first sound was always
presented at 60 dB HL and decreased in steps of 20 dB until the CI user reported not having
heard any sound. Then, sound levels were increased in steps of 5 dB until the patient noticed
the test stimulus again. The threshold value was validated by varying sound levels by variations
of 5 dB steps below the initially identified threshold. Next, the volume of each frequency was
increased until patients reported uncomfortable intensities or until 100dB HL were reached.
By this procedure the physiological dynamic range was maximized while low level background
was inhibited and uncomfortable signal peaks were prevented. Participants had received their
last map change earliest two month before data assessment (max = 26 month, mean = 7.8 ± 5.1
month).
In short, using this intensive screening procedure, we put together two extreme groups
with no overlap in language perception and language production (tested via global language
performance as mentioned above: t(8) = 14.4, p<0.001, n = 18), but with equal device experi-
ence and with very high hearing abilities.
All participating CI users had deafened prelingually and had no language perception with
hearing aids. In both performance groups patients were provided with gestures at school, but
with different success: while three of the good performers achieved low (two) to moderate
(one) performance level, seven of the poor performers achieved either low (two) to moderate
(four) performance with one of them showing even good abilities in the comprehension and
use of gestures. All except one pair (pair 9) received their CI before their fifths birthday. Both
patients of pair 9 had deafened prelingually and were offered CIs. However, their parents
decided to try high-level hearing aids first, but later switched to CIs.
CI users were initially matched according to device experience and age at implantation
rounded to the year. This resulted in no difference between groups concerning age at
implantation (t(8) = -0.55, p = 0.59; good performers: mean = 4.2, std = 4.84; poor perform-
ers: mean = 4.55, std = 3.32) and device experience (t(8) = 1.35, p = 0.21; good performers:
mean = 11.33, std = 4.06; poor performers: mean = 10.22, std = 3.34). Even when taking the
exact age into account (years, months), no significant difference was found: device experi-
ence (t(8) = 1.12, p = 0.27; good performers: mean = 4.14, std = 4.97; poor performers:
mean = 4.5, std = 3.35); age at implantation (t(8) = 0.59, p = 0.57; good performers:
mean = 11.27, std = 4.16; poor performers: mean = 10.29, std = 3.36). However, if pair 9 is
considered an outlier and excluded from analyses, age at implantation is significantly lower
(t(7) = 3.87, p = 0.006) in good performers (mean = 2.5 years, std = 0.81) than in poor per-
formers (mean = 3.4 years, std = 1.11).
To learn more about the influence of age at implantation on global language performance,
we calculated a Pearson’s Correlation test. As before, with pair 9 included, age at implantation
had no influence in the current study group on global language performance (r = 0.125,
p = 0.622). This changed when pair 9 was excluded; the correlation test then showed a trend
towards significance (r = 0.49, p = 0.053), indicating a possible relationship between early CI
implantation and favorable language development. Therefore, to control for age at implanta-
tion as a possible confounding variable, we included it as an additional variable (measured in
When Hearing Is Tricky: Language Processing in Children with CI
PLOS ONE | DOI:10.1371/journal.pone.0168655 January 5, 2017 6 / 27
years, months) in all relevant steps of data analysis. For further information on patient data
and descriptive statistics, see [6].
Eleven CI users had bilateral CIs, while seven had unilateral implants. All participants were
patients of the Department of Phoniatrics and Pedaudiology of the Muenster University Hos-
pital, Germany. One pair had received their implant at the Hannover Medical School but was
treated further in Muenster. Thus, across groups, all participants received the same type of
rehabilitation treatment procedures.
All CI users were provided with CIs from Cochlear1 (Cochlear, Sydney, Australia), with
nine using Freedom speech processors (seven poor performers, two good performers) and the
other nine using an Esprit 3G (two poor performers, seven good performers). Note that good
performers mainly used the Esprit 3G speech processor, the precursor of the Freedom proces-
sor, at the time of testing. In contrast, poor performers mainly used the Freedom processor as a
follow-up to wearing the Esprit 3G. Physicians and parents had hoped for an additional gain in
language performance due to a change in processor technology, which turned not out to be as
successful as hoped. For further information on CI-related processing strategies and patient
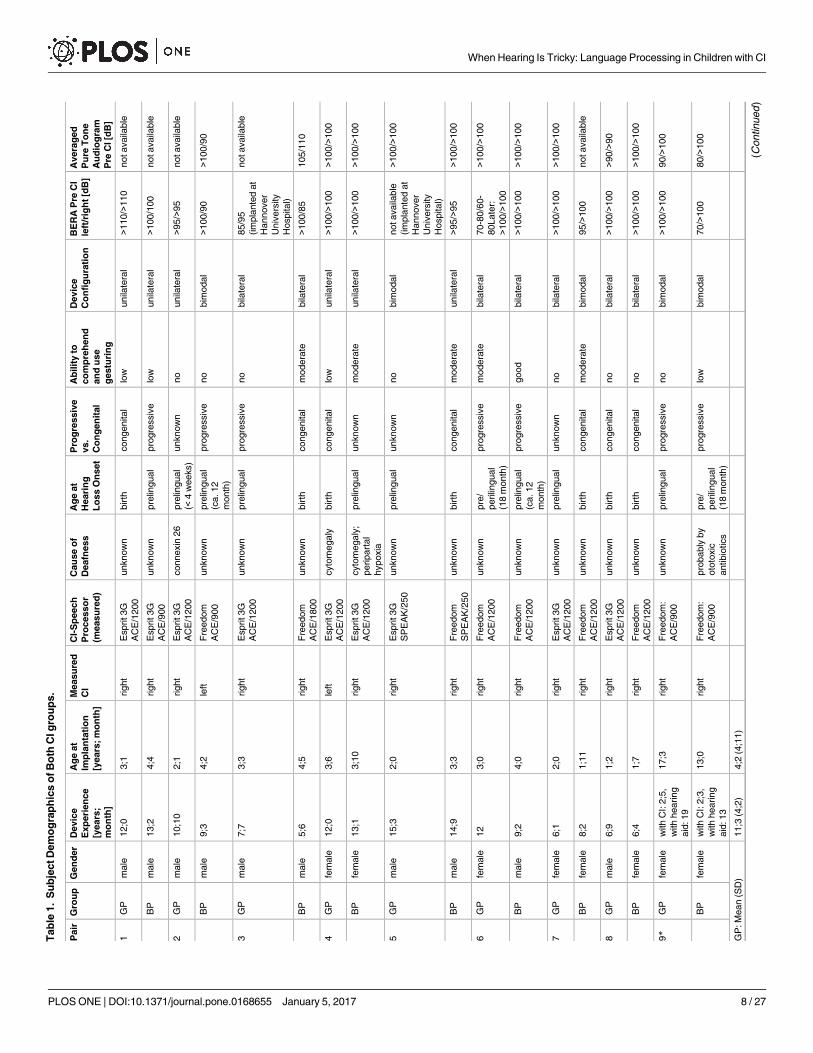
data, see Table 1.
The variance between CI users due to the number of CIs implanted (bilateral or unilateral)
was controlled for by measuring only their first implant in bilaterally treated patients. Four of
the unilaterally provided CI users used hearing aids on the contralateral side. Still, hearing
aides had no beneficial effect on language perception. Taken together, in 16 CI users the right
ear was assessed, while the left ear was assessed in two users. Although in most patients no
hearing ability remained in the contralateral ear, all received an earplug during auditory
testing.
Healthy controls. In addition to the two patient groups, phoneme discrimination abilities
and the MMN were measured in an age-matched control group with typical hearing (four
male, five female; 8 to 20 years, mean = 14 years). The same ear was stimulated in controls as
in their matched CI partners; the other ear was closed with an earplug.
Ethics statement. All participants (or their parents in case children were younger than 18
years) provided their written informed consent to participate in this study. The study was
approved by the Ethical Committee of the Deutsche Gesellschaft fur Psychologie (DGPS) in
conformance with the 2004 declarationof Helsinki.
General procedure. All CI users underwent a logopedic and phoniatric assessment by a
speech therapist, which lasted 1.5 hours. Next, phoneme discrimination abilities were mea-
sured. EEG was recorded in a camera silens, a soundproof and electrically shielded chamber.
Participants watched a silent movie of their choice during EEG registration. In sum, the com-
plete procedure took five to six hours, including breaks.
Data Assessment
Stimuli and stimulus presentation. Six German phonemes embedded in syllables were
chosen as stimulus material: /bu/, /bo/, /ba/, /pu/, /be/, /bi/, all with tense vowels. Stimuli were
spoken by a male adult recorded with Audacity 1.3.beta1 using a sample rate of 48,000 Hz and
resolution of 16 bit. Cool Edit Pro 1.2a1 was used for further processing. Stimuli were cut to
be as equal as possible in length, but to still sound like the intended syllable, varying from 420
to 451 ms in duration (mean = 435 ±14.5 ms). An onset of the sound file that sounded the
most natural was chosen. Stimuli were carefully faded in to avoid sound artifacts. This resulted
in a brief “silence” before language onset (depending on the stimulus, up to 50 ms, see Fig 1 in
the supplementary material). To avoid clipping, stimuli were normalized to 95% of the maxi-
mum amplitude and equalized in average RMS values. Syllables were presented via two
When Hearing Is Tricky: Language Processing in Children with CI
PLOS ONE | DOI:10.1371/journal.pone.0168655 January 5, 2017 7 / 27
Tab
le1.
Su
bje
ctD
em
og
rap
hic
so
fB
oth
CIg
rou
ps.
Pair
Gro
up
Gen
der
Devic
e
Exp
eri
en
ce
[years
;
mo
nth
]
Ag
eat
Imp
lan
tati
on
[years
;m
on
th]
Measu
red
CI
CI-
Sp
eech
Pro
cesso
r
(measu
red
)
Cau
se
of
Deafn
ess
Ag
eat
Heari
ng
Lo
ss
On
set
Pro
gre
ssiv
e
vs.
Co
ng
en
ital
Ab
ilit
yto
co
mp
reh
en
d
an
du
se
gestu
rin
g
Devic
e
Co
nfi
gu
rati
on
BE
RA
Pre
CI
left
/rig
ht
[dB
]
Avera
ged
Pu
reT
on
e
Au
dio
gra
m
Pre
CI[d
B]
1G
Pm
ale
12;0
3;1
right
Esprit3G
AC
E/1
200
unknow
nbirth
congenital
low
unila
tera
l>1
10/>
110
notavaila
ble
BP
male
13;2
4;4
right
Esprit3G
AC
E/9
00
unknow
npre
lingual
pro
gre
ssiv
elo
wunila
tera
l>1
00/1
00
notavaila
ble
2G
Pm
ale
10;1
02;1
right
Esprit3G
AC
E/1
200
connexin
26
pre
lingual
(<4
weeks)
unknow
nno
unila
tera
l>9
5/>
95
notavaila
ble
BP
male
9;3
4;2
left
Fre
edom
AC
E/9
00
unknow
npre
lingual
(ca.12
month
)
pro
gre
ssiv
eno
bim
odal
>100/9
0>1
00/9
0
3G
Pm
ale
7;7
3;3
right
Esprit3G
AC
E/1
200
unknow
npre
lingual
pro
gre
ssiv
eno
bila
tera
l85/9
5
(im
pla
nte
dat
Hannover
Univ
ers
ity
Hospital)
notavaila
ble
BP
male
5;6
4;5
right
Fre
edom
AC
E/1
800
unknow
nbirth
congenital
modera
tebila
tera
l>1
00/8
5105/1
10
4G
Pfe
male
12;0
3;6
left
Esprit3G
AC
E/1
200
cyto
megaly
birth
congenital
low
unila
tera
l>1
00/>
100
>100/>
100
BP
fem
ale
13;1
3;1
0right
Esprit3G
AC
E/1
200
cyto
megaly
;
peripart
al
hypoxia
pre
lingual
unknow
nm
odera
teunila
tera
l>1
00/>
100
>100/>
100
5G
Pm
ale
15;3
2;0
right
Esprit3G
SP
EA
K/2
50
unknow
npre
lingual
unknow
nno
bim
odal
notavaila
ble
(im
pla
nte
dat
Hannover
Univ
ers
ity
Hospital)
>100/>
100
BP
male
14;9
3;3
right
Fre
edom
SP
EA
K/2
50
unknow
nbirth
congenital
modera
teunila
tera
l>9
5/>
95
>100/>
100
6G
Pfe
male
12
3;0
right
Fre
edom
AC
E/1
200
unknow
npre
/
perilin
gual
(18
month
)
pro
gre
ssiv
em
odera
tebila
tera
l70-8
0/6
0-
80Late
r:
>100/>
100
>100/>
100
BP
male
9;2
4;0
right
Fre
edom
AC
E/1
200
unknow
npre
lingual
(ca.12
month
)
pro
gre
ssiv
egood
bila
tera
l>1
00/>
100
>100/>
100
7G
Pfe
male
6;1
2;0
right
Esprit3G
AC
E/1
200
unknow
npre
lingual
unknow
nno
bila
tera
l>1
00/>
100
>100/>
100
BP
fem
ale
8;2
1;1
1right
Fre
edom
AC
E/1
200
unknow
nbirth
congenital
modera
tebim
odal
95/>
100
notavaila
ble
8G
Pm
ale
6;9
1;2
right
Esprit3G
AC
E/1
200
unknow
nbirth
congenital
no
bila
tera
l>1
00/>
100
>90/>
90
BP
fem
ale
6;4
1;7
right
Fre
edom
AC
E/1
200
unknow
nbirth
congenital
no
bila
tera
l>1
00/>
100
>100/>
100
9*
GP
fem
ale
with
CI:
2;5
,
with
hearing
aid
:19
17;3
right
Fre
edom
:
AC
E/9
00
unknow
npre
lingual
pro
gre
ssiv
eno
bim
odal
>100/>
100
90/>
100
BP
fem
ale
with
CI:
2;3
,
with
hearing
aid
:13
13;0
right
Fre
edom
:
AC
E/9
00
pro
bably
by
oto
toxic
antibio
tics
pre
/
perilin
gual
(18
month
)
pro
gre
ssiv
elo
wbim
odal
70/>
100
80/>
100
GP
:M
ean
(SD
)11;3
(4;2
)4;2
(4;1
1)
(Continued
)
When Hearing Is Tricky: Language Processing in Children with CI
PLOS ONE | DOI:10.1371/journal.pone.0168655 January 5, 2017 8 / 27

Tab
le1.
(Continued
)
Pair
Gro
up
Gen
der
Devic
e
Exp
eri
en
ce
[years
;
mo
nth
]
Ag
eat
Imp
lan
tati
on
[years
;m
on
th]
Measu
red
CI
CI-
Sp
eech
Pro
cesso
r
(measu
red
)
Cau
se
of
Deafn
ess
Ag
eat
Heari
ng
Lo
ss
On
set
Pro
gre
ssiv
e
vs.
Co
ng
en
ital
Ab
ilit
yto
co
mp
reh
en
d
an
du
se
gestu
rin
g
Devic
e
Co
nfi
gu
rati
on
BE
RA
Pre
CI
left
/rig
ht
[dB
]
Avera
ged
Pu
reT
on
e
Au
dio
gra
m
Pre
CI[d
B]
GP
:M
ean
(SD
)w
ithout
pair
9
10;3
(3;2
)2;6
(0;9
)
BP
:M
ean
(SD
)10;4
(3;4
)4;6
(3;4
)
BP
:M
ean
(SD
)w
ithout
pair
9
9;1
1(3
;5)
3;5
(1;1
)
Dem
og
rap
hic
Data
an
dC
IS
pecifi
cIn
form
ati
on
:D
ata
were
retr
ieved
from
each
patient’s
medic
alr
ecord
.P
airs
were
matc
hed
accord
ing
todevic
eexperience
and
age
at
impla
nta
tion.A
llpart
icip
ants
deafe
ned
pre
lingually
.T
hose
who
had
receiv
ed
only
one
CIand
who
wore
ahearing
aid
contr
ala
tera
llyare
denote
das
“bim
odal”.P
lease
note
that
hearing
aid
sdid
notim
pro
ve
perf
orm
ance
inla
nguage
perc
eption
tests
and
are
no
indic
ato
rfo
rre
sid
ualhearing.
doi:10.1
371/jo
urn
al.p
one.
0168655.t001
When Hearing Is Tricky: Language Processing in Children with CI
PLOS ONE | DOI:10.1371/journal.pone.0168655 January 5, 2017 9 / 27

loudspeakers that were placed at an angle of ±20˚ azimuth approximately 1.5 m in front of the
participant, who was seated in a comfortable chair.
Stimuli were delivered via Presentation 13.01 (Neurobehavioral Systems, California, USA).
Loudness was adjusted individually by presenting the syllable /bo/ at intensities using an audi-
ometer (Medimate 622D from Otometrics, Taastrup, Denmark). A visual analog scale, which
was especially designed for children and adolescents to rate categorical loudness, was used
until the stimulus was reliably rated as “comfortably loud”, ensuring adequate und comparable
stimulation levels across participants.
The most difficult-to-differentiate pair out of three (/bu/ vs. /ba/, /bu/ vs. /bo/, bu/ vs. /pu/;
see Phoneme Discrimination Task below) was identified for each CI user and taken as the
stimulus pair for EEG registration. Stimuli had an average length of 436 ms and an inter-stim-
ulus interval of 900 ms (with a jittering of ± 200 ms). In 17 CI users, /bu/ vs. /bo/ was used, in
one user, /bu/ vs. /pu/ was used. Healthy controls were always stimulated with the phonetically
most similar and therefore most difficult to discriminate pair, /bu/ vs. /bo/ [48]. Please note
that /bu/ was presented to all participants in this design. Moreover, it was used as both stan-
dard and deviant, the order balanced across participants.
To identify the point in time at which those 26 participants, who were presented with /bu/-/
bo/, were able to reliably distinguish the target stimulus from the distractor, we performed a
gating task [49]. 20 participants (students of the University of Muenster, 10 female, aged 20–
30, Ø24 years) were presented with fragments of increasing duration of the sound files /bu/
and /bo/, starting at 70 ms and up to 350 ms, with increments of 20 ms. Participants had to
identify the corresponding syllable in a forced-choice task by pressing a button. Hits for all
fragments of the stimulus /bu/ were assessed. The point of identification was determined for
each subject as the fragment at which the identification was correct and not changed on subse-
quent fragments. These identification points were then averaged across participants and served
as an indicator of the time point within the stimuli at which the MMN could be triggered.
Data analyses revealed that, on average, 250 ms of /bu/ was sufficient for successful discrimina-
tion from /bo/ (std = 91 ms). Given that the MMN is triggered by differences between standard
and deviant, we used this duration as an index for the onset of the MMN. Therefore, MMN
latencies were reduced by 250 ms. In the results section, we present both latencies–corrected
and uncorrected. In the discussion, we only consider corrected latency (lc) times. With only
one out of 27 participants having received /bu/-/pu/, a corresponding procedure in the gating
task was abandoned.
Behavioral data and ratings. 1. Phoneme Discrimination Task: Phoneme discrimination
abilities were assessed by presenting four stimulus pairs varying in phonological similarity:
/bu/ vs. /bo/, /bu/ vs. /ba/, /bu/ vs. /pu/ and /be/ vs. /bi/, with /bu/ appearing in three out of
four pairs. This was done to identify the most difficult-to-discriminate stimulus pair in each
individual CI user, which was then used in the MMN registration. Note that /bu/ served as the
target stimulus for all participants, as standard and deviant. /be/ vs. /bi/ was used to extend
phonological discrimination beyond the vowel /u/ (but was never selected as the most difficult
pair).
The order of the four subtests was randomized across CI users. Participants had to differen-
tiate stimulus pairs in a forced-choice design by deciding which stimulus had just been pre-
sented via mouse click. Each test consisted of 60 repetitions, with equal probabilities of
occurrence for both stimuli. Hits, misses, correct rejections and false alarms were used to cal-
culate the sensitivity index d’.
2. Subjective Satisfaction Rating: To identify personal satisfaction with language perception,
CI users self-rated twelve items concerning their ability to function in daily communication
situations; for example: “How often do you talk to somebody on the phone you don’t know?”.
When Hearing Is Tricky: Language Processing in Children with CI
PLOS ONE | DOI:10.1371/journal.pone.0168655 January 5, 2017 10 / 27

Items were ordinally scaled (5-point rating scale) with the levels: “never”, “rarely ever”, “some-
times”, “often” and “always”. Together, scores ranged between 12 and 60 points. Questions
were adapted from theManchester Teen Questionnaire, which is part of the TeenEars Testbox[47]; see S3 Table of the supplementary material.
Eeg data recording. An odd-ball paradigm with a ratio of 85:15 (standard:deviant, in per-
cent) was used to evoke the mismatch negativity, with two runs, resulting in 803 standards and
141 deviants per run. Each run lasted approximately 20 minutes.
Participants watched a silent movie of their own choice. Brain responses were measured
with a 32-channel EEG cap (model “Easycap BrainCap-MR 3–0 32Ch) using electrodes that
were located according to the international 10–20 system. FCz was defined as the reference
channel, eye blinks were recorded with an EOG electrode that was placed at a central position
below the right eye. Electrode impedances were always kept below five kΩ. Electrodes located
above the CI (on average 2.8 electrodes per subject) were left out of the analyses. This proce-
dure was shown not to influence source localization in CI users [40,50]. Passing an amplifier
(Brain Amp MR, 32 channels), data were filtered online with 0.1–250 Hz and recorded with
500 Hz using Brain Vision Recorder1. Additionally, participants’ individual electrode posi-
tions were digitized using Polhemus Fastrack1 3D to account for inter-individual differences.
Data Processing and Analyses
1. Behavioral data and ratings. Phoneme Discrimination Task: In addition to the sensitiv-
ity index d’ that was individually calculated for each stimulus pair, a discriminant analysis was
computed to investigate whether individual performance in the difficult condition of the pho-
neme discrimination task could correctly predict group membership. A repeated measures
ANOVA was calculated to identify differences between groups. Two-tailed paired t-tests were
used to investigate effects more in detail [51].
Eeg data analysis. EEG data were imported into BESA 5.31 and epoched from -200 to
600 ms, to analyze the Mismatch Negativity. Each CI user’s electrode position was normalized
to account for differences in head forms, and dead channels were interpolated. To avoid exces-
sive loss of trials due to the poor quality often found in patient data, eye-blink distorted trials
were not simply rejected, but corrected using the adaptive artifact correction method provided
by BESA1 [52]. This method models not only the artifact that has to be excluded (defined
here by manually marking a typical eye blink, followed by automatic identification of other
blinks, which are then averaged to obtain the typical waveform and topography of the artifact),
but also models the brain activity to be retained. This way, brain activity and artifact are disen-
tangled and brain waves, especially in frontal EEG channels, are not distorted. Blink-free EEG
data were baseline-corrected from -150 to 0 ms and filtered from 0.1 to 25 Hz. All other arti-
facts (as e.g. due to movement) were removed using the artifact scan tool implemented to
BESA1. Standards immediately preceded by a deviant were excluded from analyses. In good
performers, 72% of all standards and 90% of deviants remained for analyses; in poor perform-
ers, this was 67/77%, in controls 70/87%. Next, the reference was set from FCz to average refer-
ence, electrode positions were transformed into standard positions and data were exported via
MATLAB 2009a1 to Emegs2.51 [53].
In Emegs, cortical sources of the event-related fields were estimated using the L2-Mini-
mum-Norm-Estimates (L2-MNE) method for standards and deviants separately [54]. The
L2-MME is an inverse modeling technique applied to reconstruct the topography of the pri-
mary current underlying the electric field distribution. It allows the estimation of distributed
neural-network activity without a priori assumptions on the location and/or number of
current sources [55]. In addition, of all possible generator sources, only those exclusively
When Hearing Is Tricky: Language Processing in Children with CI
PLOS ONE | DOI:10.1371/journal.pone.0168655 January 5, 2017 11 / 27

determined by measured electric fields are considered. Calculation of the L2-Minimum-
Norm-Estimates was based on a spherical four-shell isotropic volume conductor head model,
with three (radial, azimuthal, and polar direction) × 127 evenly and spherically distributed
dipoles as source model. A source shell radius of 6 cm was chosen as trade-off between depth
sensitivity and spatial resolution (Tikhonov regularization parameter k = 0.1). This distributed
source reconstruction in EEG does not precisely localize cortical generators, but allows an
approximation of cortical generators and a corresponding assignment to larger cortical
structures.
In the control group, the MMN was established by calculating a point-wise repeated-mea-
sures ANOVA computed for each dipole and time point using the within-factor “stimulus”
(standard vs. deviant). The control group provided a reference for the time course and the
localization of the MMN in participants with typical hearing.
To identify the MMN in CI users and to find differences between good and poor perform-
ers regarding the MMN, another point-wise ANOVA with the within-factor “stimulus” and
the between-factor “group” was performed (ANOVA 1). The main effect “stimulus” served as
an indicator for the MMN and the interaction “stimulus x group” displayed significant group
differences. To investigate the interaction of group and stimulus in more detail, an additional
point-wise ANOVA with the between-factor “group” was calculated, using the difference waveforms derived by subtracting averaged standards from deviants in each individual CI-user
(ANOVA 2). Thus, this ANOVA was performed on the MMN response.
Each point-wise ANOVA resulted in a spatiotemporal distribution of statistical values for
each dipole and time-point. Clusters displaying significant F-values (p<0.05) over at least ten
consecutive data points and five adjacent diploes were chosen for further statistical analysis. In
case of unilateral activation, significant clusters were mirrored to homologous regions of the
other hemisphere to test for hemispheric differences and their interactions. For this, data of the
mirrored clusters were averaged cluster-wise and exported to SPSS119. Another repeated-
measures ANOVA was calculated with the within-factor “stimulus” (ANOVA 1)/between-fac-
tor “group” (ANOVA 2) and the within-factor “hemisphere”. If necessary, post-hoc compari-
sons were performed with paired t-tests. Additionally, Pearson’s correlation tests were
performed for each cluster, with phoneme discrimination (for all participants), individual satis-
faction with his or her language perception and age at implantation (for CI users) as variables.
Differences in MMN strength between controls with typical hearing and CI users were
roughly tested by calculating a repeated-measures ANOVA with the between-factor “group”
and the within-factor “stimulus”, using the average amplitude of both group’s MMN (averaged
across different clusters, if necessary).
Artifacts evoked by the implant. Using the identical stimulus as deviant and standard,
the resulting MMN as the subtraction of standard and deviant is argued to be free of pure stim-
ulus differences [56]. This also has the advantage that deviants and standards produce an iden-
tical CI artifact, which can then be eliminated by subtracting standards from deviants, as has
already successfully been done [6,44].
To acknowledge the possible influence of the CI artifact on the MMN time course and
localization, the neural signature of the artifact is displayed in time (Fig 3A) and space (Fig
5C). Artifact localization was done in standards and deviants.
All variables were tested for normality via the Kolmogorov Smirnov test. P-values for results
were Greenhouse-Geisser corrected for non-sphericity (if necessary). In effects that were not
derived from hypotheses, p-values of multiple paired t-tests/multiple correlation tests were
bonferroni-corrected within each cluster [57]. To avoid excessive information, bonferroni cor-
rection was mentioned only in case the corrected t-test lost significance (by reporting the
adjusted critical p-value (pcrit)). All performed t-tests were two-tailed [51].
When Hearing Is Tricky: Language Processing in Children with CI
PLOS ONE | DOI:10.1371/journal.pone.0168655 January 5, 2017 12 / 27

Fig 2. MMN in sensor space. Global power plot for standards, deviants and their difference waveform (deviant minus standard)
of the control group (A) and averaged for both CI groups (B). The difference waveform of the controls shows a distinct MMN, with a
peak at approximately 280 ms, which was far less prominent in CI users (B). Here, the CI artifact is clearly visible in standards and
deviants from 100 to 130 ms, but not in their difference waveform. (C/D): topographic map of the MMN across time with a central
negativity displaying the MMN in the control group (C) and–though less pronounced–in CI users (D). Data were assessed with
average reference.
doi:10.1371/journal.pone.0168655.g002
When Hearing Is Tricky: Language Processing in Children with CI
PLOS ONE | DOI:10.1371/journal.pone.0168655 January 5, 2017 13 / 27

Fig 3. MMN in source space. (A) global power plot for minimum norm estimates of the CI group, separately displayed for deviants, standards
and their difference (MMN). The artifact is clearly visible in standards and deviants from 100 to 130 ms, but–as in sensor space–not in their
difference waveform. (B) Global power plot of the difference waveform for all three groups and (C) averaged across both CI groups, with a focus
on the MMN time window. (D/E) Topographic map of the MMN in the control group and (D) averaged for both CI groups (E). While the control
group showed a bilateral MMN in temporal and supramarginal regions, CI users engaged not only auditory, but also frontal and occipital regions
during MMN. (F) Poor performers showed (a trend) for significantly higher activity in the left occipital cortex during MMN.
doi:10.1371/journal.pone.0168655.g003
When Hearing Is Tricky: Language Processing in Children with CI
PLOS ONE | DOI:10.1371/journal.pone.0168655 January 5, 2017 14 / 27

Fig 4. Source localization for the difference waveforms of the good (A) and poor (B) performers across time. Visual impression that
both groups differ regarding the activation of the right temporal and right supramarginal cortex (GP>BP) before the MMN begins and in the left
occipital cortex (BP>GP) during and before the MMN is underlined by statistical analyses (C).
doi:10.1371/journal.pone.0168655.g004
When Hearing Is Tricky: Language Processing in Children with CI
PLOS ONE | DOI:10.1371/journal.pone.0168655 January 5, 2017 15 / 27

Results
Behavioral Data and Ratings
Phoneme discrimination task. Statistical analyses showed that control participants had
excellent phoneme discrimination abilities across all phoneme pairs and good performers a
similar performance level. Poor performers did significantly worse than good performers
(please note that these results were originally published in [6], therefore a detailed statistical
report is not given here). Sorted by each person’s most difficult-to-differentiate subtest, the
three groups showed a different performance: while control participants performed on a very
high level (d’ = 4.25, which equals about 99% correct answers), good performers showed mod-
erate performance (d’ = 1.25, 68% correct answers) and poor performers performed on guess-
ing level (d’ = -0.41, equaling about 47% correct answers). Therefore, there was a significant
decrease in the ability to discriminate the most difficult phoneme pair from the control group
to the good performers (t(8) = 5.2, p = 0.001) and from good to poor performers (t(8) = 2.67,
p = 0.03). Statistical differences between groups and across all subtests are displayed in Fig 1.
These results clearly demonstrate the validity of phoneme discrimination tests to distinguish
good and poor performers at a group level.
Discriminant analysis. The predictive value of phoneme discrimination abilities was
tested on an individual basis via a discriminant analysis. Of the two variables (d’ of phoneme
discrimination in the difficult condition, and age at implantation), only the first entered the
model (entry criterion: F = 3.84, remove criterion: F = 2.71, F(1,16) = 74.17, p<0.001), with the
result that every single CI user was correctly sorted into his or her performance group. On a
single-case level, this impressively confirms the power to predict a group membership that
was established by means of a large test battery with only one variable indexing phonological
awareness. The result did not change when pair 9 was excluded (F(1,14) = 56.75, p<0.001).
EEG Data
Sensor space. To be able to compare the MMN to results to previous ERP studies, stan-
dards, deviants and their difference waveforms are displayed for all three groups in sensor
space, in terms of a global power plot for standards, deviants and the difference waveforms.
This is done for the control group (Fig 2A) and the averaged CI groups (Fig 2B), and as topo-
graphic maps across time for the difference waveform of the control (Fig 2C) and the averaged
CI groups (Fig 2D).
Fig 5. Source localization for the significant group differences found before the MMN began. While good performers showed significantly higher
activation from 220 to 260 ms in the right marginal cortex (A), poor performers activated their left occipital cortex more strongly from 220 to 280 ms. This
allows the conclusion that both groups engaged different neural patterns for the processing of difficult-to-differentiate phoneme pairs. (C) Correct source
localization of the averaged CI artifact in the 16 participants who wore their CI on the right side.
doi:10.1371/journal.pone.0168655.g005
When Hearing Is Tricky: Language Processing in Children with CI
PLOS ONE | DOI:10.1371/journal.pone.0168655 January 5, 2017 16 / 27
Source space. Fig 3A separately displays the global power of the L2-MNE for deviants,
standards and their difference waveform, averaged for all CI users. While standards and devi-
ants both clearly show the impact of the artifact caused by the implant, their difference wave-
form is free of this artifact. The artifact was identical in deviants and standards, and appeared
between 100 to 130 ms with a maximum at 114 ms. As a consequence, it completely disap-
peared after calculating the deviant-standard difference. Fig 5C shows the artifact localization
in the 16 CI users who wore their implant on the right side. As expected, it was correctly
located in the right temporal lobe and, as demonstrated below, did not confound the MMN
results in the spatial or in the time domain.
MMN of the control group: Fig 3B separately displays the global power of the MMN (deviant
minus standard) for all three groups. Inspection of the amplitude of the MMN showed that the
control group displays a stronger MMN than both patient groups. The time course of the
MMN in the control participants (black line) revealed a MMN from 470 to 600 ms (220–350
ms latency corrected (lc)), with a peak at around 550 ms (300 ms lc). Projecting the L2-MNE
source localization for this time interval onto a cortical surface, a bilateral activation in tempo-
ral regions was found from 505 to 600 ms (255–350 ms lc), consisting of 19 dipoles each (main
effect “stimulus”: F(1,8) = 21.04; p<0.01), with a trend for a hemispheric dominance of the left
hemisphere (“stimulus x hemisphere”: F(1,8) = 3.95; p = 0.08, t(8) = 1.99, p = 0.08, see Fig 3D).
The sources of the left and right hemisphere did not correlate with phoneme discrimination
abilities in the difficult condition (left: r = -0.24, p = 0.53; right: r = -0.11, p = 0.78, N = 9).
MMN of the CI users: Given the latency and the regions of interest (ROI) predefined by the
literature and by the MMN of the control group, the MMN of the CI users was expected in
fronto-temporal regions, starting not earlier than 470 ms (220 ms lc). Fig 3C displays the Global
Power plot of the main-effect “stimulus” from ANOVA 1, showing the MMN in CI users from
500 to 600ms (250–350ms lc), with a clear peak at about 550 ms (300ms lc). Fig 3E shows the
result of ANOVA 1 averaged for both patient groups and projected on a cortical surface. The
MMN was located within three different regions: the left prefrontal cortex, the right temporal
cortex with strong involvement of the supramarginal gyrus, and the left occipital cortex.
Follow-up analyses revealed highly significant effects of the MMN in the frontal cluster
from 540 ms to 590 ms (290–340 ms lc; cluster 1, main effect “stimulus”: F(1,16) = 19.64;
p<0.001; 29 dipoles; Fig 3E left) with no hemispheric dominance (“stimulus x hemisphere”:
F(1,16) = 2.78; p = 0.12). The same was found for the right temporal and supramarginal gyrus
from 530 to 600 ms (280–350ms lc; cluster 2, main effect “stimulus”: F(1,16) = 14.56; p = 0.002;
“stimulus x hemisphere”: F(1,16) = 0.76; p = 0.4; 13 dipoles; Fig 3E middle). In contrast, the
MMN component located in the occipital cluster (cluster 3, main effect “stimulus”: F(1,16) =
11.45; p = 0.004; 8 dipoles; Fig 3E right) was dominant to the left hemisphere (“stimulus x
hemisphere”: F(1,16) = 10.7; p = 0.005, standard vs. deviant in the left hemisphere: t(17) = 2.97,
p = 0.009), but not for the right hemisphere (p>0.5). In every cluster, deviants showed stronger
activity than standards (deviants ranging on average from 464 to 584 nAm (std: 167–190),
standards from 303 to 413 nAm (std: 104–161).
MMN–CI users vs. control group: To estimate group-specific differences in stimulus process-
ing between CI users and the control group, a repeated-measures ANOVA with the between-
factor “group” (controls vs. CI users) and the within-factor “stimulus” (standards vs. deviants)
was computed, revealing a significant main effect for the factor “stimulus”, with stronger activ-
ity in deviants than in standards across groups (F(1,25) = 42.7; p<0.001; deviants = 663 nAm;
standards = 437 nAm). There was no difference in stimulus processing between CI users and
controls with typical hearing (stimulus x group: F(1,25) = 1.37; p = 0.25). Remember that this
was just a crude estimation of MMN amplitudes in the groups, with MMN amplitude averaged
across all group-specific MMN-related clusters.
When Hearing Is Tricky: Language Processing in Children with CI
PLOS ONE | DOI:10.1371/journal.pone.0168655 January 5, 2017 17 / 27

Fig 4A and 4B separately show the L2-MNE of the MMN difference wave-forms projected
on a cortical surface for the two patient groups. Visual inspection suggests that the prefrontal
component of the MMN is equally strong in both groups, while the right temporal component
seems to be enhanced in good performers. In contrast, the left occipital component seems
more prominent in poor performers. Interestingly, these group differences seem not to be
restricted to the time range of the MMN, but also include those preceding the MMN.
MMN—good vs. poor performers: To investigate these differences, a second point-wise
repeated-measures ANOVA was calculated on the difference waveforms (deviants minus stan-
dards, ANOVA 2, for results, see Fig 4C), with the between-factor “group”. Hemispheric dom-
inance was investigated by mirroring significant clusters to the other hemisphere. During the
MMN time window, no significant group differences emerged in the main regions of interest–
the prefrontal or auditory cortex. A significant interaction was only observed for the left occip-
ital component of the MMN (group x hemisphere: F(1,16) = 8.04; p = 0.01, “cluster 4”, 7 dipoles,
see Fig 3F). Post-hoc analyses revealed a trend towards significance for stronger activity in the
poor performers than in the good performers, from 530 to 590 ms (280–340 ms lc) in the left
occipital regions (t(8) = 2.12, p = 0.07), which was not found in the right hemisphere (t(8) =
0.57, p = 0.59).
Differences preceding the MMN- good vs. poor performers: Besides this difference in the
MMN window, the point-wise ANOVA identified two significant group effects, both directly
preceding the MMN. In the area of the right supramarginal gyrus, this difference was found
from 470 to 510 ms (220–260 ms lc) in five dipoles (see Fig 5A); in the left occipital cortex, it
was seen from 470 to 540 ms (220–280 ms lc) in six dipoles (see Fig 5B). Adjacent dipoles were
combined and labeled “cluster 5” (right supramarginal gyrus) and “cluster 6” (left occipital
cortex).
To further investigate hemispheric dominance, clusters were mirrored to the other hemi-
sphere. For cluster 5, a repeated-measures ANOVA showed a significant interaction for group
x hemisphere (F(1,16) = 8.3; p = 0.01). Post-hoc tests revealed significantly stronger activity in
the right supramarginal gyrus in good performers than in poor performers (t(8) = 2.75,
p = 0.02), while no difference was found in the left homologous region (t(8) = 1.03, p = 0.33).
In the left occipital cortex, a repeated-measures ANOVA showed a trend toward significant
interaction (group x hemisphere; F(1,16) = 3.64; p = 0.07). Post-hoc t-tests revealed that activa-
tion in the left hemisphere was significantly larger in poor than in good performers (t(8) = 2.87,
p = 0.02). This was not found in the right hemisphere (t(8) = 1.17, p = 0.28).
Correlation analyses. To explore the relations between brain activity and behavioral per-
formance, we correlated regional activities with behavioral responses. For these group-differ-
entiating clusters, activity of the left occipital cortex during the MMN (cluster 4) was related to
the behavioral performance for phoneme discrimination in the difficult condition (r = -0.61,
p = 0.008, N = 18), which shows that the weaker phoneme discrimination was established in
CI users, the stronger the left occipital cortex was activated during the MMN (Fig 6A).
Interestingly, the same correlation was found before MMN onset: again, the left occipital
cortex (cluster 6) highly correlated with phoneme discrimination abilities in the difficult con-
dition (r = -0.61, p = 0.007, N = 18, Fig 6B). In the right supramarginal gyrus (cluster 5), a
trend for a significant correlation with individual satisfaction with one’s own language percep-
tion (r = 0.48, p = 0.04, Bonferroni correction: pcrit = α/3 = 0.016, N = 18) indicated that the
more strongly the right supramarginal gyrus was activated before MMN onset, the more satis-
fied a patient was with his or her language perception (Fig 6C).
Brain activity did not correlate with age at implantation during or before the MMN (all
r< 0.18, all p> 0.46, N = 18). The CI user who was stimulated with /bu/ vs. /pu/ instead of
/bu/ vs. /bo/ was tested for being an outlier within each cluster (defined by two standard
When Hearing Is Tricky: Language Processing in Children with CI
PLOS ONE | DOI:10.1371/journal.pone.0168655 January 5, 2017 18 / 27

deviations from mean activity). Except for the left occipital activation that preceded the MMN
(cluster 6), there was no difference compared to other CI users. Repetition of all tests involving
cluster 6 showed no changes in results when the outlier was removed.
Discussion
Our goal was to investigate phoneme processing in a difficult context in CI users that had
developed either good or poor language understanding skills after cochlear implantation in
early childhood. Due to its core function in language processing, we used phoneme discrimi-
nation and measured the mismatch negativity as its neurophysiological correlate. The cortical
origin of the electrophysiological response was determined with distributed source estimates.
The behavioral results confirmed the value of phoneme discrimination for the differentiation
of persons with either high or low performance in general language functions. The neurophys-
iological analyses demonstrated that the MMN in CI users is similar in latency and overall
amplitude to the MMN of matched controls. However, while the MMN in controls appeared
bilaterally in fronto-temporal regions from 255 to 350 ms, CI users showed their MMN from
280 to 350 ms in frontotemporal and occipital regions. This finding is in line with brain-imag-
ing studies that reported a pronounced occipital activity in CI users under purely auditory
conditions. These findings were taken as evidence for cross-modal perception, a consequence
of lip reading as a strategy for language comprehension [58]. Differences in language process-
ing between good and poor performers were only marginal in the MMN window, but signifi-
cant before typical time ranges of the MMN. During the MMN, there was a trend towards a
stronger activation of the left occipital cortex in the poor performers that was most significant
immediately before the onset of the MMN (220–290 ms). Additionally, the good performers
recruited the right supramarginal gyrus, which has been reported to be involved in the analysis
of phonemes [59,60].
Contrasting these results with our earlier study on phoneme discrimination in an easy con-
text suggests that, even after successful language development, CI users use different language
processing strategies that are strongly context dependent. Importantly, we provide evidence
Fig 6. Correlation analyses. Activity in the occipital cluster during (A) and before (B) the MMN correlated negatively with phoneme discrimination ability
in the difficult condition. The stronger CI users activated their left occipital cortex, the poorer their performance was in the phoneme discrimination test. In
contrast to that, there was a trend for higher activity in the right supramarginal cluster being associated with more satisfaction regarding the CI user’s
subjectively perceived language intelligibility.
doi:10.1371/journal.pone.0168655.g006
When Hearing Is Tricky: Language Processing in Children with CI
PLOS ONE | DOI:10.1371/journal.pone.0168655 January 5, 2017 19 / 27
for this dissociation in response to the very same stimuli, presented in different language con-
texts. Taken together, our results emphasize the role of neural plasticity and adaptation in lan-
guage development after CI implantation. In the following, we discuss each of these aspects as
well as their implication for clinicians.
MMN Amplitude, Localization and Latency
Distributed source localization revealed that the MMN in CI users was localized in fronto-tem-
poral and occipital regions. Hemispheric dominance was only found for the left occipital clus-
ter. Except for this cluster, the cortical origin of the MMN fits with the literature reporting
bilateral fronto-temporal activations [29,31]. It also fits with our earlier results for the same
deviant, when it was easy to discriminate from the standard (/bu/ vs. /ba/). In that study, the
MMN also appeared in fronto-temporal regions, but hemispheric dominance was far more
prominent [6]. This may indicate that recruitment of both hemispheres is needed when lan-
guage perception is difficult. The activation over temporal regions, only observed in the cur-
rent study, involved the supramarginal gyrus, a region known to be highly involved in
phoneme discrimination [59–61]. Another difference concerns the amplitude of the MMN
which was strongly attenuated relative to study 1. We believe that this reduction is due to the
difficulty to distinguish the presented phonemes, given that the MMN is reduced when audi-
tory items are hard to differentiate (e.g., [62]), an effect that is especially strong in CI users
[35].
With a latency of 220 to 350 ms, the MMN of our control participants with typical hearing
appeared late and was rather broad. This was expected for reasons detailed in our earlier study
[6]: for example, subtle differences between standards and deviants are reflected in delayed
MMN latencies (e.g., [62]). Also, children and young adults aged 7 to 19 years were tested, and
it is known from developmental studies that ERP latencies decrease over the course of matura-
tion [63,64]. Given that the age range of our children was rather large, we assume that this led
to the long-lasting MMN. Moreover, phonemes trigger a rather broad MMN [33,65,66], in
children as well as in adults [67].
In 17 out of 18 CI users, /bu/ vs. /bo/ was identified as the most difficult to differentiate
phoneme pair. Only in one user, this was /bu/ vs. /pu/. Based on the gating task that was per-
formed by 20 university students with typical hearing, the time window in which the MMN
was expected to appear, was defined. Still, the gating task was performed only for /bu/ vs. /bo/,
neglecting the one participants who had received /bu/ vs. /pu/ instead of /bu/ vs. /bo/. It can be
assumed, that a gating task performed on /bu/ vs. /pu/ would have resulted in an earlier point
of identification, due to the different consonants at the beginning of both syllables. Therefore,
also the MMN should have been triggered earlier in this participant. This possibly added more
variance to the data. Still, further statistical testing did not reveal an influence of stimulation
on the effects found in the EEG. As a consequence, the one participant who had received /bu/
vs. /pu/ instead of /bu/ vs. /bo/ did not change the results of the current study.
Language Processing in Good and Poor Performers
We found no significant difference between good and poor performers regarding the overall
amplitude of the MMN. This was surprising, because it did not reflect the behavioral evidence
for phoneme discrimination, which was much better in good performers. Given that the
MMN–although amplitude reduced (cf. [6])–was comparable in both patient groups, it seems
that other group specific information processing strategies were employed when phoneme dis-
crimination is difficult. These might be relevant to understand why some patients developed
well and others did not.
When Hearing Is Tricky: Language Processing in Children with CI
PLOS ONE | DOI:10.1371/journal.pone.0168655 January 5, 2017 20 / 27

For a MMN to be generated, a thorough evaluation of the sensory input is necessary before-
hand [68]. If standards and deviants show only subtle differences, this early sensory analysis is
likely to be intensified. This may explain why we found differences between groups prior to
the MMN time range that was defined on the basis of a gating task. Note also, as briefly
described in the introduction, that deviant detection correlates with earlier neurophysiological
components than the MMN and its typical time range [34]. We use the term MMN here in ref-
erence to the large body of existing literature, but we regard it an open issue if this terminology
with relatively fixed time intervals will hold for the future. We observed an enhanced activation
in the good performers of the right supramarginal gyrus from 220 to 260 ms, directly preced-
ing the time window of the MMN. Studies on word processing showed that the supramarginal
gyrus is involved in phonological processing, especially in phoneme discrimination and pho-
neme categorization [59–61]. We thus suggest that this region is activated in good performers
in order to enhance phonological processing and to correctly classify phonemes. A similar
right-lateralization of the supramarginal region as observed here was reported in postlingually
deafened CI users [69]. [70] showed increased activation of the right supramarginal gyrus in
phonological processing that was accompanied by decreased involvement of the left supramar-
ginal gyrus. Moreover, they observed decreased activation of the right supramarginal gyrus
during processing of environmental sounds. This was interpreted as a compensation strategy
that valued the processing of language stimuli as more important than that of environmental
sounds. Naturally, this adaptive process resulted in worse language perception after CI activa-
tion than in those postlingually deafened CI users who solely relied on their left supramarginal
gyrus to perceive language. In the current study with prelingually deafened CI users, who
received their implant before their fifths birthday, activation of the right supramarginal gyrus
during phonological processing was associated with better language development. This indi-
cates that the success of alterations in the functionality of brain areas in CI users highly
depends on prior experience and task affiliation of the affected regions.
In contrast to the involvement of the supramarginal gyrus in good performers, poor per-
formers displayed enhanced left occipital activity preceding the MMN. We assume that both
groups recruit the visual cortex during the MMN for the interpretation of spoken verbal sti-
muli that are difficult to differentiate. Activity over visual regions under purely auditory condi-
tions is a phenomenon repeatedly reported in postlingually deafened CI users using methods
such as PET [71]. Based on these studies, we interpret the stronger activity in the left occipital
lobe in poor performers during (as a trend) and before the MMN as the consequence of com-
pensative strategies to gain additional information by e.g. lip reading [72] or other visual input
as e.g. sign language. This highly trained strategy leads to cross-modal activity [73], even in the
absence of visual input [71,74]. As can be seen in Table 1 most of our patients were trained
with more or less success in using non-verbal means to communicate.
But how did these group-specific differences in language processing develop? Based on the
literature, we see three possibilities: if the cross-modal activation constitutes a compensatory
mechanism that was established to cope with processing difficulties in poor performers, it
could be concluded that the two patient groups were not as well matched as intended, and dif-
fered in functions that we could not assess, as e.g neuronal survival in the auditory nerve or
brainstem nuclei. Also maladaptive cortical plasticity as e.g. an occupation of the auditory cor-
tex by visual functions (as described by [75]) could have prevented good development of pho-
neme representation in the auditory cortex as soon as hearing was rebuild. As such, it is
possible that poor performers had problems after CI activation to process auditory cues prop-
erly and—as a consequence- they may have been forced to rely more strongly on lip reading,
gesturing or German sign language. Until now, this is merely an assumption, as we have no
data on how both groups might differ. All patients were extensively tested before surgery to
When Hearing Is Tricky: Language Processing in Children with CI
PLOS ONE | DOI:10.1371/journal.pone.0168655 January 5, 2017 21 / 27

ensure their suitability for the use of CIs (e.g., logopedic and phoniatric assessment, audiome-
try, anatomy of the outer, middle, inner ear, and auditory nerve, etc.). They underwent almost
identical rehabilitative treatment after implantation in our clinic, though it cannot be ruled
out, that poor performers received distinct training in comprehension and use of gestures at
school. This would be supported by the fact that five out of six CI users with moderate to good
competence in the comprehension and use of gestures were poor performers, while good per-
formers showed twice as often no or only low performance (8:4). Still, this communication
mode is only used in language therapy to facilitate language comprehension. There was no
patient who was knowledgeable in German sign language.
Another possibility is that cross-modal activation was initially established to use visual cues
to support auditory language processing, which resulted in a learned-non-use phenomenon in
the long run (for a review, see: [76]). This phenomenon is well known in hemi-paretic stroke
patients, for whom compensatory processes generally favor the easiest way to reach respective
goals. In motor-impaired patients, this is evidenced by the preferred use of the unaffected arm,
due to its temporary functional superiority, even if it is the non-dominant one. Over time, this
leads to a complete lack of use of the affected arm, even after cortical recovery. In prelingually
deafened CI users, the same phenomenon could have occurred in the poor performers. Before
CI surgery, the visual channel was the main source of information for language. Interestingly,
even prelinguistic infants integrate auditory and visual language information and thus make
use of cross-modal perception to acquire language [77]. In CI users, due to years of intense
practice, this strategy is highly trained and very effective. After CI activation, signals from
the auditory channel were unfamiliar and their interpretation very complicated. Therefore,
patients who developed into poor performers might have persisted in focusing on lip reading
or other visual co-information as e.g. gesturing, thus further practicing the cross-modal inter-
pretation of language signals, while patients who developed well concentrated more on phono-
logical analyses.
Third, poor performers could have simply been less used to the new processing strategy fol-
lowing the last adjustment of their CIs aided thresholds. The average amount of time needed
to habituate to changes in the aided thresholds is around two to three weeks. Therefore, less
time could have resulted in lower performance in e.g. the phoneme discrimination tests. Still,
this would not explain differences in language performance. Also, all CI users had received
their last adjustment at least 2month (average 7.8) before taking part in our study, as a conse-
quence, we assume, that all CI users were fully used to their current map settings.
Apart from these arguments, there are two other factors in which our groups differ that
might explain the results. One concerns technological equipment. Poor performers more often
used a more modern speech processor technology (Freedom, 7:2) than good performers
(Esprit 3G, 2:7). But as mentioned in the methods section, poor performers received the Free-
dom processor as a follow up to the Esprit 3G to further improve language perception, while
the good performers showed satisfying results with the older processor technology and there-
fore had no need for better equipment. Therefore we consider it highly unlikely that this can
explain the differences in performance.
A more serious concern relates to differences in age at implantation. While we tried to
match the groups according to these criteria, good performers were on average implanted
eleven months earlier than poor performers (at least when pair 9 was excluded from group
comparisons). Therefore, it is possible that age at implantation had influenced cortical plastic-
ity after CI implantation. To investigate the influence of age at implantation on observed
effects, we included this factor in all subsequent steps of analysis. Age at implantation did not
result in group differences or significant correlations for behavioral or for neurophysiological
results. Consequently, differences in age at implantation–at least statistically- do not seem to
When Hearing Is Tricky: Language Processing in Children with CI
PLOS ONE | DOI:10.1371/journal.pone.0168655 January 5, 2017 22 / 27
be a likely explanation for the results of our study. Still, the current study population was–due
to the limited number of suitable long term patients- rather small. It is possible, that an
increased population size would have resulted in an effect of age implantation, but—obviously
—the effect was so small that it demanded larger group sizes. As a consequence, we cannot
rule out, that the differences in age at implantation led e.g. to weaker phoneme representations
in the auditory cortex of the poor performer due to maladaptive cortical plasticity following
the longer period of signal deprivation.
Therefore, unless other unknown reasons are responsible for the differences between
groups, we are convinced that phoneme discrimination abilities have a strong influence on
language development within the normal range in prelingually deafened CI users. Though lip
reading or the interpretation of other visual information (such as sign language or gesturing to
support language comprehension) is of great value in daily life communication and early on
during rehabilitation, a profound cortical representation of phonemes is of utmost importance
for good language comprehension. Therefore,—as shown here—testing phoneme pairs that
are difficult to differentiate can serve as an effective predictor of language performance and of
language function in general. Early and intensive training of phonological abilities should be
established as a clinical routine in prelingually deafened CI users to strengthen cortical repre-
sentation of phonemes in the auditory cortex. A training that is initially cross-modal, but that
gradually reduces the visual input–in terms of shaping, for example–could be highly effective
[78]. The resulting strengthening of the cortical representation should then facilitate higher
levels of language processing, leading to enhanced language performance. Taken together, our
results show that very different brain signatures can be evoked by the physically same stimuli
depending on the context in which they appear and on how well the hearer developed after
implantation. Even more advanced technology seems to be no guarantee for the high outcome
of language functions. Stressing the role of cortical plasticity, one of the major challenges for
future research is to develop individual training programs that allow each CI user to gain as
much benefit from the signal provided by the implant as possible. As already pointed out by
[22], we will only know the individual limitations in performance after “optimized, long-term
training” (p. 690).
Supporting Information
S1 Fig. Stimulus /bu/.
(TIF)
S1 Table. Criteria for speech and language performance.
(PDF)
S2 Table. Results of speech intelligibility tests.
(PDF)
S3 Table. Subjective rating of hearing abilities.
(PDF)
Acknowledgments
We thank Verena Bremer and Katharina Feldker for their help in data acquisition and their
dedication to our participants. We are grateful to Christo Pantev and Markus Junghofer for
their valuable comments and support and for the substantial improvements made by our two
reviewers. Finally, we are most indebted to all our CI-users for participating in this study.
When Hearing Is Tricky: Language Processing in Children with CI
PLOS ONE | DOI:10.1371/journal.pone.0168655 January 5, 2017 23 / 27

Author Contributions
Conceptualization: MO CD AK PZ.
Data curation: JB SB.
Formal analysis: MO CD.
Funding acquisition: MO CD PZ.
Investigation: MO SB JB.
Methodology: MO CD AK SB PZ.
Project administration: MO CD JB.
Resources: MO CD AZD.
Software: MO.
Supervision: CD PZ.
Validation: MO CD AK.
Visualization: MO.
Writing – original draft: MO CD PZ.
Writing – review & editing: MO CD PZ AK AZD.
References1. Eisen MD. The History of Cochlear Implants. Cochlear Implants—Principles and Practice. Lippencott
Williams & Wilkens; 2009. pp. 89–94.
2. Svirsky, Robbins, Kirk, Pisoni, Miyamoto. Language Development in Profoundly Deaf Children with
Cochlear Implants. Psychol Sci. 2000; 11: 153–158. PMID: 11273423
3. Colletti L, MandalàM, Zoccante L, Shannon R V, Colletti V. Infants versus older children fitted with
cochlear implants: performance over 10 years. Int J Pediatr Otorhi. 2011; 75: 504–9.
4. Miyamoto RT, Kirk KI, Svirsky MA, Sehgal ST. Communication skills in pediatric cochlear implant recipi-
ents. Acta Oto-Laryngol. 1999; 119: 219–24.
5. Sarant JZ, Blamey PC, Dowell RC, Clark GM, Gibson WPR. Children with Cochlear Implants. Otolaryn-
gology. 2001; 22: 18–28.
6. Ortmann M, Knief A, Deuster D, Brinkheetker S, Zwitserlood P, am Zehnhoff-Dinnesen A, et al. Neural
correlates of speech processing in prelingually deafened children and adolescents with cochlear-
implants. PLoS One. 2013; 8(7):e6769.
7. Eimas P. The perception of speech in early infancy. Sci Am. 1985; 252: 46–52.
8. Eimas P, Siqueland ER, Jusczyk P, Vigorito J. Speech perception in infants. Science. 1971; 171: 303–
6. PMID: 5538846
9. Streeter LA. Language perception of 2-month-old infants shows effects of both innate mechanisms and
experience. Nature. 1996; 259: 39–41.
10. Kuhl PK, Williams KA, Lacerda F, Stevens KN, Lindblom B. Linguistic Experience Alters Phonetic Per-
ception in Infants by 6 Months of Age. Science. 1992; 255: 606–608. PMID: 1736364
11. Kuhl PK, Stevens E, Hayashi A, Deguchi T, Kiritani S, Iverson P. Infants show a facilitation effect for
native language phonetic perception between 6 and 12 months. Dev Sci. 2006; 2: 13–21.
12. Tsao FM, Liu HM, Kuhl PK. Speech perception in infancy predicts language development in the second
year of life: a longitudinal study. Child Dev. 2004; 75: 1067–84. doi: 10.1111/j.1467-8624.2004.00726.x
PMID: 15260865
13. Maillart C, Parisse C. Phonological deficits in French speaking children with SLI. Int J Lang Comm Dis.
2006; 41: 253–74.
14. Stahl SA, Murray BA. Defining phonological awareness and its relationship to early reading. J Educ Psy-
chol. 1994; 86: 221–234.
When Hearing Is Tricky: Language Processing in Children with CI
PLOS ONE | DOI:10.1371/journal.pone.0168655 January 5, 2017 24 / 27

15. Rvachew S, Ohberg A, Grawburg M, Heyding J. Phonological awareness and phonemic perception in 4-
year-old children with delayed expressive phonology skills. Am J Speech-Lang Pat. 2003; 12: 463–71.
16. Lyxell B, Sahlen B, Wass M, Ibertsson T, Larsby B, Hallgren M, et al. Cognitive development in children
with cochlear implants: relations to reading and communication. Int J Audiol. 2008; 47 Suppl 2: S47–52.
17. Geers AE. Predictors of reading skill development in children with early cochlear implantation. Ear
Hear. 2003; 24: 59–68.
18. Dillon CM, Pisoni DB. Nonword repetition and reading in deaf children with cochlear implants. Int Congr
Ser. 2001; 1273: 304–307. doi: 10.1016/j.ics.2004.07.042 PMID: 21442032
19. Harris M, Moreno C. Deaf children’s use of phonological coding: evidence from reading, spelling, and
working memory. JDSDE. 2004; 9: 253–68. doi: 10.1093/deafed/enh016 PMID: 15304430
20. Fiori A, Reichmuth K, Matulat P, Schmidt C, Am Zehnhoff-Dinnesen A. Do children with cochlear
implants read or write differently?: literacy acquisition after cochlear implantation. HNO. 2010; 58: 934–
46. doi: 10.1007/s00106-010-2088-8 PMID: 20517587
21. Krueger B, Joseph G, Rost U, Strauss-Schier A, Lenarz T, Buechner A. Performance groups in adult
cochlear implant users: speech perception results from 1984 until today. Otol Neurotol. 2008; 29: 509–
12. doi: 10.1097/MAO.0b013e318171972f PMID: 18520586
22. Moore DR, Shannon R V. Beyond cochlear implants: awakening the deafened brain. Nat Neurosci.
2009; 12: 686–91. doi: 10.1038/nn.2326 PMID: 19471266
23. Naatanen R, Jacobsen T, Winkler I. Memory-based or afferent processes in mismatch negativity
(MMN): a review of the evidence. Psychophysiology. 2005; 42: 25–32. doi: 10.1111/j.1469-8986.2005.
00256.x PMID: 15720578
24. Sussman E, Winkler I. Dynamic sensory updating in the auditory system. Cogn Brain Res. 2001; 12:
431–9.
25. Shestakova A, Brattico E, Huotilainen M, Galunov V, Soloviev A, Sams M, et al. Abstract phoneme rep-
resentations in the left temporal cortex: magnetic mismatch negativity. Neuroreport. 2002; 13: 1813–
1816. PMID: 12395130
26. Tavabi K, Elling L, Dobel C, Pantev C, Zwitserlood P. Effects of place of articulation changes on auditory
neural activity: a magnetoencephalography study. PLoS One. 2009; 4: e4452. doi: 10.1371/journal.
pone.0004452 PMID: 19209225
27. Menning H, Imaizumi S, Zwitserlood P, Pantev C. Plasticity of the human auditory cortex induced by dis-
crimination learning of non-native, mora-timed contrasts of the Japanese language. Learn Mem. 2002;
9: 253–67. doi: 10.1101/lm.49402 PMID: 12359835
28. Rinne T, Degerman A, Alho K. Superior temporal and inferior frontal cortices are activated by infrequent
sound duration decrements: an fMRI study. Neuroimage. 2005; 26: 66–72. doi: 10.1016/j.neuroimage.
2005.01.017 PMID: 15862206
29. Halgren E, Sherfey J, Irimia A, Dale AM, Marinkovic K. Sequential temporo-fronto-temporal activation
during monitoring of the auditory environment for temporal patterns. Hum Brain Mapp. 2011; 32: 1260–
76. doi: 10.1002/hbm.21106 PMID: 20665718
30. Lai Y, Tian Y, Yao D. MMN evidence for asymmetry in detection of IOI shortening and lengthening at
behavioral indifference tempo. Brain Res. Elsevier B.V.; 2011; 1367: 170–80.
31. Todd J, Robinson J. The use of conditional inference to reduce prediction error—a mismatch negativity
(MMN) study. Neuropsychologia. Elsevier Ltd; 2010; 48: 3009–18.
32. Pulvermuller F, Fadiga L. Active perception: sensorimotor circuits as a cortical basis for language. Nat
Rev Neurosci. Nature Publishing Group; 2010; 11: 351–60.
33. Pulvermuller F, Shtyrov Y. Language outside the focus of attention: The mismatch negativity as a tool
for studying higher cognitive processes. Prog Neurobiol. 2006; 79: 49–71. doi: 10.1016/j.pneurobio.
2006.04.004 PMID: 16814448
34. Escera C, Malmierca MS. The auditory novelty system: an attempt to integrate human and animal
research. Psychophysiology. 2014; 51: 111–23. doi: 10.1111/psyp.12156 PMID: 24423134
35. Lonka E, Kujala T, Lehtokoski A, Johansson R, Rimmanen S, Alho K, et al. Mismatch negativity brain
response as an index of speech perception recovery in cochlear-implant recipients. Audiol Neurootol.
2004; 9: 160–2. doi: 10.1159/000077265 PMID: 15084820
36. Kelly A, Purdy S, Thorne P. Electrophysiological and speech perception measures of auditory process-
ing in experienced adult cochlear implant users. Clin Neurophysiol. 2005; 116: 1235–46. doi: 10.1016/j.
clinph.2005.02.011 PMID: 15978485
37. Kraus N, Micco AG, Koch DB, McGee T, Carrell T, Sharma A, et al. The mismatch negativity cortical
evoked potential elicited by speech in cochlear-implant users. Hear Res. 1993; 65: 118–24. PMID:
8458744
When Hearing Is Tricky: Language Processing in Children with CI
PLOS ONE | DOI:10.1371/journal.pone.0168655 January 5, 2017 25 / 27

38. Ponton CW, Eggermont JJ, Don M, Waring MD, Kwong B, Cunningham J, et al. Maturation of the mis-
match negativity: effects of profound deafness and cochlear implant use. Audiol Neurootol. 2000; 5:
167–85. PMID: 10859411
39. Roman S, Canevet G, Marquis P, Triglia JM, Liegeois-Chauvel C. Relationship between auditory per-
ception skills and mismatch negativity recorded in free field in cochlear-implant users. Hear Res. 2005;
201: 10–20. doi: 10.1016/j.heares.2004.08.021 PMID: 15721556
40. Debener S, Hine J, Bleeck S, Eyles J. Source localization of auditory evoked potentials after cochlear
implantation. Psychophysiology. 2008; 45: 20–4. doi: 10.1111/j.1469-8986.2007.00610.x PMID:
17910729
41. Bolte J, Schulz C, Dobel C. Processing of existing, synonymous, and anomalous German derived
adjectives: An MEG study. Neurosci Lett. 2010; 469: 107–111. doi: 10.1016/j.neulet.2009.11.054
PMID: 19944741
42. Dobel C, Lagemann L, Zwitserlood P. Non-native phonemes in adult word learning: evidence from the
N400m. Philos Trans R Soc Lond B Biol Sci. 2009; 364: 3697–709. doi: 10.1098/rstb.2009.0158 PMID:
19933141
43. Shtyrov Y, Pulvermuller F. Early MEG activation dynamics in the left temporal and inferior frontal cortex
reflect semantic. J Cogn Neurosci. 2007; 19: 1633–1642. doi: 10.1162/jocn.2007.19.10.1633 PMID:
17854281
44. Friesen LM, Picton TW. A method for removing cochlear implant artifact. Hear Res. Elsevier B.V.; 2010;
259: 95–106.
45. Pulvermuller F, Shtyrov Y. Spatiotemporal signatures of large-scale synfire chains for speech process-
ing as revealed by MEG. Cereb cortex. 2009; 19: 79–88. doi: 10.1093/cercor/bhn060 PMID: 18460449
46. Keller F, Moser LM. Freiburger Sprachverstandnistest. Augsburg: WESTRA GmbH; 1969.
47. Anderson I, Phillips L, Roberts L, Jamieson L, Costa A, Cross S. TeenEARS: development of a pilot
assessment battery for cochlear implanted adolescents. Cochlear Implants Int. 2008; 9: 119–31. doi:
10.1002/cii.361 PMID: 18821567
48. Wiese R. Phonetik und Phonologie. 1st ed. Stuttgart: UTB; 2010.
49. Grosjean F. Spoken word recognition processes and the gating paradigm. Percept Psychophys. 1980;
28: 267–83. PMID: 7465310
50. Sandmann P, Eichele T, Buechler M, Debener S, Jancke L, Dillier N, et al. Evaluation of evoked poten-
tials to dyadic tones after cochlear implantation. Brain. 2009; 132: 1967–79. doi: 10.1093/brain/awp034
PMID: 19293240
51. Bortz J, Schuster C. Statistik fur Sozialwissenschaftler. 7th ed. Berlin: Springer; 2010. p. 655.
52. Ille N, Berg P, Scherg M. Artifact correction of the ongoing EEG using spatial filters based on artifact
and brain signal topographies. J Clin Neurophysiol. 2002; 19: 113–24. PMID: 11997722
53. Peyk P, De Cesarei A, Junghofer M. ElectroMagnetoEncephalography software: overview and integra-
tion with other EEG/MEG toolboxes. Comput Intell Neurosci. 2011; 2011: 1–10.
54. Hamalainen MS, Ilmoniemi RJ. Interpreting magnetic fields of the brain: minimum norm estimates. Med
Biol Eng Comput. 1994; 32: 35–42. PMID: 8182960
55. Hauk O. Keep it simple: a case for using classical minimum norm estimation in the analysis of EEG and
MEG data. Neuroimage. 2004; 21: 1612–21. doi: 10.1016/j.neuroimage.2003.12.018 PMID: 15050585
56. Picton TW, Bentin S, Berg P, Donchin E, Hillyard SA, Johnson R, et al. Guidelines for using human
event-related potentials to study cognition: recording standards and publication criteria. Psychophysiol-
ogy. 2000; 37: 127–52. PMID: 10731765
57. Field A. Discovering Statistic using SPSS. 4th ed. London: SAGE Publications Ltd.; 2014.
58. Giraud, Price, Graham, Truy, Frackowiak. Cross-modal plasticity underpins language recovery after
cochlear implantation. Neuron. 2001; 30: 657–63. PMID: 11430800
59. Gow D, Caplan D. An examination of impaired acoustic-phonetic processing in aphasia. Brain Lang.
1996; 52: 386–407. PMID: 8811970
60. Caplan D, Gow D, Makris N. Analysis of lesions by MRI in stroke patients with acoustic-phonetic pro-
cessing deficits. Neurology. 1995; 45: 293–8. PMID: 7854528
61. Gow D. The cortical organization of lexical knowledge: a dual lexicon model of spoken language pro-
cessing. Brain Lang. 2012; 121: 273–88. doi: 10.1016/j.bandl.2012.03.005 PMID: 22498237
62. Naatanen R. The perception of speech sounds by the human brain as reflected by the mismatch negativ-
ity (MMN) and its magnetic equivalent (MMNm). Psychophysiology. 2001; 38: 1–21. PMID: 11321610
63. Gomot M, Giard MH, Roux S, Barthelemy C, Bruneau N. Maturation of frontal and temporal compo-
nents of mismatch negativity (MMN) in children. Neuroreport. 2000; 11: 3109–12. PMID: 11043532
When Hearing Is Tricky: Language Processing in Children with CI
PLOS ONE | DOI:10.1371/journal.pone.0168655 January 5, 2017 26 / 27

64. Kurtzberg D, Vaughan HG, Kreuzer JA, Fliegler KZ. Developmental studies and clinical application of
mismatch negativity: problems and prospects. Ear Hear. 1995; 16: 105–17. PMID: 7774764
65. Dehaene-Lambertz G. Electrophysiological correlates of categorical phoneme perception in adults.
Neuroreport. 1997; 8: 919–24. PMID: 9141065
66. Eulitz C, Lahiri A. Neurobiological evidence for abstract phonological representations in the mental lexi-
con during speech recognition. J Cogn Neurosci. 2004; 16: 577–83. PMID: 15185677
67. Kraus N, McGee T, Sharma A, Carrell T, Nicol T. Mismatch negativity event-related potential elicited by
speech stimuli. Ear Hear. 1992; 13: 158–64. PMID: 1397755
68. Naatanen R, Kujala T, Winkler I. Auditory processing that leads to conscious perception: a unique win-
dow to central auditory processing opened by the mismatch negativity and related responses. Psycho-
physiology. 2011; 48: 4–22. doi: 10.1111/j.1469-8986.2010.01114.x PMID: 20880261
69. Lazard DS, Lee HJ, Gaebler M, Kell C, Truy E, Giraud A L. Phonological processing in post-lingual deaf-
ness and cochlear implant outcome. Neuroimage. Elsevier Inc.; 2010; 49: 3443–51.
70. Lazard DS, Lee H-JJ, Truy E, Giraud A-LL. Bilateral reorganization of posterior temporal cortices in
post-lingual deafness and its relation to cochlear implant outcome. Hum Brain Mapp. 2012; 34: 1208–
19. doi: 10.1002/hbm.21504 PMID: 22287085
71. Giraud, Truy, Frackowiak. Imaging plasticity in cochlear implant patients. Audiol Neurootol. 2001; 6:
381–93. PMID: 11847465
72. Proops Donaldson, Cooper Thomas, Burrell Stoddart, et al. Outcomes from adult implantation, the first
100 patients. J Laryngol Otol Suppl. 1999; 24: 5–13. PMID: 10664722
73. Doucet ME, Bergeron F, Lassonde M, Ferron P, Lepore F. Cross-modal reorganization and speech per-
ception in cochlear implant users. Brain. 2006; 129: 3376–83. doi: 10.1093/brain/awl264 PMID:
17003067
74. Giraud Truy. The contribution of visual areas to speech comprehension: a PET study in cochlear
implants patients and normal-hearing subjects. Neuropsychologia. 2002; 40: 1562–9. PMID: 11985837
75. Sandmann P, Dillier N, Eichele T, Meyer M, Kegel A, Debener S, et al. Visual activation of auditory cor-
tex reflects maladaptive plasticity in cochlear implant users. Brain. 2012; 135: 555–68. doi: 10.1093/
brain/awr329 PMID: 22232592
76. Mark VW, Taub E. Constraint-induced movement therapy for chronic stroke hemiparesis and other dis-
abilities. Restor Neurol Neurosci. 2004; 22: 317–36. PMID: 15502259
77. Burnham D, Dodd B. Auditory-visual speech integration by prelinguistic infants: perception of an emer-
gent consonant in the McGurk effect. Dev Psychobiol. 2004; 45: 204–20. doi: 10.1002/dev.20032
PMID: 15549685
78. Uswatte G, Taub E, Morris D, Barman J, Crago J. Contribution of the shaping and restraint components
of Constraint-Induced Movement therapy to treatment outcome. NeuroRehabilitation. 2006; 21: 147–
56. PMID: 16917161
When Hearing Is Tricky: Language Processing in Children with CI
PLOS ONE | DOI:10.1371/journal.pone.0168655 January 5, 2017 27 / 27