when 1/10th of a millimeter weighs 400 t
TRANSCRIPT

* [email protected] ; [email protected]
When 1/10th of a millimeter weighs 400 T
Jean-Marie Carrez1, *, Geoffroy Emain2
1AREVA NP, Technical Guarantor, Expert Studies Department, 71100 Chalon-Sur-Saône, France 2AREVA NP, Technical Expert, Industrial Measurement Studies Department, 71100 Chalon-Sur-Saône, France
Abstract Most of the examples encountered in dimensional metrology generally concern a single measurand and focus on the measurement system and its direct environment (Ishikawa diagram). The “analytical” application of the methodology presented in the Guide to the expression of uncertainty in measurement [1] appears, for example, unsuited to our operations because of the complexity of expression of the mathematical model. For the same reason, the Monte-Carlo method also seems to us to be complex in implementation and for the immediate term remains difficult to apply to our industrial process as a whole. Moreover, our main objective is not to determine dimensional conformity, but to guarantee that a process is operating which meets all the requirements, whether regulatory, contractual or technical. The aim of this presentation is to set out, with support from our experience feedback, how AREVA NP chose to treat the uncertainties of an industrial process by optimally combining the theoretical, empirical and practical approaches.
1 Introduction
Since the start of the nineties, AREVA NP (formerly Framatome) has been performing field services as part of maintenance operations on nuclear power-generating plants in France and in the export market.
One of its emblematic field projects has been the mid-life replacement of steam generators (Figure 1), which are key components of power plants used to exchange heat between the reactor coolant system heated up by the reactor and the secondary system which provides the rotation of the steam turbines. This overall replacement process extends over 2 years, with measurement of the component in the factory and upstream measurement of the on-site rooms in a complex environment.
Figure 1: Removing a used SG
A steam generator (SG) is a steel cylinder more
than twenty meters high and weighing almost 400 tonnes, enclosing up to 6000 inverted U-tubes.
The operation involves replacing this component by a new machined SG fitted to its two pipes at the bottom end arranged at 107° and forming a tilt angle of 40°.
The final aim of the operation is to enable assembling of the SG stainless steel pipes of diameter 800 mm and thickness 80 mm, with the two pipes remaining in the concrete structure while guaranteeing a concentricity under 1 mm between the two centers of the bevels and a parallelism under 1 mm between the two faces of the bevels (Figure 2).
Figure 2 : Fitup gap of two primary pipes
18th International Congress of Metrology, 01004 (2017)
© The Authors, published by EDP Sciences. This is an open access article distributed under the terms of the Creative Commons Attribution License 4.0 (http://creativecommons.org/licenses/by/4.0/).
DOI: 10.1051/ 701004metrology/201
Article available at http://cfmetrologie.edpsciences.org or https://doi.org/10.1051/metrology/201701004

2 Description of the operation
Steam generator replacement is a field service which requires performing several successive operations of different kinds, including a number of calculation and analysis steps (Figure 6).
2.1 Initial field measurement
The first phase completed two years beforehand is to generate a technical situation report during the periodic plant outage in order to determine the position of the original steam generator (SG) in its room, with respect to its environment. We then know the constraints which will enable determination of the adjustment margins for the installation of the new component.
2.2 Procurement of the replacement SG
The manufacturing control of the new steam generators is performed in the workshop, on the basis of the procurement drawings approved by Engineering. The measures taken at the various SG manufacturing stages and aiming to guarantee compliance with the manufacturing tolerances indicated in the technical specifications are outside the scope of this study. A digital videogrammetry measurement is taken on completion of the assembling of the new SG, before the primary pipe (PP) ends are machined (Figure 3). This measurement will be used to determine the available extra lengths and also to define a local coordinate system.
Figure 3: Videogrammetry measurement of the replacement SG
A first calculation is done in order to virtually
position the new SG in the room measured during the technical situation report. The principle is to optimize by calculation the position of the new SG, while taking into account the constraints generated by the support system (support legs, stops…) and the two primary pipes.
This calculation will be updated as the operation progresses by integrating the new data to refine the calculation.
The replacement SG is machined at both ends and a new measurement is taken. This measurement will be used to enable SG installation on site.
2.3 Performance of the replacement operations on site
2.3.1 Determining the position of the cuts
The third phase takes place in the cubicle and initially involves fitting into the coordinate system of the technical situation report measurement via the zero locations left in place. For accessibility to the measurement points, this measurement is also taken by videogrammetry, as this technique is perfectly suited to cramped spaces (Figure 4).
The next step is to make a new simulation of the SG position and to mark the position of the cuts on the primary pipes by center-punching.
Figure 4: Determining the position of the cuts
2.3.2 Determining the position of the new SG
After cutting and removal of the original SG, the unmachined ends of the primary pipes are measured by laser tracker. The motions to be applied to the ends of the primary pipes are then determined to take into account weld shrinkage; this motion is afterwards controlled by laser tracking.
The SG position calculation is then optimized once again and the machining values in the center and in the plane of the primary pipes (PP) are determined in the cubicle coordinate system.
2.3.3 Machining the primary pipes
Machining control is performed by iterations while using the laser tracker to measure elements representative of the machined bevel.
The first step is to measure at the end of each pipe an external cylinder and a machined plane in order to determine the settings to be applied to the machining units.
18th International Congress of Metrology, 01004 (2017)
2
DOI: 10.1051/ 701004metrology/201

The second step is completed without topometric assistance and involves shaping the bevels, based on the references machined in the first step.
Figure 5: Machining the ends of the primary pipes
2.3.4 Fitup and automatic welding of the bevels
Once the bevels have been completed and the support legs equipped with the shims have been set to their correct position, the replacement SG is brought into position for fitup on the primary pipes, ensuring concentricity and parallelism < 1 mm with a point of contact. These conditions enable automatic welding of the bevels to be performed.
Figure 6: Main SGR operations
3 From theory to practice
3.1 What method?
GUM and GUM.S1 measurement model approach, “method validation” approach, inter-laboratory comparison, “method performance” approach, “proficiency tests” approach, Gage R&R tests, empirical approach: many methods exist for evaluating the uncertainties, admittedly with a similar common core but for specific target applications.
Familiarity with and analysis of the evaluated process is paramount, combining the methods seems indispensable.
One of the main difficulties encountered in our process is to successfully move from a generic methodology primarily linked to a measurement system and its environment to a broader methodology covering uncertainties generated by difficult-to-model measuring, machining, welding and shimming operations.
Furthermore, our industrial process only concerns small-sized series (1-2 operations per year, with 3 applications per operation) and does not allow repeatability and reproducibility tests because of schedule constraints, working conditions in an ionizing environment, equipment availability, equipment mass and dimensions and the capital cost of the components.
3.2 What need? Analysis of the process
In our operation, we focus more on validating a method than on expressing a dimensional conformity.
The determination of the uncertainties for our application is driven more by the need to be able to prove that our process meets regulatory, contractual and technical requirements than the need to assign a measurement uncertainty to a measurand.
Moreover, we consider it more accurate in our case to speak of the uncertainty of a process than of measurement uncertainty, since part of this uncertainty is generated by physical phenomena such as weld shrinkage or machining unit drifts.
The first question which our analysis asks is therefore: for which objective(s) must the uncertainties be controlled? The second is: which steps of our process have an impact on the achievement of these objectives?
3.2.1 Defining the objectives
In our business, contractual requirements are most often dictated by regulatory requirements. In the precise case of steam generator replacement, we must keep in mind two constraints: the position of the new steam generator with respect to its environment and the position of the PPs after the operation. These two contractual constraints are combined with an internal technical constraint: a fit-up of the bevels which enables the use of an automatic welding process must be accomplished. The constraints are aimed at meeting different requirements:
18th International Congress of Metrology, 01004 (2017)
3
DOI: 10.1051/ 701004metrology/201
- controlling the position of the new SG in its cubicle guarantees compliance with the hot shimming marginsa, - controlling and justifying the displacement of the primary pipes ensures that residual stresses are limitedb, - controlling the fitup of the bevels enables an automatic welding process to be used.
These objectives are not independent: controlling the fitup position requires control of the PP displacement, which has a direct impact on the position of the SG in the cubicle. Meeting the bevel fitup constraint ensures that the other two objectives are achieved, which makes this requirement the cornerstone of our process.
3.2.2 Identifying the “key steps”
Table 1 presents the sequencing of the SG replacement operations. The intermediate measurement steps are followed by a calculation phase in which the position of the new SG in the cubicle is optimized as the operation progresses.
Table 1: Sequencing of the operations
Description Impact on uncertainty
Measurement of the used SG in its environment. Serves to assign each new SG to a room
No, because optimization step
Initial measurement of the new SG, serves to define the machining of the new SG.
No, because intermediate step
Measurement of machined SG is one of the input data for determining the theoretical machining of the PPs
Yes §3.3.1
Measurement of the pipes and of the environment Enables the position of the new SG to be optimized
No, intermediate measurements
enable the calculation to be
refined Measurement of the pipes in fitup position and of the environment Enables the machining of the PPs and of the vertical shims to be determined
Yes §3.3.2
Setting of the machining units Yes §3.3.3 to §3.3.4
Machining of the PPs Provides fitup of the new SG
Yes §3.3.5
Machining of the shims Provides positioning of the new SG at its correct elevation
Yes §3.3.6
Fitup Provides positioning of the new SG in its room
Yes §3.3.7
In the end, the fitup of the bevels is not affected
by all the steps in the operation. For each bevel, it can also be summed up as compliance with two parameters: - concentricity of the centers of the SG and PP bevels, - parallelism of the faces of the SG and PP bevels. a In hot operation, the reactor coolant system expands together with the SG b The PPs are subjected to loads, in particular because of the expansion phenomena and the residual stresses caused by installation
3.3 Quantification of the uncertainty sources
3.3.1 Measuring the machined SG
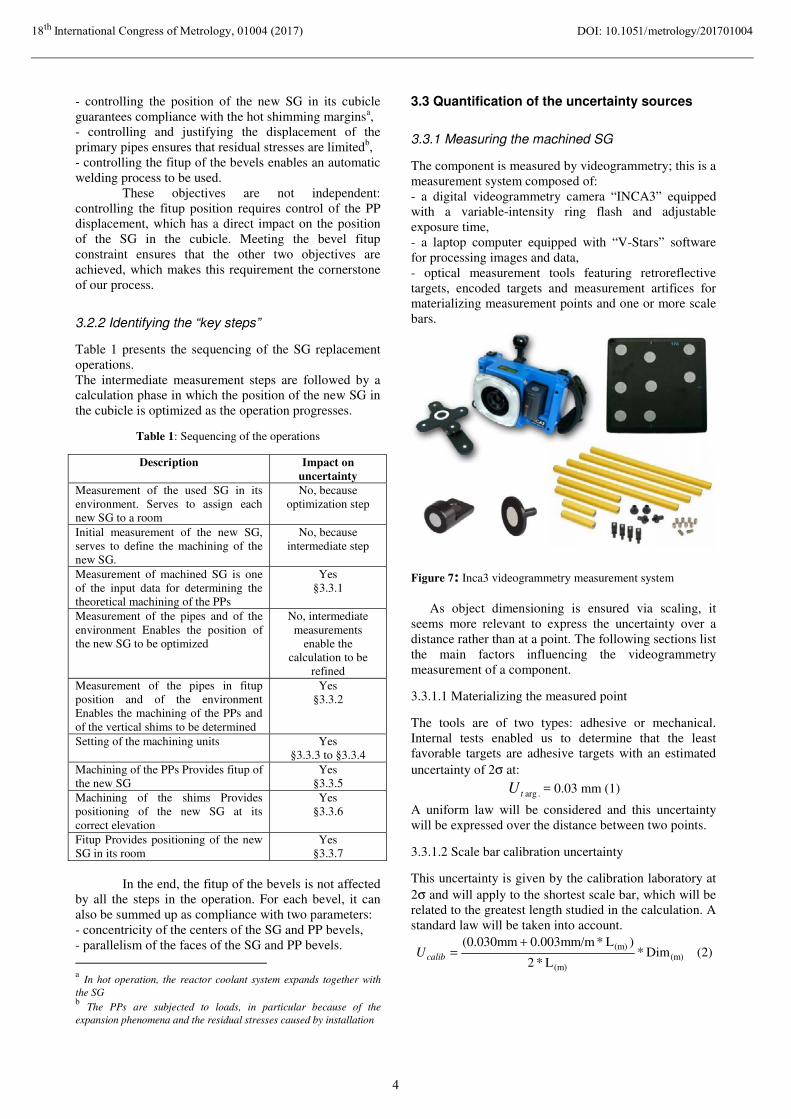
The component is measured by videogrammetry; this is a measurement system composed of: - a digital videogrammetry camera “INCA3” equipped with a variable-intensity ring flash and adjustable exposure time, - a laptop computer equipped with “V-Stars” software for processing images and data, - optical measurement tools featuring retroreflective targets, encoded targets and measurement artifices for materializing measurement points and one or more scale bars.
Figure 7: Inca3 videogrammetry measurement system
As object dimensioning is ensured via scaling, it seems more relevant to express the uncertainty over a distance rather than at a point. The following sections list the main factors influencing the videogrammetry measurement of a component.
3.3.1.1 Materializing the measured point
The tools are of two types: adhesive or mechanical. Internal tests enabled us to determine that the least favorable targets are adhesive targets with an estimated uncertainty of 2σ at:
.argtU = 0.03 mm (1)
A uniform law will be considered and this uncertainty will be expressed over the distance between two points.
3.3.1.2 Scale bar calibration uncertainty
This uncertainty is given by the calibration laboratory at 2σ and will apply to the shortest scale bar, which will be related to the greatest length studied in the calculation. A standard law will be taken into account.
(m)(m)
(m) Dim*L*2
)L*0.003mm/m(0.030mm +=calibU (2)
18th International Congress of Metrology, 01004 (2017)
4
DOI: 10.1051/ 701004metrology/201

3.3.1.3 Measurement file scaling error
This error can be considered as the sensor measurement uncertainty given by the manufacturer at 2σ. It is expressed versus the dimension of the measured object. This error will be applied to the shortest scale bar, which will be related to the object dimension.
)((m)
)( *L*2
)*/005.0005.0(m
mscale Dim
LmmmmmU
+= (3)
3.3.1.4 Taking temperature into account
If the SG measured in the workshop was at the same temperature as the room measured in the technical situation report, the impact of temperature would be considered as null; the measured objects would be either larger or smaller.
In our application, ignoring temperature during the measurements mainly influences the position of the bevel centers. On the other hand, the parallelism of the bevel faces is less impacted.
We chose not to correct the effects of temperature mainly for two reasons: - modeling the deformations of a non-homogeneous component made of welded parts is difficult, The problem is even more complex in the case of a room featuring reinforced concrete walls and an assembly of different steel or stainless-steel supports. - an error in the position of one of the two bevels can be offset by shifting a primary pipe during fitup, without affecting the existing residual stresses.
On the other hand, we shall take into account the effects of temperature in our uncertainty calculation by carrying over this error to the center position of one of the two bevels.
The parameters contributing to the temperature effects are mainly: - the temperature measurement uncertainty, - the uncertainty due to ignorance of the expansion factor, - the deviation from the reference temperature, or in our case the temperature difference between the two rooms, - the temperature variation during the measurement.
The measurement system itself can be considered to be insensitive to T° variations, as the measurement principle is optical and the scale bars are made of Invar.’
The linear expansion law is:
( ))20.(120 °−+=° TLL measuredC α (4) where:
- L20°C is the corrected length at 20°C, - Lmeasured is the measured length at ambient temperature, - α is the expansion coefficient of the part, - T° is the ambient temperature of the part.
The analysis will consider a temperature difference between the two rooms of 10°C, a temperature variation during measurement of 2°C and an expansion factor of α = 13.10-6. The uncertainty on the measurement of the part temperature and on ignorance of the expansion coefficient will be neglected. The part related to the T° variation during measurement will be treated as a random error; the part corresponding to the temperature
difference as a systematic error. A uniform law will be used.
3
.10.13. 6)(
exp
CDU mmmeasured
ansion
°Δ=
−
(5)
3.3.2 Measuring the pipes in fitup position
This measurement is taken by means of laser tracking. Use is made of a polar measurement system consisting of: - the camera itself equipped with a precision distance meter and two angle encoders, - a laptop computer equipped with the Spatial Analyzer software for collecting and interpreting the data, - sensing tools including reflectors and special-purpose supports.
Figure 8: AT401 laser tracking measurement system
The two bevels are generally measured from a single station, using a tool system for directly sensing the internal diameter of the piping at 18 points. The following sections list the main factors influencing the measurement uncertainty of a component with laser tracking.
3.3.2.1 Materializing the measured point
The reflectors used with laser tracking are corner cubes of diameter 1.5’’, consisting of an assembly of three mirrors. The manufacturing tolerances supplied by the manufacturer give an optical element centering < ±0.003 mm, a radius of 19.05±0.0025 mm and a ball shape deviation < 0.003 mm.
A radius deviation will only have the effect of offsetting the bevel center along the normal of the measured circle, with no impact on the parallelism of the bevels during fitup. The optical element centering and ball shape deviations will be included in the measured point uncertainty.
3.3.2.2 Temperature non-inclusion error
Only the temperature variation during measurement will be taken into account for the laser tracking measurement;
18th International Congress of Metrology, 01004 (2017)
5
DOI: 10.1051/ 701004metrology/201

the T° deviation between the two rooms was already taken into account in the videogrammetry measurement. The camera itself is equipped with T°, pressure and humidity sensors which permanently correct the measured distances for the effects of the environment conditions; the residual errors will therefore be neglected.
3.3.2.3 Instrument-related measurement uncertainty
The vendor’s brochure gives an angle performance of ±15μm + 6μm/m and an absolute distance performance of ±10μm, both expressed in MPE. As a precaution, MPE will be considered as an occurrence probability at 2σ.
The Spatial Analyzer [2] software enables determination of the measurement uncertainties by simulation, using a module similar in principle to the Monte-Carlo method. For each instrument, it is possible to enter as input data the horizontal and vertical standard deviations, together with the distance standard deviation.
The angle performance expressed in mm must firstly be converted into arcsec. The fixed part of this uncertainty will be combined with the manufacturing dimensions for the tools as described in §3.3.2.1, considering them given at 3σ:
mmmmmU LT /35.05.05.7 222_ μμμμα +++±= (6)
Figure 9: angle error versus distance As this uncertainty decreases versus distance, an angle uncertainty for a minimum distance of 2 m will be considered, i.e. 1.4”.
In the same way, the distance performance will also be combined with the tool-related uncertainties:
mmmU LTdist μμμ 222_ 5.05.05 ++±= (7)
These uncertainties are afterwards injected into the instrument parameters of the software program in order to simulate the measurements of the pipe ends; 1000 shots are completed for each measurement.
This first simulation allows us to obtain the uncertainty for one point at 1σ; on average, it is equal to 0.035 mm.
Whenever possible, we favor the measurement of both pipes from a single station. However, in the event of breakdown of a machining unit, it may be necessary to measure the two bevels from two stations generally situated at the same location. A second simulation level
allows the station adjustment uncertainty to be simulated. The adjustment standard deviation calculated at 1σ is 0.016 mm.
Figure 10: Simulating the measurements with Spatial Analyzer
A third simulation level enables the calculation of a geometrical construction based on the 1000 shots; the principle is to build 1000 constructions for each element and to analyze the variation in the main components.
Figure 11: Simulating the constructions with Spatial Analyzer
The results of the simulations give an uncertainty on the calculated center of a bevel of 0.012 mm and an uncertainty on the normal of 0.0008 deg.
3.3.2.4 Tool handling error
Unlike videogrammetry, where operator error is negligible, laser tracking measurement requires tools to be handled by the operator to materialize the measurement points. Repeatability tests give this uncertainty as 0.06 mm at 1σ.
3.3.3 Setting the machining unit
A reference machined by the machining unit is measured. This measurement is very similar to the previous one; only the measuring instruments and the number of measured points vary: - the uncertainty for a point at 1σ is 0.035 mm, - the adjustment standard deviation calculated at 1σ is 0.016 mm, - the uncertainty on the calculated center of a bevel is 0.018 mm and the uncertainty on the normal is 0.0010 deg, - the operator tool handling uncertainty is estimated as 0.03 mm at 1σ.
������������
������������
����������
�������� ���
� � �� �
���������
�����������
��������������
18th International Congress of Metrology, 01004 (2017)
6
DOI: 10.1051/ 701004metrology/201

3.3.4 Setting criteria for machining
The setting of the reference test sample is achieved when the criterion of ±0.2 mm at the center and the criterion of ±0.0001° for each component of the plane are met.
However, as these are setting criteria, it is more realistic to consider that the distribution is neither normal nor uniform, but that there are more values situated towards the middle than towards the tolerance limits.
In this case, the GUM (Guide to the Expression of Uncertainty in Measurement) recommends to use a trapezoidal law with the base of width a2 and the top of width βa2 where 10 ≤≤ β . The equivalent standard
deviation is then:
6/)1()( 222 β+= axu i (8)
Where the half-base is a = 0.2 mm, the half-top = 0.1mm and β = 0.5.
3.3.5 Machining the primary pipes
Machining is in two phases: a phase of control by means of topometry, enabling the machining of a reference surface, and a phase of shaping without assistance, using the reference surface.
The machining capacities of the unit are ± 0.10 mm and ± 0.0005° in the plane (including vibration problems). Consideration must also be given to the need to reposition the machine in the event of machining breakdown or interruption, a position which is estimated as ±0.15 mm and ±0.001° in the plane.
These uncertainties will be considered to follow uniform laws.
3.3.6 Shim machining uncertainty
The shims are positioned on the tops of the SG support legs; the distance between two support legs is 2.5 m. The shim machining tolerances are ± 0.10 mm. A uniform law will be considered.
3.3.7 SG positioning uncertainty
This uncertainty corresponds to the SG elevation uncertainty during positioning on the support legs, particularly with respect to the settling phenomena. According to our experience feedback, it is estimated as ± 0.2 mm at 3σ and will be considered to follow a normal law.
���
���=
3
2.0_. SGPosU (9)
3.4 Combining the uncertainties
Fitup is performed in two stages: - the SG is first fitted up to the hot leg pipec joined to the reactor vessel, making sure to respect the fitup gaps c The hot leg joins the SG to the reactor vessel
calculated at the interfaces; the second crossover leg piped is cleared by a few millimeters. -the piping connected to the reactor coolant pump is restored to its position.
3.4.1 Measuring the machined SG
To obtain the uncertainty on the hot leg center, the values a, b, c and d of Table 2 will be quadratically combined, as follows:
mm
U leghotXYZmachinedSG
053.0035.0011.0035.0017.0 2222
.___
=+++
= (10)
To obtain the uncertainty on the crossover leg center, the values a, b, c and d of Table 2 will be quadratically combined,
as follows:
mm
U legcrossXYZmachinedSG
226.0173.0035.0011.0035.0017.0 2222
.___
=++++
=
(11)
To calculate the uncertainty on the orientation of the hot leg plane, we shall consider uncertainty (10) in relation to a diameter of 800 mm, as follows:
°=���
���= 00762.0
800
053.0*2tan.___ aU leghotmachinedSG α (11)
To calculate the uncertainty on the orientation of the crossover leg plane, we shall consider both uncertainty (10) in relation to a diameter of 800 mm and the rotation effect generated at the crossover leg end to restore the center to fitup position. Considering a leverage of 4m and a mispositioning of 0.226 mm, this means modifying the crossover leg end plane by
°=���
��� 00324.0
4000
223.0tana
(12)
giving a total of:
°=+= 00828.000324.000762.0 22.___ legcrossmachinedSGU α
(13)
Table 2: Composition of Topo 1 uncertainty
No Definition Distribution Parameters
1σ (mm)
a Point materializing
Uniform (1) 0.017
b Scale bar calibration
Normal (2) Dim = 2.3 L= 1.096 m
0.035
d The crossover leg joins the SG to the pump
18th International Congress of Metrology, 01004 (2017)
7
DOI: 10.1051/ 701004metrology/201

c Scaling error Normal (3) Dim = 2.3 L= 1.096 m
0.011
d T° variation during measurement
Uniform (5) D = 2300 mm Δ°C = 2
0.035
e Expansion taken into account
Uniform (5) D = 2300 mm Δ°C = 2
0.173
3.4.2 Measuring the pipes in fitup position
The uncertainty on the hot leg and crossover leg center is obtained by quadratically combining the f, g and h values in Table 3 as follows:
mmU XYZCubicle 062.0059.0016.0012.0 222_ =++= (14)
The uncertainty on the orientation of the planes of the crossover leg and hot leg bevels is then:
°=���
���= 00891.0
800
062.0*2tan_ aUCubicle α (15)
Table 3: Composition of cubicle uncertainty
No Definition Distribution Parameters
1σ (mm)
f Error on the center measurement at 18 points
Normal Simulation 0.012
g Adjustment error
Normal simulation 0.016
h Tool handling error
Normal Experience feedback
0.059
3.4.3 Setting the machining unit
The uncertainty on the hot leg and crossover leg center is obtained by quadratically combining the i, j and k values in Table 4 as follows:
mmU XYZMeasMach 037.0029.0016.0018.0 222_ =++=
(16) The uncertainty on the orientation of the planes of the crossover leg and hot leg bevels is then:
°=���
���= 00532.0
800
037.0*2tan_ aU MeasMach α (17)
Table 4: Composition of the machining measurement uncertainty
No Definition Distribution Parameters 1σ (mm)
i Error on the center measurement at 8 points
Normal simulation 0.018
j Adjustment error
Normal simulation 0.016
k Tool handling error
Normal Experience feedback
0.028
3.4.4 Setting criteria for machining
Considering a trapezoidal law where a = 0.2 and β = 0.5,
the uncertainty on the hot leg and crossover leg centers is
mmU XYZSettMach 091.0_ = (18)
In the same way, a trapezoidal law for the orientation of the crossover leg and hot leg bevels can be determined by choosing a = 0.00014° and β = 0.00007°:
°= 00006.0_αSettMachU (19)
Table 5: Composition of the machining setting uncertainty
No Definition Distribution Parameters 1σ (mm)
l Error on the center measurement at 8 points
Trapezoidal (8) a = 0.2 β = 0.5
0.091
3.4.5 Machining the primary pipes
The machining uncertainty can be reduced to:
mmU XYZMachining 104.03
15.0
3
1.022
_ =���
����
�+��
�
����
�±=
(20) The plane orientation uncertainty is estimated
respectively as ± 0.0005° for machining and ± 0.001° for repositioning:
°=���
����
�+��
�
����
�±= 00065.0
3
001.0
3
0005.022
_ αMachiningU
(21)
Table 6: Composition of the machining unit uncertainty
No Definition Distribution
Parameters 1σ (mm)
m Machining unit capacity and drift
Uniform Experience feedback
0.104
18th International Congress of Metrology, 01004 (2017)
8
DOI: 10.1051/ 701004metrology/201

3.4.6 Shim machining uncertainty
Choosing the worst case could result in a maximum offset along Z of ± 0.10 mm on the position of the SG center:
mmU XYZShim 058.03
1.0_ =��
�
����
�= (22)
Considering an elevation difference of 0.2 mm between two support legs, this would then give:
°=���
����
�= 00262.0
3*2500
1.0*2tan_ aUShim α (23)
Table 7: Composition of the shim machining uncertainty
No Definition Distribution Parameters 1σ (mm)
m Shim thickness deviation
Uniform Experience feedback
0.058
3.3.7 SG positioning uncertainty
mmU XYZSGPos 067.03
1.0_. =�
��
���= (24)
Table 8: Composition of SG positioning uncertainty
No Definition Distribution Parameters 1σ (mm)
n SG positioning deviation
Normal Experience feedback
0.067
3.5 Expression of the final uncertainty
Table 9 groups all the uncertainty sources covered by the calculation for the determination of the SG nozzle fitup uncertainty in the center and in the plane.
Table 9: Expression of the final uncertainty
No Definition Center (mm)
Plane (°)
machinedSGU _ Machined SG measurement
0.053 0.00762
Carryover of T° influence to crossover leg
0.00324
CubicleU Cubicle measurement
0.062 0.00891
MachMeasU . Machining test sample measurement
0.037 0.00532
MachSettU . Setting criteria for machining
0.091 0.00006
MachiningU Machining unit capacities
0.104 0.00065
ShimU Machining of the shims
0.058 0.00262
SGPosU . SG positioning 0.067
FitupU 0.19 0.01355
The final fitup uncertainty is therefore evaluated as ± 0.56 mm at 3σ in the center and ± 0.0407° at 3σ in the plane, making a maximum bevel opening of 0.6 mm.
4 Conclusion
Beyond the sharing of this example, what we wish to show is that for our business, the measurement uncertainties are treated within a wider context that covers the whole operation, which could be referred to as a process uncertainty.
Our initial goal is not to validate a dimensional conformity but to provide evidence that our process enables us to guarantee that all our customer’s requirements are met.
Furthermore, this approach is iterative and allows us to identify the important steps in a process, with the aim of reinforcing or adapting the key steps.
More than ever, uncertainty analysis is an indispensable tool in our industry, from design right up to final construction.
1. NF ISO/IEC GUIDE 98-3 July 2014, Evaluation of Measurement data – Guide to the expression of uncertainty in measurement, (2014)
2. Spatial Analyzer, User Manual Measurement Uncertainty Chapter 29, 789 (2016)
18th International Congress of Metrology, 01004 (2017)
9
References
DOI: 10.1051/ 701004metrology/201