wheel/rail profile maintenance kevin j. sawley ... · pdf filecontact geometries are...
TRANSCRIPT
Wheel/Rail Profile Maintenance
Kevin J. Sawley, Transportation Technology Center, Inc., Pueblo, Colorado
Identification No. 461
1.0 INTRODUCTION
Vehicles and track meet at a wheel/rail interface that sees large forces, and stresses much higher than the
tensile strength of wheel and rail steels. The forces in this interface act positively to steer the vehicle.
However, they also lead to rolling contact stresses that work negatively to cause wear and cracks, spalls,
and shells produced by rolling contact fatigue. Vehicle steering forces depend on many factors including
vehicle and bogie type, track curvature, the degree of wheel/rail lubrication, and the detailed transverse
profile shapes of the wheels and rails. Inappropriate profile shapes can lead to vehicle instability and even
derailment. Wheel/rail stresses also depend critically on the wheel and rail profiles and the way they
interact.
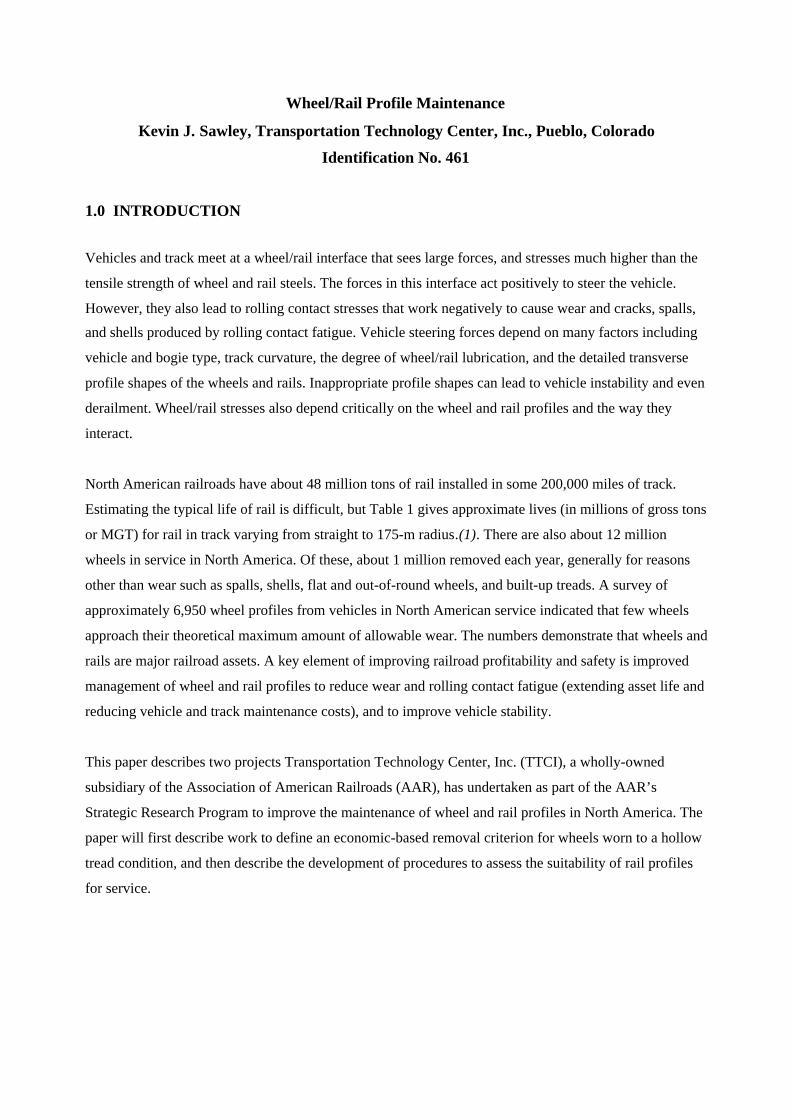
North American railroads have about 48 million tons of rail installed in some 200,000 miles of track.
Estimating the typical life of rail is difficult, but Table 1 gives approximate lives (in millions of gross tons
or MGT) for rail in track varying from straight to 175-m radius.(1). There are also about 12 million
wheels in service in North America. Of these, about 1 million removed each year, generally for reasons
other than wear such as spalls, shells, flat and out-of-round wheels, and built-up treads. A survey of
approximately 6,950 wheel profiles from vehicles in North American service indicated that few wheels
approach their theoretical maximum amount of allowable wear. The numbers demonstrate that wheels and
rails are major railroad assets. A key element of improving railroad profitability and safety is improved
management of wheel and rail profiles to reduce wear and rolling contact fatigue (extending asset life and
reducing vehicle and track maintenance costs), and to improve vehicle stability.
This paper describes two projects Transportation Technology Center, Inc. (TTCI), a wholly-owned
subsidiary of the Association of American Railroads (AAR), has undertaken as part of the AAR’s
Strategic Research Program to improve the maintenance of wheel and rail profiles in North America. The
paper will first describe work to define an economic-based removal criterion for wheels worn to a hollow
tread condition, and then describe the development of procedures to assess the suitability of rail profiles
for service.
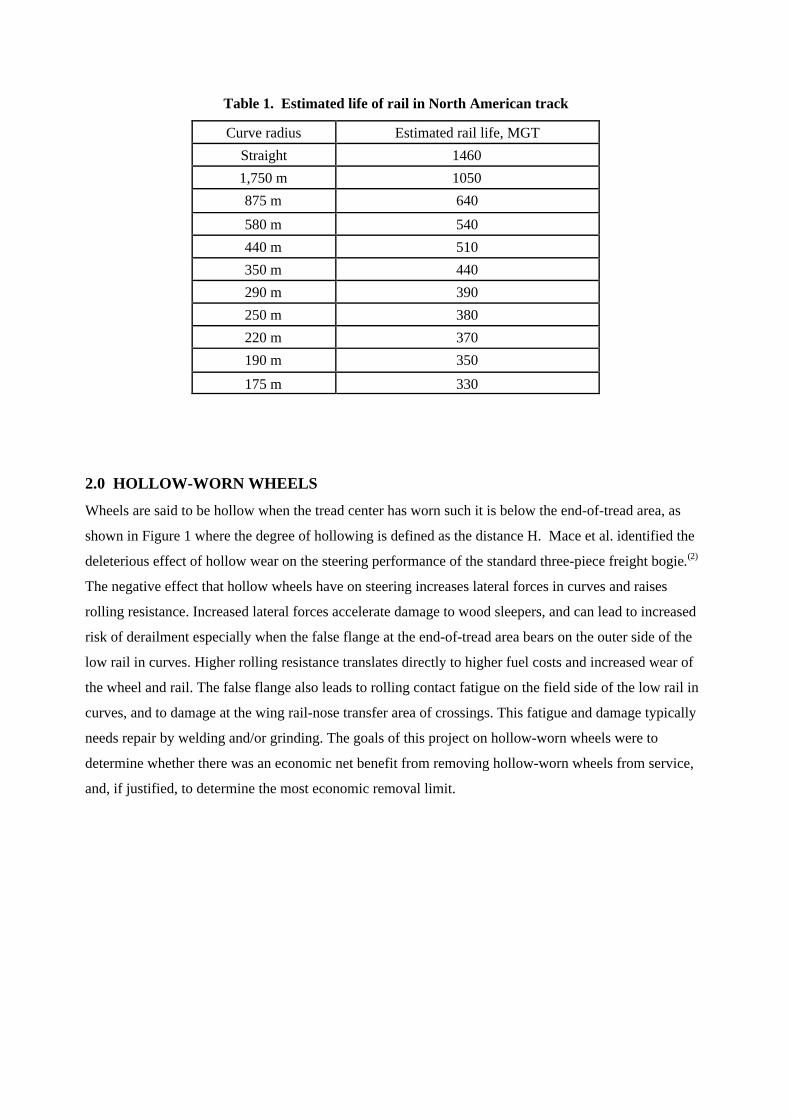
Table 1. Estimated life of rail in North American track
Curve radius Estimated rail life, MGT
Straight 1460
1,750 m 1050
875 m 640
580 m 540
440 m 510
350 m 440
290 m 390
250 m 380
220 m 370
190 m 350
175 m 330
2.0 HOLLOW-WORN WHEELS
Wheels are said to be hollow when the tread center has worn such it is below the end-of-tread area, as
shown in Figure 1 where the degree of hollowing is defined as the distance H. Mace et al. identified the
deleterious effect of hollow wear on the steering performance of the standard three-piece freight bogie.(2)
The negative effect that hollow wheels have on steering increases lateral forces in curves and raises
rolling resistance. Increased lateral forces accelerate damage to wood sleepers, and can lead to increased
risk of derailment especially when the false flange at the end-of-tread area bears on the outer side of the
low rail in curves. Higher rolling resistance translates directly to higher fuel costs and increased wear of
the wheel and rail. The false flange also leads to rolling contact fatigue on the field side of the low rail in
curves, and to damage at the wing rail-nose transfer area of crossings. This fatigue and damage typically
needs repair by welding and/or grinding. The goals of this project on hollow-worn wheels were to
determine whether there was an economic net benefit from removing hollow-worn wheels from service,
and, if justified, to determine the most economic removal limit.

Definition of Hollow Wear for North American Study
2.1 Methodology of Study
The methodology adopted to achieve the objectives is described:
1. A survey of wheel profiles on North American vehicles was undertaken to determine the
distribution of hollow-worn wheels.
2. The potential benefits from removing hollow-worn wheels were identified, and dynamic
modeling backed by track tests was undertaken to quantify the benefits for hollow wheel
removal limits from 2 mm to 6 mm.
3. For each removal limit, the increased wheelset maintenance costs were calculated using typical
and defined costs for wheelset maintenance operations in North America.
4. A cost/benefit sensitivity analysis was performed.
5. Finally the costs and benefits were compared to establish whether there was an economic case
for removing hollow-worn wheels from service.
Table 2 shows the results of the wheel survey in which over 6,500 profiles were taken from a wide range
of vehicles and were analyzed. While approximately 46 percent of the wheels measured showed virtually
no hollow wear, about 2 percent of wheels showed more than 4 mm of hollow wear. Analysis also
indicated that hollow wheels did not necessarily occur in pairs on the same axle. Thus, although 2 percent
of wheels were more than 4 mm hollow, about 3.8 percent of axles had at least one wheel with 4 mm
hollow wear or more. Very few wheels showed more than 6 mm of hollow wear. This is because the tread
wear needed to achieve 6 mm hollow wear causes wheels to meet the removal criterion for a tall flange.
Table 2. Distribution of hollow wheels in North America
Hollow wear Percent of wheels Percent of axles (worst wheel)
Tapered to 0.25 mm 45.49 35.11
0.25 mm to 1 mm 21.37 22.17
1 mm to 2 mm 18.20 19.55
2 mm to 3 mm 8.69 11.85
3 mm to 4 mm 4.22 7.52
4 mm to 5 mm 1.64
5 mm to 6 mm 0.36
More than 6 mm 0.03
3.81*
* 3.81 percent of axles have at least one wheel more than 4 mm hollow
2.2 Technical Investigation
The perceived benefits from hollow wheel removal were as follows:
An improvement in vehicle steering leading to reduced rolling resistance; hence, reduced fuel
usage and lower rail wear. It was believed that overall wheel wear rates would also reduce with
hollow wheel removal, but these potential benefits were not calculated.
A reduction in gage-spreading lateral forces leading to reduced damage to wooden sleepers.
A lowering of contact stresses on the field side of the low rail in curved track caused by the
hollow wheel false flange, leading to a reduction in rolling contact fatigue and the grinding
needed to remove cracks and spalls. Other work had established that the low rail in curves was a
particular focus for rail grinding in North America.(3)
A reduction of impacts (and therefore damage) caused by the false flange at special track work.
Damage, which needs to be repaired by extensive weld repairs, is particularly noticeable at the
wing-rail/nose transfer points at crossing.
A reduction in derailment risk. By increasing lateral force, and with the rail turning moment
caused by the action of the false flange on the low-rail field side, hollow wheels increase the risk
of rail rollover. However, means to calculate this benefit were not available.
Modeling using the dynamics program *NUCARS™ was undertaken to establish the effect of hollow
worn wheels on wheel/rail interaction, principally rolling resistance and lateral force.(4) This is a multi-
body vehicle dynamics program that allows the detailed simulation of any rail vehicle running on
virtually any track. It uses a full nonlinear creep theory for calculating wheel/rail forces, and wheel/rail

contact geometries are pre-calculated from files of measured and/or theoretical rail and wheel shapes. The
basic model used a typical 119-tonne coal hopper equipped with standard three-piece bogies with constant
contact side bearings and representation of all major suspension elements (including friction elements).
Table 3 lists the major variables studied, and the common model outputs.
Small-angle axle misalignments were applied, since earlier work has shown that bogies on tangent track
run with axles misaligned typically by 2 mrad.(5) In the modeling, these misalignments had little effect on
results from curved track. They were necessary, however, to give realistic rolling resistance predictions in
straight track. (In the absence of misalignment, the model gave negligible rolling resistance in straight
track.) Because these axle misalignments destroyed vehicle symmetry, modeling in curved track was
undertaken using both left- and right-hand curves, and the final results were expressed as averages of
these left- and right-hand runs. Typical results from the modeling exercise are shown in Figures 2 and 3,
for the 0.45 wheel/rail friction case.
Table 3. Major variables in dynamic model
Parameter Value Comments
Wheel/rail friction Friction 1: 0.45Friction 2: 0.4/0.2
0.45 everywhere on both rails0.4 on rail top, 0.2 on gage face,
both rails
Track curvature Straight track to 175-mradius
Six track cases in total
Track roughness Typical vertical andlateral roughness
To introduce small amplitudelateral and vertical dynamicresponse in the simulations
Wheel profiles Tapered to 6-mm hollowin approximately 1-mm
increments*
In any given simulation, allwheels in the vehicle were
identical
Rail profiles Typical straight andcurved rail profiles
Two-point contact conditionswere avoided
Center bowl friction 0.267
Axle misalignment 0, 1, 2 mrad Imposed misalignment betweenbogie axles
Speed 48 km per hour Constant for all simulations
Common outputs 1 Vertical, lateral, and longitudinal forces at each wheel2 Angle-of-attack at each wheelset3 Rolling resistance of vehicle
* The wheel profiles had simulated worn flanges
Figure 2 shows the effect of track curvature on rolling resistance for the hollow-wear cases examined.
(Note that hollow wear is expressed in mm, according to the definition of Figure 1. The only exception is
the 0 mm case where this is used as shorthand to describe the nearly new tapered wheel condition.) Figure
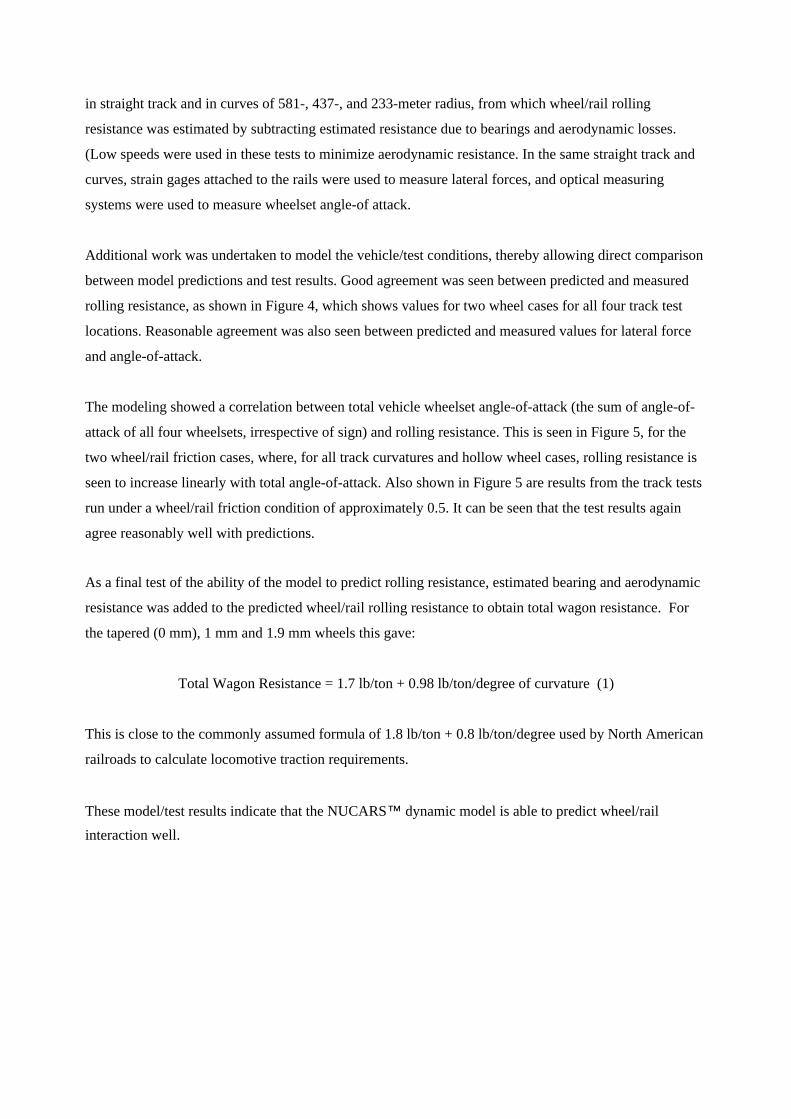
3 shows how the gage-spreading force changes for the same track and hollow-wear conditions. (Gage-
spreading force is defined as the sum of the outward lateral force on each rail, expressed as the average
for all four axles.)
Principal results from the modeling exercise are:
As expected, rolling resistance increases substantially with track curvature, for wheels in all
conditions.
Hollow wheels also lead to much higher levels of rolling resistance, even in straight track. Closer
inspection of the modeling output indicated that this increased rolling resistance was associated
with lozenging of the bogies, causing all four wheelsets to run with higher angle-of-attack.
The same effect of track curvature and hollow wear was seen for gage spreading force. For
tapered and low-hollow wheels the gage spreading force arose mainly from the lead axles in each
bogie. The modeling cases with more-hollow wheels consistently showed relatively high lateral
forces also for the trail axles. (For very hollow wheels, gage spreading force saturated
approximately at the product of axle load and friction.)
Rolling resistance and gage spreading force were little affected by hollow wear up to about 2 mm.
Hollow wear above 2 mm led to significant increases in resistance and force. The cause of this
cut-off value is not known with certainty, but it equates approximately with the onset of negative
equivalent conicity. That is, for the wheel and rail profiles used, hollow wear up to approximately
2 mm gave positive conicity, while hollow wear of approximately 3 mm and above gave negative
conicity with associated lack of steering.
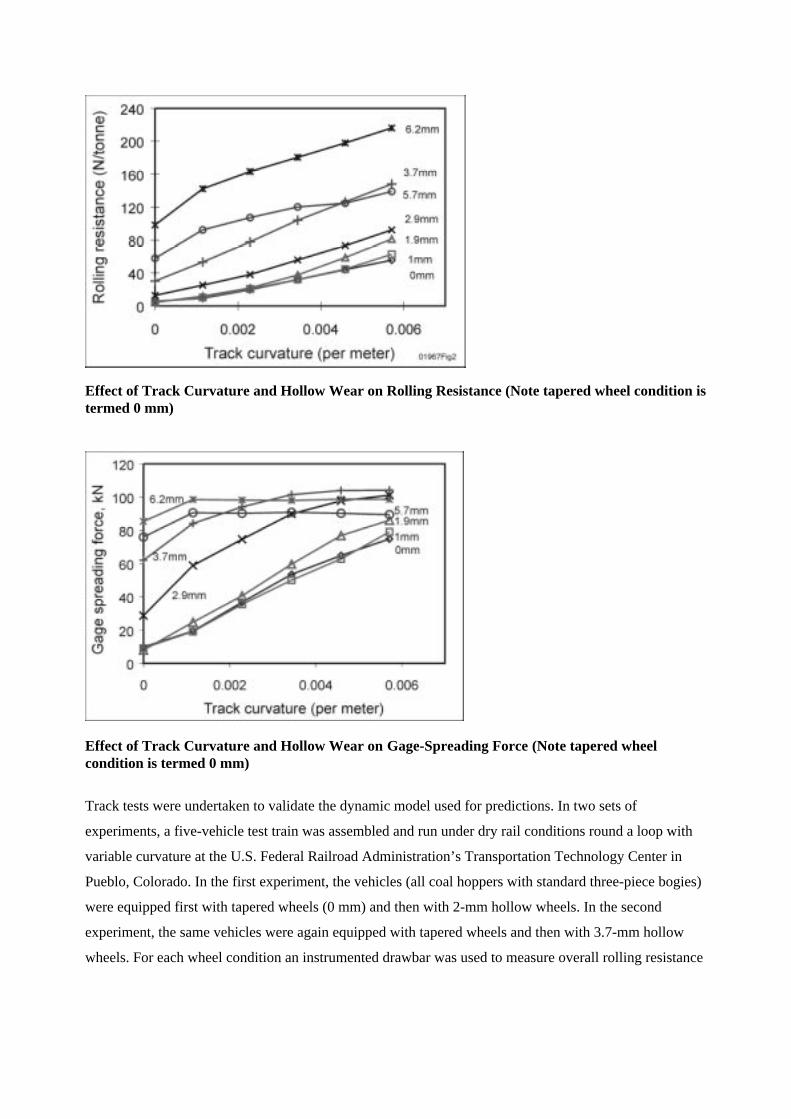
Effect of Track Curvature and Hollow Wear on Rolling Resistance (Note tapered wheel condition istermed 0 mm)
Effect of Track Curvature and Hollow Wear on Gage-Spreading Force (Note tapered wheelcondition is termed 0 mm)
Track tests were undertaken to validate the dynamic model used for predictions. In two sets of
experiments, a five-vehicle test train was assembled and run under dry rail conditions round a loop with
variable curvature at the U.S. Federal Railroad Administration’s Transportation Technology Center in
Pueblo, Colorado. In the first experiment, the vehicles (all coal hoppers with standard three-piece bogies)
were equipped first with tapered wheels (0 mm) and then with 2-mm hollow wheels. In the second
experiment, the same vehicles were again equipped with tapered wheels and then with 3.7-mm hollow
wheels. For each wheel condition an instrumented drawbar was used to measure overall rolling resistance
in straight track and in curves of 581-, 437-, and 233-meter radius, from which wheel/rail rolling
resistance was estimated by subtracting estimated resistance due to bearings and aerodynamic losses.
(Low speeds were used in these tests to minimize aerodynamic resistance. In the same straight track and
curves, strain gages attached to the rails were used to measure lateral forces, and optical measuring
systems were used to measure wheelset angle-of attack.
Additional work was undertaken to model the vehicle/test conditions, thereby allowing direct comparison
between model predictions and test results. Good agreement was seen between predicted and measured
rolling resistance, as shown in Figure 4, which shows values for two wheel cases for all four track test
locations. Reasonable agreement was also seen between predicted and measured values for lateral force
and angle-of-attack.
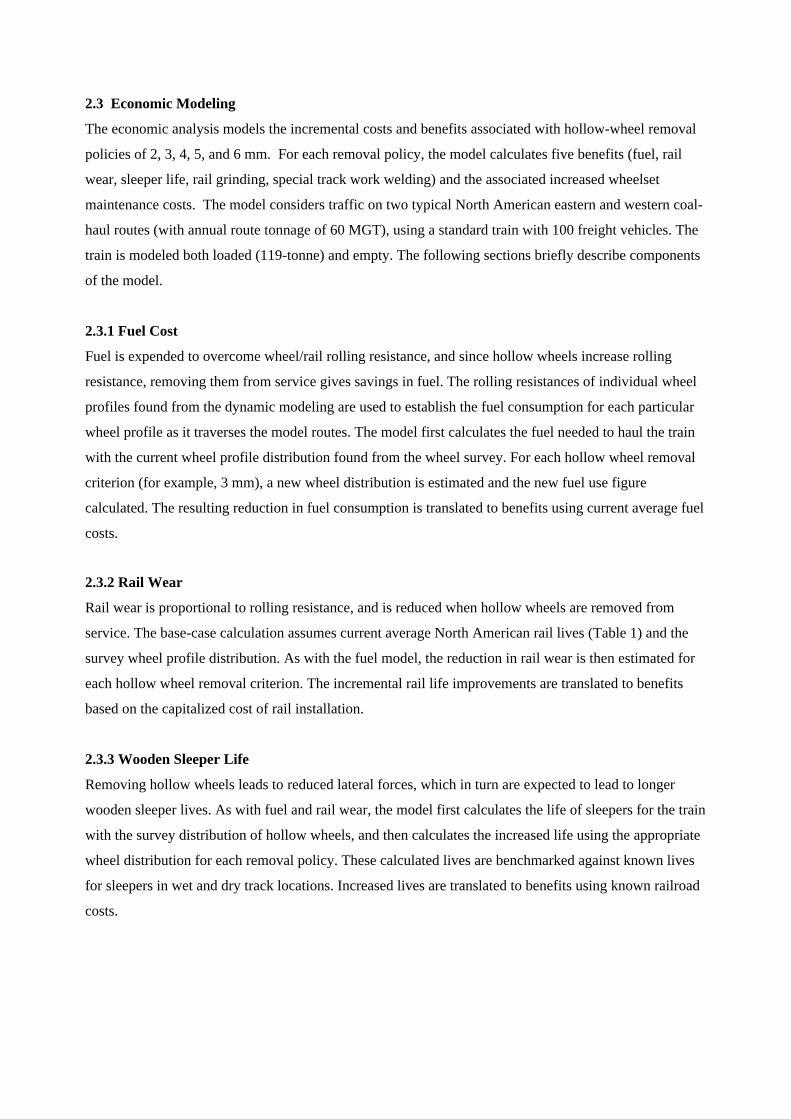
The modeling showed a correlation between total vehicle wheelset angle-of-attack (the sum of angle-of-
attack of all four wheelsets, irrespective of sign) and rolling resistance. This is seen in Figure 5, for the
two wheel/rail friction cases, where, for all track curvatures and hollow wheel cases, rolling resistance is
seen to increase linearly with total angle-of-attack. Also shown in Figure 5 are results from the track tests
run under a wheel/rail friction condition of approximately 0.5. It can be seen that the test results again
agree reasonably well with predictions.
As a final test of the ability of the model to predict rolling resistance, estimated bearing and aerodynamic
resistance was added to the predicted wheel/rail rolling resistance to obtain total wagon resistance. For
the tapered (0 mm), 1 mm and 1.9 mm wheels this gave:
Total Wagon Resistance = 1.7 lb/ton + 0.98 lb/ton/degree of curvature (1)
This is close to the commonly assumed formula of 1.8 lb/ton + 0.8 lb/ton/degree used by North American
railroads to calculate locomotive traction requirements.
These model/test results indicate that the NUCARS™ dynamic model is able to predict wheel/rail
interaction well.
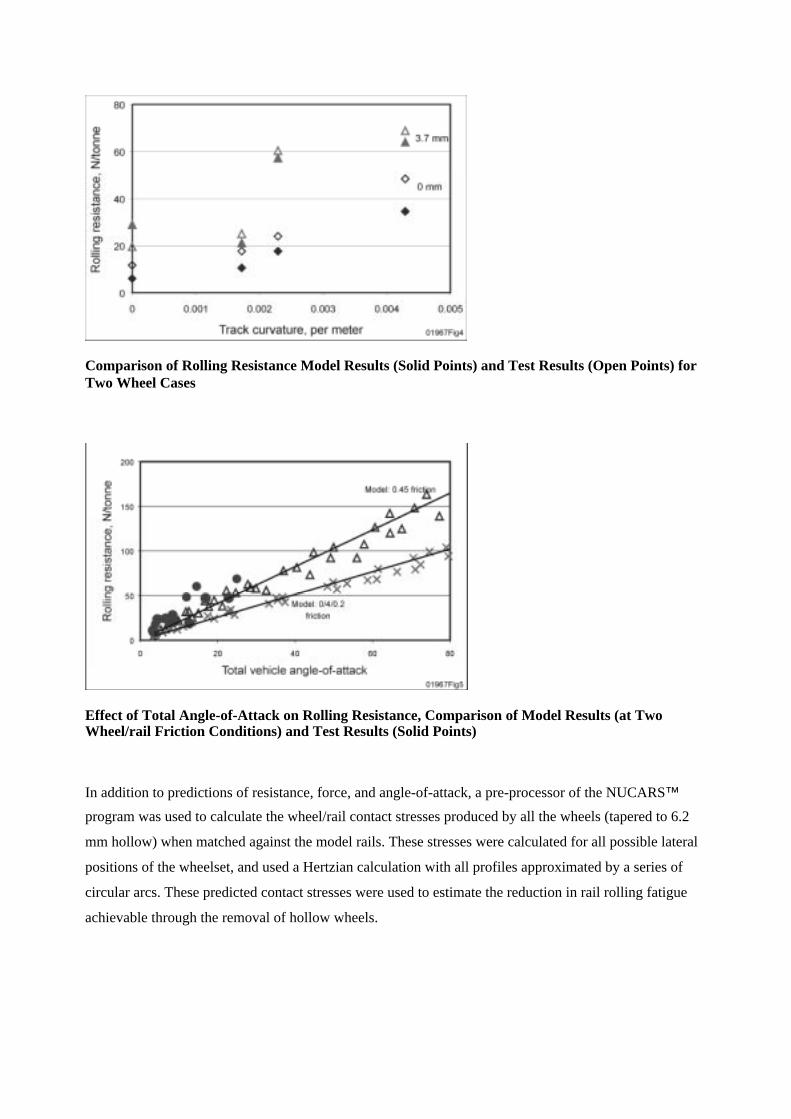
Comparison of Rolling Resistance Model Results (Solid Points) and Test Results (Open Points) forTwo Wheel Cases
Effect of Total Angle-of-Attack on Rolling Resistance, Comparison of Model Results (at TwoWheel/rail Friction Conditions) and Test Results (Solid Points)
In addition to predictions of resistance, force, and angle-of-attack, a pre-processor of the NUCARS™
program was used to calculate the wheel/rail contact stresses produced by all the wheels (tapered to 6.2
mm hollow) when matched against the model rails. These stresses were calculated for all possible lateral
positions of the wheelset, and used a Hertzian calculation with all profiles approximated by a series of
circular arcs. These predicted contact stresses were used to estimate the reduction in rail rolling fatigue
achievable through the removal of hollow wheels.
2.3 Economic Modeling
The economic analysis models the incremental costs and benefits associated with hollow-wheel removal
policies of 2, 3, 4, 5, and 6 mm. For each removal policy, the model calculates five benefits (fuel, rail
wear, sleeper life, rail grinding, special track work welding) and the associated increased wheelset
maintenance costs. The model considers traffic on two typical North American eastern and western coal-
haul routes (with annual route tonnage of 60 MGT), using a standard train with 100 freight vehicles. The
train is modeled both loaded (119-tonne) and empty. The following sections briefly describe components
of the model.
2.3.1 Fuel Cost
Fuel is expended to overcome wheel/rail rolling resistance, and since hollow wheels increase rolling
resistance, removing them from service gives savings in fuel. The rolling resistances of individual wheel
profiles found from the dynamic modeling are used to establish the fuel consumption for each particular
wheel profile as it traverses the model routes. The model first calculates the fuel needed to haul the train
with the current wheel profile distribution found from the wheel survey. For each hollow wheel removal
criterion (for example, 3 mm), a new wheel distribution is estimated and the new fuel use figure
calculated. The resulting reduction in fuel consumption is translated to benefits using current average fuel
costs.
2.3.2 Rail Wear
Rail wear is proportional to rolling resistance, and is reduced when hollow wheels are removed from
service. The base-case calculation assumes current average North American rail lives (Table 1) and the
survey wheel profile distribution. As with the fuel model, the reduction in rail wear is then estimated for
each hollow wheel removal criterion. The incremental rail life improvements are translated to benefits
based on the capitalized cost of rail installation.
2.3.3 Wooden Sleeper Life
Removing hollow wheels leads to reduced lateral forces, which in turn are expected to lead to longer
wooden sleeper lives. As with fuel and rail wear, the model first calculates the life of sleepers for the train
with the survey distribution of hollow wheels, and then calculates the increased life using the appropriate
wheel distribution for each removal policy. These calculated lives are benchmarked against known lives
for sleepers in wet and dry track locations. Increased lives are translated to benefits using known railroad
costs.
2.3.4 Rail Grinding
Hollow wheels lead to higher wheel/rail contact stress, giving increased rolling contact fatigue damage
that needs to be removed by grinding. The model assumes that 20 percent of the annual cost of rail
grinding in North America can be saved by the removal of all hollow wheels, and calculates the saving
from a given removal policy by considering the magnitude of the contact stresses associated with hollow
wheels and the lateral wheelset shifts over which those stresses are applied to the low rail.
2.3.5 Special Track Work Welding
It is known that hollow wheels are a cause of much of the damage that occurs to special track work,
principally in the area where the wheel transfers from the wing-rail to the nose and vice-versa. This
damage can be repaired by welding, but also shortens component life. It was found impossible to
determine the costs of damage using stress and impact calculations. Consequently, presentations on the
types of damage caused by hollow wheels were made to railroad welding staff who were then asked to
estimate the percentage of their time spent repairing such damage. These estimates were converted to
benefits using standard railroad costs for welding.
2.3.6 Wheelset Costs
The wheelset cost model was developed to estimate the number of wheels requiring maintenance or
replacement throughout a wheel life cycle, for each of the removal policies. Three wheel types were
considered: 1-wear wheels, 2-wear wheels, and multi-wear wheels. Maintenance costs were estimated
using data from the AAR’s Field and Office Manuals of Interchange Rules and known railroad costs. It
was difficult to calculate the increased maintenance costs associated with a given removal policy, in large
part because wheels tend to be taken out for causes other than wear. Many of these causes, such as
wheelflats and shelled wheels, tend to occur on a random basis. It was eventually decided to undertake the
analysis by assuming that, for a given hollow-wear limit, all wheels in the next-lowest hollow wear band
reach the limit. For example, for the 3-mm removal case, the model assumes that all 2-mm hollow wheels
eventually wear to the 3-mm limit and are replaced for hollow wear. This is conservative, since in
practice many 2 mm hollow wheels would likely be removed from service for other reasons before
reaching 4 mm hollow. The wheelset costs calculated using this model are termed Case 1 costs.
The Case 1 model assumes that one wheelset is taken out for every two hollow wheels removed. This is
unlikely, since the wheel survey showed that hollow wheels rarely occur in pairs (Table 2). Therefore
augmented wheelset costs (Case 2 costs) were calculated by increasing the Case 1 costs by 50 percent
(equivalent to removing three wheelsets for every four hollow wheels removed). It is believed these Case
2 costs are highly conservative.

2.4 Economic Results
The net benefit results for the Case 1 cost model are shown in Table 4. This shows positive net benefits
for all removal policies, and for all wheel types, with the highest net benefit found for the 3-mm removal
policy. Lower net benefits are seen for the 2 mm policy, principally because of the larger numbers of
these wheels and the reduced damage/costs they produce. Very low net benefits are seen for the very
hollow wheels, mainly because there are so few of them. When Case 2 costs are used the maximum net
benefits are reduced, but are still positive for all policies except the 2-mm policy, when the net benefits
become highly negative.
An extensive sensitivity study was undertaken to test the net benefit results. As expected, increasing fuel
costs increased net benefits substantially, while any changes that delayed benefits worsened net benefits.
A particular finding of interest is that net benefits are significantly reduced (though still positive) for
vehicles equipped with improved suspension bogies that are resistant to lozenging. In these vehicles
hollow wheels produce lower increases in rolling resistance. Therefore the case for removing hollow
wheels from vehicles with such bogies is less strong.
The results indicate that, for typical freight vehicles, there is an economic case for removing hollow
wheels at the level of 3 to 4 mm and above for North American conditions. It is possible, though not yet
proven, that removal of hollow wheels at this limit would also lead to a reduction in derailment risk. This
figure of 3-4 mm compares with a removal value of 2 mm adopted recently by Cartier Railway Company
in Canada and Spoornet in South Africa.(6, 7) For policy reasons, these two railroads have much lower
bearing-related costs than most of the North American railroads for wheelset re-truing.
Table 4. Summary of cost benefit results for Case 1 costs
Annual North American net benefits, $ millions
Assumed hollow wear removal limit
2 mm 3 mm 4 mm 5 mm 6 mm
1-wear wheels $20.14 m $88.7 m $44.73 m $12.29 m $1.02m
2-wear wheels $41.34 m $103.72 m $51.3 m $14.93 m $1.49 m
Multi-wear wheels $57.35 m $109.13 m $55.97 m $16.10 m $1.70 m

3.0 RAIL PROFILE ASSESSMENT
The objective of this project is to lengthen wheel and rail life by reducing wheel/rail contact stresses
through improved control of rail profiles. As will be seen, the software developed for this also potentially
allows other improvements in wheel/rail interaction.
Manual wheel and rail profile measurement systems have been available for some years, as have
automatic rail profile systems. Automatic wheel profiling systems have emerged recently, and are
currently being used or tested in North America. Profiles traditionally have been used mainly to get an
indication of the extent of wear. This is useful, but profiles hold much more information. As part of the
AAR’s Strategic Research Program, TTCI is developing software designed to extract and analyze more
information from measured rail profiles to reduce the stress state between the wheel and rail extending
life and reducing costs.
3.1 Methodology
The methodology adopted is to match measured rails (in pairs) against a range of wheels typical of the
vehicles passing over, calculate the wheel/rail interaction, and assess the calculated interaction against the
preferred interaction. This has required the following tasks:
1. A range of wheel and wheelset profiles typical of those found in North America was defined
using the wheel survey described in Section 2.0. Of the wheels, 49 of them could be used to
describe about 90 percent of the survey wheels judged to be no more than 3 mm hollow. Forty-
nine typical wheelsets were found by adding the mating wheels to the 49 typical wheels.
2. Four wheel/rail interaction parameters were defined (contact stress, contact angle, effective
conicity, and degree of two-point contact). Work is continuing to determine preferred limits for
each interaction parameter.
3. The wheel database holds wheel profiles idealized by a series of circular arcs. Software has been
designed also to automatically represent the input measured rail profiles by a series of circular
arcs. This method of profile representation was adopted to speed the calculation of contact stress
using Hertzian analysis. The software enables the user to compare the measured profiles with the
circular-arc profiles.
4. Software has been designed to match the wheels and wheelsets against a measured pair of rails
for all possible positions of lateral wheelset shift. The software places the left wheel in flange
contact with the wheel and moves the wheelset in incremental steps until the right wheel is in
flange contact. At each step the software calculates the wheel/rail interaction. For calculation of
contact stress, contact angle, and degree of two-point contact the software uses the 49 typical
wheels with identical wheels at each end of the axle. For calculation of effective conicity the
software uses the 49 typical wheelsets. At the end of processing, the software assesses the
interaction against the preferred interaction. Both graphical and numerical data output is
available.
While the software was intended initially for the North American environment, it has been designed for
general use. As such it can accept any database of wheels and wheelsets, and allows varying track gage. A
goal has been to make the software sufficiently fast such that eventually rail profiles can be analyzed in
real time. Currently, to input and curve-fit a pair of rail profiles, calculate all the interaction parameters
between the rails and 49 wheelsets, and produce all outputs with preferred value comparisons takes about
15 seconds on a high-powered desktop personal computer.
3.2 Wheel/Rail Interaction Parameters
Four interaction parameters have been chosen, although the software has flexibility for more to be added.
User-defined preferred values can be assigned to these parameters. Initial work has focused on contact
stress and contact angle, and setting the interim preferred values for these parameters. Work continues to
set preferred values on the degree of two-point contact and effective conicity.
3.2.1 Contact Stress (P0)
This is the maximum compressive stress normal to and at the center of a given wheel/rail contact. Past
work has shown that wear and rolling contact fatigue increase as contact stress rises.(8, 9) For Hertzian
conditions the calculated contact is circular or elliptical and methods to calculate contact stress are readily
available.
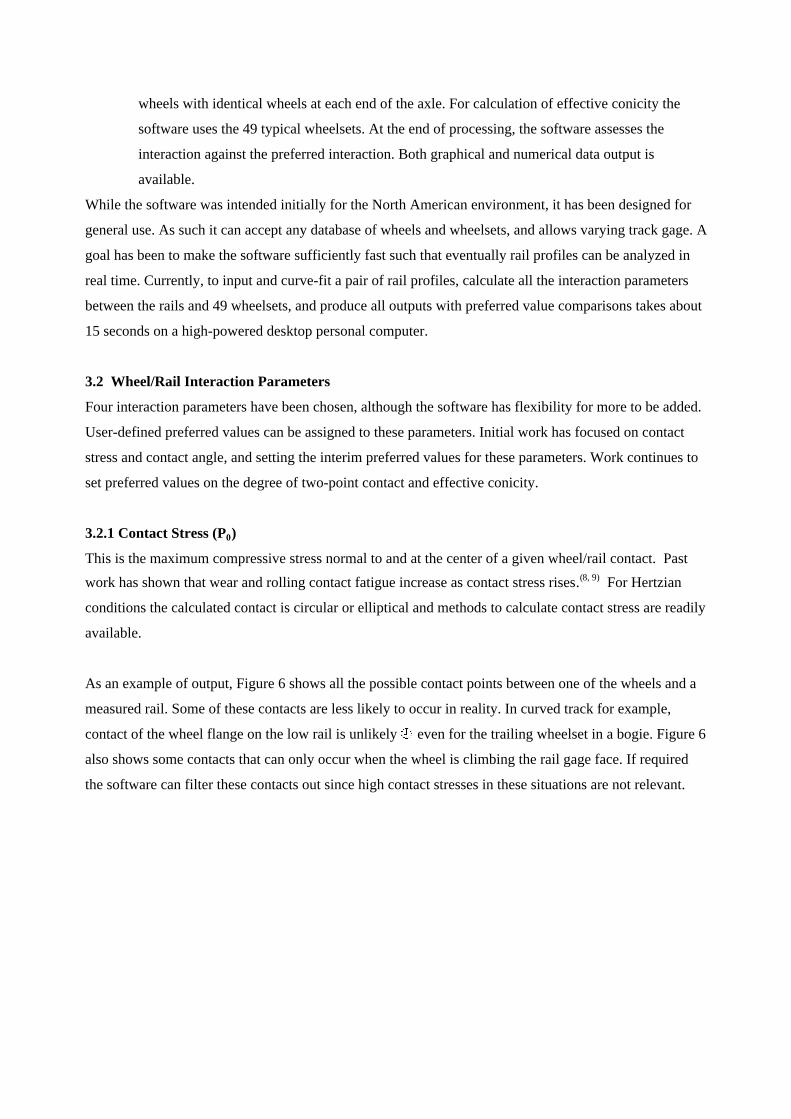
As an example of output, Figure 6 shows all the possible contact points between one of the wheels and a
measured rail. Some of these contacts are less likely to occur in reality. In curved track for example,
contact of the wheel flange on the low rail is unlikely even for the trailing wheelset in a bogie. Figure 6
also shows some contacts that can only occur when the wheel is climbing the rail gage face. If required
the software can filter these contacts out since high contact stresses in these situations are not relevant.
All Possible Contact Points Between Wheel and Rail
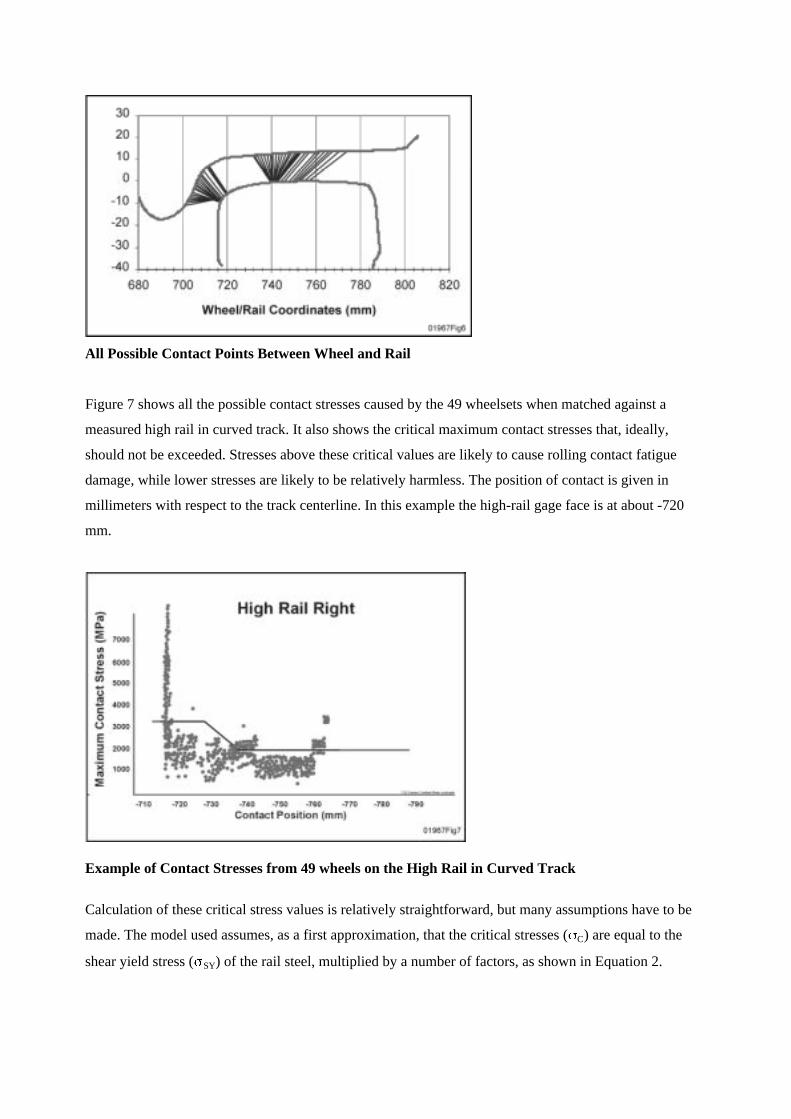
Figure 7 shows all the possible contact stresses caused by the 49 wheelsets when matched against a
measured high rail in curved track. It also shows the critical maximum contact stresses that, ideally,
should not be exceeded. Stresses above these critical values are likely to cause rolling contact fatigue
damage, while lower stresses are likely to be relatively harmless. The position of contact is given in
millimeters with respect to the track centerline. In this example the high-rail gage face is at about -720
mm.
Example of Contact Stresses from 49 wheels on the High Rail in Curved Track
Calculation of these critical stress values is relatively straightforward, but many assumptions have to be
made. The model used assumes, as a first approximation, that the critical stresses ( C) are equal to the
shear yield stress ( SY) of the rail steel, multiplied by a number of factors, as shown in Equation 2.
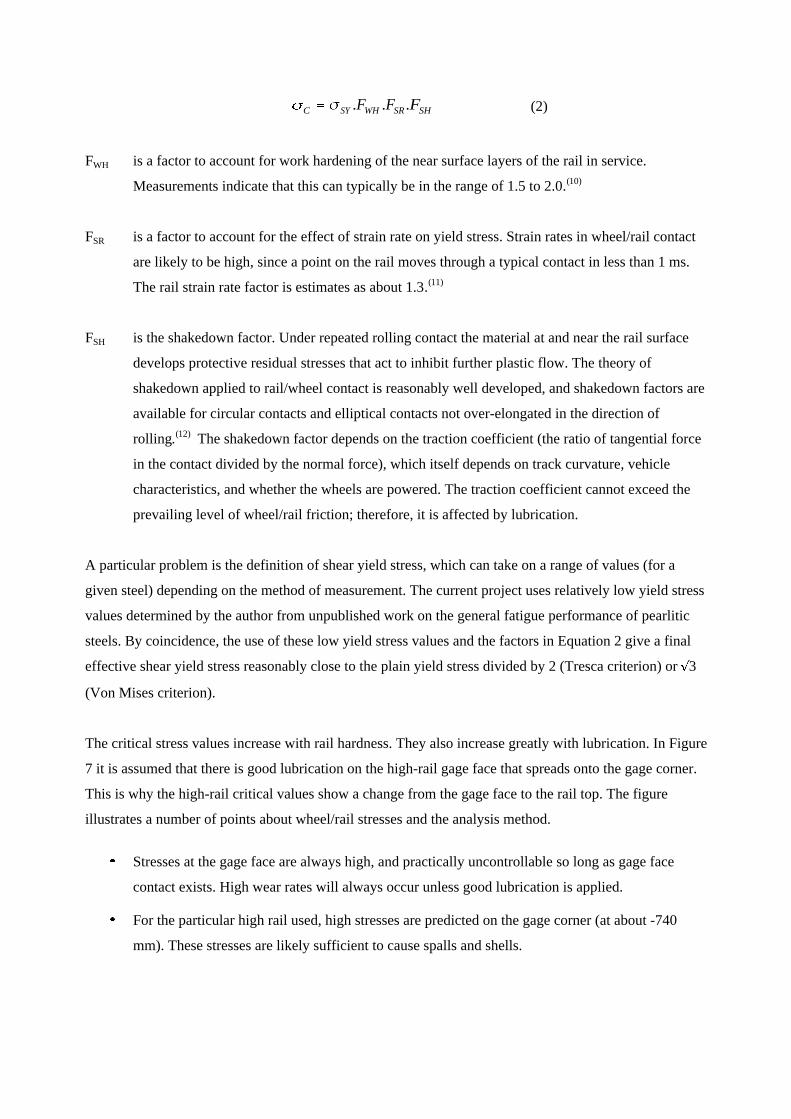
SHSRWHSYC FFF ... (2)
FWH is a factor to account for work hardening of the near surface layers of the rail in service.
Measurements indicate that this can typically be in the range of 1.5 to 2.0.(10)
FSR is a factor to account for the effect of strain rate on yield stress. Strain rates in wheel/rail contact
are likely to be high, since a point on the rail moves through a typical contact in less than 1 ms.
The rail strain rate factor is estimates as about 1.3.(11)
FSH is the shakedown factor. Under repeated rolling contact the material at and near the rail surface
develops protective residual stresses that act to inhibit further plastic flow. The theory of
shakedown applied to rail/wheel contact is reasonably well developed, and shakedown factors are
available for circular contacts and elliptical contacts not over-elongated in the direction of
rolling.(12) The shakedown factor depends on the traction coefficient (the ratio of tangential force
in the contact divided by the normal force), which itself depends on track curvature, vehicle
characteristics, and whether the wheels are powered. The traction coefficient cannot exceed the
prevailing level of wheel/rail friction; therefore, it is affected by lubrication.
A particular problem is the definition of shear yield stress, which can take on a range of values (for a
given steel) depending on the method of measurement. The current project uses relatively low yield stress
values determined by the author from unpublished work on the general fatigue performance of pearlitic
steels. By coincidence, the use of these low yield stress values and the factors in Equation 2 give a final
effective shear yield stress reasonably close to the plain yield stress divided by 2 (Tresca criterion) or 3
(Von Mises criterion).
The critical stress values increase with rail hardness. They also increase greatly with lubrication. In Figure
7 it is assumed that there is good lubrication on the high-rail gage face that spreads onto the gage corner.
This is why the high-rail critical values show a change from the gage face to the rail top. The figure
illustrates a number of points about wheel/rail stresses and the analysis method.
Stresses at the gage face are always high, and practically uncontrollable so long as gage face
contact exists. High wear rates will always occur unless good lubrication is applied.
For the particular high rail used, high stresses are predicted on the gage corner (at about -740
mm). These stresses are likely sufficient to cause spalls and shells.
High stresses are also predicted at the field side of the high rail, caused by just a small number of
wheels. These stresses may be unlikely to occur in practice, requiring a wheelset shift giving
flange contact on the low rail.
3.2.2 Contact Angle (_)
The contact angle is the angle that the contact plane at the wheel/rail contact point makes with the
horizontal to the track. The risk of flange-climb derailment increases as this angle is decreased. Based on
previous work by TTCI, to reduce derailment risk the maximum contact angle at flange contact should
preferably be greater than 68 degrees.
3.2.3 Degree of Two-Point Contact
During rail grinding to remove rolling contact fatigue damage, a past practice on North American
railroads has been to remove metal especially from the high-rail gage corner. This produces two-point
contact conditions, where the wheel contacts the high rail on the gage face and rail top. This is intended to
reduce the incidence of shell defects that can lead to broken rails. When properly applied, such grinding
can be effective in reducing defects (especially in softer rails), but it impairs vehicle steering leading to
significantly increased wear and rolling resistance. This practice is not now generally favored, and recent
work at test sites indicates that premium head-hardened rails are much less susceptible to breaks from
shell defects.(3) It was decided, however, that the software could usefully examine whether unwanted two-
point contact conditions were present on the high rail in curves, as an aide to remedial grinding to reduce
rolling resistance.
Early work in the hollow wheel project indicated that rolling resistance (hence, wear and fuel use) rises
approximately linearly with the vertical distance between the two contact points. This distance would
therefore seem to be a reasonable way of defining the degree of two-point contact. No preferred value for
the maximum allowable degree of two-point contact, which influences railroad economics rather than
safety, has yet been set.
3.2.4 Effective Conicity (CE)
Conicity is a measure of the combined geometry of a wheelset and rail pair. It is defined as one half the
rate of change of wheel rolling radius difference with lateral wheelset shift, for shifts that do not give
flange contact. For a coned wheelset on new rails the conicity is normally equal to the cone angle of the
wheel. For a worn wheelset on new or worn rails the conicity generally varies with lateral wheelset shift,
and the effective conicity is taken to be some average of the range of calculated conicity. The effective
conicity affects the stability of the vehicle. Too low a value impairs the ability of the vehicle to steer

adequately in curves, since the wheelset cannot generate sufficient rolling radius difference to generate
longitudinal steering forces. Too high a value can lead to hunting on straight track. For an idealized case
of a single wheelset restrained by springs in a frame it has been shown that the critical speed for hunting
is inversely proportional to the square root of the effective conicity.(13)
Effective conicity is an automatic output of the software used to calculate wheel/rail contact stress
(Section 3.2.1). Hence, work is in progress to see whether preferred ranges of effective conicity can be
defined for specific vehicle/bogie combinations. The goal is to set limits on effective conicity, and thus on
wheel and rail profiles, such that the speed of hunting can be reasonably guaranteed to be above the
required operating vehicle speed.
Early work has concentrated on modeling the dynamic performance of an empty coal hopper equipped
with standard three-piece bogies (containing many friction elements) and roller side-bearings. The model
has examined the effect of effective conicity on hunting speed for a range of coned wheelsets running on
new 136RE profile rails installed in straight track with vertical and lateral roughness typical of heavy haul
freight track. (For these wheel/rail profile combinations the effective conicity is constant with wheelset
shift, and varies from 0.01 to 0.2.) The model slowly increases vehicle speed, and the onset of hunting is
assessed by examining outputs including axle and bolster lateral displacement, and lead and trail body
lateral accelerations. For these ideal wheel/rail combinations the speed at onset of hunting is found to vary
approximately as the inverse one-quarter power of effective conicity, as shown in Figure 8. Current work
is examining the hunting characteristics of the same vehicle equipped with worn wheelsets that give
variable conicity with wheelset shift.
Effect of Effective Conicity on Hunting Speed for a Freight Vehicle Equipped with ConedWheelsets
3.3 Testing of Contact Stress Model and Example of Use
By matching multiple wheelsets against a single pair of measured rail, the software is potentially capable
of allowing rapid assessment of the suitability of the measured rail profiles in terms of contact stress
for the wheels passing over. This would allow decisions to be made about the suitability of the profiles
used for rail grinding, or the need for remedial grinding. It also enables those wheels that give damaging
stresses to be identified. (In future work it is intended to “reverse” the software, and match databases of
rail profiles against measure wheel pairs to identify damaging wheels.)
Before the software can be used, however, tests are needed to ensure that the information given is relevant
for use in maintenance decisions. As a first step, the software has been applied to rail profiles measured
over several years at a range of rail grinding sites in North America. Long-term observation and
measurement at these sites has documented the profiles (before and after grinding), the degree of
lubrication applied, and the surface condition (in terms of rolling contact fatigue) of the rails. The
software has been used to assess the wheel/rail stress condition, which can be related to changes in
surface condition.
Figure 9 shows results from one of the sites, a 270-m radius curve with head-hardened rails made to clean
steel specifications. The x-axis gives the accumulated tonnage (first visit at 12 MGT, with further visits to
250 MGT), and the y-axis gives the percentage of wheels passing over that are judged by the software to
apply damaging stresses; i.e., stresses above the solid line in Figure 7. This site had little lubrication until
approximately 154 MGT (shown by the solid line in Figure 9), and was ground for the first time at 164
MGT, and at intervals thereafter. Before about 154-164 MGT the high rail showed significant rolling
contact fatigue damage (cracks, flakes, spalls and shells) while after 164 MGT fatigue damage has been
minimal. This damage history correlates with the results shown in Figure 9, in that before 154-164 MGT
it is predicted that most of the wheels passing over were applying damaging stresses. In contrast, the
application of lubrication and grinding caused the percentage of damaging wheels to fall significantly.
Grinding helps reduce stress by giving more conformal wheel/rail contact. The effect of lubrication is
subtler, in that it reduces tangential forces in the contact and therefore, by its effect on the shakedown
factor, raises the critical stress for damage (that is, it raises the solid line in Figure 7).
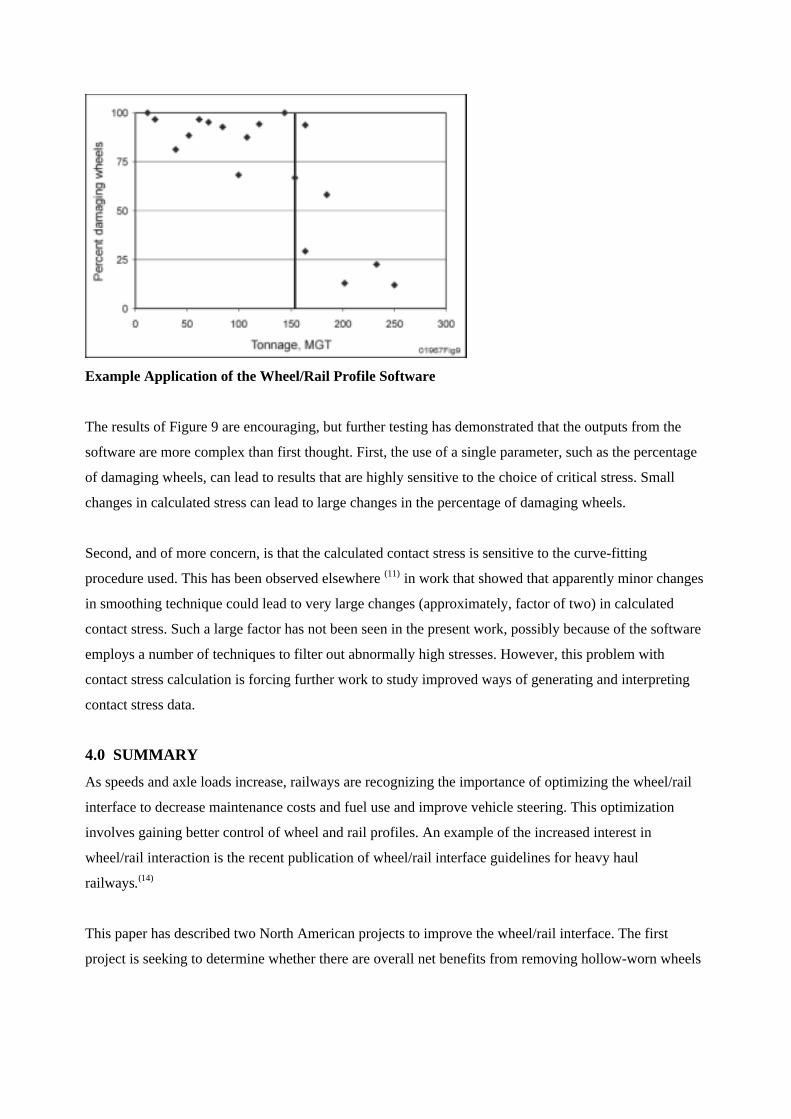
Example Application of the Wheel/Rail Profile Software
The results of Figure 9 are encouraging, but further testing has demonstrated that the outputs from the
software are more complex than first thought. First, the use of a single parameter, such as the percentage
of damaging wheels, can lead to results that are highly sensitive to the choice of critical stress. Small
changes in calculated stress can lead to large changes in the percentage of damaging wheels.
Second, and of more concern, is that the calculated contact stress is sensitive to the curve-fitting
procedure used. This has been observed elsewhere (11) in work that showed that apparently minor changes
in smoothing technique could lead to very large changes (approximately, factor of two) in calculated
contact stress. Such a large factor has not been seen in the present work, possibly because of the software
employs a number of techniques to filter out abnormally high stresses. However, this problem with
contact stress calculation is forcing further work to study improved ways of generating and interpreting
contact stress data.
4.0 SUMMARY
As speeds and axle loads increase, railways are recognizing the importance of optimizing the wheel/rail
interface to decrease maintenance costs and fuel use and improve vehicle steering. This optimization
involves gaining better control of wheel and rail profiles. An example of the increased interest in
wheel/rail interaction is the recent publication of wheel/rail interface guidelines for heavy haul
railways.(14)
This paper has described two North American projects to improve the wheel/rail interface. The first
project is seeking to determine whether there are overall net benefits from removing hollow-worn wheels

from service. Economic calculations using benefits calculated principally from dynamic simulations
indicate that the removal of hollow wheels at 3 to 4 mm and above is justified. The main benefits arise
from reduced rail wear and fuel use from decreased rolling resistance, and reduced welding of damage at
special track work. The second project is an attempt to develop software that can be used to rapidly
identify rails that have profiles unsuitable for the wheels passing over. The software assesses wheel/rail
interaction in terms of contact stress, contact angle, degree of two-point contact, and effective conicity.
Good progress has been made, but much needs to be done. In particular, the software has confirmed that
calculation of contact stress is still a major problem.

References
1 Stone, D. H., Sawley, K. J., Kelly, D. and Shust, W., “Wheel/rail Materials and Interaction: North
American Heavy Haul Practices,” IHHA 1999 STS Conference on Wheel/Rail Interaction, Moscow
1999, pp. 155-168.
2 Mace, S., Pena, R., Wilson, N. and DiBrito, D., “Effects of Wheel/Rail Contact Geometry on
Wheelset Steering Forces,” Wear, Vol. 191, 1996, pp. 204-209.
3 Sawley, K. J., “North American Rail Grinding: Practices and Effectiveness,” Report R-928,
Association of American Railroads, August 1999.
4 Wilson, N. G., et al, NUCARS™ Users’ Manual, Version 2.1, AAR Report SD-043 (Rev/9/95),
Association of American Railroads, 1995.
5 Allen, R.A., Elkins, J.A., Dincher, J.T. and Leary, J.F., “Effect of Truck Performance on Train
Resistance,” Proceedings, Railroad Energy Technology II, Atlanta, Georgia, 1987, pp. 103-125.
6 Sirois, G., “Benefits of Preventive Wheel Maintenance,” ARM Crosstalk Wheel/Rail Interface
Seminar, Chicago, May 1998.
7 Tournay, H. M., and Mulder, J. M., “The Transition from the Wear to the Stress Regime,” Wear,
Vol. 191 Nos. 1-2, pp. 107-112, January 1996.
8 Bolton, P. J. and Clayton, P., “Rolling-Sliding Wear Damage in Rail and Tire Steels,” Wear, Vol. 93,
pp. 145-165, 1984.
9 Clayton, P., “Tribological Aspects of Wheel/Rail Contact: A Review of Recent Experimental
Research,” Wear, Vol. 191, pp. 170-183, 1996.
10 Laufer, E. E., Fegredo, D. M., and Kalousek, J., “The Effect of Microstructure on Wear in Standard
and Head-Hardened Rails in Heavy Haul Service,” 3rd International Heavy Haul Railway
Conference, Vancouver, Canada, pp. 177-192, 1986.
11 Knothe, K., and Güney, S., “Task 5: Computer Modeling of Wheel/Rail Contact Stresses,” ICON
Final Technical Report, ed. Cannon, D. F., May 2000.
12 Ponter, A. R. S, Hearle, A. D., and Johnson, K. L., “Application of the Kinematical Shakedown
Theorem to Rolling and Sliding Point Contacts,” J. Mech. Phys. Solids, Vol. 33 (4), pp 339-362,
1985.
13 Wickens, A. H., “Steering and Stability of the Bogie: Vehicle Dynamics and Suspension Design,”
Proceedings, Instrumental Mechanical Engineers, Part F: Journal of Rail and Rapid Transit, Vol.
205, pp 109-121, 1991.
14 International Heavy Haul Association, “Guidelines to Best Practices for Heavy Haul Railway
Operations: Wheel and Rail Interface Issues,” IHHA, May 2001.
* NUCARS™ is a trademark of Transportation Technology Center, Inc. (TTCI), a wholly-owned subsidiary of theAssociation of American Railroads.