wheat production and management oklahoma grain...
TRANSCRIPT

Wheat Production and Management Practices used by Oklahoma Grain and Livestock Producers
Wheat Production and Management Practices used by Oklahoma Grain and Livestock Producers
Oklahoma Agricultural Experiment Station
Departments of Agricultural Economics, Animal Science, and Plant and Soil Sciences
Division of Agricultural Sciences and Natural Resources
Oklahoma State University
B- 818B-818


Wheat Production and Management Practices used by Oklahoma Grain
and Livestock Producers
Wheat Production and Management Practices used by Oklahoma Grain
and Livestock Producers
The authors wish to express deep appreciation to those Oklahoma crop and livestock producers who freely gave of their time to complete and return the questionnaire. The authors acknowledge the assistance of Mr. Barry Bloyd and his associates with the Oklahoma Agricultural Statistics Service. Appreciation is also expressed to Gracie Teague who provided valuable assistance.
This material is based upon work supported in part by the Cooperative State Research, Education, and Extension Service, U. S. Department of Agriculture, under Agreement Numbers 93-34198-8410, 97-34198-3970, and 99-34198-7481 and in part by the Oklahoma Agricultural Experiment Station, project H-2403. Any opinions, findings, conclusions, or recommendations expressed in this publication are those of the authors and do not necessarily reflect the views of either the United States Department of Agriculture or the Oklahoma Agricultural Statistics Service.
Products mentioned in this manuscript are for informational purposes only. No endorsement is implied or intended.
2004
Ishrat Hossain Graduate Student, Agricultural Economics
Francis M. Epplin Professor, Commercial Agriculture, Agricultural Economics
Gerald W. Horn Professor, Forage Utilization, Animal Science
Eugene G. Krenzer, Jr. Professor, Extension Wheat Specialists, Plant and Soil Sciences
Oklahoma State University, in compliance with Title VI and VII of the Civil Rights Act of 1964, Executive Order 11246 as amended, Title IX of the Education Amendments of 1972, Americans with Disabilities Act of 1990, and other federal laws and regulations, does not discriminate on the basis of race, color, national origin, sex, age, religion, disability, or status as a veteran in any of its policies, practices, or procedures. This includes but is not limited to admissions, employment, financial aid, and educational services.
This report of the Oklahoma Agricultural Experiment Station is printed and issued by Oklahoma State University as authorized by the Dean of the Division of Agricultural Sciences and Natural Resources and has been prepared and distributed at a cost of $155.55 for 100 copies. 0304 JA.


Introduction
More than six million acres of Oklahoma crop-land are seeded annually to winter wheat. As a result of the soil, climate, and environmental condi-tions, the Southern Great Plains region has a unique niche enabling the production of winter wheat for three purposes: (1) grain-only, (2) forage-only, and as a (3) dual-purpose forage and grain crop (Krenzer, 1994). In the Southern Great Plains, the risk of severe Hessian fly infestations is small. This enables producers the option to plant wheat in late summer, which extends the fall vegetative growth period and increases fall forage production relative to October plantings. Extended snow cover is rare, enabling livestock to graze during the winter.
Wheat forage is of high nutritive value and gain potential of livestock is excellent. In a forage-only system, forage is available in late fall, winter, and early spring, when other forage sources are low in quantity and quality. In a dual-purpose system, wheat forage is available for grazing by livestock from mid-November until development of the first hollow stem, usually in early March. Typical rainfall patterns in April and May reduce concern about soil moisture limiting potential grain production (Krenzer, 2000a). If livestock are removed no later than the development of first hollow stem, the wheat will mature and produce a grain crop for harvest in June.
Many lightweight calves are brought in from the Southeast, Midwest, and West to graze on wheat pasture in the Southern Plains (Brorsen et al., 1994). After wintering on wheat pasture, these calves are fed to slaughter weight in Southern Plains feedlots. The use of winter wheat as a multi-purpose crop is important in the agricultural economies of southwestern Kansas, eastern New Mexico, western Oklahoma, southeastern Colorado, and the Texas Panhandle (Epplin et al., 2000; Pinchak et al., 1996; Redmon et al., 1995; Shroyer et al., 1993).
The United States Department of Agriculture (USDA) provides annual estimates of the wheat acres planted and harvested for grain (National Agricultural Statistics Service, 2003). However, they do not differentiate among wheat uses. Hence, there are no routine data available from the USDA on the proportion of wheat acres used for each of the three purposes. Similarly, estimates of the number and class of animals stocked on wheat pasture in Okla-homa are also not provided by the USDA.
Recommended research-based wheat pro-
duction practices differ across intended use. For example, the recommended planting date for wheat that is intended for forage production is two to six weeks before the recommended planting date for grain-only production. The recommended seeding rate is also greater for forage-only wheat (Krenzer, 2000b). The optimal level of fertilizer may also differ across intended use of wheat. However, since the USDA’s wheat cropping practices survey does not differentiate among the three uses, little information on actual production practices is available.
Surveys of selected Oklahoma wheat producers were conducted by Harwell et al. (1976) and Walker et al. (1988). Participants provided information on wheat and wheat pasture stocker management prac-tices. However, neither of these surveys was drawn from a representative sample of wheat producers. Hence, the data could not be used to conduct hypothesis tests regarding differences in produc-tion practices across intended use. Results of a 1996 random survey of Oklahoma wheat producers were reported by True et al. (2001). However, for most of the state, a drought extended throughout the 1995-96 growing season and fall and winter forage production was abnormally low. True et al. (2001) recommended an additional survey to verify and augment their findings.
Objectives
The overall objective of this study was to pro-vide information about production methods, man-agement practices, and lease arrangements used by Oklahoma wheat, wheat pasture, and wheat pasture livestock producers. The specific objectives were to (1) determine the proportion of wheat grown for each of the three purposes (grain-only, forage-only, and dual-purpose), and determine if production practices differ across intended use; (2) determine production methods and management practices used by Oklahoma wheat, wheat pasture, and wheat pasture livestock producers; (3) determine characteristics of wheat pasture lease arrangements; and (4) to compare selected responses from the 2000 survey to those of the 1996 survey of Oklahoma wheat, wheat pasture, and wheat pasture livestock producers.
The information obtained from this research may be used to compare actual practices used by producers to recommended practices, to identify research and extension program needs, and to target extension programs to practices that deviate sub-stantially from research-based recommendations.
1

MethodsA four-page questionnaire was mailed to a ran-
domly selected group of Oklahoma wheat producers in March of 2000. A panel from the Oklahoma State University Departments of Animal Science, Plant and Soil Sciences, and Agricultural Economics designed the survey questions. Agricultural stat-isticians of the Oklahoma Agricultural Statistics Service (OASS) cooperated in making the final edit of the questionnaire form. A copy of the question-naire is included in the Appendix (page 33). Budget constraints dictated the use of a mail questionnaire rather than face-to-face or phone interviews.
The questionnaire included open-ended, ranking, and multiple-choice items. To minimize item non-response, few open-ended questions were used. Pretesting was limited to administering the questionnaire to several graduate students who were from Oklahoma and had wheat and stocker production experience.
The Oklahoma Agricultural Statistics Service (OASS) maintains a database that includes names and addresses of Oklahoma crop and livestock producers including those that produce wheat. The survey used the most recent database constructed initially from information obtained from the 1997 census of agriculture. OASS routinely updates the database using information gathered during their regular data acquisition program.
A stratified sampling plan was used. The state was divided into six regions (Figure 1 page 17) to account for the variability of practices due to weather and soil in different parts of Oklahoma. Five of these regions correspond with Oklahoma crop reporting districts – Panhandle, West Central, Southwest, North Central, and Central. The sixth region (South Central – East) includes the four remaining crop-reporting districts – South Central, Northeast, East Central, and Southeast. The OASS database was divided into six strata corresponding to the six regions as specified.
A total of 4,815 producers were randomly selected from the database, approximately 800 from each of the six regions. Consistent with federal policy, access to the OASS database is restricted to OASS statisticians. Hence, OASS selected the sample and addressed and mailed the questionnaires. The ques-tionnaire was mailed on March 9, 2000. OASS mailed reminder postcards on March 15, 2000. A copy of the reminder postcard is included in the Appendix.
A total of 1,204 (25%) questionnaires were returned. However, 114 questionnaires did not contain useful information. Data from 1,090 were analyzed. More than 160 usable responses were
received from each of the six regions (Table 1 page 17). The 1,090 respondents reported that they had planted 460,997 acres to wheat in the fall of 1999. This was approximately 8% of the total Oklahoma acres of 6.1 million planted for all wheat purposes in the 1999-2000 crop year.
The response data were entered into a database and findings were summarized into tables. Multiple mean comparison procedures were used to conduct hypothesis tests regarding relevant production practice differences across intended use within each region. Some results were compared to those obtained from the 1996 survey of Oklahoma wheat producers (True et al., 2001).
Weather
Average precipitation decreases from Southeast to Northwest in Oklahoma (Tables 2 and 3 pages 17 and 18). The state average annual precipitation in 1999 was 37.88 inches, 1.33 inches greater than the mean of 1971-2000 (Table 2). Though the first half of the year was wetter than normal, the second half was drier. The statewide average annual tempera-ture was 61.4 degrees Fahrenheit, 1.3 degrees above the mean of 1971-2000 (Table 4 page 18). The second half of the year was also warmer than normal.
Table 2 also includes the 1999 average precipita-tion by Oklahoma region by month (July-December). Each region had significantly lower than normal precipitation in July and August of 1999. As a result of rainfall during the second week of September, the situation improved across some regions. In October, the dry weather was again widespread except in the Panhandle and Southwest regions. Exceptionally dry and warm weather was present throughout the state in November. It was followed by mild weather in December, when on average almost all regions had higher than normal precipitation.
The statewide average annual temperature was 60.4 degrees in 2000, close to the normal (Table 4). Though the statewide average annual precipitation was above normal in 2000, the year began rather dry (Table 3). Overall, mild temperatures and good spring rainfall helped wheat growth and develop-ment. The year included one of the wettest months of March on record (Oklahoma Climatological Survey, 2001). Excellent growing weather in March and April helped to improve wheat conditions across the state. Almost the entire wheat crop had jointed by the end of April. Despite the abnormally wet conditions in June, wheat grain harvest was completed earlier than normal (Oklahoma Agricul-tural Statistics Service, 2001b).
2

Survey Findings
Farmland was defined to include cropland, pastureland, woodland, CRP, and other land. The survey found that the total number of acres in the state is approximately equally divided between owned and leased. But, fewer respondents reported leasing land compared to those who reported owned acres. Therefore, the average size leased was greater than the average size owned (Table 5 page 18). On average, producers owned 651 acres and leased 835 acres.
The largest farms are in the Panhandle region and smallest ones are in the South Central-East region.
Membership in Organizations Respondents were asked if they were members
of either the Oklahoma Wheat Growers Associa-tion (OWGA), or the Oklahoma Grain and Stocker Producers (OGSP), or the Oklahoma Cattlemen’s Association (OCA). Most of the respondents (66%) indicated that they did not belong to any of the three associations (Table 6 page 19). Statewide, member-ship percentages were 11% in OWGA-only, 0% in OGSP-only, 14% in OCA-only, 0% in both OWGA and OGSP, 7% in both OWGA and OCA, 0% in both OGSP and OCA, and 1% in all three. The proportion of the members’ wheat acreage with respect to the total planted wheat acres were also calculated and included in Table 6. Members of OCA-only planted 17% of the total wheat acreage, whereas members of the OWGA-only planted 11% of the total wheat acreage.
In a related table, the respondents were divided into three categories: grain-only, forage-only, and forage and grain (Table 7 page 19). The grain-only category included producers who planted wheat intended only for grain, forage-only included producers who planted wheat intended only for forage, and the forage and grain category included producers who intended to use their wheat to pro-duce both fall-winter forage and grain. As expected, in the grain-only category, more producers (18%) were members of OWGA-only and few (6%) were OCA-only members. In the same manner, 17% of the producers in the forage-only category were mem-bers of OCA-only, and only 3% were members of OWGA-only. In the forage and grain category, 12% were OWGA-only members, 16% were OCA-only members, and 9% were members of both OWGA and OCA.
Other Crops with Wheat Producers may plant other species, such as rye
or ryegrass, with wheat. This may be done in an attempt to produce more forage or to increase the length of the grazing season. When mixed with wheat, rye can improve early fall grazing and annual ryegrass can extend the spring graze-out period. However, both rye and ryegrass can become serious weed problems for future wheat crops in the same field. Producers who follow this practice are encouraged to destroy the rye and ryegrass after grazing to prevent seed production.
When asked whether they had planted any other species with the wheat, 13% of the respon-dents in the state answered in the positive (Table 8 page 20). This ranged from 3% in the Panhandle to 31% in South Central-East region. About 4% of the state’s planted wheat acreage included a species in addition to wheat. The combination percentage was greatest in the South Central-East region (16%) and least in the North Central region (1%).
Soil Testing Good nutrient management is essential for
maintaining fertile and productive soils. Soil testing is recommended to identify nutrient deficiencies and is the most reliable guide to develop an efficient fertilization strategy (Krenzer, 1994). Nitrogen and phosphorus are the nutrients of concern for most Oklahoma wheat acres. The availability of phos-phorus is greatly affected by soil pH. Soil testing every three years is recommended to check the levels of pH, phosphorus, and potassium (Johnson et al., 2000). Of the respondents in the state as a whole, 60% reported that they test soil at least once every three years (Table 9 page 20). However, 37% responded that they seldom or never have their soil tested. About 48% of respondents in the Panhandle region seldom or never have their soil tested. The percentages in other regions were similar to the state percentages.
Definition of “First Hollow Stem” Research has found that grazing wheat beyond
the first hollow stem growth stage substantially decreases grain yield (Redmon et al., 1995). There-fore, the ability to identify the first hollow stem growth stage is very important for dual-purpose wheat producers. This is the stage when the stems begin to elongate or hollow stem is forming just above the roots (Krenzer, 1994).
3

A question was included to determine how familiar producers were with the term “first hollow stem” in reference to wheat growth stages. The choices were: joint or node above the soil surface; developing head is at or above the soil surface; hollow stem can first be identified above the roots; and not familiar. The respondents were categorized into three groups: grain-only, forage-only, and dual-purpose. Under the grain-only category, those producers who intended to use all of their acreage for the purpose of grain-only were included. Similarly, producers who reported no use other than forage were included in the forage-only category. Producers who had at least some proportion of their acreage for dual-purpose were included in the dual-purpose category. Producers in the dual-purpose category are most likely to benefit from the ability to identify the “first hollow stem” growth stage, so that they may terminate grazing of dual-purpose wheat at the appropriate time.
As reported in Table 10 (page 20), 36% of the respondents in the dual-purpose category selected the correct identification of first hollow stem. Proportionately fewer producers in the grain-only (24%) and forage-only (21%) categories identified the correct response. In the dual-purpose category, the most correct responses (44%) were received from the North Central region the and least (27%) from the Panhandle region.
Wheat Variety Selection Variety selection is an important management
decision. Some characteristics that may be used to select wheat varieties were listed in the survey. Respondents were asked to rank in order of impor-tance the top three characteristics that they used to select varieties. Producers ranked grain yield and forage yield as the two most important variety characteristics in every region (Table 11 page 21). Statewide, grain yield received 44% of the number one (most important) ranks, 22% of the number two ranks, and 8% of the number three ranks. Forage yield received 38%, 19%, and 8% of the one, two, and three ranks, respectively. In the Central and South Central-East regions, forage yield was ranked more important than grain yield. Producers also cited grain yield and forage yield as primary factors in the 1996 (True et al., 2001) and 1988 surveys (Walker et al., 1988). Other important characteristics identified in this survey were past success, test weight, and drought tolerance. Winter hardiness was also noted as an important characteristic in both the Panhandle and South Central-East regions.
In a related question, producers were asked to rank sources of information as to their importance for variety selection. Producers rely on various sources for their information, since it is impossible for them to individually test all varieties on their farm. As in the 1996 survey (True et al., 2001), past performance on their farm was identified as the most popular variety information source across all regions (Table 12 page 21). Statewide, 51% of the producers checked past performance as the number one source. Extension test plot results (48% checked as either first, second, or third) and results in neighboring fields (11% checked as first) were also popular sources of information. Among the other listed choices, seed availability was consid-ered important, especially in the Central and South Central-East regions.
Intended Use Statewide, the response to the question, “How
many of your 1999-2000 wheat acres were planted for each purpose,” was 31% for grain-only, 20% for forage-only, and 49% for dual-purpose (Table 13 page 22). The North Central (46%) and Panhandle (45%) regions had the greatest percentages intended for grain-only. The West Central (16%) and Central (16%) regions had the least percentages intended for grain-only. The greatest percentage (49%) of acreage intended for forage-only was in the South Cen-tral-East region, typically the region with greatest rainfall. The region with the least amount of rainfall, Panhandle, had one of the least percentages (10%) of acreage intended for forage-only. In the West Central region, 61% of the acreage was intended for dual-purpose use.
Actual Use The responses to the question, “How many
acres of your 1999-2000 wheat crop will actually be used for each purpose,” were summarized in Table 14 (page 22). Actual use may differ from intended use for various reasons, especially due to weather circumstances. Since both grain yield and forage yield are affected by planting dates (Epplin et al., 2000), wheat should be planted at the appropriate time for the desirable intention. When the weather is not favorable for planting during the intended planting date window, producers may be forced to change planting date and actual use of wheat may differ from the original intended use. Sometimes unfavorable weather, such as drought, severe cold, or rain, after the planting or during the production season may force producers to modify plans.
4

Statewide, 39% was used for grain-only, 22% for forage-only, and 39% for dual-purpose. The percentage (22%) of wheat acreage actually used for forage-only changed very little from the original intention (20%). The main differences were in grain-only and dual-purpose. Producers reported that they had intended to use 31% for grain-only and 49% for dual-purpose, but ended up actually using 39% for grain-only and 39% for dual-purpose. The major differences between the intention and actual usage were in the West Central, Panhandle, and Southwest regions. One of the reasons might be that the July, August, September, and October precipitation levels in the Southwest and West Central regions were below average (Table 2). This may have reduced fall production of wheat forage relative to expectations. In which case some wheat intended for dual-pur-pose was used for grain-only.
In the 1996 survey, only 9% of the wheat acreage was intended for forage-only compared with 20% in this survey (Table 15 page 22). This major change was very likely a response to changes included in the 1996 Federal Agriculture Improvement and Reform (FAIR) Act. At the time of the 1996 survey, farmers were operating under a federal policy that often required wheat grain harvest on a large proportion of the acres planted to maintain wheat program base acres. Since federal payments were tied to wheat program base acres, producers were very reluctant to engage in practices that may have jeopardized wheat program base acres. However, under the 1996 act, producers were given greater flexibility. They were permitted to use wheat base acres to produce forage and still collect federal payments based upon their historical wheat base acres and wheat base grain yield. In addition, use of the land to produce forage did not jeopardize their wheat base acres. Another contributing factor to the relative decrease in acres intended for wheat grain in the 1999-2000 survey was that the 1999 average market year price of $2.24 per bushel of wheat was the lowest in decades (National Agricultural Statis-tics Service, 2003).
Diversification Producers may diversify to manage production
risks and reduce income variability. Wheat pro-ducers can diversify by using a combination of crop-ping systems on their cropland. The majority (61%) of respondents reported that they intended to grow wheat for more than one purpose (Table 16 page 22). However, 39% intended to use all of their wheat acreage for just one purpose, 19% for grain-only and 20% for forage-only. Dual-purpose is considered
to be a multiple activity and 27% indicated dual-purpose only. Other potential combinations were forage-only and dual-purpose (12%); grain-only and dual-purpose (8%); grain-only, forage-only, and dual-purpose (7%), and grain-only and forage-only (6%). The West Central region had the greatest per-centage (76%) and South Central-East region had the least percentage (26%) of producers who intended to grow wheat for more than one purpose.
Production Practices across Intended Use of Wheat Acreage
Wheat producers may vary production practices with intended use. Multiple pairwise comparisons of the means associated with each of the three pur-poses within each region were conducted using the Tukey method (Kuehl, 2000; SAS Institute, 1999a). State averages of selected responses in this survey were compared with state averages obtained from the 1996 survey (True et al., 2001) to the same or a very similar question to determine if the respective averages were statistically different from each other. For example, in the case of seeding rate, the grain-only averages of the two surveys were compared, the forage-only averages of the two surveys were compared, and the dual-purpose averages of the two surveys were compared. Assuming that the surveys were independent of each other, the data were normally distributed in each group, and the variances of the respective two groups were equal, it is appropriate to use a t test to compare the two means (SAS Institute, 1999b; Wackerly et al., 1996). All mean comparison tests were done at the 5% level of significance using SAS.
Seeding Rate Statewide, respondents reported the greatest
seeding rate of 94 lb/acre for wheat intended for forage-only (Table 17 page 23). The seeding rate for wheat intended for grain-only was 77 lb/acre and the seeding rate for wheat intended for dual-pur-pose was 84 lb/acre. These rates are consistent with recommendations in the sense that a greater seeding rate is recommended for wheat that is intended for forage relative to wheat intended for grain-only. However, the reported forage-only and dual-pur-pose rates were lower than rates recommended by state extension specialists (Krenzer, 2000c; Shroyer et al., 1993).
The Tukey test revealed that the forage-only average seeding rate was significantly greater than the seeding rates of both grain-only and dual-pur-pose. The seeding rate for dual-purpose production was significantly greater than that for grain-only.
5
When comparing state averages across the two surveys (Table 18 page 23), the t test found that the grain-only seeding rate average of 72 lb/acre in 1996 survey was significantly different than the grain-only average of 77 lb/acre in this survey. Simi-larly, the forage-only average of 90 lb/acre in 1996 survey was significantly different than the 94 lb/acre reported in this survey, and the dual-purpose average of 79 lb/acre in 1996 survey was also sig-nificantly different from the 84 lb/acre reported in this survey. Based upon these findings the average seeding rate increased by 4 to 5 pounds per acre from the fall of 1995 to the fall of 1999 across all three intended uses. These increases in seeding rates are consistent with research-based recommendations.
Table 17 also includes the reported average seeding rates across intended use by region. The least averages occurred in the Panhandle region, and the greatest averages occurred in the South Central-East region. This was similar to findings from the 1996 survey. Producers in the greater rainfall areas use greater seeding rates. Forage-only seeding rate averages were always the greatest among the three averages within each region. Grain-only averages were significantly lower than the respective forage-only averages in all the regions. Grain-only averages were also significantly lower than the respective dual-purpose averages in all regions except the Central region. However, the difference between the forage-only and dual-purpose averages was signifi-cant only in the Panhandle and Central regions.
Planting Date When asked to report the target and actual fall
1999 wheat planting dates, the respondents often recorded a range of dates for each category. In those cases, the middle date of the range was used for the analysis. The reported average target planting dates show that producers consistently planted forage-only wheat earliest, then dual-purpose wheat, fol-lowed by grain-only wheat (Table 19 page 23).
The state average wheat target planting dates were significantly different across intended use (Table 19). The average target planting date of October 2 for grain-only was significantly later than both forage-only and dual-purpose averages. The average dual-purpose target planting date of Sep-tember 20 was significantly later than the average forage-only target planting date of September 13. These averages were found to be significantly different from the respective 1995-96 grain-only average of September 27, forage-only average of September 10, and dual-purpose average of September 17 (Table 18). Average grain-only target
planting date was significantly later than forage-only and dual-purpose averages in all regions. The difference between forage-only and dual-purpose averages was significant only in the West Central, North Central, and Central regions.
The average responses to the question of actual planting date (Table 20 page 24) were later than the average target planting dates. Respondents on average planted wheat intended for grain-only the second week of October. Wheat intended for forage-only was planted during the fourth week of September, and dual-purpose wheat in late September or early October. Statewide, average grain-only actual planting date was significantly later than both forage-only and dual-purpose aver-ages, and average dual-purpose actual planting date was significantly later than the forage-only average. The 1996 actual planting date state averages were October 7 for grain-only, September 23 for forage-only and October 1 for dual-purpose. Within each region, in comparison to those of target planting dates there are fewer significant differences between the average actual planting dates. The latest average actual planting date (October 16) was for grain-only wheat in the Southwest region, and the earliest one (September 21) was for forage-only wheat in the South Central-East region.
Nitrogen Fertilizer Soil fertility plays a major role in wheat produc-
tion. Nitrogen is usually the most limiting nutrient associated with wheat forage production (Shroyer et al., 1993). Available nitrogen changes in the soil mainly as a result of the amount of nitrogen removed in forage and grain harvest relative to the amount added. Nitrogen requirements can be calculated based on expected yields. It is estimated that 1,000 pounds of dry forage requires 30 pounds of nitrogen and each bushel of grain requires two pounds of nitrogen (Krenzer, 1994). For an expected grain yield of 35 bushels per acre in a grain-only enterprise, an expected forage yield of 5,000 pounds of dry forage per acre in a forage-only enterprise, and 2,000 pounds of forage and 30 bushels of grain per acre in the dual-purpose enterprise, the recommended nitrogen requirements per acre will be approxi-mately 70 pounds, 150 pounds, and 120 pounds for grain-only, forage-only, and dual-purpose wheat enterprises, respectively. These quantities are based upon the assumption that no nitrogen is available from other sources such as breakdown of organic matter, and that none of the nitrogen consumed by the livestock that is returned to the soil in the form of urine and feces is available for use by the plant.
6

Table 21 (page 24) includes a summary of the actual nitrogen used across regions. All reported forage-only and dual-purpose nitrogen uses were lower than the recommendations by a large margin. This suggests that (1) farmers applied an insufficient quantity of nitrogen, (2) farmers expected that the soil contained a substantial quantity of residual nitrogen, or (3) the recommendation relative to nitrogen requirements for livestock production on grazing wheat is incorrect. It could be that the quantity of nitrogen returned to the field in the form of urine and feces is substantial and that its value is underestimated. Current nitrogen recommenda-tions relative to forage production and use by livestock were derived from wheat plots that were clipped rather than grazed. Additional research may be needed to more precisely determine forage and livestock response to nitrogen on plots that are actually grazed.
In the state as a whole, though the grain-only average of 63 lb/acre was significantly lower than both forage-only and dual-purpose averages of 69 lb/acre, the differences were not large. The averages in 1996 were 66 for grain-only, 78 for forage-only, and 70 for dual-purpose (Table 18). Only the forage-only t test showed the actual average nitrogen applied was significantly different from that reported in the 1996 survey. In the regional analysis, the reported averages were not significantly different from each other except in the Panhandle region (Table 21). In the Panhandle, the grain-only average was significantly lower than the dual-purpose average, but other averages were not significantly different from each other. The greatest reported average actual nitrogen use was for the wheat intended for dual-purpose in the South Central-East region, and the least was for the wheat intended for grain-only in the Panhandle region.
Fall and Winter Grazing PracticesApproximately 90% of the respondents in
every region, who checked at least one livestock type for question 14 of the survey, grazed either stocker cattle or cows and/or replacement heifers on 1999-2000 wheat pasture (Table 22 page 24). This response was similar to that reported in the 1996 survey. Other than the combination of stocker cattle and cows and/or replacement heifers, almost all other responses were checked as only one species. The responses for the state as a whole were 42% for stocker cattle, 22% for cows and/or replacement heifers, 28% for both stocker cattle and cows and/or replacement heifers, 1% for sheep, 2% for dairy cattle, 3% for horses, and 1% for other. Stocker cattle
had the greatest percentages in all regions except in the West Central region, where most respondents (38%) checked both stocker cattle and cows and/or replacement heifers. This combination was also high (34%) in the Southwest region.
The survey results and OASS reports were used to estimate the number of stocker steers and stocker heifers grazed on 1999-2000 wheat pasture (Tables 23 and 24 page 25). Column one of Tables 23 and 24 contains the estimate of wheat acres in the regions provided by the OASS (2001c). Column two con-tains the percentages of wheat acres used for either forage-only or dual-purpose as reported in Table 14. Column three is the multiplication of the first two columns and provides an estimate of the total wheat acres used for forage in each region.
Column four of Table 23 was derived from the survey results as follows. Respondents who checked stocker steers in survey question 15, were divided into two groups. One group of respondents had only stocker steers in their 1999-2000 fall-winter operation. The other group had steers in combina-tion with other species of livestock. It was assumed that the first group used all of their forage-only and dual-purpose acreage to graze steers and the second group used half of their forage-only and dual-pur-pose acreage to graze steers. Those two groups of acres were added and divided by the sum of all forage-only and dual-purpose acres in each region. The result is reported in column four of Table 23. Column four of Table 24 was calculated in a similar manner.
Multiplication of columns three (total acres) by four (percent used by stockers) resulted in column five (an estimate of the total wheat acres stocked with steers). Column six, the stocking rate, is also reported in Table 25 (page 25). Dividing column five (acres) by column six (stocking rate) results in column seven (the estimated number of steers in the state stock on wheat pasture during the 1999-2000 wheat production year). By this measure, there were an estimated 886,351 stocker steers (Table 23) and 466,136 stocker heifers (Table 24) on Oklahoma wheat pasture. The Panhandle and the South Central-East regions had the least number of steers and heifers. The Panhandle, the region with the least number of stockers (60,134 steers and 36,814 heifers), had the least number of wheat acres used for forage and lowest stocking rates. On the other hand the North Central region had the greatest number of steers (212,051) and heifers (111,390), and the greatest number of wheat acres used for forage and one of the greatest percentages of forage acres used by steers and heifers.
7

Table 25 includes average beginning weight, rate of gain, and stocking rates for steers and heifers, and stocking rates for cows. The state average for beginning weight was 460 lb for stocker steers and 447 lb for stocker heifers. The North Central region had the greatest averages, 479 lb for steers and 466 lb for heifers. The West Central region had the least average beginning weight of 430 lb for heifers. The averages for heifers in other regions were close to the state average. The least average beginning weight for steers was 436 lb in the South Central-East region.
On average, the reported rate of gain for steers was greater than the rate of gain for heifers across all regions. The reported state averages were 2.3 lb/day for steers and 2.1 lb/day for heifers. Almost all regions reported gains over 2.0 lb/day.
Stocking rates vary from year-to-year and region-to-region depending upon climatic and management factors that influence wheat forage production. The state stocking rate averages were 2.1 acres/steer and 2.0 acres/heifer. Other statewide stocking rate averages were 3.5 acres/head for cows with fall calves, 3.3 acres/head for cows with spring calves, and 2.9 acres/head for cows only. The reported stocking rates varied across regions. The South Central-East and Central regions reported the greatest stocking rates and the Panhandle, the region with least rainfall, reported the least stocking rates. The North Central region reported a relatively low stocking rate perhaps because it had the greatest average beginning weights for steers and heifers.
Purchase of Stockers Many respondents, who purchased stocker
cattle for fall-winter grazing, purchased animals in more than one month (Table 26 page 26). For example, statewide 6% of the respondents checked October, November, and December as the months they purchased stocker cattle. Twenty-seven percent of respondents chose a combination of months (July to December) that was not reported in the Table 26. October (15%) and November (14%) were the most popular months among the producers who checked only one month. Seven percent of the respondents purchased stocker cattle in months other than July to December.
Forty-two percent of the stocker cattle producers reported that they usually mass medicate stockers with an antibiotic after purchase and before place-ment on wheat (Table 27 page 26). The response percentages were similar across regions. Almost half (49%) of the Southwest region respondents reported that they mass medicated, whereas 38% of those in the South Central-East region did.
In response to the question, “How many days do you typically have purchased stockers on the farm before placing them on wheat,” the state average was 26 days (Table 28 page 26). The greatest average (31 days) was reported in the Panhandle region and the least average (23 days) was in the Central region.
Receiving Programs The receiving period is one of the most stressful
times during an animal’s life (Lalman and Gill, 1997). Many producers follow a receiving program for purchased stocker cattle or buy them pre-con-ditioned before placing them on wheat pasture. In the state as a whole, among the respondents who checked at least one of the four choices in question 18 of the survey, 21% used their own receiving diet, 23% used a commercial diet, 8% purchased cattle pre-conditioned, and 48% did not use a receiving diet (Table 29 page 26). A receiving diet, own or commercial, was most common (55%) in the North Central region and least common in the South Cen-tral-East where 57% reported not using a receiving diet. Purchasing pre-conditioned cattle was most common (16%) in the Southwest region.
Table 30 (page 26) includes a summary of days and cost of the receiving diets. The statewide aver-ages were 23 days at $12/head for producers who used their own receiving program, and 20 days at $15/head for a commercial program. Some of the regional averages might be unreliable due to a limited number of responses.
Grass hay was the most frequent feedstuff used by producers who used their own receiving program (Table 31 page 27). The three most commonly used programs in the state included grass hay. They were grass hay plus a high-protein supplement (27%), grass hay plus a high-energy supplement (22%), and grass hay alone (16%). Those three programs were mostly used (79%) in the South Central-East region and least used (49%) in the Panhandle region. A complete mixed ration (hand-fed daily) was also popular (19%) in the Panhandle.
Grazing Initiation and Termination Krenzer (1994) recommended that grazing
should not begin until wheat has developed a coronal root system. The coronal root system, also called secondary root system, anchors the plant, which makes it difficult for grazing animals to uproot it. Furthermore, future growth is not critically affected by leaf removal after this growth stage. In response to the question, “How did you determine when to begin grazing your wheat pasture,” 51% checked visual assessment of top growth (Table 32
8

page 27). This ranged from 32% in the Panhandle to 68% in the South Central-East region. Statewide, 39% reported that they initiated grazing after the root system was anchored. The choice of root system was greatest (60%) in the Panhandle and least (23%) in the South Central-East. Other listed alternatives (calendar date, climate conditions, recommendation of others) were not frequently checked.
Timing of fall-winter grazing termination is critical to successful dual-purpose wheat produc-tion. Removing livestock from wheat prior to the first hollow stem growth stage is important to enable grain production (Croy, 1984; Redmon et al., 1996). Studies have shown that net return per acre to a dual-purpose enterprise declines significantly if grazing continues beyond the presence of first hollow stem (Krenzer, 2000c). The stem will not elongate in heavily grazed wheat, hence the first hollow stem stage of growth must be determined in ungrazed wheat of the same variety and planting date as the wheat being grazed (Krenzer, 1994).
Table 33 (page 27) includes a summary of the responses to the question about the most important factor producers used to determine when to termi-nate fall-winter grazing. Only 17% of the respon-dents indicated that they used the first hollow stem stage of ungrazed wheat to terminate grazing, while 14% identified using the first hollow stem stage of grazed wheat. Though calendar date of the first hollow stem stage can vary considerably from year to year (Christiansen et al., 1989), the majority (58%) of respondents checked that they used calendar date to determine when to terminate grazing. Very few respondents (2%) relied upon the recommendation of someone else. The responses across regions were similar to the state percentages.
Statewide, producers removed livestock from dual-purpose wheat on March 3 (Table 34 page 27). Krenzer (1994) found that stem elongation usually occurs in Central Oklahoma between March 1 and March 20. In the survey, the average date for removal of livestock from grazing in the Central and the North Central regions was February 29. The Panhandle region had the latest average date of March 9.
Supplements Responses to a question about the types of
supplement fed to cows and stocker cattle on wheat pasture are summarized in Tables 35 through 38 (page 28). Most producers indicated that they fed more than one supplement type. Among the cow producers who responded to this question, 78% used hay and 53% used a mineral supplement (Table
35). Other popular supplements were protein (25%) and wheat straw (22%). Hay (74%), mineral (57%), wheat straw (23%), and protein (17%) were also the most common stocker supplements (Table 36). They were the four most widely used supplements fed to both cows and stockers in each region. Only 2% of the cow producers and 4% of the stocker producers did not use any supplement. Few respondents indicated the use of other listed supplement choices (liquid, high-starch energy, high-fiber energy).
Mineral SupplementsWheat pasture poisoning is a non-infectious
metabolic disorder of cows grazed on wheat pas-ture. It occurs most frequently in mature cows that are in the latter stages of pregnancy or are nursing calves, and that have been grazing wheat pasture for 60 days or more. Cows with wheat pasture poisoning have low blood concentrations of both calcium and magnesium. While a similar, tetany-like condition may occur in stocker cattle, its incidence is extremely low. Considerable variation occurs in the mineral composition of wheat forage. Until more complete data are available, the data in Table 39 (page 29) have been selected to indicate the calcium, phosphorus, magnesium, and potassium content of wheat forage in relation to the requirements for the same minerals of a 400 lb steer calf gaining 2 lb per day (Horn, 2003).
The values in Table 39 indicate that wheat forage contains marginal to sufficient phosphorus and magnesium, excess potassium (which is characteristic of small grains forages in general) and inadequate amounts of calcium for growing cattle. Therefore, calcium is the macromineral of primary concern in many wheat grazing situations. In these situations, wheat pasture stockers should be supplemented with an additional 10 grams of calcium per day. While this may seem to be a very small amount of calcium (and therefore perhaps not of practical importance), for perspective the total calcium requirement of a 400 lb steer calf gaining 2 lb/day is 28 grams. The additional calcium could be included as calcium carbonate in other supplements or a mineral mixture. No mineral mixture will be efficacious if desired amounts are not consumed. Intake of mineral mixtures must be monitored.
The lower values for phosphorus content of wheat forage in Table 39 are from Bushland, Texas (Stewart et al., 1981). In this area, and perhaps the Panhandle of Oklahoma and Southwestern Kansas, wheat pasture stocker cattle should also receive sup-plemental phosphorus depending on soil type and actual mineral analysis of wheat forage. A case of
9

phosphorus deficiency in a group of growing steers grazing wheat pasture was detected near Loyal, Oklahoma (i.e., North-Central Oklahoma) (Horn, 2003). The field had been in alfalfa for about six years prior to wheat. The application of phosphorus fertilizer for the wheat crop was less than recom-mended from soil test results. Phosphorus, calcium, magnesium, and potassium contents of wheat forage samples collected on January 14 were, respectively, 0.16, 0.26, 0.16 and 1.72 % of DM. The Angus steers appeared healthy and were fairly fleshy, but seemed to crave bones, which were present in a native grass area adjacent to the wheat pasture, from carcasses of cows that had died in previous years. Depraved appetite or pica is a classical sign of phosphorus deficiency in beef cattle. The mineral mixture that was being fed was changed from a low-phosphorus mineral (4.0 %) to a mineral mixture that contained 12% calcium, 12% phosphorus, and 12% salt. According to the owner, this resolved the bone-chewing problem (Horn, 2003).
The question relative to the effect of feeding mineral mixtures (often high-magnesium mineral mixtures) to wheat pasture stockers on the incidence of bloat is commonly raised. There is no evidence to support the suggestion that supplemental magne-sium will decrease the incidence and (or) severity of bloat of stocker cattle on wheat pasture (Horn, 2003). There may be a relationship between ruminal motility (and the ability of stocker cattle to eructate ruminal gases) and the calcium status of the cattle. Ruminal and gut motility is greatly compromised by subclinical deficiencies of calcium. Therefore, the concern of providing additional calcium to growing cattle on wheat pasture is two-fold: (1) to meet requirements for growth and (2) to perhaps decrease the bloat problem by an effect on ruminal motility (Horn, 2003). A potential research objective may be to determine if the so-called “dry bloat” problems that are sometimes observed in wheat pasture stocker cattle are related to a subclinical deficiency of calcium.
The survey found that more than half of the cow and stocker producers fed mineral supplements. Among those who grazed cows and who used mineral supplements, 79% checked magnesium as their primary mineral concern, 40% checked calcium, and 32% checked phosphorus (Table 37). The percentages for those grazing stockers were 74% for magnesium, 40% for calcium, and 42% for phosphorus (Table 38).
Table 40 (page 29) includes a summary of the pri-mary reasons producers fed a supplement to stocker cattle. Statewide, 34% of the producers reported that
providing supplemental nutrients such as minerals was the number one (most important) reason to feed a supplement; 27% reported providing addi-tional roughage, 16% reported maintaining an ideal average daily gain, and 12% reported increasing stocking density during the fall-winter grazing season as the number one reason. Providing addi-tional energy was not an important reason to most of the producers. The responses were similar across regions.
Stocker Health Problems and Additives Fed
Regarding the primary health problem of stockers after placement on wheat pasture, nearly all in the state reported either respiratory disease (53%) or bloat (41%) (Table 41 page 29). Bloat is a common problem associated with wheat pasture because of its high crude protein and low fiber contents (Horn et al., 1977). The Southwest region had the greatest percentages (57%) for bloat, while the North Central region had the greatest (60%) incidence of respiratory disease. Foot rot was not reported as a significant health problem except in the Central region (13%).
In the state, on average, the respondents reported 1.44% typical total death loss and 0.60% typical death loss from bloat for the wheat pasture stockers on their farms (Table 42 page 29). About half of the total death loss was from bloat, which underscores the significance of bloat as a herd health problem. The West Central region had the greatest averages for both average total death loss (1.72%) and death loss from bloat (0.71%), while the South Central-East region had the least averages (1.09% and 0.41%, respectively).
Bloat can be a big problem, especially during periods of rapid wheat growth in the fall and late winter. Shroyer et al. (1993) contend that feeding Bloat Guard (poloxalene) is one of the most effective practices for the prevention of bloat. Two ionophores, Rumensin (monensin) and Bovatec (lasalocid), are also available for wheat pasture stocker cattle. Both of them, if delivered in the proper dosage, increase weight gain of growing cattle on wheat pasture by 0.18 to 0.24 lb/day over that of the carrier supple-ment (Horn et al., 1981; Andersen and Horn, 1987). In addition, research by Branine and Galyean (1990) showed that Rumensin decreased the incidence and severity of bloat from wheat pasture. More recently, Paisley and Horn (1998) reported that Rumensin is more efficacious than Bovatec in decreasing both the incidence and severity of bloat of cattle grazing wheat pasture.
10

The survey found that 59% of the stocker cattle producers in the state fed at least one of the three additives to cattle on wheat pasture (Table 43 page 30). Ten percent used Rumensin only, 12% used Bovatec only, 20% used Bloat Guard only, and 17% used a combination of those three. Bloat Guard alone or in combination was used by 36% of the respondents. Bovatec alone or in combination was used by 24%. Rumensin alone or in combination was used by 18%. The Southwest region had the greatest percentage (72%) of stocker producers, who reported the use of at least one of the three additives. It was also the region where most producers (57%) identified bloat as the primary health problem.
The majority (61%) of the respondents, who fed Bloat Guard to stocker cattle, said that they had used it during the high bloat risk periods (Table 44 page 30). Statewide, 39% of the producers fed Bloat Guard during the entire wheat pasture season. Among those who used Rumensin, 26% indicated that they used it only to increase gain, 32% indi-cated that they used it only to decrease bloat, and 42% used it for both reasons. The percentages for Bovatec were 36%, 22%, and 42%, respectively. Most of the producers reported that Rumensin (81%) and Bovatec (78%) were self-fed.
Graze-out Management PracticesAverages for beginning weights, rates of gain,
and stocking rates were considerably greater during the graze-out period (Table 45 page 30) compared with those of the fall-winter grazing period. The average beginning weights varied widely from region to region. The range of average weights was approximately three times greater than that for the fall-winter period. The state average beginning weights were 556 lb for steers and 526 lb for heifers. Consistent with the fall-winter grazing period, the greatest averages for beginning weights occurred in the North Central region. The South Central-East region had the least averages for both steers and heifers.
The average daily gains were 2.4 lb for steers and 2.2 lb for heifers. The reported rates of gain were greater for steers than heifers in most regions. The greatest average gains were reported in the Southwest region, 2.6 lb/day for steers and 2.5 lb/day for heifers. The least gains were in the South Central-East region, 2.1 lb/day for steers and 1.9 lb/day for heifers.
Stocking rates for the graze-out season are usu-ally 1.5-2.0 times greater than the fall-winter rates.
All reported average stocking rates were greater in the graze-out period compared with the fall-winter grazing period. The average stocking rates were 1.2 acres/head for steers and heifers, 2.3 acres/head for cows with fall calves, 2.2 acres/head for cows with spring calves, and 1.7 acres/head for cows only. The stocking rates for steers across regions were similar except in the South Central-East region, where the respondents reported a relatively low rate. All regions also had very similar stocking rates for heifers except the Panhandle and the South Central-East regions. As noted in Table 45, some of the reported regional stocking rates were calculated from very few available responses.
The decision of whether or not wheat will be grazed out can be delayed until shortly before or at the first hollow stem stage. This permits flexibility in response to changes in relative prices of wheat and cattle, weather, and federal farm programs. However, among those who responded to the ques-tion regarding timing of the decision to graze-out, 39% reported that the percentage of their total wheat acres that would be grazed out was determined prior to planting, while 35% reported that it was determined during the fall-winter grazing season (Table 46 page 30). Only 13% checked the choice, “when livestock were removed from fall-winter pas-ture,” and 9% checked “at planting.” The response summary across regions is included in Table 46.
In a related question, producers were asked to rank the top three factors that influence their deci-sion on how many, if any, acres they would graze-out each year. Thirty-eight percent identified wheat prices and 29% identified cattle prices as the number one (most important) factor. Wheat and cattle prices were checked 33% and 30% of the time, respectively, as the number two factor (Table 47 page 31). They were the top two choices for the most important factor in all the regions. Cattle price, not wheat price, was the top choice for the number one factor only in the Central and the South Central-East regions. In the state as a whole, 9% said that cheat was the most important factor. Cheat refers to several of the annual winter grasses, also known as bromegrasses. Graze-out wheat provides a very effective way for controlling cool season weeds, such as cheat, which is expensive to control with herbicides (Krenzer, 1994). Cheat was particularly identified as a big problem in the North Central region. Among the other prominent factors statewide were lack of moisture and crop rotation. Lack of moisture was more important in the Panhandle, South Central-East, and Southwest regions.
11

Wheat Pasture Grazing Lease Arrangements
The USDA (1992) reported that 43% of the farm-land in the U.S. was operated under lease agree-ments in 1992 compared with 35% in 1950. Analysis of agricultural land lease arrangements has been a strong focus of economists since the early writings of Adam Smith and John Stewart Mill (Dasgupta et al., 1999). An attempt was made to identify some of the common lease arrangements used for wheat pasture grazing in Oklahoma. Wheat pasture leases are somewhat unique in that three parties may be involved. One party may own the land (landlord), a second party may produce the wheat (wheat producer), and a third party may own and stock the livestock on the wheat (livestock producer). Wheat pasture contractual arrangements may involve all three parties or may involve only the wheat pro-ducer and the livestock producer.
Wheat pasture leasing may be a good option to many wheat producers, since they can reduce finan-cial risk by not owning the livestock. The livestock producer’s expected earnings, the wheat producer’s costs, competition in the lease market, quality of pasture, amenities of the pasture land, relevant government programs, tax laws, and other related economic activities influence the structure of the lease agreements and rates (Doye et al., 2001).
The majority (58%) of the respondents, who indi-cated that they were involved in renting or leasing fall-winter wheat pasture, were wheat producers (Table 48 page 31). These individuals produced the wheat and leased the wheat pasture to someone else. However, 29% were livestock owners, who rented pasture from a wheat producer and stocked their cattle on wheat pasture. In addition, 13% of the respondents checked both livestock owner and wheat producer.
Legal experts recommend that producers have a written wheat pasture lease agreement, preferably drafted by an attorney (Tilley, 1988). However, the survey results showed that about 90% of the lease contracts statewide were oral and only 10% were written. This was consistent with the previous survey (True et al., 2001), when 82% of the leases were oral. In every region, more than 80% of the leases were oral.
On average, the size of the lease agreements was 303 acres. The range of the average size was from 212 acres in Central Oklahoma to 432 acres in the Panhandle region. The majority (63%) reported that the land had been leased for multiple years, while 38% reported a single year lease. Multiple year leases accounted for 79% of the agreements in the
South Central-East region, and for 48% in the North Central region. On average, the multiple year leases extended for more than seven years; more than nine years in the Panhandle, and more than five years in the Central region.
Some respondents reported a combination of rental pricing methods. This suggests that some producers may have more than one lease arrange-ment. The methods of rate per hundredweight per month ($/cwt/month) and rate per pound of gain ($/lb of gain) were overwhelmingly popular for renting fall-winter grazing in all regions (Table 49 page 31). None of the respondents used rate per acre per month ($/acre/month). Very few respondents identified rate per acre per year ($/acre/year) and rate per head per month ($/head/month) as the methods used. The state average fall-winter grazing rental rates were $2.74 for the $/cwt/month method and $0.32 for the $/lb of gain method. The regional averages for $/cwt/month method ranged from $2.44 in the Southwest to $2.91 in the North Central region. The averages for $/lb of gain were similar across all regions.
The most widely used rental method for graze-out acreage was $/lb of gain, followed by $/acre/year and $/cwt/month (Table 50 page 32). Other methods were not common. The state averages were $74 for $/acre/year, $2.84 for $/cwt/month, and $0.32 for $/lb of gain. There were no noteworthy differences between the average rental prices of fall-winter grazing and graze-out for the $/cwt/month and $/lb of gain methods.
Lease agreements and negotiations involve assignments of responsibilities to supply relevant inputs and services to the contracting parties. One of the main goals of a fair and economically efficient contract is to recognize that the assignments should be done to curtail moral hazard by either of the par-ties. Moral hazard is a technical concept that refers to the risk that the presence of a contract will affect the behavior of one or more parties. The typical example is in the insurance industry, where insurance cov-erage might increase the risk-taking behavior of the insured. In the context of a wheat pasture lease, moral hazard refers to the potential (hazard) for either the wheat producer or the livestock owner to conduct an activity in a manner detrimental to the economic outcome of the other. For example, a livestock owner may benefit by keeping the cattle on the wheat after first hollow stem. However, this practice will reduce wheat grain yield and the wheat producer’s income.
Some empirical studies have found that land-lords expect tenant moral hazard in the use of
12

landlord-supplied inputs (Dasgupta et al., 1999). It is also possible for the tenant to under-invest in resources that have productive benefits beyond the lease term. Alternatively, landlords may under-invest when the benefits of the investment accrue solely during the lease term and mainly benefit the tenant. Hence, assignments of input responsibilities play an important role in determining the efficiency of resource use.
Respondents were asked to identify, under the fall-winter grazing rental price they gave, the responsible parties for a few selected services. Assuming that the livestock owners and wheat producers will be mostly tenants and landlords, respectively, lease agreements should have a ten-dency to assign the services that would primarily benefit cattle production to the livestock owners and the services that would enhance the land beyond the lease period to the wheat producers. This hypothesis was supported by the survey responses (Table 51 page 32). The majority of the respondents reported that livestock owners were responsible for checking livestock, salt and minerals, supplemental feeding, and supplemental pasture. The items for which the wheat producers were most frequently responsible for were fencing materials, fencing labor, fertilizer cost, and water. These findings were consistent with those of previous surveys (Doye et al., 2001; Doye et al., 1999; True et al., 2001).
Conclusions
The overall objective of this study was to pro-vide information about production methods, man-agement practices, and lease arrangements used by Oklahoma wheat, wheat pasture, and wheat pasture livestock producers. The specific objectives were to (1) determine the proportion of wheat grown for each of the three purposes (grain-only, forage-only, and dual-purpose) and determine if production practices differ across intended use; (2) determine production methods and management practices used by Oklahoma wheat, wheat pasture, and wheat pasture livestock producers; (3) determine characteristics of wheat pasture lease arrangements; and (4) to compare selected responses from the 2000 survey to those of the 1996 survey of Oklahoma wheat, wheat pasture, and wheat pasture livestock producers.
The information obtained from this research may be used to compare actual practices used by producers to recommended practices, to identify research and extension program needs, and to target
extension programs to practices that deviate sub-stantially from research-based recommendations.
Oklahoma farmers planted 6.1 million acres to wheat in the fall of 1999. Based upon the survey results, more than 3.7 million acres (61%) were grazed. Statewide, the respondents intended to use 20% of the wheat acreage for forage-only, 49% for dual-purpose, and 31% for grain-only, but due to weather constraints use was 22%, 39%, and 39%, respectively. Relative to 1995-96, the respondents intended and actually used more acreage for forage-only in 1999-2000. The difference may be related to changes in the relative prices of wheat and cattle and to changes resulting from the 1996 Federal Agricultural Improvement and Reform Act.
Oklahoma farmers use different wheat manage-ment practices depending upon intended use of the wheat. For example, average reported seeding rates were 94 lb/acre for forage-only, 84 lb/acre for dual-purpose, and 77 lb/acre for grain-only. Producers recognize the influence of planting date on wheat forage and grain yields. Respondents indicated average target planting dates of September 13 for forage-only, September 20 for dual-purpose, and October 2 for grain-only. Nitrogen use also differed depending upon intended use. Respondents, on average, used 69 lb/acre, 69 lb/acre, and 63 lb/acre for forage-only, dual-purpose, and grain-only, respectively.
Stocker cattle and cows and/or replacement heifers were by far the most common livestock species that grazed on 1999-2000 wheat pasture. The survey findings indicate that approximately 1,352,000 steers and heifers were stocked on Okla-homa wheat pasture during the 1999-2000 season (886,000 steers and 466,000 heifers). On average, the beginning weights for steers and heifers were 460 lb and 447 lb, respectively. Almost all regions reported daily gains in excess of 2 lb. The average stocking rates were 2.1 acres/steer and 2.0 acres/heifer.
Wheat pasture leases are somewhat unique in that three parties may be involved. One party may own the land (landlord), a second party may pro-duce the wheat (wheat producer), and a third party may own and stock the livestock on the wheat (live-stock producer). Wheat pasture contractual arrange-ments may involve all three parties or may involve only the wheat producer and the livestock producer. Some individuals may be involved in more than one type of contract. For example, 13% who indicated involvement in leases checked both livestock owner and wheat producer. And, some respondents used more than one method to establish rental charges. These results suggest that it is difficult to discern
13
detailed information regarding wheat pasture lease contracts from a mail questionnaire. An alternative method may be justified for a researcher interested in precise information regarding wheat pasture production contracts.
The survey identified several production practices that deviate substantially from current recommendations. For example, all reported forage-only and dual-purpose nitrogen uses were lower than recommendations. This suggests that farmers applied an insufficient quantity of nitrogen, or they expected the soil contained a substantial quantity of residual nitrogen, or the recommendation relative to nitrogen requirements for livestock production on grazing wheat is incorrect. Current nitrogen recommendations relative to forage production and livestock use were derived from wheat plots that were clipped rather than grazed. It could be that the quantity of nitrogen returned to the field in the form of urine and feces is substantial and that its value is underestimated. Additional research may be needed to more precisely determine forage and livestock response to nitrogen on plots that are actu-ally grazed.
Wheat production specialists recommend that grazing should not be initiated until the coronal root system is developed. More than half of the respondents used visual assessment of top growth, rather than development of the coronal root system, to determine when to begin grazing.
Wheat production specialists also recommend that producers use the first hollow stem stage of ungrazed wheat of the same variety and planting date to determine when to terminate fall-winter grazing. Almost two thirds of the dual-purpose wheat producers did not reveal a correct under-standing of the term “first hollow stem.”
Livestock production specialists recommend the use of a receiving diet for stocker cattle. But, almost half of the respondents did not use a receiving diet.
Research has shown that in most situations wheat forage contains marginal to sufficient phos-phorus and magnesium, excess potassium, and inadequate amounts of calcium for growing cattle. Therefore, calcium is the macromineral of primary concern. However, most producers (74%) indicated that magnesium rather than calcium (40%) was the macromineral of primary concern for cattle grazing wheat.
Legal experts recommend that producers have a written wheat pasture lease agreement. However, the survey results showed that about 90% of the lease contracts statewide were oral and only 10% were written.
The study findings enhance understanding of the actual practices of wheat and livestock pro-ducers in Oklahoma. This information will be useful in identifying the issues that need to be addressed in extension and research programs. It was determined in this and in the 1996 survey that producers do dif-ferentiate seeding rates, planting dates, and nitrogen uses according to the intended use of wheat. How-ever, in most cases, the differences were not as much as recommended by research and extension specialists. The reported seeding and nitrogen rates were less than recommended for forage-only and dual-purpose production by a large margin.
Emphasis on wheat forage as a vital income source will warrant more studies on risk analysis, comparative economic returns, and efficient combi-nations of the potential three uses of wheat produc-tion. Wheat variety development research should continue the effort to select dual-purpose varieties for maximization of net income from the produc-tion of both forage and grain. As evident from the literature and discussions, successful dual-purpose wheat production requires unique management skills. Investment in research and extension pro-grams is critical to improve the profitability and reduce financial risks associated with dual-purpose wheat production.
References
Andersen, M.A. and G.W. Horn. 1987. Effect of lasa-locid on weight gains, ruminal fermentation and forage intake of stocker cattle grazing winter wheat pasture. J. Anim. Sci. 65:865.
Branine, M.E. and M.L. Galyean. 1990. Influence of grain and monensin supplementation on ruminal fermentation, intake, digestion kinetics, and incidence and severity of frothy bloat in steers grazing winter wheat pasture. J. Anim. Sci. 68:1139.
Brorsen, B.W., D. Bailey, and M.R. Thomsen. 1994. Oklahoma cattle and the video auction: Loca-tion of buyers, location of cattle purchased, and quality premiums. Oklahoma Current Farm Econ. 67:3-13.
Carver, B.F., E.G. Krenzer, Jr., and W.E. Whitmore. 1991. Seasonal forage production and regrowth of hard and soft red winter wheat. Agron. J. 83:533-537.
Christiansen, S., T. Svejcar, and W.A. Phillips. 1989. Spring and fall cattle grazing effects on com-ponents and total grain yield of winter wheat. Agron. J. 81:145-150.
14
Croy, L.I. 1984. Effects of clipping and grazing termination date on grain production. p. 35-40. In G.W. Horn (ed.) National wheat pasture sym-posium proceedings. Misc. Publ. 115. Oklahoma Agric. Exp. Stn., Stillwater.
Dasgupta, S., T.O. Knight, and H.A. Love. 1999. Evolution of agricultural land leasing models: A survey of the literature. Review of Agricultural Economics 21:148-176.
Doye, D., D. Kletke, and B.L. Fischer. 1999. Oklahoma pasture rental rates: 1998-99. CR-216. Oklahoma State Univ. Coop. Ext. Serv., Stillwater.
Doye, D., D. Kletke, B.L. Fischer, and D.D. Davies. 2001. Oklahoma pasture rental rates: 2000-2001. CR-216. Oklahoma State Univ. Coop. Ext. Serv., Stillwater.
Epplin, F.M., I. Hossain, and E.G. Krenzer, Jr. 2000. Winter wheat fall-winter forage yield and grain yield response to planting date in a dual-pur-pose system. Agric. Systems 63:161-173.
Epplin, F.M., E.G. Krenzer, Jr., and G. Horn. 2001. Net returns from dual-purpose wheat and grain-only wheat. J. of the American Society of Farm Managers and Rural Appraisers. 65:8-14.
Harwell, R.L., P.L. Strickland, and R. Jobes. 1976. Utilization of winter wheat pasture in Okla-homa. Res. Rep. P-743. Oklahoma State Univ. Agric. Exp. Stn., Stillwater.
Horn, G.W., B.R. Clay and L.I Croy. 1977. Wheat pas-ture vloat of stockers. Animal Science Research Report MP-101. Okla. Agric. Exper. Sta. Pages 26-31.
Horn, G.W., T.L. Mader, S.L. Armbruster, and R.R. Frahm. 1981. Effect of monensin on ruminal fermentation, forage intake, and weight gains of wheat pasture stocker cattle. J. Anim. Sci. 52:447.
Horn, G.W., and S. I. Paisley. 1999. Developments in the management and supplementation of stocker cattle on wheat pasture. Proceedings of the Plains Nutrition Council Spring Confer-ence. San Antonio, TX. Publication No. AREC 99-9. Texas A&M Res. and Ext. Center, Amarillo. Pages 48-73.
Horn, G.W., and S.I. Paisley. October, 2000. Manage-ment and supplementation strategies for stocker cattle grazing winter wheat pasture. Proceedings of the Pacific Northwest Animal Nutrition Con-ference. Spokane, Washington. Pages 91–122.
Horn, G.W., C. Gibson, J. Kountz, and C. Lunsford. 2002. Two-year summary: Effect of mineral supplementation with or without ionophores on growth performance of wheat pasture stocker cattle. Proceedings Wheatland Stocker Confer-ence. Pages A1-A19.
Horn, G.W. March 21, 2003. Personal communica-tion. Stillwater, Oklahoma.
Johnson, G.V., H. Zhang, and E.G. Krenzer. 2000. Fertility management. p. 19-26. In T.A. Royer and E.G. Krenzer (ed.) Wheat Management in Oklahoma. E-831. Oklahoma State Univ. Coop. Ext. Serv., Stillwater.
Krenzer, Jr., E.G. 1994. Wheat for pasture. F-2586. Oklahoma State Univ. Coop. Ext. Serv., Stillwater.
Krenzer, E.G. Jr, A.R. Tarrant, D.J. Bernardo, and G.W. Horn. 1996. An economic evaluation of wheat cultivars based on grain and forage pro-duction. J. of Prod. Agric. 9:66-73.
Krenzer, E.G. 2000a. Introduction. p. 1-4. In T.A. Royer and E.G. Krenzer (ed.) Wheat Manage-ment in Oklahoma. E-831. Oklahoma State Univ. Coop. Ext. Serv., Stillwater.
Krenzer, E.G. 2000b. Production management. p. 11-18. In T.A. Royer and E.G. Krenzer (ed.) Wheat Management in Oklahoma. E-831. Oklahoma State Univ. Coop. Ext. Serv., Stillwater.
Krenzer, E.G. 2000c. Wheat as forage. p. 27-30. In T.A. Royer and E.G. Krenzer (ed.) Wheat Man-agement in Oklahoma. E-831. Oklahoma State Univ. Coop. Ext. Serv., Stillwater.
Kuehl, R.O. 2000. Design of experiments: Statistical principles of research design and analysis. Dux-bury Press, Pacific Grove, CA.
Lalman, D., and D.R. Gill. 1997. Nutrition and man-agement of stressed stocker cattle. Oklahoma State Univ. Wheatland Stocker Conference.
National Agricultural Statistics Service. 2003. Agri-cultural Statistics Data Base: U.S. and State Data. [Online]. Available: http://www.nass.usda.gov:81/ipedb/
Oklahoma Agricultural Statistics Service. 2001a. Annual Bulletin: 1999 and 2000. [Online]. Available: http://www.nass.usda.gov/ok/bulletin.htm
Oklahoma Agricultural Statistics Service. 2001b. Annual Bulletin: 2000. [Online]. Available: http://www.nass.usda.gov/ok/bulletin.htm
Oklahoma Agricultural Statistics Service. 2001c. County Estimates: All Wheat County Estimates 2000. [Online]. Available: http://www.nass.usda.gov/ok/wheat00.htm
Oklahoma Climatological Survey. 2001. Annual Summaries: 2000 Climate Summary. [Online]. Available: http://climate.ocs.ou.edu/annual_summary.html
15

Paisley, S.I., and G.W. Horn. 1998. Effect of iono-phore on rumen characteristics, gas production, and occurrence of bloat in cattle grazing winter wheat pasture. 1998 Animal Science Research Report, pp. 141-146. Oklahoma State Univ. Agric. Exp. Stn., Stillwater.
Pinchak, W.E., W.D. Worrall, S.P. Caldwell, L.J. Hunt, N.J. Worrall, and M. Conoly. 1996. Interre-lationships of forage and steer growth dynamics on wheat pasture. J. of Range Management 49:126-130.
Redmon, L.A., G.W. Horn, E.G. Krenzer, Jr., and D.J. Bernardo. 1995. A review of livestock grazing and wheat grain yield: Boom or bust? Agron. J. 87:137-147.
Redmon, L.A., E.G. Krenzer, Jr., D.J. Bernardo, and G.W. Horn. 1996. Effect of wheat morphological stage at grazing termination on economic return. Agron. J. 88:94-97.
Rodriguez, A., J.N. Trapp, O.L. Walker, and D.J. Ber-nardo. 1990. A wheat grazing systems model for the US southern plains: Part I-model description and performance. Agric. Systems 33:41-59.
SAS Institute. 1999a. SAS OnlineDoc Version 8, SAS/STAT User’s Guide: The GLM Procedure. SAS Inst. Inc., Cary, NC. [Online]. Available: http://www.okstate.edu/sas/v8/saspdf/stat/pdfidx.htm
SAS Institute. 1999b. SAS OnlineDoc Version 8, SAS/STAT User’s Guide: The TTEST Procedure. SAS Inst. Inc., Cary, NC. [Online]. Available: http://www.okstate.edu/sas/v8/saspdf/stat/pdfidx.htm
Shroyer, J.R., K.C. Dhuyvetter, G.L. Kuhl, D.L. Fjell, L.N. Langemier, and J.O. Fritz. 1993. Wheat Pas-ture in Kansas. C-713. Kansas State Univ. Coop. Ext. Serv., Manhattan.
Stewart, B.A., D.L. Grunes, A.C. Mathers, and F.P. Horn. 1981. Chemical composition of winter wheat forage grown where grass tetany and bloat occur. Agron. J. 73:337.
Tilley, M.L. 1988. Wheat pasture lease agreements. Rep. 200. Oklahoma State Univ. Ext. Ser., Stillwater.
True, R.R., F.M. Epplin, E.G. Krenzer, Jr., and G.W. Horn. 2001. A survey of wheat production and wheat forage use practices in Oklahoma. Bul-letin No. B-815. Oklahoma State Univ. Agric. Exp. Stn., Stillwater.
Tweeten, L. (ed.) 1982. Oklahoma agriculture 2000. Div. of Agric., Oklahoma State Univ., Stillwater.
U.S. Department of Agriculture (USDA). 1992. Agri-cultural Statistics. Economic Research Service, Washington, D.C.
Wackerly, D.D., W. Mendenhall, and R.L. Scheaffer. 1996. Mathematical statistics with applications. Duxbury Press, Belmont, CA.
Walker, O.L., D.J. Bernardo, J.N. Trapp, and A.L. Rodriguez. 1988. A survey of wheat Pasture utilization systems in western Oklahoma. Res. Rep. P-903. Oklahoma State Univ. Agric. Exp. Stn., Stillwater.
Warde, W.D. 1990. Sampling methods. Statistics Department, Oklahoma State Univ., Stillwater.
Winter, S.R., and E.K. Thompson. 1987. Grazing duration effects on wheat growth and grain yield. Agron. J. 79:110-114.
Winter, S.R., and E.K. Thompson. 1990. Grazing winter wheat: I. Response of semidwarf culti-vars to grain and grazed production systems. Agron. J. 82:33-37.
Witt, M.D. 1996. Delayed planting opportunities with winter wheat in the central great plains. J. Prod. Agric. 9:74-78.
16

1. Panhandle*2. West Central3. Southwest4. North Central5. Central6. South Central-East
1
2
3
4
5
6
Figure 1. Oklahoma wheat producing regions.
* Regions 1 through 5 correspond with agricultural staticstics districts as defined by the Oklahoma Agricultural Statistics Service. Region 6 includes four districts: South Central, Northeast, East Central, and Southeast.
Table 1. Number of usable responses, number of wheat acres included in the survey, and size of survey relative to total planted Oklahoma wheat acreage in 1999-2000.
Region Usable Total Total Percent of Total Acres Responses Wheat Acres of Oklahoma Wheat Included in Survey Respondents Acres*
Panhandle 161 73,564 680,000 11%West Central 192 86,349 900,000 10%Southwest 193 100,504 1,350,000 7%North Central 201 114,213 1,850,000 6%Central 181 60,521 850,000 7%South Central-East 162 25,846 470,000 5%
State 1090 460,997 6,100,000 8%
*Source: Oklahoma Agricultural Statistics Service, 2001c.
Table 2. Average July-December, 1999 precipitation (inches) in Oklahoma by region, with deviations of precipitation from historical (1971- 2000) averages shown in parentheses.
Region July August September October November December Annual
Panhandle 1.47 (-1.08) 2.27 (-0.22) 1.95 (+0.06) 1.63 (+0.10) 0.00 (-1.01) 0.80 (+0.12) 24.04 (+3.00)West Central 1.01 (-1.15) 1.98 (-0.74) 1.91 (-1.16) 1.42 (-1.17) 0.83 (-0.98) 2.65 (+1.48) 28.19 (-0.98)Southwest 1.52 (-0.64) 0.31 (-2.36) 1.80 (-1.59) 2.36 (-0.66) 0.20 (-1.52) 3.02 (+1.60) 29.33 (-1.39)North Central 2.61 (-0.39) 2.27 (-0.82) 4.62 (+1.50) 1.37 (-1.31) 0.46 (-1.65) 3.24 (+1.91) 42.46 (+10.54)Central 1.44 (-1.15) 1.03 (-1.58) 4.49 (+0.46) 2.14 (-1.45) 0.58 (-2.13) 3.84 (+1.83) 39.29 (+1.98)South Central 0.87 (-1.57) 1.68 (-0.84) 4.47 (+0.24) 2.68 (-1.45) 0.92 (-1.97) 2.33 (-0.11) 36.15 (-3.47)Northeast 1.19 (-1.95) 1.48 (-1.65) 6.46 (+1.57) 1.62 (-2.11) 1.72 (-2.06) 4.19 (+1.71) 50.82 (+7.99)East Central 1.39 (-1.56) 0.95 (-1.93) 5.28 (+0.34) 1.48 (-2.82) 1.87 (-2.49) 3.65 (+0.57) 45.57 (-0.59)Southeast 0.97 (-2.63) 0.80 (-1.91) 3.17 (-1.33) 2.32 (-2.73) 1.76 (-3.17) 4.66 (+0.60) 42.08 (-8.75)
State 1.40 (-1.33) 1.43 (-1.33) 3.92 (+0.12) 1.90 (-1.49) 0.90 (-1.89) 3.15 (+1.10) 37.88 (+1.33)
Source: Oklahoma Agricultural Statistics Service, 2001a.
17
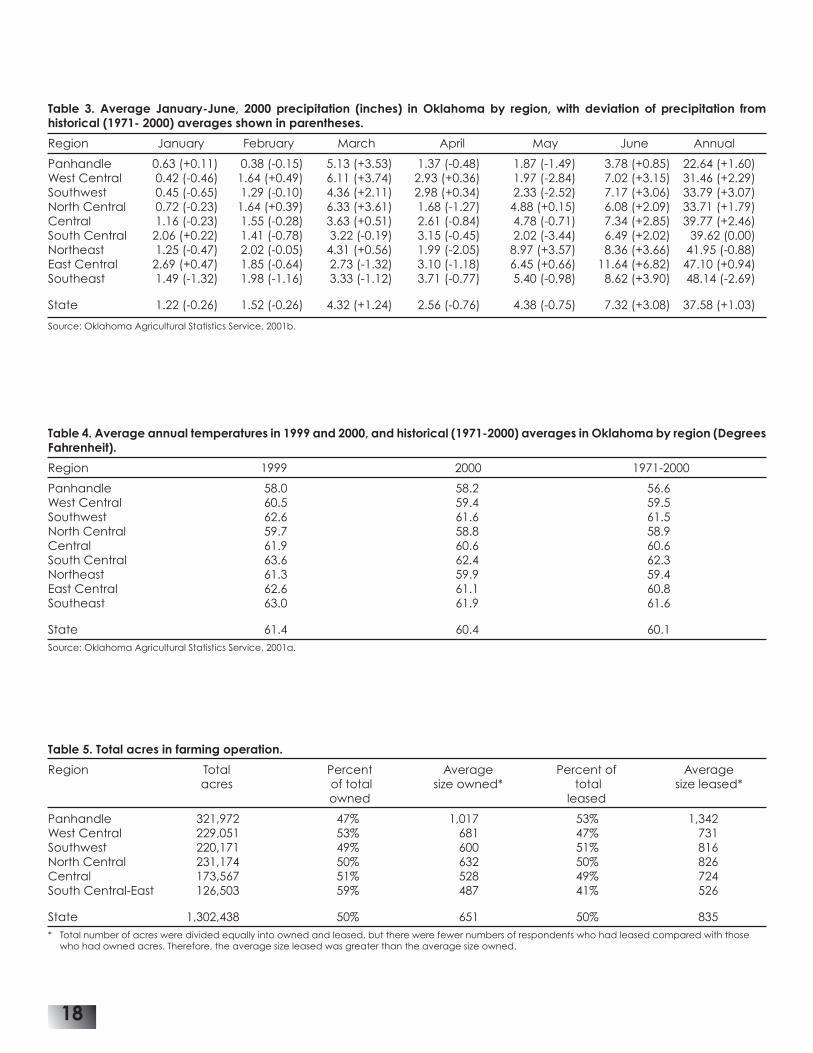
Table 3. Average January-June, 2000 precipitation (inches) in Oklahoma by region, with deviation of precipitation from historical (1971- 2000) averages shown in parentheses.
Region January February March April May June Annual
Panhandle 0.63 (+0.11) 0.38 (-0.15) 5.13 (+3.53) 1.37 (-0.48) 1.87 (-1.49) 3.78 (+0.85) 22.64 (+1.60)West Central 0.42 (-0.46) 1.64 (+0.49) 6.11 (+3.74) 2.93 (+0.36) 1.97 (-2.84) 7.02 (+3.15) 31.46 (+2.29)Southwest 0.45 (-0.65) 1.29 (-0.10) 4.36 (+2.11) 2.98 (+0.34) 2.33 (-2.52) 7.17 (+3.06) 33.79 (+3.07)North Central 0.72 (-0.23) 1.64 (+0.39) 6.33 (+3.61) 1.68 (-1.27) 4.88 (+0.15) 6.08 (+2.09) 33.71 (+1.79)Central 1.16 (-0.23) 1.55 (-0.28) 3.63 (+0.51) 2.61 (-0.84) 4.78 (-0.71) 7.34 (+2.85) 39.77 (+2.46)South Central 2.06 (+0.22) 1.41 (-0.78) 3.22 (-0.19) 3.15 (-0.45) 2.02 (-3.44) 6.49 (+2.02) 39.62 (0.00)Northeast 1.25 (-0.47) 2.02 (-0.05) 4.31 (+0.56) 1.99 (-2.05) 8.97 (+3.57) 8.36 (+3.66) 41.95 (-0.88)East Central 2.69 (+0.47) 1.85 (-0.64) 2.73 (-1.32) 3.10 (-1.18) 6.45 (+0.66) 11.64 (+6.82) 47.10 (+0.94)Southeast 1.49 (-1.32) 1.98 (-1.16) 3.33 (-1.12) 3.71 (-0.77) 5.40 (-0.98) 8.62 (+3.90) 48.14 (-2.69)
State 1.22 (-0.26) 1.52 (-0.26) 4.32 (+1.24) 2.56 (-0.76) 4.38 (-0.75) 7.32 (+3.08) 37.58 (+1.03)
Source: Oklahoma Agricultural Statistics Service, 2001b.
Table 4. Average annual temperatures in 1999 and 2000, and historical (1971-2000) averages in Oklahoma by region (Degrees Fahrenheit).
Region 1999 2000 1971-2000
Panhandle 58.0 58.2 56.6West Central 60.5 59.4 59.5Southwest 62.6 61.6 61.5North Central 59.7 58.8 58.9Central 61.9 60.6 60.6South Central 63.6 62.4 62.3Northeast 61.3 59.9 59.4East Central 62.6 61.1 60.8Southeast 63.0 61.9 61.6
State 61.4 60.4 60.1Source: Oklahoma Agricultural Statistics Service, 2001a.
Table 5. Total acres in farming operation.
Region Total Percent Average Percent of Average acres of total size owned* total size leased* owned leased
Panhandle 321,972 47% 1,017 53% 1,342West Central 229,051 53% 681 47% 731Southwest 220,171 49% 600 51% 816North Central 231,174 50% 632 50% 826Central 173,567 51% 528 49% 724South Central-East 126,503 59% 487 41% 526
State 1,302,438 50% 651 50% 835* Total number of acres were divided equally into owned and leased, but there were fewer numbers of respondents who had leased compared with those
who had owned acres. Therefore, the average size leased was greater than the average size owned.
18

Table 6. Survey respondents who indicated membership in OWGA*, OGSP, and/or OCA (%).
Region OWGA OGSP OCA Both Both Both All three None only only only OWGA & OWGA & OGSP & of the three OGSP OCA OCA
Panhandle 9 1 15 1 5 1 0 68Wheat Acres Planted** 7 1 17 0 6 3 0 66
West Central 10 0 13 1 8 1 0 68Wheat Acres Planted 9 0 15 2 11 2 0 62
Southwest 18 0 14 1 5 0 1 62Wheat Acres Planted 18 0 16 0 7 0 0 58
North Central 14 1 12 0 9 0 2 61Wheat Acres Planted 13 1 12 0 11 0 4 58
Central 8 0 17 0 11 0 1 62Wheat Acres Planted 6 0 25 0 21 0 1 46
South Central-East 5 0 14 0 2 1 1 77Wheat Acres Planted 8 0 21 0 4 1 0 65
State 11 0 14 0 7 0 1 66Wheat Acres Planted 11 0 17 0 10 1 1 59* OWGA = Oklahoma Wheat Growers Association ; OGSP = Oklahoma Grain and Stocker Producers; OCA = Oklahoma Cattlemen’s Association. ** Proportion of the members’ reported wheat acreage with respect to the reported total planted wheat acres in the survey.
Table 7. Survey respondents, classified by intended use of wheat, who indicated membership in OWGA*, OGSP, and/or OCA (%).
Region OWGA OGSP OCA Both Both Both All three None only only only OWGA & OWGA & OGSP & of the three OGSP OCA OCA
Grain-only Panhandle 18 4 4 0 5 0 0 69 West Central 19 0 6 0 0 0 0 75 Southwest 38 0 4 0 0 0 0 58 North Central 20 0 7 0 7 0 2 64 Central 6 0 11 0 6 0 0 78 South Central-East 6 0 6 0 0 0 0 87
State 18 1 6 0 4 0 1 71
Forage-only Panhandle 13 0 25 0 0 0 0 63 West Central 0 0 7 4 7 0 0 82 Southwest 0 0 23 0 0 0 0 77 North Central 0 0 17 0 0 0 0 83 Central 4 0 21 0 4 0 2 69 South Central-East 2 0 14 0 2 1 1 80
State 3 0 17 0 3 0 1 76
Forage and Grain Panhandle 5 0 21 1 5 1 0 68 West Central 11 0 14 1 9 1 0 64 Southwest 18 0 15 0 7 0 1 58 North Central 13 1 14 1 9 0 2 60 Central 11 0 17 0 15 0 1 56 South Central-East 10 0 20 0 5 0 0 66
State 12 0 16 0 9 0 1 61* OWGA = Oklahoma Wheat Growers Association ; OGSP = Oklahoma Grain and Stocker Producers; OCA = Oklahoma Cattlemen’s Association. Grain-only
- Producers who planted wheat intended only for grain; Forage-only - Producers who planted wheat intended only for grazing; Forage and Grain - Producers who intended to use their wheat to produce both fall-winter forage and grain.
19

Table 8, Percentage of respondents who indicated that a crop such as rye or ryegrass was planted with the wheat and the percentage of total wheat acres that included a combination.
Region Respondents who planted Wheat acreage a crop with wheat, such as rye or ryegrass that included a combination
Panhandle 3.1 1.6West Central 9.4 2.9Southwest 11.4 3.8North Central 6.0 0.7Central 19.3 9.8South Central-East 30.9 16.2
State 13.0 4.0
Table 9. Frequency of soil test as reported by the respondents (%).
Region Every Every 2 Every 3 Seldom or Other Year Years Years Never
Panhandle 15 15 21 48 1West Central 10 25 30 30 4Southwest 11 15 37 37 1North Central 16 15 31 36 2Central 9 13 35 39 4South Central-East 5 19 36 35 5
State 11 17 32 37 2
Table 10. Percentage of each definition of “first hollow stem” responses across intended use by region.
Region Joint or node Developing head Hollow stem Not above soil is above soil above roots familiar
Grain-only* Panhandle 18 8 21 53 West Central 7 27 20 46 Southwest 26 13 17 43 North Central 28 13 29 30 Central 25 6 31 38 South Central-East 10 3 23 64
State 20 11 24 45
Forage-only** Panhandle 12 6 38 44 West Central 16 4 32 48 Southwest 9 8 22 61 North Central 33 0 0 67 Central 9 4 22 65 South Central-East 13 10 15 62
State 13 7 21 59
Dual-purpose*** Panhandle 26 15 27 32 West Central 20 12 35 33 Southwest 23 13 30 34 North Central 11 20 44 25 Central 20 10 39 31 South Central-East 6 9 41 44
State 19 14 36 31* Grain-only - Producers who intended to use all of their acreage for the purpose of grain-only. ** Forage-only - Producers who intended to use all of their acreage for the purpose of forage-only. *** Dual-purpose - Producers who had at least some proportion of their acreage for dual-purpose.
20

Tab
le 1
1. C
hara
cte
ristic
s o
f whe
at u
sed
to d
ete
rmin
e w
hic
h va
riety
to p
lant
(%
).
Fo
rag
eY
ield
G
rain
Yie
ld
Alu
min
um
Te
st W
eig
ht
Co
leo
ptil
e L
en
gth
W
inte
r D
rou
gh
t
Late
Fro
st
Inse
ct
or p
H t
ole
ran
ce
H
ard
ine
ss
Tole
ran
ce
T
ole
ran
ce
R
esis
tan
ce
Re
gio
n
#1
#2
#3
#1
#2
#3
#1
#2
#3
#1
#2
#3
#1
#2
#3
#1
#2
#3
#1
#2
#3
#1
#2
#3
#1
#2
#3
Pan
ha
nd
le
20*
14*
11*
48
22
6 0
0 0
3 15
10
1
1 6
6 7
7 6
14
14
0 2
5 0
2 5
We
st C
en
tra
l 44
25
7
43
30
8 2
3 9
2 12
19
1
2 4
2 4
7 2
7 11
0
2 4
1 0
2So
uth
we
st
37
21
9 46
22
10
0
2 4
2 12
16
1
2 1
0 4
6 3
10
11
0 2
1 0
2 5
No
rth
Ce
ntr
al
23
19
9 59
21
7
3 5
9 6
19
16
1 3
5 1
4 3
1 3
5 0
1 3
0 2
3C
en
tra
l 49
18
7
38
18
7 1
2 7
3 13
13
0
3 3
1 9
10
3 9
8 0
2 2
1 5
4So
uth
Ce
ntr
al-E
ast
53
18
5
27
15
8 1
2 0
1 11
8
0 0
1 6
12
8 4
13
10
1 3
3 1
5 7
Sta
te
38
19
8 44
22
8
1 3
5 3
14
14
1 2
3 2
7 7
3 9
9 0
2 3
0 3
4*
Exa
mp
le: F
ora
ge
yie
ld re
ce
ive
d 2
0% o
f all
nu
mb
er o
ne
co
un
ts (
mo
st im
po
rta
nt)
, 14%
of a
ll n
um
be
r tw
o c
ou
nts
, an
d 1
1% o
f all
nu
mb
er t
hre
e c
ou
nts
in t
he
Pa
nh
an
dle
reg
ion
.
Tab
le 1
1 (C
ont
inue
d).
Cha
rac
teris
tics
of w
hea
t use
d to
de
term
ine
whi
ch
varie
ty to
pla
nt (
%).
H
eig
ht
of P
lan
t Pa
st S
uc
ce
ss
Dise
ase
M
atu
rity
Ped
igre
e
Sha
tte
ring
Lo
dg
ing
M
illin
g
Oth
er
R
esis
tan
ce
R
ep
uta
tion
&Ba
kin
g Q
ua
lity
Re
gio
n
#1
#2
#3
#1
#2
#3
#1
#2
#3
#1
#2
#3
#1
#2
#3
#1
#2
#3
#1
#2
#3
#1
#2
#3
#1
#2
#3
Pan
ha
nd
le
0 3
3 12
8
8 1
2 8
0 1
2 0
1 0
1 3
6 1
1 1
0 2
5 1
0 1
We
st C
en
tra
l 1
3 2
1 5
11
0 2
9 0
2 3
1 0
1 0
0 2
0 0
1 0
1 1
1 0
0So
uth
we
st
0 3
5 6
9 13
2
2 7
1 4
5 0
1 1
1 2
4 0
1 2
0 1
1 1
0 0
No
rth
Ce
ntr
al
1 3
4 3
7 12
1
6 12
0
3 3
0 0
2 1
1 2
0 2
2 0
1 2
1 0
1C
en
tra
l 1
6 4
4 6
18
0 2
10
1 4
2 0
0 0
0 0
1 0
0 3
0 1
1 0
0 0
Sou
th C
en
tra
l-Ea
st
1 4
6 3
4 21
1
8 14
0
3 4
0 0
1 0
1 1
0 1
3 0
0 0
1 0
1
Sta
te
1 4
4 5
7 13
1
4 10
0
3 3
0 0
1 0
1 3
0 1
2 0
1 2
1 0
0
Tab
le 1
2. S
our
ce
s o
f inf
orm
atio
n us
ed
to s
ele
ct w
hic
h va
riety
of w
hea
t to
pla
nt (
%).
Te
st P
lot
Ne
igh
bo
ring
Fie
lds
See
d A
vaila
bili
ty
Past
R
ese
arc
h
Exte
nsio
n
See
d
Oth
er
Perf
orm
an
ce
Pu
blic
atio
ns
Serv
ice
C
om
pa
ny
Info
.
Re
gio
n
#1
#2
#3
#1
#2
#3
#1
#2
#3
#1
#2
#3
#1
#2
#3
#1
#2
#3
#1
#2
#3
#1
#2
#3
Pan
ha
nd
le
15*
16*
12*
8 34
19
5
13
28
59
22
9 7
9 16
2
4 7
3 2
7 1
0 1
We
st C
en
tra
l 18
18
18
12
32
20
4
13
24
54
19
13
8 12
14
2
3 5
2 2
5 0
0 1
Sou
thw
est
18
19
20
16
31
18
6
11
22
54
22
11
3 11
17
1
3 7
3 3
5 0
0 0
No
rth
Ce
ntr
al
24
22
12
12
25
18
6 11
18
44
26
14
7
8 23
4
3 7
2 5
5 1
0 2
Ce
ntr
al
19
11
13
9 29
21
11
15
28
51
22
10
6
13
15
0 4
6 4
4 8
1 1
0So
uth
Ce
ntr
al-E
ast
16
9
6 8
25
23
20
24
25
43
23
15
3 8
12
6 1
10
4 10
6
0 1
2
Sta
te
18
16
14
11
30
20
8 14
24
51
22
12
6
10
16
2 3
7 3
4 6
1 0
1*
Exa
mp
le: T
est
plo
t re
ce
ive
d 1
5% o
f all
nu
mb
er o
ne
co
un
ts (
mo
st im
po
rta
nt)
, 16%
of a
ll n
um
be
r tw
o c
ou
nts
, an
d 1
2% o
f all
nu
mb
er t
hre
e c
ou
nts
in t
he
Pa
nh
an
dle
reg
ion
.
21
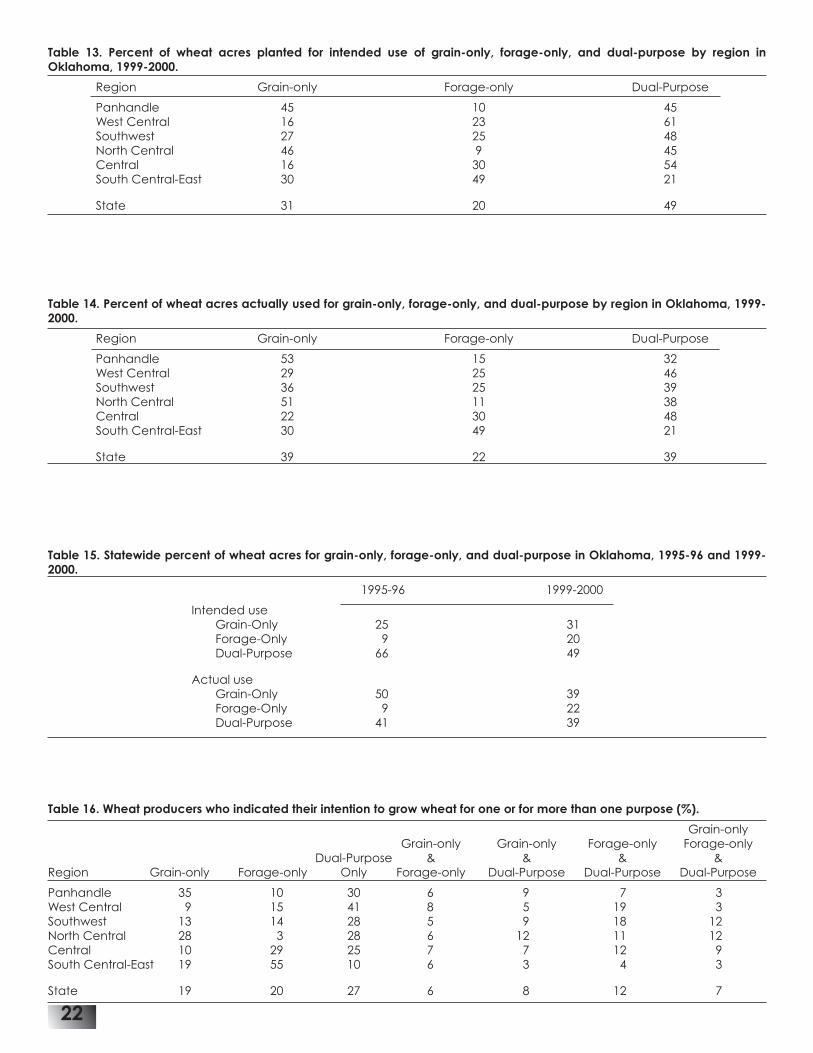
Table 13. Percent of wheat acres planted for intended use of grain-only, forage-only, and dual-purpose by region in Oklahoma, 1999-2000.
Region Grain-only Forage-only Dual-Purpose
Panhandle 45 10 45 West Central 16 23 61 Southwest 27 25 48 North Central 46 9 45 Central 16 30 54 South Central-East 30 49 21
State 31 20 49
Table 14. Percent of wheat acres actually used for grain-only, forage-only, and dual-purpose by region in Oklahoma, 1999-2000.
Region Grain-only Forage-only Dual-Purpose
Panhandle 53 15 32 West Central 29 25 46 Southwest 36 25 39 North Central 51 11 38 Central 22 30 48 South Central-East 30 49 21
State 39 22 39
Table 15. Statewide percent of wheat acres for grain-only, forage-only, and dual-purpose in Oklahoma, 1995-96 and 1999-2000.
1995-96 1999-2000
Intended use Grain-Only 25 31 Forage-Only 9 20 Dual-Purpose 66 49
Actual use Grain-Only 50 39 Forage-Only 9 22 Dual-Purpose 41 39
Table 16. Wheat producers who indicated their intention to grow wheat for one or for more than one purpose (%).
Grain-only Grain-only Grain-only Forage-only Forage-only Dual-Purpose & & & &Region Grain-only Forage-only Only Forage-only Dual-Purpose Dual-Purpose Dual-Purpose
Panhandle 35 10 30 6 9 7 3West Central 9 15 41 8 5 19 3Southwest 13 14 28 5 9 18 12North Central 28 3 28 6 12 11 12Central 10 29 25 7 7 12 9South Central-East 19 55 10 6 3 4 3
State 19 20 27 6 8 12 7
22

Table 17. Average seeding rate across intended use by region (lb/acre).
Region Grain-only Forage-only Dual-Purpose
Panhandle 52a (81, 16)* 73 b (33, 21) 61c (69, 19)West Central 80 a (71, 16) 89 b (78, 18) 86 b (123, 16)Southwest 81 a (93, 17) 90 b (88, 21) 89 b (114, 19)North Central 77 a (118, 14) 85 b (59, 16) 81 b (108, 14)Central 87 a (66, 16) 99 b (94, 22) 90 a (89, 17)South Central-East 96 a (52, 18) 109 b (90, 22) 108 b (35, 25)
State 77 a (481, 20) 94 b(442, 23) 84 c(538, 21)* Means with common lettered superscript within each row (region) are not statistically different from each other at α = 0.05. Numbers in parentheses are sample
size and standard deviation, respectively.
Table 18. Comparison of the state averages of seeding rate (lb/acre), planting date, and nitrogen rate (lb/acre) across intended use, 1995-96 and 1999-2000.
1995-96 1999-2000
Seeding rate Grain-Only 72a (404, 21)* 77b(481, 20) Forage-Only 90 a(226, 24) 94 b(442, 23) Dual-Purpose 79 a(535, 20) 84 b(538, 21)
Target planting date Grain-Only 9/27 a(397, 14) 10/2 b(449, 16) Forage-Only 9/10 a(214, 14) 9/13 b(423, 14) Dual-Purpose 9/17 a(513, 11) 9/20 b(498, 13)
Actual planting date Grain-Only 10/7 a(322, 15) 10/10 b(317, 17) Forage-Only 9/23 a(178, 18) 9/24 a(294, 18) Dual-Purpose 10/1 a(431, 15) 9/30 a(368, 17)
Nitrogen rate Grain-Only 66 a(275, 37) 63 a(398, 32) Forage-Only 78 a(145, 41) 69 b(358, 35) Dual-Purpose 70 a(364, 32) 69 a(424, 34)* Means with common lettered superscript within each row (intended use) are not statistically different from each other at α = 0.05. Numbers in parentheses
are sample size and standard deviation, respectively.
Table 19. Target planting date across intended use by region.
Region Grain-only Forage-only Dual-Purpose
Panhandle 9/23 a (83, 12)* 9/9 b (38, 17) 9/16 b (66, 16)West Central 9/30 a (70, 16) 9/12 b (74, 11) 9/20 c (110, 13)Southwest 10/5 a (81, 17) 9/16 b (81, 16) 9/22 b (104, 14)North Central 10/4 a (108, 13) 9/15 b (59, 13) 9/22 c (99, 10)Central 10/4 a (60, 15) 9/12 b (93, 14) 9/20 c (88, 12)South Central-East 10/5 a (47, 21) 9/13 b (84, 13) 9/15 b (31, 13)
State 10/2 a (449, 16) 9/13 b (423, 14) 9/ 20 c (498, 13)* Means with common lettered superscript within each row (region) are not statistically different from each other at α = 0.05. Numbers in parentheses are sample size and standard deviation,
respectively.
23

Table 20. Actual 1999 planting date across intended use by region.
Region Grain-only Forage-only Dual-Purpose
Panhandle 10/6 a (59, 19)* 9/27 a (23, 29) 9/28 a (49, 21)West Central 10/11 a (38, 20) 9/25 b (55, 16) 10/3 a (81, 20)Southwest 10/16 a (61, 18) 9/28 b (51, 20) 10/2 b (73, 18)North Central 10/9 a (74, 11) 9/24 b (39, 13) 9/29 c (73, 9)Central 10/12 a (48, 16) 9/22 b (69, 18) 9/26 b (67, 13)South Central-East 10/8 a (37, 20) 9/21 b (57, 17) 9/24 b (25, 18)
State 10/10 a (317, 17) 9/24 b (294, 18) 9/30 c (368, 17)* Means with common lettered superscript within each row (region) are not statistically different from each other at α = 0.05. Numbers in parentheses are
sample size and standard deviation, respectively.
Table 21. Actual average nitrogen applied across intended use by region (lb/acre).
Region Grain-only Forage-only Dual-Purpose
Panhandle 42 a (61, 28)* 50 a b(30, 24) 56 b(47, 30)West Central 66 a(58, 38) 63 a(62, 31) 64 a(94, 33)Southwest 67 a(76, 30) 72 a(72, 33) 74 a(93, 34)North Central 63 a(98, 27) 66 a(51, 30) 69 a(93, 33)Central 67 a(59, 34) 74 a(80, 37) 74 a(71, 31)South Central-East 75 a(46, 33) 78 a(63, 41) 88 a(24, 45)
State 63 a(398, 32) 69 b(358, 35) 69 b(434, 34)* Means with common lettered superscript within each row (region) are not statistically different from each other at α = 0.05. Numbers in parentheses are sample
size and standard deviation, respectively.
Table 22. Fall-winter wheat pasture use by livestock type, 1999-2000 (%).
Region Stocker Cows and/or Both Stocker Sheep Dairy Cattle Horses Other Cattle Replacement Cattle and Cows Heifers and/or Replacement Heifers
Panhandle 56 24 18 0 1 0 1West Central 35 19 38 2 1 5 0Southwest 37 24 34 1 1 2 1North Central 52 18 24 1 0 2 3Central 40 21 28 2 4 4 1South Central-East 41 28 21 1 4 4 1
State 42 22 28 1 2 3 1
24

Table 23. Estimated number of wheat acres used for forage in Oklahoma and estimated number of stocker steers on 1999-2000 Oklahoma wheat pasture.
Region Total Percent Total Wheat Percent used Total Wheat Stocking Rate Estimated Oklahoma used for Acres used for by Stocker Acres Stocked Acres/Steer†† Number of Wheat Acres* Forage** Forage Steers† with Stocker (F) Steers (A) (B) (C=A x B) (D) Steers (G=E ÷ F) (E=C x D)
Panhandle 680,000 47 316,954 45 142,629 2.4 60,134West Central 900,000 71 640,713 45 288,321 2.0 144,922Southwest 1,350,000 64 868,378 49 425,505 2.3 185,592North Central 1,850,000 49 897,483 56 502,591 2.4 212,051Central 850,000 78 663,146 55 364,730 1.8 202,939South Central-East 470,000 70 327,698 39 127,802 1.5 82,668
State 6,100,000 61 3,729,091 49 1,827,254 2.1 886,351
* Oklahoma Agricultural Statistics Service, 2001c.** Table 14.† Derived from survey results.†† Table 25.
Table 24. Estimated number of wheat acres used for forage in Oklahoma and estimated number of stocker heifers on 1999-2000 Oklahoma wheat pasture.
Region Total Percent Total Wheat Percent used Total Wheat Stocking Rate Estimated Oklahoma used for Acres used for by Stocker Acres Stocked Acres/Heifer†† Number of Wheat Acres* Forage** Forage Heifers† with Stocker (F) Heifers (A) (B) (C=A x B) (D) Heifers (G=E ÷ F) (E=C x D)
Panhandle 680,000 47 316,954 29 91,917 2.5 36,814West Central 900,000 71 640,713 26 166,585 2.1 80,908Southwest 1,350,000 64 868,378 20 173,676 2.0 87,505North Central 1,850,000 49 897,483 28 251,295 2.3 111,390Central 850,000 78 663,146 27 179,049 1.7 107,740South Central-East 470,000 70 327,698 19 62,263 1.6 39,793
State 6,100,000 61 3,729,091 25 932,273 2.0 466,136* Oklahoma Agricultural Statistics Service, 2001c.** Table 14.† Derived from survey results.†† Table 25.
Table 25. Average fall-winter grazing cattle beginning weights, rates of gain, and stocking rates.
Beginning Beginning Rate of Rate of Stocking Stocking Stocking Rate Stocking Rate Stocking Weight Weight Gain Gain Rate Rate Cows with Cows with Rate Steers Heifers Steers Heifers Steers Heifers Fall Calves Spring Calves Cows Region (lb) (lb) (lb/day) (lb/day) (acres/hd) (acres/hd) (acres/hd) (acres/hd) (acres/hd)
Panhandle 464 449 2.3 2.1 2.4 2.5 6.9 ** 6.1* 3.0 **
West Central 449 430 2.2 2.1 2.0 2.1 3.7 2.6 3.2**
Southwest 454 446 2.3 2.2 2.3 2.0 3.8 3.5 3.0*
North Central 479 466 2.4 2.1 2.4 2.3 4.3 3.8 3.3**
Central 476 449 2.4 2.3 1.8 1.7 2.6 2.6 2.7*
South Central-East 436 440 2.1 2.0 1.5 1.6 2.9 2.4 1.6**
State 460 447 2.3 2.1 2.1 2.0 3.5 3.3 2.9* Less than 25 observations used to calculate.** Less than 15 observations used to calculate.
25

Table 26. The months when stocker cattle for fall-winter grazing were purchased by the respondents (%).
July Aug Sept Oct Nov Dec Other Oct Nov Oct Other REGION Only Only Only Only Only Only single Nov Dec Nov Combination Months Dec of months
Panhandle 6* 13 13 13 6 3 10 3 3 6 23West Central 8 8 11 17 17 2 5 2 3 8 23Southwest 2 13 3 13 17 7 7 2 0 2 35North Central 0 2 5 24 16 5 8 8 5 8 19Central 6 8 6 9 8 8 5 5 5 8 34South Central-East 0 4 11 15 22 7 11 0 7 4 19
State 4 8 7 15 14 5 7 4 4 6 27* Example: 6% of the respondents purchased stocker cattle only in July.
Table 27. Percentage of stocker producers who mass medicated stockers with an antibiotic after purchase and before placement on wheat.
Region Mass Medicated
Panhandle 41 West Central 40 Southwest 49 North Central 40 Central 41 South Central-East 38
State 42
Table 28. Average number of days producers typically had purchased stockers on the farm before placing them on wheat.
Region Purchase Days
Panhandle 31 West Central 28 Southwest 27 North Central 26 Central 23 South Central-East 24
State 26
Table 29. Reported receiving diets for purchased stocker cattle (%).
Own Commercial Pre- NoRegion Diet Diet Conditioned Diet
Panhandle 23 26 11 40West Central 26 16 8 50Southwest 18 24 16 42North Central 28 27 4 41Central 16 24 4 56South Central-East 17 20 6 57
State 21 23 8 48
Table 30. Average days and cost of stocker receiving diets.
Producer’s Own Diet Commercial Diet
Days Cost Days CostRegion ($/Head*) ($/Head*)
Panhandle 25.73** 9.15** 22.50** 18.20**
West Central 22.79 11.87 16.88** 17.36**
Southwest 22.55** 10.26** 19.57 15.07North Central 20.55 9.71** 22.53 12.75**
Central 22.20** 19.19** 20.57 12.87South Central-East 27.88** 11.20** 19.64** 17.19**
State 23.04 11.52 20.33 15.06* Dollars per head for the entire receiving period.** Less than 15 observations used to calculate.
26

Table 31. Stocker cattle feeding program during receiving (%).
Region Grass Silage Alfalfa Silage Grass Self-fed Grass Daily Alfalfa Other hay alone hay alone plus hay plus mixed hay plus hand-fed hay plus supplement high-protein ration high-energy mixed high-energy supplement supplement ration supplement
Panhandle 7 0 7 2 21 5 21 19 0 17West Central 18 1 4 1 24 7 21 5 11 8Southwest 16 0 6 1 24 8 18 8 10 10North Central 10 0 4 0 31 1 33 4 7 7Central 19 0 5 1 32 3 13 8 8 11South Central-East 23 0 4 2 30 2 26 5 5 4
State 16 0 5 1 27 4 22 8 8 9
Table 32. Factors that producers used to determine when to begin grazing wheat (%).
Assessment Anchored Calendar of Top Climate Root Recommendation Region Date Growth Conditions System of others Other
Panhandle 0 32 8 60 0 0West central 3 41 6 48 0 2Southwest 2 59 4 34 0 1North Central 5 41 6 45 1 2Central 3 58 6 31 0 2South Central-East 1 68 5 23 1 2
State 2 51 6 39 0 2
Table 33. Factors that producers used to determine when to terminate fall-winter grazing (%).
Region Calendar First hollow First hollow Recommendation Other Date stem stage stem stage of others of ungrazed wheat of grazed wheat
Panhandle 47 25 13 0 14West central 60 18 14 1 7Southwest 68 11 13 3 5North Central 57 22 12 2 7Central 57 14 15 3 11South Central-East 50 13 13 2 22
State 58 17 14 2 10
Table 34. Average grazing termination date used by producers who planned to harvest wheat for grain.
Region Date
Panhandle March 9 West central March 6 Southwest March 1 North Central February 29 Central February 29 South Central-East March 1
State March 3
27

Table 35. Types of supplement fed to cows on wheat pasture (%).
Region None Hay Protein Liquid High Wheat High Mineral Other Starch Energy Straw Fiber Energy
Panhandle* 11 59 26 0 11 15 7 59 4West Central 1 85 30 4 4 30 4 52 0Southwest 1 73 21 9 3 31 3 50 6North Central 4 71 27 4 2 20 0 57 2Central 0 80 26 2 4 16 1 54 1South Central-East 4 86 25 2 2 16 7 54 0
State 2 78 25 4 3 22 3 53 2* Row totals are greater than 100% as most producers used more than one type.
Table 36. Types of supplement fed to stocker cattle on wheat pasture (%).
Region None Hay Protein Liquid High Wheat High Mineral Other Starch Energy Straw Fiber Energy
Panhandle* 10 60 19 2 10 21 8 52 10West Central 2 76 14 7 9 29 4 46 2Southwest 3 68 13 6 4 36 7 60 1North Central 5 78 17 3 7 20 2 60 3Central 5 81 16 3 7 12 3 61 2South Central-East 3 76 24 1 10 16 4 63 0
State 4 74 17 4 7 23 4 57 3* Row totals are greater than 100% as most producers used more than one type.
Table 37. Mineral supplement of primary concern to the cow producers (% of respondents who checked at least one of the four mineral types).
Region Calcium Phosphorus Magnesium Other
Panhandle* 53 20 73 7West Central 36 28 89 8Southwest 35 50 79 9North Central 50 13 75 0Central 44 33 67 11South Central-East 29 36 89 7
State 40 32 79 8* Row totals are greater than 100% as most producers checked more than one type.
Table 38. Mineral supplement of primary concern to the stocker cattle producers (% of respondents who checked at least one of the four mineral types).
Region Calcium Phosphorus Magnesium Other
Panhandle* 29 52 71 10West Central 41 30 78 5Southwest 43 41 65 4North Central 28 42 84 2Central 55 47 66 9South Central-East 37 45 84 8
State 40 42 74 6* Row totals are greater than 100% as most producers checked more than one type.
28

Table 39. Mineral composition of wheat forage and mineral requirements of steers.
Item Calcium Phosphorus Magnesium Potassium
Composition, % of DM .35 .25 - .40 .15 3-5Requirementa .56 .26 .10 0.7a400 lb growing steer gaining 2 lb/day and consuming 11 pounds DM/day.Source: Horn, 2003.
Table 40. Primary reasons producers gave for feeding a supplement to stocker cattle on wheat pasture (%).
Nutrients . Energy . Roughage . Gain . Stocking Density Other .
Region #1 #2 #3 #1 #2 #3 #1 #2 #3 #1 #2 #3 #1 #2 #3 #1 #2 #3
Panhandle† 30* 17* 6* 13 15 21 26 24 18 15 22 24 15 20 27 2 2 3West Central 31 21 13 3 19 33 26 27 10 17 20 27 17 11 16 7 1 2Southwest 38 22 12 3 10 21 25 27 16 17 24 26 12 16 12 6 1 12North Central 33 30 6 6 22 19 26 25 8 17 8 31 8 11 31 11 3 4Central 38 21 12 2 10 25 31 30 12 15 26 22 10 12 23 5 1 7South Central-East 33 17 8 3 9 25 29 26 11 17 17 31 10 28 19 8 4 6
State 34 22 10 4 14 24 27 27 12 16 20 27 12 15 21 6 2 6† Row totals may not add up to 100% due to rounding errors.* Example: Nutrients received 30% of all number one counts (most important), 17% of all number two counts and 6% of all number three counts in the
Panhandle region.
Table 41. Reported primary health problem of stockers after placement on wheat pasture (%).
Region Bloat Respiratory Disease Foot Rot Polioencephalomalacia Other
Panhandle 41 57 2 0 0West Central 39 55 3 0 3Southwest 57 42 1 0 0North Central 37 60 2 0 0Central 33 53 13 1 0South Central-East 38 54 5 0 3
Sate 41 53 4 0 1
Table 42. Total death loss and death loss from bloat on the farm’s of the respondents (%).
Region Total Death Loss Death Loss From Bloat
Panhandle 1.21 0.58West Central 1.72 0.71Southwest 1.55 0.68North Central 1.54 0.56Central 1.34 0.57South Central-East 1.09 0.41
State 1.44 0.60
29

Table 43. Producers who reported the feeding of Rumensin, Bovatec, and Bloat Guard as additives (% of respondents who reported grazing stocker cattle on wheat pasture).
Region Rumensin Bovatec Bloat Guard Rumensin & Rumensin & Bovatec & All Only Only Only Bovatec Bloat Guard Bloat Guard Three
Panhandle* 10 14 19 0 8 8 0West Central 9 11 19 2 8 8 2Southwest 12 14 23 1 4 15 3North Central 11 11 22 0 5 11 0Central 9 15 16 3 4 8 3South Central-East 8 7 24 2 2 1 4
State 10 12 20 1 5 9 2* Since many respondents did not check any of the additives, row totals do not add up to 100%.
Table 44. Reasons and type of feeding for additives reported by stocker cattle producers (%).
Rumensin Bovatec Bloat Guard
Region Gain Bloat Both Self-fed Hand Gain Bloat Both Self-fed Hand Full High only only fed only only fed season risk
Panhandle 27* 0* 73* 100 0 30 40 30 88 13 24* 76*West Central 33 38 29 88 13 50 25 25 91 9 33 68Southwest 12 53 35 88 13 30 22 48 81 19 46 54North Central 25 31 44 64 36 42 11 47 75 25 50 50Central 13 25 63 64 36 31 19 50 72 28 37 63South Central-East 46 31 23 88 13 29 29 43 50 50 39 61
State 26 32 42 81 19 36 22 42 78 22 39 61* Example: In Panhandle region, respondents fed Rumensin to increase gain only 27% of the time, to decrease bloat only 0% of the time and for both reasons
73% of the time. In the same region, respondents fed Bloat Guard during full season 24% of the time and during high bloat risk periods 76% of the time.
Table 45. Average beginning weights, rates of gain, and stocking rates of cattle in graze-out period.
Region Beginning Beginning Rate of Rate of Stocking Stocking Stocking Rate Stocking Rate Stocking Weight Weight Gain Gain Rate Rate Cows with Cows with Rate Steers Heifers Steers Heifers Steers Heifers Fall Calves Spring calves Cows only (lb) (lb) (lb/day) (lb/day) (acres/hd) (acres/hd) (acres/hd) (acres/hd) (acres/hd)
Panhandle 543* 526* 2.2* 2.3* 1.2* 1.6* 2.3* 2.8** 1.5**West Central 532 520 2.4 2.3 1.1 1.1 1.8** 1.7* 1.6**Southwest 568 508 2.6 2.5 1.2 1.1 2.2* 1.9* 1.0**North Central 614 568 2.4 2.3 1.1 1.0 2.4** 1.9** †Central 569 543 2.5 2.3 1.1 1.1 2.4* 2.1* 1.0**South Central-East 486 484 2.1 1.9 1.5 1.7* 2.9** 3.2** 4.0**
State 556 526 2.4 2.2 1.2 1.2 2.3 2.2 1.7**† No response* Less than 25 observations used to calculate.** Less than 15 observations used to calculate.
Table 46. When the percentage of total wheat acres to be grazed-out were determined (%).
Region Prior To At End of At During Other Planting Fall-winter Grazing Planting Fall-winter Grazing Season
Panhandle 38 21 8 25 8West central 32 11 10 46 3Southwest 35 14 12 33 6North Central 29 17 10 40 4Central 47 10 6 36 1South Central-East 55 9 9 22 6
State 39 13 9 35 4
30

Tab
le 4
7. F
ac
tors
tha
t infl
uenc
ed
the
de
cis
ion
of n
umb
er o
f ac
res
to b
e g
raze
d-o
ut e
ac
h ye
ar (
%).
C
att
le
Wh
ea
t A
vaila
ble
La
ck
of
Ha
il o
r C
he
at
Cro
p
Inc
om
e
Oth
er
p
rice
s p
rice
s c
ap
ital t
o
mo
istu
re
hig
h
ro
tatio
n
fro
m
p
urc
ha
se
w
ind
s
p
ast
ure
ca
ttle
le
asin
g
Re
gio
n
#1
#2
#3
#1
#2
#3
#1
#2
#3
#1
#2
#3
#1
#2
#3
#1
#2
#3
#1
#2
#3
#1
#2
#3
#1
#2
#3
Pan
ha
nd
le
22*
30*
7*
32
35
14
2 2
10
16
13
31
0 0
5 6
6 14
12
6
14
8 6
2 2
4 2
We
st C
en
tra
l 22
32
19
56
28
7
0 4
5 3
3 11
0
0 0
9 12
29
0
6 17
5
11
4 4
4 8
Sou
thw
est
30
32
11
43
37
8
0 1
12
9 11
26
0
0 1
4 7
22
7 5
12
3 3
5 5
3 3
No
rth
Ce
ntr
al
23
30
13
34
36
20
0 0
2 1
1 8
0 1
0 23
14
35
8
9 13
6
8 3
6 1
5C
en
tra
l 38
29
15
31
31
18
1
8 12
5
11
10
0 1
1 8
16
22
6 1
12
3 0
3 9
2 6
Sou
th C
en
tra
l-Ea
st
37
22
18
25
29
16
4 5
16
9 20
9
0 2
0 1
9 18
5
3 16
0
9 5
18
2 2
Sta
te
29
30
14
38
33
13
1 3
9 7
9 16
0
1 1
9 11
24
6
5 14
4
6 4
8 3
5*
Exa
mp
le: C
att
le p
rice
s re
ce
ive
d 2
2% o
f all
nu
mb
er o
ne
co
un
ts (
mo
st im
po
rta
nt)
, 30%
of a
ll n
um
be
r tw
o c
ou
nts
an
d 7
% o
f all
nu
mb
er t
hre
e c
ou
nts
in t
he
Pa
nh
an
dle
reg
ion
.
Tab
le 4
8. L
ea
se a
gre
em
ent
s fo
r fa
ll-w
inte
r whe
at p
ast
ure
gra
zing
.
Re
gio
n
Live
sto
ck
Wh
ea
t Bo
th
Ora
l W
ritte
n
Ave
rag
e
On
e-y
ea
r M
ulti
-ye
ar
Ave
rag
e y
ea
r of
O
wn
er
Pro
du
ce
r %
Le
ase
Le
ase
A
cre
s Le
ase
Le
ase
M
ulti
-ye
ar
%
%
%
%
%
%
Le
ase
Pan
ha
nd
le
35*
50*
15*
96
4 43
2 35
65
9.
23W
est
Ce
ntr
al
21
68
12
90
10
259
41
59
6.64
Sou
thw
est
24
67
9
83
17
321
28
72
8.00
No
rth
Ce
ntr
al
26
62
12
89
11
325
52
48
8.25
Ce
ntr
al
46
42
13
91
9 21
2 44
56
5.
60So
uth
Ce
ntr
al-E
ast
30
50
20
91
9
297
21
79
6.87
Sta
te
29
58
13
90
10
303
38
63
7.42
* E
xam
ple
: In
th
e P
an
ha
nd
le re
gio
n, 3
5% o
f th
e re
spo
nd
en
ts w
ere
th
e li
vest
oc
k o
wn
er,
50%
we
re t
he
wh
ea
t p
rod
uc
er a
nd
15%
we
re b
oth
.
Tab
le 4
9. A
vera
ge
whe
at p
ast
ure
rent
al p
rice
for f
all-
win
ter g
razi
ng.
Re
gio
n
Ob
serv
atio
ns
$/a
cre
/ O
bse
rva
tion
s $/
cw
t/
Ob
serv
atio
ns
$/lb
of
Ob
serv
atio
ns
$/h
ea
d/
yea
r
mo
nth
ga
in
m
on
th
Pan
ha
nd
le
1 60
15
2.
58
13
0.32
1
10.0
0W
est
Ce
ntr
al
0 †
18
2.77
15
0.
32
5 10
.00
Sou
thw
est
0
† 8
2.44
20
0.
31
2 12
.98
No
rth
Ce
ntr
al
0 †
24
2.91
7
0.32
2
13.5
0C
en
tra
l 2
27
9 2.
72
11
0.33
1
15.0
0So
uth
Ce
ntr
al-E
ast
3
18
4 2.
88
10
0.32
1
10.0
0
Sta
te
6 28
78
2.
74
76
0.32
12
11
.50
† N
o R
esp
on
se.
31
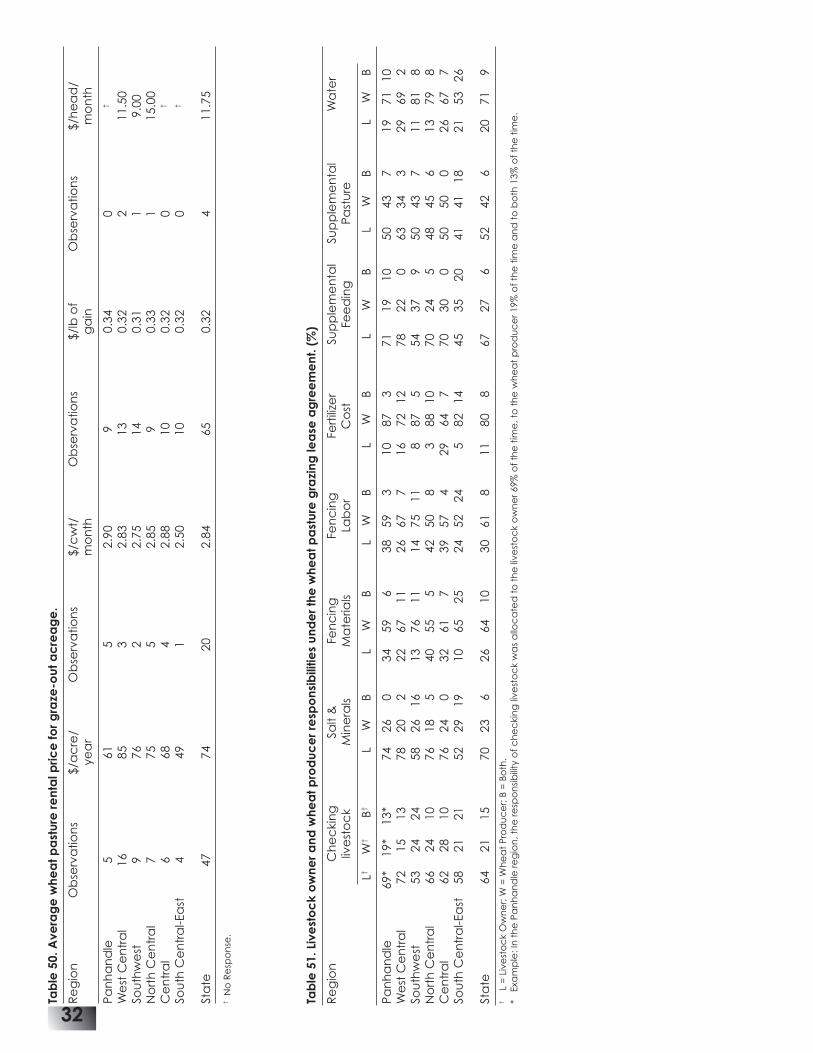
Tab
le 5
0. A
vera
ge
whe
at p
ast
ure
rent
al p
rice
for g
raze
-out
ac
rea
ge
.
Re
gio
n
Ob
serv
atio
ns
$/a
cre
/ O
bse
rva
tion
s $/
cw
t/
Ob
serv
atio
ns
$/lb
of
Ob
serv
atio
ns
$/h
ea
d/
yea
r
mo
nth
ga
in
m
on
th
Pan
ha
nd
le
5 61
5
2.90
9
0.34
0
†
We
st C
en
tra
l 16
85
3
2.83
13
0.
32
2 11
.50
Sou
thw
est
9
76
2 2.
75
14
0.31
1
9.00
No
rth
Ce
ntr
al
7 75
5
2.85
9
0.33
1
15.0
0C
en
tra
l 6
68
4 2.
88
10
0.32
0
†
Sou
th C
en
tra
l-Ea
st
4 49
1
2.50
10
0.
32
0 †
Sta
te
47
74
20
2.84
65
0.
32
4 11
.75
† N
o R
esp
on
se.
Tab
le 5
1. L
ive
sto
ck
ow
ner a
nd w
hea
t pro
duc
er r
esp
ons
ibili
ties
und
er t
he w
hea
t pa
stur
e g
razi
ng le
ase
ag
ree
me
nt. (
%)
Re
gio
n
Ch
ec
kin
g
Salt
&
Fen
cin
g
Fen
cin
g
Fert
ilize
r Su
pp
lem
en
tal
Sup
ple
me
nta
l W
ate
r
live
sto
ck
Min
era
ls M
ate
rials
Lab
or
Co
st
Fee
din
g
Past
ure
L†
W†
B† L
W
B L
W
B L
W
B L
W
B L
W
B L
W
B L
W
B
Pan
ha
nd
le
69*
19*
13*
74
26
0 34
59
6
38
59
3 10
87
3
71
19
10
50
43
7 19
71
10
We
st C
en
tra
l 72
15
13
78
20
2
22
67
11
26
67
7 16
72
12
78
22
0
63
34
3 29
69
2
Sou
thw
est
53
24
24
58
26
16
13
76
11
14
75
11
8
87
5 54
37
9
50
43
7 11
81
8
No
rth
Ce
ntr
al
66
24
10
76
18
5 40
55
5
42
50
8 3
88
10
70
24
5 48
45
6
13
79
8C
en
tra
l 62
28
10
76
24
0
32
61
7 39
57
4
29
64
7 70
30
0
50
50
0 26
67
7
Sou
th C
en
tra
l-Ea
st
58
21
21
52
29
19
10
65
25
24
52
24
5 82
14
45
35
20
41
41
18
21
53
26
Sta
te
64
21
15
70
23
6 26
64
10
30
61
8
11
80
8 67
27
6
52
42
6 20
71
9
†
L =
Liv
est
oc
k O
wn
er;
W =
Wh
ea
t Pr
od
uc
er;
B =
Bo
th.
* E
xam
ple
: In
th
e P
an
ha
nd
le re
gio
n, t
he
resp
on
sibili
ty o
f ch
ec
kin
g li
vest
oc
k w
as
allo
ca
ted
to
th
e li
vest
oc
k o
wn
er 6
9% o
f th
e t
ime
, to
th
e w
he
at
pro
du
ce
r 19%
of t
he
tim
e a
nd
to
bo
th 1
3% o
f th
e t
ime
.
32

AppendixAppendix
33

34

35

36
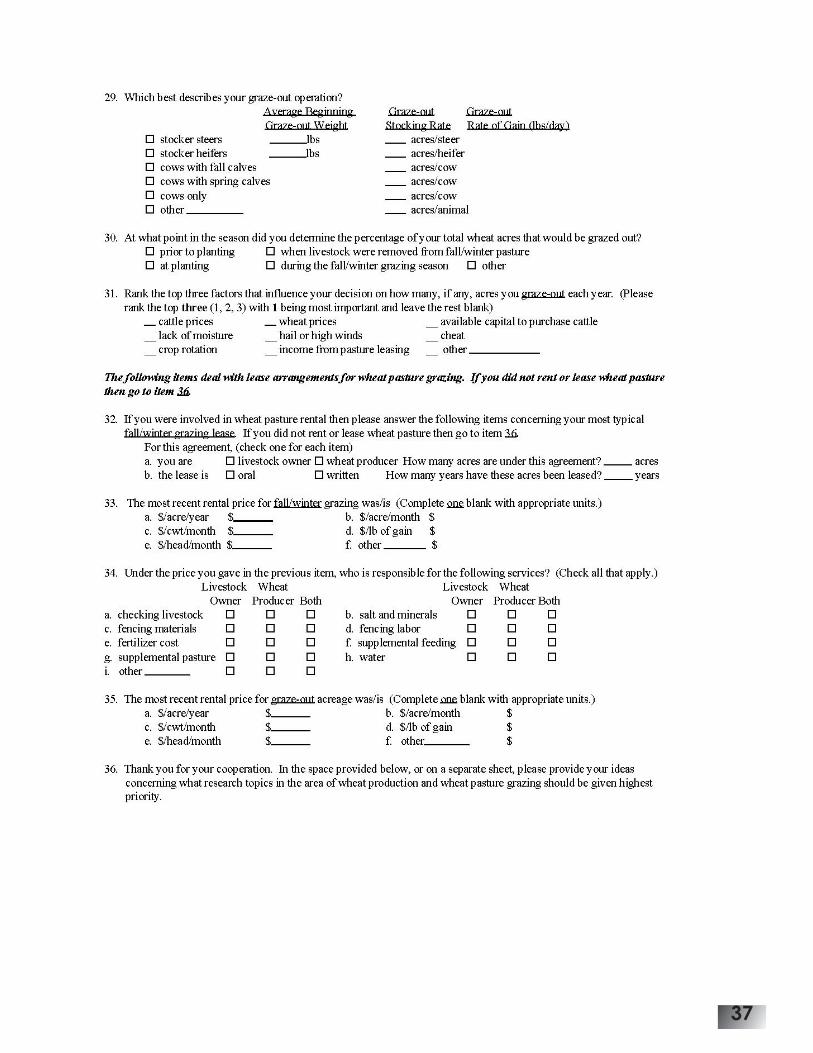
37

Oklahoma State University Oklahoma Agricultural StatisticsDept of Ag Economics PO Box 528804Stillwater OK 74078 Oklahoma City OK 73152
Dear Operator:
Last week you were mailed a questionnaire seeking information regarding wheat pasture grazing practices. Your name was selected at random from among all livestock producers in the state. The information you provide will be kept absolutely confidential and aid in research programs at O.S.U.
If you have already completed the questionnaire and returned it to us, please accept our thanks. If you have not completed the questionnaire, please take a few minutes and do so today.
Sincerely yours,
Francis M. Epplin, Professor Barry L. BloydAgricultural Economics Department State Statistician405-744-7126 405-522-6190
38

