wheat milling and baking report · report on previous studies conducted in south africa on the...
TRANSCRIPT

i
DETERMINING THE FACTORS THAT LIMIT AGRO-PROCESSING DEVELOPMENT IN THE WHEAT MILLING AND BAKING INDUSTRIES IN RURAL AREAS IN SOUTH AFRICA
By André Louw, Mariëtte Geyser & Jacques Schoeman
ii
Disclaimer
“Information contained in this document results from research funded wholly or in part by the NAMC acting in
good faith. Opinions and points of view expressed herein do not necessarily reflect the official position or
policies of the NAMC. The NAMC makes no claims, promises, or guarantees about the accuracy,
completeness, or adequacy of the contents of this document and expressly disclaims liability for errors and
omissions in the contents hereof. No warranty of any kind, implied, expressed, or statutory, including but not
limited to the warranties of non-infringement of third party rights, title, merchantability, fitness for a particular
purpose or freedom from computer virus, is given with respect to the contents of this document in hardcopy,
electronic format or electronic links to such. Reference made to any specific product, process, service by trade
name, trade mark, manufacturer or any other commercial commodity or entity are presented for informational
purposes only and do not constitute or imply approval, endorsement or favouring by the NAMC.”

iii
NATIONAL AGRICULTURAL MARKETING COUNCIL
DETERMINING THE FACTORS THAT LIMIT AGRO-PROCESSING DEVELOPMENT IN THE WHEAT MILLING AND BAKING INDUSTRIES IN
RURAL AREAS IN SOUTH AFRICA
NAMC Report by
Andre Louw , Mariëtte Geyser & Gerhard Troskie
August 2010
Department of Agricultural Economics, Extension, and Rural Development
Absa Chair in Agribusiness
Faculty of Natural and Agricultural Sciences
University of Pretoria

iv
Sectional inputs were contributed
by
Melissa van der Merwe
Richard Nicholson
Nico Scheltema
Almarie Nordier
Special appreciation for inputs from the following organisational in the respective industries
Jannie de Villiers, CEO of the National Chamber of Milling
All individual bakers and millers who participated
and
Andre van der Vyver (Dr), Director of UT Grain Management (Pty) Ltd
&
Senior Lecturer at the University of Pretoria

v
TABLE OF CONTENTS LIST OF FIGURES ...................................................................................................................................vii LIST OF TABLES ......................................................................................................................................ix EXECUTIVE SUMMARY ........................................................................................................................... x CHAPTER 1 STUDY OBJECTIVES, DATA COLLECTIONS AND METHODOLOGIES .......................... 1 1.1 STUDY OBJECTIVES .................................................................................................................. 1 1.2 DATA COLLECTION .................................................................................................................... 2 1.3 METHODOLOGIES USED BY THE STUDY ................................................................................ 3 1.3.1 STRUCTURE, CONDUCT AND PERFORMANCE FRAMEWORK ....................................... 3 1.3.2 PRICE VOLATILITY .............................................................................................................. 5 1.3.3 RISK MANAGEMENT ANALYSIS ......................................................................................... 6
CHAPTER 2 WHEAT LITERATURE REVIEW ......................................................................................... 8 2.1 INTERNATIONAL LITERATURE STUDY .................................................................................... 8 2.2 SOUTHERN AFRICAN DEVELOPMENT COMMUNITY (SADC) .............................................. 13 2.3 SOUTH AFRICA LITERATURE REVIEW .................................................................................. 13 2.4 CONCLUSIONS ......................................................................................................................... 26 Chapter 3 MARKET OVERVIEW .........................................................................................................27 3.1 GLOBAL WHEAT OVERVIEW .................................................................................................. 27 3.1.1 STOCK LEVELS .................................................................................................................. 28 3.1.2 PRODUCTION LEVELS ...................................................................................................... 29 3.1.3 CONSUMPTION LEVELS ................................................................................................... 32 3.1.4 INTERNATIONAL TRADE ................................................................................................... 33 3.1.5 PRICE AND PRICE CYCLES .............................................................................................. 38 3.1.6 THE WHEAT MILLING INDUSTRY ..................................................................................... 40 3.1.7 CURRENT ISSUES AND CHALLENGES ........................................................................... 41
3.2 SOUTHERN AFRICAN DEVELOPMENT COMMUNITY (SADC) OVERVIEW .......................... 43 3.2.1 PRODUCTION LEVELS ...................................................................................................... 43 3.2.2 CONSUMPTION LEVELS ................................................................................................... 44 3.2.3 STOCK LEVELS .................................................................................................................. 44 3.2.4 IMPORT AND EXPORT LEVELS ........................................................................................ 45 3.2.5 PRICES AND PRICE CYCLES ............................................................................................ 47 3.2.6 FOOD SECURITY ................................................................................................................ 48 3.2.7 CURRENT CHALLENGES AND ISSUES ........................................................................... 50 3.2.8 MILLING INDUSTRY ........................................................................................................... 50
3.3 SOUTH AFRICAN OVERVIEW .................................................................................................. 51 3.3.1 STOCK LEVELS .................................................................................................................. 51 3.3.2 PRODUCTION LEVELS ...................................................................................................... 52 3.3.3 CONSUMPTION LEVELS ................................................................................................... 57 3.3.4 IMPORT AND EXPORT LEVELS ........................................................................................ 59 3.3.5 PRICE VOLATILITY ............................................................................................................ 66 3.3.6 RELATIONSHIP BETWEEN PRICE VOLATILITY AND RISK ............................................ 69 3.3.7 PRICE AND PRICE CYCLES .............................................................................................. 72 3.3.8 THE SOUTH AFRICAN WHEAT SUPPLY CHAIN .............................................................. 74 3.3.9 FOOD SECURITY ................................................................................................................ 79 3.3.10 MILLING AND BAKING INDUSTRY ................................................................................... 80
3.4 PORTER ANALYSIS OF THE WHEAT PROCESSING INDUSTRY .......................................... 83 3.5 CURRENT GLOBAL CHALLENGES FACED BY THE WHEAT INDUSTRY ............................ 88 3.6 CURRENT ISSUES IN THE GLOBAL WHEAT INDUSTRY ...................................................... 93 3.7 BUSINESS MODELS OF THE FUTURE .................................................................................... 94 3.8 THE ROLE OF THE COMPETITION COMMISSION ............................................................... 100 CHAPTER 4 DATA ANALYSIS AND RESULTS ...................................................................................102

vi
4.1 INTRODUCTION ...................................................................................................................... 102 4.2 STRUCTURE OF THE INTERVIEWS ...................................................................................... 102 4.2.1 STRUCTURE OF WHEAT MILLERS INTERVIEWED ....................................................... 102 4.2.2 STRUCTURE OF BAKERS INTERVIEWED ..................................................................... 104
4.3 CONDUCT OF WHEAT MILLERS AND BAKERS INTERVIEWED ......................................... 106 4.3.1 INTRODUCTION ................................................................................................................ 106 4.3.2 LEVEL OF COMPETITION IN WHEAT MILLING AND BAKING ...................................... 106 4.3.3 STRENGTHS, WEAKNESSES, OPPORTUNITIES AND THREATS (SWOT) ....................... ANALYSIS ......................................................................................................................... 109 4.3.4 CRITICAL AREAS OF A WHEAT MILLING AND BAKING BUSINESS ........................... 117 4.3.5 THE KEY ISSUES/ CONSTRAINTS/ CHALLENGES CURRENTLY BEING EXPERIENCED
BY WHEAT MILLERS AND BAKERS ............................................................................... 120 4.3.6 BARRIERS TO ENTRY AND EXIT OF WHEAT MILLERS AND BAKERS ...................... 122 4.3.7 PROCUREMENT DECISION ............................................................................................. 125 4.3.8 IMPORTS, EXPORTS OF WHEAT PRODUCTS ............................................................... 128 4.3.9 RISK MANAGEMENT ........................................................................................................ 129 4.3.10 LEGAL FRAMEWORK IMPACTING THE WHEAT MILLING AND ........................................ BAKING INDUSTRY .......................................................................................................... 135 4.3.11 SUPPORT STRUCTURES OF THE GOVERNMENT AND DTI ........................................ 138
4.4 PERFORMANCE OF WHEAT MILLERS AND BAKERS ........................................................ 138 4.4.1 FINANCIAL PERFORMANCE OF WHEAT MILLERS AND BAKERS .............................. 138 4.4.2 THE IMPACT OF INCREASES IN INPUT COSTS ON WHEAT MILLERS AND BAKERS140
REFERENCES: ......................................................................................................................................149

vii
LIST OF FIGURES
Figure 1: An illustration of the S-C-P paradigm ........................................................................................... 4 Figure 2: Deterministic S-C-P mode ............................................................................................................ 5 Figure 3: Dynamic S-C-P model .................................................................................................................. 5 Figure 4: Graphical representation of the risk management process. ......................................................... 7 Figure 5: Industries that are easy to enter but difficult to exit. .....................................................................10 Figure 6: Industries that are difficult to enter and easy to exit. ....................................................................11 Figure 7: Industries that are easy to enter and easy to exit. .......................................................................11 Figure 8: Industries that are difficult to enter and difficult to exit. ................................................................12 Figure 9: Wheat industry value chain .........................................................................................................15 Figure 10: Annual wheat milled in tons .........................................................................................................17 Figure 11: Market share of top wheat milling companies ..............................................................................19 Figure 12: Porters five forces for the milling industry as identified by the IDC (2010) ...................................26 Figure 13: World wheat ending stocks, 1960-2010 .......................................................................................28 Figure 14: Top five International Wheat Producing Areas based on acreage produced (2010) ....................29 Figure 15: Top five International Wheat Producing Areas based on bushels produced (2010) ....................30 Figure 16: Global Wheat Yields from 1960 to 2009 ......................................................................................31 Figure 17: US Wheat Production from 1960 to 2010 ....................................................................................31 Figure 18: Global Feed Usage in Million Metric tons from 1960 to 2010 ......................................................32 Figure 19: Domestic Usage of Global Wheat from 1960 to 2010 ..................................................................33 Figure 20: Top ten world wheat importers in percentage in 2008/2009 ........................................................34 Figure 21: World Wheat Exports (million bu) from 1960 to 2010 ..................................................................36 Figure 22: Market share of major wheat exporters (1991/92 – 2008/2009) ..................................................37 Figure 23: World wheat trade and US exports from 1991 to 2010 ................................................................38 Figure 24: International FOB US hard red wheat and Argentinean wheat prices from 04/01/2008 to
16/04/2010 ..................................................................................................................................39 Figure 25: Wheat milling process .................................................................................................................40 Figure 26: Section through a grain of wheat .................................................................................................41 Figure 27: Total SADC Wheat production from 1990 to 2009 .......................................................................43 Figure 28: Total SADC consumption from 1990 to 2009 ..............................................................................44 Figure 29: Wheat Grain Prices on the South African Futures Exchange (SAFEX) .......................................47 Figure 30: Import and Export Parity levels for South Africa from 2000 to 2010 ............................................48 Figure 31: South African Wheat, flour and bread prices ...............................................................................49 Figure 32: The contribution of each province in RSA to area wheat planted ................................................53 Figure 33: The contribution of each province in South Africa to wheat production .......................................54 Figure 34: The total area planted for wheat in RSA, the total production and average yield per hectare for
the period of 1990 to 2010 * ........................................................................................................56 Figure 35: Wheat production and utilisation in South Africa for 2006 to 2014 ..............................................58 Figure 36: Wheat consumption for South Africa (2001 – 2010*) ...................................................................59 Figure 37: Wheat imports and exports of South Africa for 2006 – 2014 .......................................................60 Figure 38: Wheat SAFEX price with import and export parities at Randfontein from 2000 to 2010 ..............65 Figure 39: Wheat spot prices, Jan 2008-May 2010 ......................................................................................67 Figure 40: A model of the principal causes of the crisis ................................................................................69 Figure 41: Producer price of wheat 1991 – 2010 ..........................................................................................73 Figure 42: SAFEX prices of wheat from May 2009 to March 2010 ...............................................................74 Figure 43: The Wheat industry value chain ..................................................................................................76 Figure 44: The market value chain of wheat .................................................................................................81 Figure 45: Porter’s 5 forces model of competition ........................................................................................83 Figure 46: Porter’s diamond .........................................................................................................................86 Figure 47: Business Model Template ...........................................................................................................94 Figure 48: Years of experience of wheat millers .........................................................................................103 Figure 49: Size and scale of wheat millers interviewed ..............................................................................103
viii
Figure 50: Years of experience of bakers interviewed ................................................................................105 Figure 51: Scale and size of the bakers interviewed ..................................................................................105 Figure 52: The level of competition perceived by wheat millers and bakers interviewed ............................107 Figure 53: Perceived competition with large scale wheat millers and bakers .............................................108 Figure 54: The impact of input price volatility on the profitability of raw materials. .....................................126 Figure 55: Procurement done on contractual basis ....................................................................................127 Figure 56: The impact of imports and exports on the wheat milling and baking industries .........................128 Figure 57: The perception of turnover over the past five years ...................................................................139 Figure 58: The perceived impact of increases in input costs on milling and baking businesses .................140

ix
LIST OF TABLES
Table 1: SA Millers’ strengths, weaknesses, opportunities and threats .........................................................22 Table 2: The IDC (2010) SWOT analysis for millers in South Africa. .............................................................25 Table 3: Wheat world estimates for the period 2005/06 to 2009/10 ...............................................................28 Table 4: Regional Wheat Imports from 2005 to 2009 and forecasted up to 2011. .........................................35 Table 5: SADC Wheat Imports and Exports Progress ...................................................................................46 Table 6: The progressive wheat stock levels from February 2009 to February 2010 in ‘000 ton ...................52 Table 7: Average yield (t/ha) of wheat in the RSA per region over 2009/2010* period ..................................55 Table 8: Import parity of wheat (VAT excluded) on 18 March 2010 ...............................................................62 Table 9: Export parity of wheat on 18 March 2010 ........................................................................................65 Table 10: Historical volatility of the wheat contract traded on CME (percentage) .......................................70 Table 11: Historical volatility of the wheat contract traded on SAFEX (percentage) ....................................71 Table 12: Share trends of the various nodes in the retail price of bread .....................................................78 Table 13: Monthly wheat milling in tons .......................................................................................................82 Table 14: The strength areas of the wheat millers and bakers businesses as interviewed. ......................110 Table 15: The weak areas of the wheat millers and bakers businesses as interviewed ............................112 Table 16: Wheat milling and baking opportunities as identified by the interviewees .................................115 Table 17: Threats in the wheat milling and baking industries ....................................................................116 Table 18: The critical areas of a wheat milling and baking business as identified by the interviewees......117 Table 19: The ten most important issues/constraints/challenges currently being experienced by wheat
millers and bakers. ....................................................................................................................120 Table 20: Barriers to entry for the wheat milling and baking industries. ....................................................123 Table 21: Risks at a Macro level ...............................................................................................................129 Table 22: Risks at micro level ....................................................................................................................132 Table 23: Legal framework of the wheat milling and baking industry ........................................................135

x
EXECUTIVE SUMMARY
The main purpose of the study was to identify factors that restrict development in the wheat milling and baking
industry in rural areas of South Africa. In order to conduct a study that adds value to stake-holders within these
industries, various objectives were identified. These objectives served as guidelines in identifying factors that
restrict development in these industries. An effort was made to as far as possible; discuss these objectives
and the results obtained from the study. The objectives of the study therefore can be summarised as follows:
1. Report on previous studies conducted in South Africa on the wheat milling and agro-processing industry.
2. Analyse the wheat supply chain to understand the shorter and longer term issues in the sub-sector that
influence the effective establishment of agro-processing industries in rural areas.
3. To unpack the governance/business models of successful smaller mills; looking specifically at
contractual arrangements, hedging, infrastructure, and marketing strategies.
4. Identify the critical success factors of the current wheat millers.
5. Analyse the barriers to entry and barriers to exit.
6. Determine the impact of imports and exports of raw materials as well as the manufactured products.
7. Determine the impact of input price volatility on the profit margins of the smaller commercial mills
8. Identify the use of any risk mitigation strategies such as hedging, storage and branding applied by the
smaller commercial mills.
9. Identify factors that restrict and/or enhance the competitiveness and profitability of smaller commercial
mills.
10. Analyse whether the current support measures provided by the DTI are applicable to the agro-
processing sector and to make recommendations on how such support measures can be adapted if
needed.
11. Establish protocols within support structures that can assist in the development and sustainability of
agro-processing industries in rural areas.
12. Make recommendations on key issues identified in the study.
From the outset of the study it was eminent that finding wheat millers and bakers who were willing to take part
in the study and if they could provide the study with accurate data would be difficult and of concern. Originally,
the study was bound to the geographical areas of the North West and Free State provinces. However, due to
the investigation by the Competition Commission and the industries unwillingness to share information, the
study was forced to go beyond these boundaries. The problem of information sharing within these industries
was also of a concern for the Department of Health. In a study by the Department of Health (2007), where it
was mentioned that finding small millers was difficult as the small scale millers did not want to be found, and

xi
did not want to talk to strangers towards whom they showed a level of distrust. After all of this, it is important to
note that in total 15 wheat millers and bakers were found that were willing to be interviewed and would provide
information relevant to the study.. Geographically, the millers and bakers interviewed are situated in Western
Cape, Eastern Cape, Pretoria, North West and Free State. Out of the total interviews conducted, 10 were
wheat millers and the remaining five were bakers. As far as possible, the study captured the voice of small,
medium and large scale wheat millers and bakers.
1. Report on previous studies conducted on the wheat milling and agro-processing industry (pages
8 – 26).
One of the first objectives of the study was to report on previous studies conducted on the wheat milling and
agro-processing industry. The main purpose of a literature review is to provide a foundation on which the study
can be conducted. It also ensures that the proposed study expands on the existing body of knowledge within
the wheat industry. The literature review section was divided into an International, Southern African
Development Community (SADC) and South African section. For abbreviation purposes, the literature review
conducted on South Africa formed an essential basis from which the study was conducted as it directly
affected the environment in which the study was conducted.
In the South African literature review section it is worth noting the studies by the Food Pricing Monitoring
Committee (FPMC) (2003) and the Industrial Development Corporation (IDC) (2010). The FPMC (2003) study
analysed the wheat-to-bread value chain, while also indicating the level of concentration within the wheat
milling and baking industries. The wheat-to-bread value chain as well as the level of concentration particularly
played an important role in the objectives of the study in identifying factors that restricts development.
The IDC (2010) study main purposes was to provide a strategic overview of the grain milling industry in South
Africa, while also indicating some of the main features and key performance trends. The study more
importantly identified certain investment opportunities for the benefit of existing as well as emerging millers.
Barriers to growth, key challenges facing the milling industry, a SWOT analysis as well as the market structure
was analysed and identified by the IDC (2010) study. The IDC (2010) study concluded that the greatest
challenge facing South Africa is the attainment of food security. This is underpinned by high population growth,
high levels of poverty, logistics costs and heavy reliance on a few staple foods. The demand for wheat as a
staple food is likely to be sustained for many decades to come. The milling industry will always play a vital role
in addressing food security problems, provided that issues such as transportation and power supply are
addressed and that the industry’s competitiveness is maintained or enhanced.

xii
After a thorough and detailed review of the available literature review, a conclusion was made that the study
needed to identify factors that restrict development in the wheat milling and baking industries which will
expand on the existing body of knowledge and that the study will make a valuable contribution to all stake-
holders involved within the industries.
A detailed market overview followed the literature review section. The main purpose of the market overview
section was to identify current trends as far as stock levels, production levels, consumption levels and
international trade are concerned. The market overview section was divided into a global, SADC and South
African scale. For the purposes of the executive summary, only the South African wheat overview will be
summarised as this is the environment in which the study was conducted.
The total hectares of wheat production decreased from the 2008/2009 to 2009/2010* production season, this
is a decrease of 14 percent. The two main production regions in South Africa are the Western Cape and Free
State provinces, representing 47 percent and 36 percent of the total hectares planted in South Africa
respectively. Total production in South Africa therefore decreased by 10 percent from 2008/2009 to
2009/2010* production period.
As far as consumption levels in South Africa was concerned. Consumption is divided into human consumption,
feed consumption and wheat that is used as seeds for plantings. Consumption of wheat stayed stable over the
past two years as the local economy recovered from the world-wide recession. As far as imports and exports
are were concerned, South Africa is a net importer of wheat. The reason for this is that the South African
wheat prices are trading at import parity levels, making it more economical to import wheat products than to
procure from within the South African borders. The only solution for this is to increase import tariffs. This would
shift the import parity level upwards, protecting local production against imports.
2. An analysis of the wheat supply chain (pages 72 – 77)
The South African wheat supply chain was also analysed in the South African market overview. A detailed
analysis of the wheat supply chain was one of the objectives of the study. An analysis of the wheat supply
chain will aid in understanding the long and short term issues in the sub-sectors of the industries. The figure
below represents the wheat supply chain in South Africa.

xiii
Figure: The South African wheat supply chain
Source: NAMC, 2009
From the figure above, the process of adding value in the wheat industry is clear and obvious. However, one
of the issues identified by the study that restricts development lies in the research and development linkage. In
order for an industry to grow and expand, investment must be made in research and development. However,
at present research within the industry is laborious and difficult following the industry’s unwillingness in sharing
information. All parties and stake-holders must be willing to share information available without them having to
fear prosecution.
3. Identify business models of the future (pages 92 – 98)
One of the objectives of the study was also to identify business models of the future, which current wheat
millers and bakers must follow in order to be successful. The wheat milling industry and all stake-holders need
to be able to engage successfully in the rapidly changing current and future business and market environment.
Management of wheat millers and bakers should focus on customers, value propositions and resources &

xiv
capabilities. The development of business models for the future should focus on the customer with the
environment and sustainability as the core for decision-making and strategy, according to the IIED (2009).
Agriculture and agribusinesses today faces huge challenges. Cooperation and co-creation of new knowledge
markets is essential in the debates concerning the future of agribusiness, agriculture and the environment.
Most issues require involvement not only from the business community and knowledge institutions, but also
different levels of government and a diverse set of societal organizations. The business model of the future
therefore, will have to pragmatic and focus on sustainability, climate change, emerging farmers and markets,
technology, systemic risks and the balance of power. Wheat farmers, wheat millers and the industry as a
whole can develop an acceptable business model to focus not only on the current market environment but also
to create value to customers in the future.
After a detailed overview of the current wheat markets and business models of the future, the results of the
study were presented. As mentioned earlier, in total 15 wheat millers and bakers were interviewed of which 10
were wheat millers and five were bakers. An effort was made to, as far as possible, capture the voice and
opinions of small, medium and large scale wheat millers and bakers. The average wheat miller interviewed has
less than ten years of experience, mills on a small scale and has a total capital investment in machineries,
buildings and vehicles of between R1 million and R2 million. On the other hand, the average baker interviewed
falls between two brackets, the first one being less than 10 years and the second bracket between 11 and 20
years of experience and bakes on small scale. For the purposes of the study, this average miller and baker will
give valuable insight into the objective of the study to identify factors that limit development in the milling and
baking industries.
4. Identify the critical success factors of the current wheat millers and bakers (pages 116 – 119).
By identifying the critical success factors of current wheat millers and bakers, valuable insight was obtained on
what an emerging wheat miller and baker must do in order to be as successful as possible. From the outset of
the study, emphasis was placed on these factors as it would make a valuable contribution to the objectives of
the study. The critical areas of the business represent the areas of the business that must be effectively
managed in order to secure the successfulness of the wheat milling or baking business.
One of the most crucial areas of a wheat milling and baking business is to identify an end market / consumer.
Respondents indicated that before one can start operations, questions on who the final consumer will be, in
what geographical area the product be sold, what distribution channel would be used etc. need to be
answered. Identifying the target market was the first crucial step in setting up the business for success. Cash

xv
flow management was also indicated as a serious area of a business. The overall success of the business was
dependant on the effective management of cash flow as procurement is mainly done on a cash basis and slow
payments also becomes a problem. In order to be successful, wheat millers and baker also indicated that
knowledge and experience on a management level is essential. Knowledge and experience refers to overall
management of the business and the techniques of milling and baking.
Other areas of the business that are crucial to the overall success of the business included, an effective cost
management strategy, procurement management, obtaining and managing the necessary capital, high quality
service delivery, management of labour, applying the correct wheat gristing techniques and a well directed
marketing campaign.
5. Analyse the barriers to entry and exit (pages 122 – 125)
After a detailed discussion on the critical areas of current wheat millers and bakers, identifying the barriers to
entry and barriers to exit of the industries followed. This objective of the study formed the cornerstone of the
study as it gave more detail on factors that restricts development in the wheat milling and baking industries.
The wheat milling and baking industries is described as industries with relatively high barriers to entry. This
statement is supported by the fact that a low number of new wheat millers and bakers have entered the
industries in recent times (National Chamber of Milling, 2010). The study made an effort to identify these
barriers to enter and exit.
The first barrier identified lies in obtaining the necessary capital requirements to start up operations. Milling
wheat requires significantly more capital investment than milling maize. Capital requirements therefore have
an even larger impact on the wheat milling industry than the maize milling industry. Establishing a market was
also indicated as a potential barrier to entry. A prospective wheat miller and baker must exploit a new market
opportunity or product development as the wheat milling and baking is a competitive environment with
dominating large scale millers and bakers. However, wheat millers and bakers indicated that there is space in
the rural areas to increase the wheat milling and baking capacity.
Other barriers to entry that wheat millers and bakers identified include the knowledge of the wheat milling and
baking industries, business skills (business knowledge on logistics), well maintained infrastructure, marketing
management knowledge, the necessary cash flow, the location of the business and obtaining a highly skilled
labour force. On the notion of obtaining a skilled labour force the National Chamber of Milling expressed their
disappointment on the level to which government training authorities was involved in the facilitating and
xvi
training in the food and beverage manufacturing sector. They are of the opinion that much more needs to be
done (National Chamber of Milling, 2010).
In terms of barriers to exit, all the respondents indicated that the only barrier to exit that exists in the wheat
milling and baking industry is the ability to sell the machinery at a price that is acceptable for the owner of the
machinery. If the wheat mill owner or bakery wants to stop operations, a willing buyer of the assets is required.
This is sometimes a difficult task in that new market entrants are hard to come by. The industry does not have
willing new market entrants that want to start milling and baking operations. It is therefore perceived that
finding a suitable buyer for your assets is a tedious task and could potential restrict the wheat miller or baker
from exiting the market.
6. Determine the impact of imports and exports of raw materials as well as the manufactured
products (pages 128 – 129).
Imports and exports of raw materials as well as manufactured products have an impact on the wheat milling
and baking industry, especially imports of raw materials. One of the objectives of the study was to determine
the severity of the impact and to report thereon.
From the outset of the study, respondents indicated that imports of raw materials have an impact on the
industries. This impact of imports on their business was indicated as indirect, as they feel that they are more
exposed to imports of wheat products from international competitors. The biggest reason given for this impact
came in the form of imports of wheat grain. Some of the respondents indicated that they feel the imports of
wheat impacts on their business in a negative way as the imported wheat did not meet acceptable baking
quality and standards. Local wheat production therefore must be supported and protected by either increasing
the import tariff or supporting local production of wheat through grants.
Exports also have an impact on the industry. Out of all the respondents, 17 percent indicated that this impact
on their business is very low. They indicated that they would export their final products should the opportunity
present itself but emphasised that exporting was not their core business. They would rather concentrate on
local markets and expand where possible.
From the above it is notable that imports and exports play a very small role in the daily operations of the
smaller wheat milling and baking industries. Therefore local production of wheat must be supported and
enhanced to minimise the imports of wheat grain.

xvii
7. Determine the impact of input price volatility on the profit margins of the smaller commercial
mills (page 125 – 127) and
8. The use of risk mitigating strategies by smaller scale wheat millers and baker (pages 125 – 127)
One of the most important raw materials a wheat miller buys is wheat grain and in the case of the baker, the
procurement of flour. Wheat price volatility therefore can have a big impact on the profitability of the wheat mill
business. The same is the case for bakers; flour price volatility will impact on the profitability of the baking
business. Out of all the respondents, 40 percent indicated that the impact of input price volatility of raw
materials on the profitability of their business is very high, 40 percent indicated that this impact is medium and
the remaining 20 percent indicated that the impact is low. The majority of the respondents who indicated that
the impact is very high are small scale wheat millers and bakers. These small scale wheat millers and bakers
felt exposed to input price volatility as they do not have the cash flow and the knowledge to counteract these
input price risks by using risk mitigating strategies such as SAFEX. On the contrary, large scale millers
indicated that they do make use of SAFEX as part of a risk mitigating strategy. This ability of large scale wheat
millers to mitigate risk on SAFEX creates an advantage for large scale millers over smaller scale millers in their
ability to offset the input price volatility.
The study identified that smaller scale wheat millers and bakers do no make use of any risk mitigating
strategies to off-set the risk of input cost price volatility. Smaller scale wheat millers and bakers do not have
the necessary skills and cash flow to make use of these strategies. Out of all the respondents only 30 percent
indicated that they do make use of contracts. It must be noted that these respondents were mainly large scale
wheat millers and bakers. Indicating the advantage large scale wheat millers and bakers has over their smaller
scale counter parts.
9. To identify factors that restricts and/or enhances competitiveness and profitability of smaller
commercial mills and bakers (pages 105 – 107 & 108 – 116 & 119 – 122).
In identifying factors that restricts and/or enhances competitiveness and profitability of smaller scale millers
and bakers, an effort was made to identify the level of competition that exists between wheat millers and
bakers. . By identifying the level of competition within these industries, factors that restrict and/or enhance
competitiveness and profitability can be identified. Two main sections of the study were setup to identify the
factors that restrict and/or enhance profitability in the wheat milling and baking industries. These sections
include the section on issues/constraints/challenges and a SWOT analysis. The issues/constraints/challenges
as well as the weaknesses and threats of the SWOT analysis section clearly indicates the factors that restrict
competitiveness and profitability in the wheat milling and baking industries, where as the strength and

xviii
weakness section of the SWOT analysis indicate the factors that enhance the competitiveness and
profitability.
The opinions expressed by wheat millers and bakers on the level of competition within the wheat milling and
baking industry showed that the milling and baking industry is highly competitive. Out of all the respondents,
60 percent indicated that the industry is highly competitive, with the remaining 40 percent indicating that the
level of competition is on average the same as any other industry. Not one respondent indicated that the level
of competition is low or non-existing. Some of the respondents feel that the level of competition is too high,
forcing them out of the market. However, a large portion of respondents indicated that there is still capacity in
the country to increase wheat milling and baking on a small scale. What the study did find is that much more
needs to be done to protect the smaller scale wheat millers and bakers against the large scale millers and
bakers as they have the capital and cash flow requirements to distort the markets and increase the level of
competition in the market.
The issues/constraints/challenges section provided valuable insight into possible factors that restrict
competitiveness and profitability of small scale millers and bakers. The respondents indicated the issue of
collusion taking place in the wheat milling and baking industry. The level of collusion is currently under
investigation by the Competition Commission. The respondents agreed that there was a level of price fixing
between firms. The knowledge level of labourers was also indicated as a serious challenge for the industry as
finding reliable and motivated labourers is troublesome, especially in the rural areas. Other issues or
challenges include theft, the availability of wheat, high electricity supply and costs, credit availability from
commercial banks, the lack of support from the Dti, deteriorating infrastructure and the level of wheat and flour
imports. All these factors restrict competition and profitability in the wheat milling and baking industries as
unnecessary costs are incurred impacting on the profitability of wheat millers and bakers which leads to a
decrease in the level of competition.
As mentioned before, the weaknesses and threats section of the SWOT analysis also identified some factors
that restrict competitiveness and profitability of wheat millers and bakers. The weaknesses from the SWOT
analysis include the ability to obtain the necessary credit, the development of a marketing campaign, handling
of bad debts, procurement and logistical management, keeping overheads as low as possible, increasing the
milling and baking capacities and the low level of product differentiation possibilities. In the threats section,
respondents indicated that ever increasing input cost is a danger. Other threats included the unhealthy level of
competition, high levels of imported wheat and the amount of theft taking place. Again, all of these factors
restrict competition and profitability in the wheat milling and baking industries as unnecessary costs are

xix
incurred impacting the profitability of wheat millers and bakers which leads to a decrease in the level of
competition.
Factors that enhance profitability and competition in the wheat milling and baking industry were captured in the
strengths and opportunities sections. High quality product offering, high quality level of service offering, good
management and expertise, the location of the business, high levels of integration and low barriers to entry are
all factors that enhances profitability and competition within the industries. The respondents also indicated
some opportunities that are present in the industries. These opportunities include increasing the level of
integration, milling wheat in rural areas, milling other types of grain and increasing the milling capacities. All of
these factors contribute to enhancing the level of profitability, and therefore competition can increase.
10. Analyse whether the current support measures provided by the DTI are applicable to the agro-
processing sector and to make recommendations on how such support measures can be
adapted if needed (page 138).
The Department of Trade and Industry (the Dti) launched a new incentive programme, called the
Manufacturing Investment Programme (MIP) which commenced in 2008 and will end in 2014. The objectives
of the MIP are to stimulate much needed investment within the manufacturing industry, while all the while
aiming to enhance the sustainability of manufacturing investment projects by small enterprises and to support
large-to-medium scale projects in manufacturing that would not have been established without a grant. To
qualify for the MIP, projects are assessed to determine their importance to the Dti’s priority sectors, job
creation, Broad Based Black Economic Empowerment (BBBEE) as well as location in areas of high
unemployment. This programme should aid wheat millers with their investment costs. However, the waiting
periods to qualify for these grants are a serious issue and needs addressing. The Department of Health
(2007), stated that “…has taken nearly four years to get approval for an allocation of funds…”. The views and
opinions expressed by respondents also indicated that the waiting period for the funds to be allocated can take
several years. This process must be speedier, as the industry especially smaller scale wheat millers and
bakers are in desperate need of funds. Furthermore, commercial banks were also required to make a
contribution through advancing credit. Non – creditworthy clients therefore do not qualify for Dti assistance.
11. Additional areas covered by the study (pages 132 – 140 & 142 – 144)
The study went beyond the scope of objectives and covered additional aspects that can assist in identifying
factors that restricts development in the wheat milling and baking industries. An effort was made to identify
risks on a macro and micro level. Macro level risks are those uncertainties over which the wheat milling and

xx
baking industry has no control, whereas the micro level risks are uncertainties that impact on the daily
operations of wheat millers and bakers. An additional area covered by the study was to identify all legal
aspects that have an impact on the industries. A legal framework was therefore established for the industries
by the study. An analysis was lastly made on the financial performance of wheat millers and bakers over the
past five years. These additional areas added value to the objectives in identifying factors that limit
development in the wheat milling and baking industries.
For the purposes of the executive summary only the most important micro-level risks as identified by wheat
millers and bakers will be mentioned as this will shed some light on the risks they feel impact their daily
operations. The act of theft taking place on-site was mentioned on a continuous basis as the biggest risk they
face on a daily basis. Other risks include, power outages and the electricity price increases, the quality of the
surrounding infrastructure and logistics, default on debt as these industries do business on a cash basis, the
impact of price volatility on their profits and the level of staff skills. The possibility that these risks will occur is
high, with the impact on the industries also indicated as high. Attention therefore, must be given to these risks
and the proper risk mitigating strategies must be developed.
As mentioned above, a legal framework for the wheat milling and baking industries was developed. The most
important legal aspect impacting the wheat milling and baking industry is the fortification and labelling of
foodstuffs law. This act provides guidelines and principles on the correct procedure and standards, in terms of
the fortification and labelling process of foodstuffs that must be executed by millers in South Africa. The issue
with this act is that small wheat millers feel that the barrier to entry of the industry is increased as entrants will
incur a great amount of unnecessary costs. This act is supported by the National Chamber of Milling, which in
the past mostly represented the large scale millers of South Africa. This created an advantage for large scale
millers over small scale millers. This has change over the past few years. At present the National Chamber of
Milling has more small scale millers and bakers on their membership list than large scale wheat millers and
bakers (National Chamber of Milling, 2010).
An effort was lastly made by the study to analyse the financial performance of existing wheat millers and
bakers. This will indicate how the various businesses have performed in terms of turnover over the past five
years. Respondents were asked to indicate from a scale of very good, good, average, bad and very bad how
their turnover performed over the past five years. More or less 34 percent of respondents indicated that their
financial performance over the past five years was average. Out of all the respondents, another 33 percent
indicated that their respective turnover over the past five years performed above average. The last bracket of
wheat millers and bakers were represented by 33 percent of respondents. This bracket of wheat millers and
bakers indicated that their turnover over the past five years performed below average and that they have

xxi
experienced a drop in sales over the past few years. It is however, interesting to note that the below average
performance bracket was solely represented by small scale wheat millers. This indicates that the financial
performance of large scale wheat millers and bakers are superior to smaller scale wheat millers and bakers.
Smaller scale wheat millers and bakers therefore need more support from the Dti and government institutions
which would aid in the sustainability of smaller scale wheat millers and bakers.
12. Make recommendations on key issues identified by the study (pages 145 – 149)
From the outset of the study it was clear that conducting research within the wheat milling and baking
industries will be difficult. Information sharing and finding wheat millers and bakers that are willing to provide
information and views were difficult following the investigations by the Competition Commission. It is important
to note that this problem of information sharing was also a problem before the investigations by the
Competition Commission. This clearly indicated that information sharing and data collection within the wheat
milling and baking industries is a major problem and needs to be addressed. Trust between the stakeholders
within the supply chain seemed to be a major obstacle. Research and development is the cornerstone of
further expansion and growth in any industry and greater effort must be made to create an environment where
there is trust to access information..
A factor that clearly restricts development is the lack of government support in terms of the quality of
infrastructure and the grants that government provide. Many respondents expressed their concern over the
quality of infrastructure their business has to cope with. For many small scale wheat millers, service delivery is
the cornerstone of their business. Not having access to a properly maintained surrounding infrastructure incurs
unnecessary costs, decreasing the profitability of smaller scale wheat millers and bakers. For smaller scale
wheat millers and bakers, sustainability equals profitability. Government therefore should upgrade enabling
infrastructure, especially in rural areas.
Government grants was another specifically mentioned issue that wheat millers and bakers feel hampers their
prospect to expand. Expansion and starting operations requires capital. Many small scale wheat millers and
bakers expressed their concern over the time it takes to qualify for the much needed grants. It can take several
years before funds are made available. Small scale wheat millers and bakers do not have that time available.
The process and the conditions of making funds available should be addressed.
Theft on-site was a major issue for the respondents - a solution should be found for this. Wheat millers and
bakers spend unnecessary productive time and effort on theft prevention. Default on debt is another serious
risk that impacts specifically on smaller scale wheat millers and bakers. The wheat milling and baking industry
xxii
is cash flow driven, with sales being done on a cash basis. Another problem, especially in rural areas, is the
lack of motivated and skilled labourers. More programmes should be initiated that provide labourers with the
necessary skills to excel in the industry. There are however, skills development programmes, smaller scale
wheat millers and baker must be more exposed to these programmes. The National Chamber of Milling, as
mentioned, expressed their disappointment on the level to which government training authorities were involved
(National Chamber of Milling, 2010). A strategy needs be formulated to counter-act these risks as it will save
costs incurred by smaller scale wheat millers and bakers.
The biggest difference that exists between smaller scale wheat millers and bakers and their larger scale
counterparts is that large scale millers’ and bakers’ have the ability to handle price volatility with the correct
risk mitigating strategies. Smaller scale millers and bakers do not have the necessary skills and capital to
make use of SAFEX in a risk mitigating strategy. Therefore, price volatility has a greater impact on the smaller
scale wheat millers and bakers than on their larger scale counterparts.
The study was complicated by the fact that finding small scale wheat millers that are still in business and that
mill wheat on a daily basis was difficult. This in itself restricts agro-processing development as wheat mill
owners are not supported by any institution and little information is available. According to SAGIS, any
business that stores grain at silos and adds value to grain products must registered at SAGIS. A
recommendation is that small scale wheat millers and bakers must register at organisations such as the
National Chamber of Milling and the South African Chamber of Baking. Having said this, smaller scale wheat
millers and bakers are sometimes not interested in registering with these organisations as they perceive the
fees to be high and also that it is of little value to them. After some investigation it was found that fees for small
scale members was R80 membership fee per month which is low (National Chamber of Milling, 2010).
The conclusion is that large scale wheat millers and bakers have an edge over their smaller scale counterparts
in that they have the necessary skills, knowledge and cash flow to overcome obstacles in a short period of
time whereas smaller scale wheat millers and bakers can take several months to recuperate proving
sometimes to be detrimental. The factors identified by the study that restricts development must be resolved in
order for smaller scale wheat millers and bakers to have a fighting chance.

1
CHAPTER 1 STUDY OBJECTIVES, DATA COLLECTIONS AND METHODOLOGIES
The main purpose of the study is to analyse and identified the factors that limits agro-processing development
in the wheat milling and baking industries in rural areas. In order to conduct a proper study that identifies the
factors that restricts agro-processing development, a detailed analysis of the wheat milling and baking
industries is required, emphasising the smaller millers and bakers. The study is broadly divided into five
chapters. The first chapter introduces the reader to the objectives of the study, the method used in data
collection and the associated methodologies used in the study. Chapter 2 lays a foundation from where the
study can be performed by reviewing all previous studies conducted on the wheat industry, the wheat milling
industry and the baking industry. Chapter 3 provides a detailed overview of the International, Southern African
Development Community (SADC) and South African wheat industry. The data analysis and results of the study
is analysed and interpreted in chapter 4, which leads to the conclusions and recommendations of the study
that is discussed in chapter 5.
In order to conduct a precise and focused study for the industry, a clear understanding of the associated
methodologies used in this study must be understood. Chapter 1 aims to introduce the reader to all the
objectives of the study and the geographical region within which the study is conducted.
1.1 STUDY OBJECTIVES
The objectives of the study can be summarised as follow:
• Report on previous studies conducted in South Africa on the wheat milling and agro-processing industry
• Identify the critical success factors of the current wheat millers
• Analyse the wheat supply chain to understand the shorter and longer term issues in the sub-sector that
influence the effective establishment of agro-processing industries in rural areas.
• Determine the impact of input price volatility on the profit margins of the smaller commercial mills
• Identify factors that restrict and/or enhance the competitiveness and profitability of smaller commercial
mills.
• Identify the use of any risk mitigation strategies such as hedging, storage and branding applied by the
smaller commercial mills.
• Establish protocols within support structures that can assist in the development and sustainability of
agro-processing industries in rural areas.
• To unpack the governance/business models of successful smaller mills; looking specifically at
contractual arrangements, hedging, infrastructure, and marketing strategies.
• Analyse the barriers to entry and barriers to exit.

2
• Analyse the power relations between the players, if any, with special emphasis on smaller commercial
mills and bakeries.
• Determine the impact of imports and exports of raw materials as well as the manufactured products.
• Analyse whether the current support measures provided by the Dti are applicable to the agro-
processing sector and to make recommendations on how such support measures can be adapted if
needed.
• Make recommendations on key issues identified in the study.
1.2 DATA COLLECTION
The collection of information was done by conducting interviews with a structured questionnaire with various
wheat milling and baking firms in the supply chain as well as major role players. The structured questionnaires
were developed on a statistical basis, in order to verify the results obtained by the study statistically.
From the outset of the study, it was apparent that data collection will be extremely difficult following the
investigation of the Competition Commission into the wheat milling and baking industries. The original
geographical region of the study was the North West and Free State provinces. However, the study could not
find sufficient wheat millers and bakers in the original geographical areas that were willing to share
information, following the investigation of the Competition Commission. The study therefore was forced to go
beyond the original boundaries to neighbouring provinces and an effort was made to find wheat millers and
bakers that are willing to cooperate and would provide accurate data. The National Agricultural Marketing
Council agreed to these changes to the original proposal.
To support the unwillingness of the industry to share data and information, the following is an exact
extrapolation from the National Chamber of Milling’s website under the industry statistics. “Following the
Competition Commission concerns regarding information sharing, the chamber has discontinued with the
dissemination and distribution of industry statistics until such time when the commission has given clear
guidelines regarding information sharing on an industry basis” - National Chamber of Milling (2010-07-12). In
a study by the Department of Health (2007), an observation was also made to the fact that finding small millers
was difficult as the small scale millers did not want to be found, and did not want to talk to strangers towards
whom they showed a level of distrust.
In total 15 wheat millers and bakers were interviewed. Geographically, the millers and bakers interviewed are
situated in Western Cape, Eastern Cape, Pretoria, North West and Free State. Out of the total interviews

3
conducted, 10 were wheat millers and the remaining five were bakers. As far as possible, the study captured
the voice of small, medium and large scale wheat millers and bakers.
1.3 METHODOLOGIES USED BY THE STUDY
1.3.1 STRUCTURE, CONDUCT AND PERFORMANCE FRAMEWORK
Bain (1951) founded the traditional S-C-P analysis framework in industrial organisation theory in 1951 (CAET,
2003) to account for inter-industry differences in profitability. S-C-P is an analytical framework used to study
how the structure of the market and the behaviour of the sellers of different commodities and services affect
the performance of markets and consequently the welfare of the different participants (USAID, 2006).
Structure affects conduct, which in turn affects performance. The structures considered in S-C-P are as
follows (USAID, 2006):
Structure refers to the features of the market that influence the rivalry among buyers and sellers operating in
a market. Examples include the number of buyers and sellers in the market, barriers to entry to the market, the
composition of the market, level of infrastructure etc.
Conduct refers to patterns of behaviour that market participants adopt to affect or adjust to the markets in
which they buy or sell. This includes price setting behaviour and production and marketing practices.
Performance refers to market outcomes and how the market fulfils certain social and private objectives. It
encompasses price levels and stability, profit levels, costs, efficiency as well as quantities and quality of food
sold.
An illustration of the S-C-P paradigm is given in Figure 1 below (Aleksandrova & Lubys, 2004). Given the
linkages of the S-C-P framework, questionnaires were developed to focus on the different elements and
separate questions were formulated to address the structure, conduct and performance within the supply
chain. The market structure is the most basic concept and research motive and it reflects groundwork and
environment in a market economy (CAET, 2003).

4
Figure 1: An illustration of the S-C-P paradigm Source: Aleksandrova & Lubys, 2004
CAET (2003) distinguishes between two different types of S-C-P frameworks. This can be seen in Figure 2
and Figure 3 below and indicates that it can either be a deterministic model or a dynamic model. The flow of
the arrows indicates the effect the structure, conduct and performance have on each other and how these
factors influence the market.
S u p p ly
T ec h no lo g y
R aw M a te ria ls
P ro d u c t C h a ra c te r is tics
B usin e ss A ttitu d e s
D em a n d
P ric e E la s tic ity
S ub stitu te s
R a te o f G ro w th
C yc lica l an d S e aso na l C h arac te r
B a sic C o n d itio n s
N u m b er o f S e lle rs a n d B u ye rs
P ro d u c t D iffe ren tia tio n
B a rr ie rs to E n try
C o st S tru c tu re s
V e rtic a l In te gra tio n
D iv e rs ific a tio n
M a rk et S tru ctu re
P ric ing B e h av io u r
P ro d u c t S tra te gy an d A d v er tising
R ese arch an d Inn o va tio n
P la n t In v es tm e n t
C o n d u ct
P ro d u ctio n a nd A llo c a tiv e E ffic ie n cy
T e ch n o lo g ica l P ro g re ss
F u ll em p lo ym e n t
E q uity
P erfo rm a n ce
T ax e s an d S u b sid ie s
In te rn a tio n a l T ra d e R u le s
R e g u la tio n a n d P rice
C o n tro ls
A n ti-T ru s t L a w s
P u b lic P o licy

5
Figure 2: Deterministic S-C-P mode Source: Lutz in CAET, 2003
Figure 2 indicates how the flow is only one-way, whereas Figure 3 shows the dynamic nature of the S-C-P
model because of its interrelationships.
Figure 3: Dynamic S-C-P model Source: Lutz in CAET, 2003 The S-C-P paradigm was used to analyse the various role players in the market and how these different
elements feature in the wheat milling industry.
1.3.2 PRICE VOLATILITY
Volatility provides a measure of the possible variation or movement in a particular economic variable. It
provides a measure that describes the tendency of a commodity, for example the maize market, to move
either up or down and to what extent the anticipated move could be. In essence it is a fear factor. If the price
Structure
Conduct
Performance
Structure
Conduct
Performance

jumps large amounts in a short space of time then the volatility of the market will be high. If the market
movement is small, steady and predictable then the volatility will be low.
associated with increased volatility may influence both producers and consumers. High volatility may limit the
ability of consumers (processors) to secure supplies and control input costs.
Two measures of volatility are used (European Commission, 2009):
• Historical (realised) volatility, based on observed (realised) movements of price over an historical
period. Historical volatility tells us how volatile an asset has been in the past. It represents past price
movements and reflects the resolution of supply and demand factors.
• Implicit volatility. Implicit volatility is the markets' view on how volatile an asset will be in the future. It
represents the market’s expectation of how much the price of a commodity is likely to move
to be more responsive to current market conditions.
Historical volatility is a statistical measure of the volatility of a futures contract, security, or other instrument
over a specified number of past trading days. It is an indication of past volatility in the marketplace. Historical
volatility is calculated as the annualized standard deviation of the first difference in the logarithmic values of
nearby futures settlement prices. Mathematically,
The historical volatility of near month wheat contracts traded on both the Chicago Mercantile Exchange and
the Agricultural Products Division of the JSE Ltd (SAFEX) were calculated and
Chapter 3.
1.3.3 RISK MANAGEMENT ANALYSIS
Risk management for the purposes of this study will be divided into a macro and micro level. All identified risks
which have an external impact on the daily operations of the milling Industry will be classified as Macro Risks.
Macro Risks will further be divided into a Political, Economical, Social, Technological and Environmental risks
(Louw, 2007). Micro risks, will have an internal impact on the milling industry in that these types of risks are
unique to and affect the long term sustainability of the industry. Micro risks, therefore will be divided into
Operational, Product Market, Financial, Input and Export risks. T
understanding of the whole risk management process for the proposed study.
jumps large amounts in a short space of time then the volatility of the market will be high. If the market
movement is small, steady and predictable then the volatility will be low. Lack of predictability and uncertainty
associated with increased volatility may influence both producers and consumers. High volatility may limit the
ability of consumers (processors) to secure supplies and control input costs.
(European Commission, 2009):
Historical (realised) volatility, based on observed (realised) movements of price over an historical
period. Historical volatility tells us how volatile an asset has been in the past. It represents past price
ects the resolution of supply and demand factors.
Implicit volatility. Implicit volatility is the markets' view on how volatile an asset will be in the future. It
represents the market’s expectation of how much the price of a commodity is likely to move
to be more responsive to current market conditions.
Historical volatility is a statistical measure of the volatility of a futures contract, security, or other instrument
over a specified number of past trading days. It is an indication of past volatility in the marketplace. Historical
the annualized standard deviation of the first difference in the logarithmic values of
nearby futures settlement prices. Mathematically,
The historical volatility of near month wheat contracts traded on both the Chicago Mercantile Exchange and
Agricultural Products Division of the JSE Ltd (SAFEX) were calculated and are
RISK MANAGEMENT ANALYSIS
Risk management for the purposes of this study will be divided into a macro and micro level. All identified risks
ich have an external impact on the daily operations of the milling Industry will be classified as Macro Risks.
Macro Risks will further be divided into a Political, Economical, Social, Technological and Environmental risks
ave an internal impact on the milling industry in that these types of risks are
unique to and affect the long term sustainability of the industry. Micro risks, therefore will be divided into
Operational, Product Market, Financial, Input and Export risks. The following figure provides a clear
understanding of the whole risk management process for the proposed study.
6
jumps large amounts in a short space of time then the volatility of the market will be high. If the market
redictability and uncertainty
associated with increased volatility may influence both producers and consumers. High volatility may limit the
Historical (realised) volatility, based on observed (realised) movements of price over an historical
period. Historical volatility tells us how volatile an asset has been in the past. It represents past price
Implicit volatility. Implicit volatility is the markets' view on how volatile an asset will be in the future. It
represents the market’s expectation of how much the price of a commodity is likely to move and tends
Historical volatility is a statistical measure of the volatility of a futures contract, security, or other instrument
over a specified number of past trading days. It is an indication of past volatility in the marketplace. Historical
the annualized standard deviation of the first difference in the logarithmic values of
The historical volatility of near month wheat contracts traded on both the Chicago Mercantile Exchange and
are discussed in detail in
Risk management for the purposes of this study will be divided into a macro and micro level. All identified risks
ich have an external impact on the daily operations of the milling Industry will be classified as Macro Risks.
Macro Risks will further be divided into a Political, Economical, Social, Technological and Environmental risks
ave an internal impact on the milling industry in that these types of risks are
unique to and affect the long term sustainability of the industry. Micro risks, therefore will be divided into
he following figure provides a clear

7
Macro Risks
Micro Risks
MACRO RISKS
MICRO RISKS
• POLITICAL RISKS • ECONOMICAL RISKS • SOCIAL RISKS • TECHNOLOGICAL RISKS • ENVIRONMENTAL RISKS
• OPERATIONAL • PRODUCT MARKET RISK • FINANCIAL RISKS • INPUT RISKS • EXPORT RISKS
Figure 4: Graphical representation of the risk management process.

8
CHAPTER 2 WHEAT LITERATURE REVIEW
The literature review is an essential part of any proposed study. A literature review provides the foundation on
which a study is conducted. It also ensures that the proposed study expands on the existing body of
knowledge. The purpose of this chapter is to clearly highlight and emphasise the existing studies that have
been conducted on the wheat industry. This chapter is divided into international wheat milling literature review
section, regional studies done on wheat milling in the Southern African Development Community (SADC) and
the available literature on wheat milling in South Africa.
2.1 INTERNATIONAL LITERATURE STUDY
The study did not yield any similar studies on the subject of factors that restrict agro-processing development
in a wheat industry. However, the following section elaborates on studies supporting the research effort.
In a study conducted on the Indian Agro-processing sector, Kachru (2009) identified objectives as well as
strategies to be followed in order to ensure the successful development of the sector. These principles can
provide guidelines as well as identify missing institutional and other structures that limit the development of
rural wheat milling industries within the Free State and North West provinces. Kachru identified the following
ideal objectives of agro-processing programs:
- to minimize product losses
- to add maximum value
- to achieve high quality standards
- to keep processing cost low
- to ensure that a fair share of added value goes to the producer.
To achieve these objectives Kachru (2009) suggested the following strategies:
• The creation of a national plan for the development and extension of agro-processing technology at all
levels of the industry, taking into consideration different needs and resources of individual provinces.
Programme details and schedules should be included for the first four to five years, as well as
periodically reviewed and adjusted.
• Key areas for research and development should be identified and research and development programs
created to support the national plan. Effluents from the agro-processing industry should be treated and
utilized; therefore provision for these activities must be made within the programme.
• Emphasis should be placed on the establishment of new agro-industrial plants in the production areas
to:
9
• minimize transport cost
• make use of the lower cost of land and a more abundant water supply to create
• employment opportunities in the rural sector
• utilise process waste and by-products for feed, irrigation and manure
• Infrastructure within production areas should be improved in order to support agro-industrial
development.
• The national plan should provide for management of agro-industrial activities within the production
areas, both by private companies and individuals as well as cooperatives.
• Financial incentives and support should be provided to promote the modernization of the agro-
processing industry and for establishing new such industries in production areas.
• Arrangements to supply market information to the farmer and agro-processor should be created.
De Magistris & Gracia (2008) presented a paper, at the 12th Congress of the European Association of
Agricultural Economists. The objective of the paper was to investigate the impact of coordination amongst
stakeholders of the food chain on enterprise competitiveness. The main conclusion of the study was that as
the quality of the relationships in the Spanish wheat to bread chain improved, stakeholder competitiveness
increased. The results also revealed that the quality of relationships in the Spanish wheat to bread chain was
based on trust, satisfaction and commitment with buyers/sellers and strongly influenced by communication
quality and quantity.
Bavorova & Hockmann (2008) conducted a study on relationships among actors in the wheat to bread chain.
The authors found that actors within the chain preferred long-term, independent business relationships.
Independence was maintained by exchanging services informally. Members can therefore benefit from the
reduced transaction costs associated with long term relationships without the legal obligations of contracts.
The main finding of the study was that relationships seemed to be sustainable only if the cost of starting a
relationship was exceeded by the long term benefits of cooperation. Relationships among smaller actors can
therefore attain sustainability quicker than larger actors.
According to Hofstrand (2007) of the Agricultural Marketing Resource Centre at Iowa State University, a barrier
to entry is anything that blocks or impedes the ability of a company to enter an industry, and a barrier to exit is
anything that blocks or impedes the ability of a company to leave an industry. Hofstrand (2007), identified the
following typical barriers to entry:
• Economies of size – Arises as a barrier when a company needs a large volume of production and
sales to reach the cost level per unit of production for profitability.
• Capital intensive activities – When a large capital investment per unit of output limits industry entry.

10
• Intellectual property – Patents and other types of intellectual property are highly effective in limiting
industry entry.
• High switching costs – The tendency for buyers of an industry’s products to be reticent about switching
to a new supplier tends to limit entry.
• Established brand identity – Industries dominated by branded products are difficult to enter due to the
large amount of time and money required to create a competing branded product.
• Permitting requirements – Industries where permitting and licenses are required to establish
production tend to have limited entry.
• Government standards – Industries where rigid industry standards exist tend to have limited entry.
Hofstrand (2007) identified the following typical barriers to exit:
• Investment in specialist equipment – Investments in specialized equipment that cannot readily be used
in other industries tends to be an impediment to leaving the industry.
• Specialized skills – Highly specialized skills by industry participants that cannot be utilized in other
industries tend to be an impediment to leaving the industry.
• High fixed costs – High levels of dedicated fixed costs tend to be an impediment to leaving an
industry.
In general, industries that are difficult for new competitors to enter may enjoy periods of good profitability and
limited rivalry among competitors. Conversely, industries that are easy to enter attract new companies into the
industry during periods of profitability. So, rivalry among competitors can be intense. On the other hand,
industries that are difficult to exit have more rivalry than industries that are easy to leave (Hofstrand, 2007).
When combining entry and exit, one can predict industry rivalry, stability and profitability. Figure 5 indicates
that an industry which is easy to enter but difficult to leave has strong industry competition and low profitability.
At the first sign of excess profitability in the industry, competitors are attracted to the industry. However, when
profitability falls, it is difficult to leave the industry so profitability remains low (Hofstrand, 2007).
Figure 5: Industries that are easy to enter but difficult to exit.
Source: Hofstrand (2007)

11
On the other hand, an industry that is difficult to enter but easy to leave is shown in Figure 6. This type of
industry has limited industry rivalry and tends to have excellent profitability, and competitors have a difficult
time entering the industry. However, during a period of low profitability, competitors leave the industry easily
(Hofstrand, 2007).
Figure 6: Industries that are difficult to enter and easy to exit.
Source: Hofstrand (2007)
Industries that are easy to enter and easy to exit are shown in Figure 7. The size and composition of the
industry is fluid and changes easily. In this type of industry supply responds quickly to changes in demand and
prices tend to stabilize. Rivalry is moderate due to the easy flow of businesses in and out of the industry
(Hofstrand, 2007).
Figure 7: Industries that are easy to enter and easy to exit.
Source: Hofstrand (2007)
Industries that are difficult to enter and to exit are shown in Figure 8. The size and composition of the industry
is fixed and changes slowly. Supply changes slowly due to market signals so price responds strongly to
changes in demand. The amount of rivalry can change drastically due to changes in demand (Hofstrand,
2007).

12
Figure 8: Industries that are difficult to enter and difficult to exit.
Source: Hofstrand (2007)
These scenarios can assist to identify the current situation within the wheat milling industry, and to identify
whether barriers to entry, exit or a combination of both limit development in the sector. This will enable focus
on relevant problem areas that need to be addressed.
13
2.2 SOUTHERN AFRICAN DEVELOPMENT COMMUNITY (SADC)
One study in particular, conducted by Flatters (2002), highlighted the wheat industry in the greater Southern
African Development Community (SADC) region. The objectives of this study were to:
• Establish current and future production of wheat and wheat products
• Identify the current processing and consumption of wheat in the SADC region
• Establish a trade mechanism that optimally benefits the whole region through the identification of various
market distortions in the world market
One of the most important factors that were identified was the fact that the SADC region is in short supply of
wheat and limited wheat is produced outside of South Africa and Zimbabwe protection in the form of tariffs is
present in South Africa and Tanzania which to an extent protect the producer and at the same time force
prices to hover around import parity levels. On the down side, these high prices impact negatively on
processors in SADC due to expensive wheat. As a net importer, the majority of the wheat is imported and thus
milled in the SADC region. For a product such as pasta, Durum wheat is needed and is not produced in SADC
due to climatic factors. There is thus no other alternative but to import. Flatter (2002) still feels that in order to
ensure a competitive milling environment and all role-players in the wheat processing sector are on a level
playing field, tariffs need to be reduced. This will promote free trade and at the same time, have none or
limited impact on regional grain growers. Whether the wheat that is milled is produced locally or imported is to
be determined by the different role-players but, as mentioned, lowering tariffs will ensure all role-players, large
and emerging, can benefit from a free market environment. It is also true that in order for markets in SADC to
operate efficiently, priority needs to be given to the development of the processing and other relevant sectors.
2.3 SOUTH AFRICA LITERATURE REVIEW
Limited research reports were found that focused on the wheat milling and baking industry in South Africa in
the last two decades. A PhD-study conducted by De Kock (1991) aimed to develop a strategic perspective of
the wheat industry in South Africa. Future scenarios were used to form an idea of the possible implications that
environmental influences may hold for the development of the wheat industry in the long term. Marketing
issues which are addressed include the internal and world market potential for wheat and the relative
competitiveness of the South African wheat industry in these markets. The production issues included were
the potential for and profitability of wheat production in South Africa, the possible influence of trends in the
social, economic, political, physical-biological and technological components of the decision-making
environment.

14
The study found that future internal socio-political and economic developments and the nature of international
trade policy appear to be the most dominant environmental factor which may influence the future development
of the South African wheat industry. The study concluded that a continuation of the present support policies of
important wheat exporting countries will have a negative influence on South Africa’s competitiveness in the
international market. Protection against the direct competition of subsidised foreign wheat will be necessary to
keep the industry sustainable in the long term.
In 1999, the NAMC conducted an evaluation on the deregulation process of the wheat to bread value chain.
The study aimed to identify the total effect of the deregulation process on the wheat milling and baking
industry. The deregulation process included the removal of the registration of bakeries, the bread subsidy,
retail price control, fixed prices for the producers, millers and bakers, the state control of imports and exports,
fixed price single channel marketing, wheat board agency agreements for handling and storage and wheat
board determined quality standards (NAMC, 1999).
The abolishment of the aforementioned resulted in South Africa’s grain market becoming one of the most
liberal in the world economy today. The study identified that the biggest impact on the industry was that
producers are exposed to world markets after the deregulation. Producers had no more bargaining power as
wheat is now produced according to the buyer’s specific needs. This deregulation resulted in higher price and
market risks for producers (NAMC, 1999). This is a valuable consideration in the context of the proposed study
to identify barriers to entry for wheat millers and bakers. Higher market and price risk for wheat millers and
bakers can result in higher barriers to entry. This is emphasised by the study in that the production of wheat
fell after the deregulation.
The impact of deregulation on wheat millers was that they were then exposed to higher procurement risk.
Before the deregulation, procurement was considered risk free and simple. After the deregulation,
procurement shifted to a more complicated process. Millers must now rely on new instruments like silo
certificates, preseason contracts and SAFEX to manage these procurement risk. On the upside, the study
found that as a result of the deregulation, competition increased as more small scale millers entered the
market. The downside was that this increase in competition led to a reduction in the number of large scale
companies, impacting negatively on employment in the country (NAMC, 1999).
Deregulation also impacted on the baking industry. The number of smaller and in-store bakeries increased
creating a surplus baking capacity. This surplus baking capacity together with the prescribed delivery zones
and production quotas created more pressure on the cost per unit of plant bakeries. This increased level of
competition led to further reductions in the number of plant bakeries (NAMC, 1999).

15
The study further emphasised the fact that the deregulation benefited the consumer in that the consumer now
has a wider variety of products to choose from. This benefit however, came at a price. Before the deregulation,
the price of bread was controlled and as a result, all consumers paid the same price. After the deregulation,
competition for retailers decreased which resulted in considerable higher prices for consumers (NAMC, 1999).
The Food Pricing Monitoring Committee (FPMC) (2003) analysed the wheat-to-bread value chain. The
market structure as defined by the FPMC is illustrated by Figure 9 below:
Figure 9: Wheat industry value chain
Source: FPMC (2003)
According to the FPMC (2003), the milling and baking industry is highly concentrated and most of the major
millers have vertically integrated with bakeries. This high level of concentration is confirmed by Chabane et al
(2008). Tiger Brands, for instance, has a controlling interest in the Spar retail group as well as interests in

16
grain milling. Companies with backward linkages into primary production include Anglo Vaal Industries and
Tongaat-Hulett, both of which are involved in primary production of raw material for processing into food
commodities (Mather, 2005). Due to difficulties in accessing to finance, wheat imports and the hedge on
SAFEX, most small scale millers cannot vertically integrate with bakers.
The baking industry is the major client of the milling industry. According to the South African Chamber of
Baking (2010), bakers can be defined as follows: wholesale bakers who operate industrial bakeries,
independent bakers who operate stand-alone bakeries, retail bakers who operate in-store bakeries, and
emerging bakers originating from previously disadvantaged groups using less than 1 000 kg of flour per week.
At the time of deregulation, approximately 3 000 bakers were registered with the Wheat Board with
approximately 80 percent of the bread production in the hands of six large baking groups. During 2003, the
number of baking units had increased and was estimated at 7 900. Of these 85 were wholesale bakeries, 600
were in-store corporate bakeries, 3 700 were independent bakers, and 3 500 were franchise bakers (this
includes franchise in-store bakeries, biscuit, pie and pizza outlets). The FPMC (2003) attributed the main
growth in the number of bakeries to the franchise in-store bakeries. It is estimated that 53 200 informal bakers
operate in non-licensed premises (note: this includes people baking for home industries and cake decorators).
In 2004, the NAMC conducted a strategic study for the wheat to bread value chain which was compiled for the
Wheat Steering Committee. The main goal of this study was to ensure the long term sustainability of the South
Africa wheat industry, after the deregulation in 1997. The vision was to create, within a free market
environment, a wheat to bread value chain that meets the needs of the domestic market as well as to be
competitive internationally. The study proposed that in order to achieve the specific vision, all members within
the value chain must work together in conjunction with the government which will ensure the long term growth
and prosperity of the wheat industry (NAMC, 2004).
The study emphasised that there is a positive future for all stakeholders in the industry. However, the industry
must recognise that some changes needs to be made in order to ensure the long term sustainability of the
industry. The study summarizes the changes as follows (NAMC, 2004):
• Changes must be made to the traditional way of doing business.
• Total commitment must be made to meet the market’s needs.
• Stakeholders must align their business plans to government goals.
• Government should take industry needs into consideration when formulating policies.

17
The study further identified that the number of wheat mills had dropped in South Africa from 137 in 1996/97 to
103 mills in 2004. This is illustrated in Figure 10. At the time of the study, 90 small mills were identified, with 33
large mills producing 97 percent of the South African wheat flour.
Figure 10: Annual wheat milled in tons Source: National Chamber of Milling, (2009)
Employment in the wheat industry had decreased by 25 percent from 1992 to 1998 because of improved
efficiency and milling units being closed. The study identified that the number of baking units at the time of the
study was around 7 900 formal bakers and around 64 900 informal bakers. The growth in the industry took
place through the establishment of franchises and in-store bakeries (NAMC, 2004).
After a detailed analysis and on-going discussions between all role players in the industry, a number of
objectives were identified by the study. These objectives are seen as the cornerstone of success for the wheat
industry and can be summarised as follows (NAMC, 2004):
• Co-operate with government and obtain their active support.
• The value chain must put in place methods of best practice and set standards against which they can
constantly be measured.
• Identify international marketing opportunities and monitor and analyse the trade agreements
• Assist in the development of Black Economic Empowerment (BEE), Small, Medium and Micro
Enterprises (SMME’s) and Woman Owned Enterprises (WE) within the industry.
Mather (2005) identified three consistent patterns in the food processing sector:
• Food processing SMEs tend to sell and market their products outside of the formal retail structures
that exist in South Africa. In other words, SME food processors tend not to supply Pick ‘n Pay,
2 000 000
2 100 000
2 200 000
2 300 000
2 400 000
2 500 000
2 600 000
2 700 000
1998
/99
1999
/200
0
2000
/01
2001
/02
2002
/03
2003
/04
2004
/05
2005
/06
2006
/07
2007
/08
2008
/09
Marketing year
To
ns
Wheat milled

18
Shoprite/Checkers, Woolworths or Spar. Rather than supplying supermarkets, SMEs supply smaller
independent retail stores or other enterprises involved in a further stage of processing. Small scale
wheat millers, for example, often supply to smaller independent bakeries or the ‘in store’ bakeries of
independent retailers. The link between SME food processors and other SME businesses suggests
that there are supply chains which are relatively independent of large processors and retail chains. As
a result are food processors away from formal retailers, more involved in supplying black South
Africans in townships through spaza shops, through networks of hawkers, or at commuter stations.
• A second finding is that SME food processors usually supply local or regional markets.
• A third finding referred to the competitive position of SME food processors. SMEs in this sector are
competitive on the basis of price or quality, but rarely volume. Wheat millers, for example, who supply
small bakeries with flour guarantee that their product is suitable for specialty baking.
The FPMC (2003) identified five major firms involved in wheat milling. In 2008, the Competition Commission’s
investigation in the bread and milling industries concluded that the four major firms dominating the milling of
wheat and the production of bread have been colluding to set prices through regular meetings and contact
from at least 1994 up to 2007 (Chabane, et al. 2008). In addition, the investigation found that the bakeries
were engaged in market allocation conduct by agreeing to close down certain bakeries in specific areas in
favour of competitors (Chabane, et al., 2008). Premier Foods applied for leniency in exchange for information
assisting the Competition Commission, while Tiger Brands entered into a consent order agreement with the
Commission for the part that they played in the bread cartel. They were awarded immunity in terms of the
Commission’s leniency for their role in the milling cartel as they provided the Commission with vital information
which the Commission did not have. The cartel investigation illustrated that, despite the deregulation of the
maize and wheat value chains, the sectors were effectively privately regulated by the major processing firms
(in their own interests).

19
Figure 11: Market share of top wheat milling companies Source: FPMC, 2003
Meyer & Kirsten conducted a study in 2005 whereby they aimed in modelling the wheat sector in South Africa.
The structure of the South African wheat market was analysed using economic theory and econometric
modelling techniques. The model is used to make baseline projections regarding the supply and use of wheat
in South Africa and to analyse the impacts of various policy alternatives on the wheat sector for the period
2004-2008. Results indicated that the area harvested in the summer as well as winter region will decrease
over time. Domestic consumption will marginally increase over time, which will result in higher levels of
imports. The ability of the model to simulate policy shocks is illustrated by means of simulating the impact of
the elimination of the wheat import tariff on the wheat sector.
Uckerman et al (2008) determined farmer’s preference in adopting derivatives contracts to manage price risk.
The paper applied a discrete choice model to determine specific characteristics that influence South African
grain farmers' preferences to hedge against uncertainties. This was the first empirical study on South African
grain producers' preferences to adopt derivative contracting and is based on the survey data of Grain South
Africa for 2006. With the application of separate binary logit models for each major grain commodity, they
established that different grain farmers are significantly heterogeneous. The results also showed that grain
farmers' preferences to adopt derivative contracting are mostly influenced by the farmers' prediction of daily
grain prices and trends, farm size and various geographic characteristics. From a policy perspective it has
been indicated that food and income insecurity will be reduced if farmers can adopt derivative contracting at
large scale since it will enable the producers to produce staple food on a continuous basis at a relatively
profitable level.
30%
27%
20%
10%
13%
Genfoods Pioneer foods Tiger Milling Ruto Other

20
McDonald et al (2008) conducted a study into the costs and benefits of higher tariffs on wheat imports to South
Africa. They found that low international wheat prices, caused by tariffs and subsidies in developed countries,
have been blamed as culprits causing the financial difficulty to South African farmers. While indignation at
unfair trade practices may be valid, it does not necessarily follow that protection of the local industry is the best
response. This study used a static general equilibrium model to describe and quantify the effects of increased
tariffs (by up to 25 percentage points) on the local wheat industry, other affected industries—particularly
downstream industries—and the economy at large. The effects on factors, households and the government
are also analysed. The results showed that the benefits to the wheat industry are highly concentrated and
smaller than the loss of income caused in other sectors. Welfare is negatively affected, especially for low-
income households, for whom the effects are exacerbated by increases in relative food prices.
The Competition Tribunal imposed a fine of R195 million on JSE-listed food producer Pioneer Foods during
2010 for its role in bread-cartel activities, which were referred to the tribunal in early 2007 following a
Competition Commission investigation. The penalty amounted to nearly 10 percent of the 2006 national
turnover of Sasko, Pioneer's baking unit. The Competition Commission found that the cartel involved the four
primary bakeries including: Tiger Brands' Albany, Premier's Blue Ribbon, Foodcorp's Sunbake, as well as
Pioneer, which owns the Sasko and Duens bakeries. Together, the four bakeries enjoyed a market share of
between 50 percent and 60 percent of the domestic bread market. Foodcorp agreed to pay an administrative
penalty of R46-million in 2009, while Tiger Brands settled the matter in late 2007 and was fined R98-million.
Both penalties were somewhat lower than what would have been 10 percent of the revenues arising from their
respective bakery divisions for 2006 (Creamer, 2010).
The NAMC conducted an investigation into the wheat-to-bread value chain in 2009. This study was initiated by
the Minister of Agriculture and Land Affairs, to investigate the wheat-to-bread value chain with emphasis on
the rising price of bread. In an effort to identify the reasons for the increases in bread price, the study identified
that the South African bread price increases followed the same international trends. The bread price was
subject to economic fundamentals governing these markets, including a shortage of grain commodities which
in turn put upward pressure on the price of food (bread) (NAMC, 2009).
The study emphasised the fact that the South African wheat prices are trading at import parity levels. The
South African price of wheat is normally determined by the world price of wheat, the exchange rate and the
local supply and demand for wheat. South Africa is not self-sufficient in terms of the production of wheat;
hence the domestic price of wheat tends to trade closer to import parity levels. The study recommends that
there should be a reduction in dependency on imported wheat and that the industry should become more self-
21
sufficient. If this objective is fulfilled, a sharp decrease in wheat prices can be expected, according to the study
(NAMC, 2009).
An interesting finding of the study was that brown bread prices were increasing at a much faster pace than
white bread, even though brown bread prices are zero rated and much cheaper to manufacture. The study
came to the conclusion (still needs to be clarified) that the price of brown bread is being marked up to make up
for the fact that it is zero rated. The study further identified that the wheat producer’s share in retail prices
dropped from 30 percent in the early 1990’s to below 20 percent in 2007. The reason for this is that the price
of wheat has changed over time. Millers’ share in retail prices also experienced a decrease during the period
under consideration. The biggest share in bread price was contributed by Bakers because of the value adding
they are responsible for. The retailers’ share has not shown any significant growth or decline and has
remained stable during the period of the study (NAMC, 2009).
A concern of the study was that the secondary levels of the value chain are highly concentrated with a few
firms dominating the market. This is not a good sign for competition within the industry and in turn for the long
term affordability of bread. Smaller bakers were of the opinion that the bigger millers tend to negotiate higher
flour prices for smaller bakers forcing them out of business. This phenomenon restricts smaller bakers to entry
the market and lowers the prospects of healthy competition (NAMC, 2009).
An NDA (2006) study found identified the major strengths, weaknesses, opportunities and threats of the wheat
millers in South Africa. These are given in Table 1 below.

22
Table 1: SA Millers’ strengths, weaknesses, opportunities and threats
Strengths Weaknesses
• Well-organised industry organisations
• There are sound infrastructure and
training standards
• Developed telecommunication network
• Availability of workforce
• There is a strong Export Committee and
highly-skilled professionals and
institutions for research
• Inadequate protection against unfair
competition
• High input costs
• Highly-distorted international market
• Low export orientation
• Lack of innovation for new products
Opportunities Threats
• Beneficiation of raw materials
• Available production capacity
• Domestic and regional demand
• Shift from maize meal to wheat products
• Existing preferential export markets (in
terms of African Growth Opportunities
Act, EU and SADC)
• Unfair competition from cheap subsidised
imports
• Non-tariff barriers by SACU and SADC-
members
• Changes in consumer preferences
• Changes in regional dynamics and
multilateral arrangements
• Lack of customised incentives
• Poor domestic/regional market economic
conditions
Source: NDA, 2006
The Industrial Development Corporation (IDC) concluded a study in April 2010 with the main purpose to
provide a strategic overview of the grain milling industry in South Africa. The study highlights some of the grain
milling industry main features and key performance trends. The report further identifies certain investment
opportunities for the benefit of existing as well as emerging millers within the industry (IDC, 2010). The study
by the IDC (2010) provides valuable insight into the objectives of the proposed study to identify factors that
limit agro-processing development in the wheat milling industry in South Africa. The study supports this in
updating the report.
The IDC (2010) study identified the following barriers to growth that exists within the milling industry (IDC,
2010):
23
• The milling industry is very capital intensive. The success in the industry is dependant on the capital
requirements and to establish brand awareness.
• Access to funding is difficult, especially for small scale millers. The National Chamber of Milling reported
that commercial banks and agribusinesses do not fund black farmers because they do not have the
necessary security to offer for financing.
• A challenge exists in flour properties that change. High levels of expertise are therefore required to
ensure a high quality product is always delivered.
• Large millers, also have their own bakeries, which results in flour being purchased from them. The
bakery and miller have contracts between each other which disallow the bakery to purchase flour from
other mills. This leaves independent millers in a predicament, forcing them to sell their products at a
reduced price.
• Flour dumping in South Africa poses a serious threat for the industry. Subsidised imported flour has an
adverse impact on the local mills.
The IDC (2010) study further identifies the key challenges facing the milling industry in South Africa and
therefore also the factors that limit agro-processing in South Africa. The challenges mentioned included the
following (IDC, 2010):
• Rising costs and access to working capital. The costs of milling are on the rise, millers need to obtain
working capital in order to meet demand requirements.
• Raw material procurement. Small scale millers are some times exposed to a situation where for
example grade 3 wheat is sold at the same price as grade 1 wheat. This unlawful practise has led to
some small scale millers collapsing.
• Inward logistics. South Africa is a net importer of wheat, forcing millers to ship their wheat which is very
expensive for small scale millers. Large scale millers have a comparative advantage in that they can
ship larger amounts of wheat and have the necessary silo’s for storage purposes.
• Transportation infrastructure is a big challenge for the milling industry. Many railway lines are not being
properly maintained which forces millers to make use of road transport which is 30 percent more costly.
The IDC (2010) study reported that the four largest millers in South Africa are Sasko Milling, Tiger Milling,
Premier Foods and Pride Milling. These four millers account for 40 percent of the market share. However, this
market share has decreased from 73 percent prior to 2006 to the 40 percent in recent times. Increased levels
of competition and regional marketing of locally produced brands altered their dominance. The study identified
that the medium size millers account for approximately 45 percent of the market share, with the remaining 15
percent claimed by small scale millers (IDC, 2010).

24
The IDC (2010) study identified that from the 137 wheat millers in 1997, only 109 where left in 2007. The
reason for this decrease in the number of mills is due to the increased level of competition that exists within
the industry as a result of deregulation and under-utilisation of production capacity. The National Chamber of
Milling (NCM) describes the industry as a high volume, low profit margin industry. From 1992 to 1998,
employment in the industry had decreased by 25 percent, following improved production efficiency and the
closure of mill plants.
A Strengths, Weaknesses, Opportunities and Threats (SWOT) analysis of the milling industry was also
included by the study. Table 2 summarises the SWOT analysis of the IDC (2010) study.

25
Table 2: The IDC (2010) SWOT analysis for millers in South Africa.
STRENGTHS WEAKNESSES
1. The grain milling industry is the second largest
agricultural sector in terms of its value
1. Inadequate protection against unfair
competition.
2. The industry provides staple food products and
caters for the domestic market
2. Significant rise in input costs.
3. Foreign exchange earner 3. Fluctuating fuel prices and increasing toll fees.
4. Well developed infrastructure for production 4. The industry is relatively unattractive to
investors.
5.Well organised industry association 5. Highly distorted international market.
6.Developed telecommunication network 6. Deteriorating transport infrastructure.
7. High delivery costs
8. Small millers do not fortify their flour, with a lack
of regulation by government officials.
OPPORTUNITIES THREATS
1. Food crisis experienced world-wide. 1. Unfair competition from cheap subsidised
imports.
2. Available production capacity. 2. Substitution of grain products by customers.
3. Shift in consumer demand from other foodstuffs
towards bread.
3. Production of grain is dependant on climatic
conditions.
4. Shift in consumer demand to organic foods. 4. HIV/Aids and unemployment.
5. Beneficiation of natural resources. 5. Bread price fixing.
6. Growing domestic and regional demand. 6. Imported genetically modified products are
threatening the domestic market due to consumer
resistance.
7. Alternative international supplier.
Source: IDC (2010)
Figure 12 below indicates Porter’s five forces that impact the ultimate profit potential of an industry. The five
forces include the factor conditions, firm strategy, structure and rivalry, demand conditions and the role of the
government. The relative signs indicate a positive, neutral or negative impact on the profitability potential of the
industry

26
Figure 12: Porters five forces for the milling industry as identified by the IDC (2010) Source: IDC (2010)
The IDC (2010) study concluded that the greatest challenge facing South Africa is the attainment of food
security. This is underpinned by high population growth, high levels of poverty, logistics costs and heavy
reliance on a few staple foods. The demand for wheat as a staple food is likely to be sustained for many
decades to come. The milling industry will always play a vital role in addressing food security problems,
provided that issues such as transportation and power supply are addressed and that the industry’s
competitiveness is maintained or enhanced.
2.4 CONCLUSIONS
After a thorough and detailed review of the available literature on the wheat industry, a conclusion can be
made that the proposed study will expand on the existing body of knowledge an that the study will make a
valuable contribution to all stakeholders involved within the industry.

27
Chapter 3 MARKET OVERVIEW
The following section provides an in-depth overview of the current state of the wheat sector. Special emphasis
is placed on the global, Southern African Development Community (SADC) and South African wheat sectors.
The main purpose of the global overview section of this market overview is also to identify current trends as far
as stock levels, production levels and consumption levels are concerned. It also extends into the challenges
and issues faced by the industry as well as a Porter analysis aimed to discuss the competitiveness in the
global wheat sector. The South African section aims to identify current South African trends as far as stock,
production and consumption levels are concerned. The aim of the market overview is to understand the
current state of the global wheat sector. From this, a more precise and concentrated study can be conducted
to identify the factors that limit agro-processing development in the wheat milling industry in rural areas.
3.1 GLOBAL WHEAT OVERVIEW
Not only is wheat (Botanicalnameis Triicumaestivum) one of the eight cereals known to man but it is also one
of the most widely cultivated grains grown in the world (WFC, 2005). Wheat grain is therefore one of the most
important basic food sources for more than three billion people world wide (Schlauri, 2005).
Wheat is generally classified into classes according to the colour of the kernel, the hardness of the grain and
the time of planting. The United States grows six classes of wheat:
• Hard red winter
• Soft red winter
• Hard red spring
• Hard white
• Soft white
• Durum (WFC, 2005).
However, the only difference in the wheat among the different classes is the protein content. The protein
content does not make a significant difference in terms of nutrition but more in terms of baking quality. Durum,
which is the hardest wheat with 14 to 16 percent protein, is generally used for pasta while hard spring wheat
with 12 to 18 percent protein is used for yeast breads. Hard winter wheat with a protein content of 10 to 15
percent is used for all different types of flour and bread. Soft wheat with 8 to 11 percent wheat is primarily used
for cakes, crackers, cookies, cereals and pastries (WFC, 2005).

28
3.1.1 STOCK LEVELS
Figure 13: World wheat ending stocks, 1960-2010
Source: USDA, 2010
Figure 13 indicates the global wheat ending stocks in million bushels from 1960 to 2010. According to this
figure, wheat ending stocks showed a general increasing trend from 1960 to 2010. Global wheat ending
stocks is expected to increase by 2.6 percent from 2009 to 2010.
Table 3: Wheat world estimates for the period 2005/06 to 2009/10
Wheat in million tons
Forecast
2005/2006 2006/2007 2007/2008 2008/2009 2009/2010
Production 595 611 683 680 672
Trade 111 117 143 126 129
Consumption 615 617 642 651 667
Stocks 130 124 165 193 198
Year to Year stock change in ton -20 -6 41 28 5
Source: USDA, 2010
Table 3 shows the estimates of world wheat stock levels as announced by the United States Department of
Agriculture (USDA). From the 2008/09 marketing season to the 2009/10 marketing season, wheat production
is expected to decrease by 1.1 percent to 672 million tons, trade in wheat to increase by 2.3 percent to 129
.000
1,000.000
2,000.000
3,000.000
4,000.000
5,000.000
6,000.000
7,000.000
8,000.000
9,000.000
1960
1962
1964
1966
1968
1970
1972
1974
1976
1978
1980
1982
1984
1986
1988
1990
1992
1994
1996
1998
2000
2002
2004
2006
2008
2010
Mill
ion B
ush
els
World Wheat Ending Stock

29
million ton and consumption is likely to increase by 2.4 percent to 667 million tons over the same period.
Ending wheat stocks is expected at 198 million ton at the end of the 2009/10 marketing season, an increase of
2.6 percent from the 2008/09 marketing season (USDA, 2010).
3.1.2 PRODUCTION LEVELS
The top ten wheat producing areas produced approximately 80 percent of global wheat production. The five
top wheat producing areas can be seen in the pie chart (Figure 14). Figure 14represents the production share
of each of the five countries as a percentage of total production of the top five wheat producers. In acreage
terms these countries and their wheat acreage production in 2009 were (Agweb, 2010):
• Russia - 71 million acres (29 million hectares)
• India - 69 million acres (28 million hectares)
• European Union (EU) - 63 million acres (25.5 million hectares)
• China - 59 million acres (24 million hectares)
• United States (US) - 49 million acres (20 million hectares)
Figure 14: Top five International Wheat Producing Areas based on acreage produced (2010) Source: Agweb, 2010
The EU had the highest average yield per acre of 76.9 bu/acre (5.17 t/ha) followed by China with 65 bu/acre
(4.37 t/ha) and the US with approximately 41.6 bu/acre (2.7 t/ha) for the 2009 production period. Due to
technological advances yields in the EU, China and US is expected to increase year on year by 1 bu/acre
(0.067 t/ha), 2.2 bu/acre (0.148 t/ha) and 1 bu/acre (0.067 t/ha) respectively (Agweb, 2010).
16%
23%
22%
20%
19%
US Russia India EU China

30
Wheat production by the top five wheat producing areas in 2009 in billion bushels were and million tons
(Agweb, 2010):
• European Union - 5.1 billion bushels (111 million tons)
• China - 4.2 billion bushels (91 million tons)
• India - 3.0 billion bushels (65 million tons)
• Russia - 2.3 billion bushels (50 million tons)
• United States - 2.2 billion bushels (47 million tons).
Figure 15 summarizes the total wheat production of the top five producers in a pie chart.
Figure 15: Top five International Wheat Producing Areas based on bushels produced (2010) Source: Agweb, 2010
15%
21%
35%
29%
US India EU China

31
Figure 16: Global Wheat Yields from 1960 to 2009 Source: USDA, 2010
Figure 16 indicates the global wheat yields from 1960 to 2010. An upwards trend can be observed from 1960
to 2010 due to the significant improvements in technology regarding planting methods as well as in inputs
used. Yields however show a decline from 2008 to 2009 by 1.3 percent (USDA, 2010).
Figure 17: US Wheat Production from 1960 to 2010
Source: USDA, 2010
.00
.50
1.00
1.50
2.00
2.50
3.00
3.50
1960
1963
1966
1969
1972
1975
1978
1981
1984
1987
1990
1993
1996
1999
2002
2005
2008
Metr
ic t
on /
ha
Yield
.000
500.000
1,000.000
1,500.000
2,000.000
2,500.000
3,000.000
1960
1963
1966
1969
1972
1975
1978
1981
1984
1987
1990
1993
1996
1999
2002
2005
2008
Mill
ion B
ush
els
US Wheat production

32
Figure 17 shows the wheat production in the US from 1960 to 2010. This figure shows an expected decline in
wheat production by 11.6 percent from 2.5 billion bu. in 2008 to 2.21 billion bu. in 2009. This is as a result of
the reduction in acreage planted and the expected reduction in US wheat yields (USDA, 2010).
3.1.3 CONSUMPTION LEVELS
China, traditionally thought of as a rice consuming country, consumes more than 80 kg of wheat per person
per annum, mostly in noodle form. However, other countries have much higher per annum wheat flour
consumption per capita such as Algeria with 200 kg, Egypt consuming 173 kg, Israel at 133 kg, France with
109 kg and the USA at 95 kg (WFC, 2005).
Increases in global wheat consumption over the last two to three decades was a result of higher quantities of
food wheat that were needed to meet the demand for staple food products in low income and developing
countries with increasing populations in Sub-Saharan and North Africa, South and South-East Asia as well as
Latin America.
Figure 18: Global Feed Usage in Million Metric tons from 1960 to 2010 Source: USDA, 2010
According to Figure 18 approximately 122.7 million metric tons of wheat will be used as feed in 2010, an
increase of 3.27 percent from 118.9 million metric tons in 2009. The global feed wheat usage line graph
show a general increasing trend from 1960 to reach an all time high in 1990 (130 million metric tons) (USDA,
2010).
.000
20.000
40.000
60.000
80.000
100.000
120.000
140.000
1960
1963
1966
1969
1972
1975
1978
1981
1984
1987
1990
1993
1996
1999
2002
2005
2008
Million T
ons
Feed Usage

33
Figure 19: Domestic Usage of Global Wheat from 1960 to 2010 Source: USDA, 2010
From Figure 19 a general upwards trend can be observed in the global food wheat usage from 1960 to 2010.
Domestic usage of global wheat is expected to increase by 2.4 percent per annum from 652 million metric tons
in 2009 to 667 million metric tons in 2010.
3.1.4 INTERNATIONAL TRADE
Wheat is a highly tradable commodity as it is one of the most common sources of foods, especially staple
foods. There are only a few major producers of wheat which results in large volumes of wheat being exported
from exporting countries to the rest of the world.
3.1.4.1 IMPORTS
There are many wheat-importing countries and a few of these countries, especially developed countries, are
responsible for a large share of the global wheat imports. The most wheat is however imported by developing
countries who have limited production potential (USDA, 2009).
.000
100.000
200.000
300.000
400.000
500.000
600.000
700.000
800.000
19
60
19
63
19
66
19
69
19
72
19
75
19
78
19
81
19
84
19
87
19
90
19
93
19
96
19
99
20
02
20
05
20
08
Mill
ion T
on
s
Domestic Usage

34
Figure 20: Top ten world wheat importers in percentage in 2008/2009 Source: Reuters, 2010
The top ten wheat importers in the world and their global share of world wheat imports as a percentage in
2008/2009 are:
• Egypt – 6.9 percent
• Iran – 6.15 percent
• Brazil – 4.7 percent
• Algeria – 4.05 percent
• Japan – 3.98 percent
• Indonesia - 3.83 percent
• Morocco – 2.89 percent
• Iraq – 2.67 percent
• Nigeria – 2.53 percent
• Turkey – 2.53 percent
4.70%
4.05%3.98%
3.83%
2.89%
2.67%
6.15%
6.87%2.53%
2.53%
Egypt Iran Brazil Algeria Japan
Indonesia Morocco Iraq Nigeria Turkey

35
Table 4: Regional Wheat Imports from 2005 to 2009 and forecasted up to 2011.
Regional Wheat Imports (thousand metric tons)
2005/2006 2006/2007 2007/2008 2008/2009 2009/2010 2010/2011
% tons % tons % tons % tons % tons % Tons
North
America
6% 6 135 6% 7 325 6% 6 535 5% 7 188 5% 6 550 5% 6 500
Central
America
1% 1506 1% 1 582 1% 1 460 1% 1 483 1% 1 475 1% 1 525
South
America
11
%
12 112 12% 14 018 12
%
13 083 9% 13 138 10
%
12 840 10
%
12 915
European
Union
6% 6758 5% 5 137 6% 6 942 6% 7 740 5% 6 000 5% 6 000
Other
Europe
1% 1 467 1% 1 505 2% 1 923 1% 1 698 1% 1 775 1% 1 785
Former
Soviet
Union - 12
5% 5 542 5% 5 958 5% 6 015 5% 6 538 4% 5 500 5% 6 125
Middle
East
12
%
13 499 11% 12 092 10
%
11 860 20
%
28 386 17
%
21 300 16
%
19 725
North
Africa
17
%
18 622 14% 16 403 19
%
21 743 17
%
23 478 16
%
19 550 17
%
21 500
Sub-
Saharan
Africa
12
%
13 301 10% 11 814 9% 10 402 10
%
13 542 12
%
14 365 11
%
14 480
East Asia 12
%
12 852 10% 11 886 10
%
11 278 8% 11 322 10
%
12 950 10
%
12 050
South
Asia
4% 4 812 10% 10 944 7% 8 270 8% 10 708 6% 6 910 5% 6 710
Southeast
Asia
11
%
11 923 11% 12 437 10
%
11 405 9% 12 328 10
%
12 925 11
%
13 925
Others 2% 2 640 2% 2 636 2% 2 777 2% 2 637 2% 2 765 2% 2 815
Total 111 169 113 737 113 693 140 186 124 905 126 055
Source: USDA, 2010
Table 4 illustrates the volumes of wheat imported globally by the major wheat importers. From this it can be
seen that wheat imports by North Africa and the mid East, East, South and South Eastern Asia as well as
South America reduced from 2004/05 to 2008/09. Wheat imports by Sub-Saharan Africa, Finance Sector
Union (FSU), the European Union (EU) and others remained relatively constant over the same period.

36
3.1.4.2 EXPORTS
Figure 21: World Wheat Exports (million bu) from 1960 to 2010 Source: USDA, 2010a
Figure 21 illustrates the world wheat exports from 1960 to 2010. From this figure a general upwards trend can
be seen peaking at just more than 5 billion metric tons in 2008. The US is by far the largest exporter of wheat
globally with 1.1 billion bushels exported per annum in 2008 (Agweb, 2010). This however decreased to reach
865 million bushels in (USDA, 2010). The EU, Russia and Australia were rated amongst the top five global
wheat exporters in 2008 with 705 million bushels, 600 million bushels and 450 million bushels respectively
(Agweb, 2010).
Global wheat trade peaked in the 1987/88 marketing season at 111.5 million metric tons (USDA, 2009), when
large amounts of wheat were imported by the Soviet Union and China. After 1987/88 global wheat trade
declined due to lower wheat demands from the above mentioned countries even though demand for wheat
increased in developing countries. The barriers to trade implemented by the EU against low quality wheat
further dampened global wheat trade (USDA, 2009). In the 2006/07 marketing season, world wheat trade
started to increase but stagnated again in the 2007/08 marketing season as a result of high prices (USDA,
2009).
.000
1,000.000
2,000.000
3,000.000
4,000.000
5,000.000
6,000.000
19
60
19
63
19
66
19
69
19
72
19
75
19
78
19
81
19
84
19
87
19
90
19
93
19
96
19
99
20
02
20
05
20
08
Millio
n B
ush
els
World Wheat Exports

37
Figure 22: Market share of major wheat exporters (1991/92 – 2008/2009)
Source: USDA, 2009
The major wheat exporters and their market share of world wheat exports are illustrated in Figure 22. The US
and the FSU are the leading exporters of wheat with just over 20 percent market share each, followed by the
EU and Canada with a market share of just under 20 percent. Australia, Argentina and the rest of the world
making up the rest of the market share in global wheat exports. The US wheat export market share declined
from 2007 to 2008 while the EU market share of wheat exports increased during the same period.
0%
10%
20%
30%
40%
50%
60%
70%
80%
90%
100%
US Australia Canada Argentina Other EU FSU
0
20
40
60
80
100
120
140
160
19
91
19
92
19
93
19
94
19
95
19
96
19
97
19
98
19
99
20
00
20
01
20
02
20
03
20
04
20
05
20
06
20
07
20
08
20
09
20
10
Mil
lio
n T
on
s
US Exports World Exports

38
Figure 23: World wheat trade and US exports from 1991 to 2010
Source: USDA, 2010a
The world wheat trade (red line) and the US exports of wheat (blue bars) from 1991 to 2010 is shown in Figure
23. Because the US is the largest exporter of wheat it is expected that the world trade of wheat and the US
exports of wheat will follow each other to some extent. Figure 23 illustrates this relationship. However, from
2007 to 2008 the US wheat exports declined somewhat but the world wheat trade increased, this is due to the
fact that the EU exported more during the same time period, offsetting the impact that the reduction in US
exports had on the world market.
3.1.5 PRICE AND PRICE CYCLES
Wheat prices typically vary between import parity and export parity prices. It is possible that wheat prices
move outside the import-export parity band for short periods of times, but market forces will correct this.
Wheat prices are primarily determined and influenced by fundamental factors which result in price volatility in
the wheat markets. The main fundamental factors that control the wheat market prices are the supply and
demand of wheat along with the US dollar. Increases in supply tend to push down wheat prices while
increases in demand tend to raise wheat prices. A weaker US dollar will most likely increase wheat prices
(CME group, 2009).

39
Figure 24: International FOB US hard red wheat and Argentinean wheat prices from 04/01/2008 to
16/04/2010
Source: SAGIS, 2010
According to Figure 24, used in an international grain price presentation by GrainSA (2010), US wheat prices
dropped from an all time high of just under $540/ton in February-March 2008 to reach a low of $200/ton at the
end of March 2010. Argentinean wheat followed the same trend over the same period. Prices of wheat, both
US and Argentina prices, moved between the $150 and $250 price band. Between November 2009 and
March 2010 a downwards trend in the international wheat price can be spotted (IGC, 2010).
0
100
200
300
400
500
600P
rice
($
/t)
Argentine Trigo Pan US No.2 Hard Red Winter (FOB) Gulf

40
3.1.6 THE WHEAT MILLING INDUSTRY
The wheat milling industry can be explained by means of Figure 25 below.
Figure 25: Wheat milling process
Source: Grain chain, 2010
Cleaned wheat enters the wheat mill where it is conditioned and gristed (combining different wheat to produce
a mix of high quality low cost flour). It then goes through sieves where it is separated into its constituent parts
wheat germ, white flour and bran. Flour is often directly packaged into a ready to be sold form to consumers
while bran and wheat germ is used in breakfast cereals or animal feed. Different parts of the grain of wheat is
used for the constituent parts, this can be seen in Figure 26 (Grain Chain, 2010).

41
Figure 26: Section through a grain of wheat
Source: Grain train, 2010
Major role players in the international and US wheat milling industries are (Grain Milling, 2010) :
• Cargill, Inc.
• Archer Daniels Midland Company
• ConAgra Foods, Inc.
• General Mills, Inc (IBISWorld, 2010)
• Caribbean Millers’ Association
• Confederation of the Food and Drink Industries of the EU
• Grain Elevator and Processing Society
• International Association of Operative Millers
• North American Millers Association
3.1.7 CURRENT ISSUES AND CHALLENGES
World trade, particularly trade of grains didn’t reflect the same behaviour during the current economic crisis as
with the Great Depression in 1933. The only cited “horror” from the Great Depression that threatens the still
shaky world economic situation is rising protectionism that poses a real threat to full economic recovery. A bit
more than a year ago countries interfered with grain trade as an attempt to try and control grain prices by
limiting exports. The real concern now is that various countries has taken steps in protecting their domestic

42
industries and one could only wonder if this protectionism will spread to grains and agriculture (Sosland,
2009).
Challenges faced by the EU flour industry:
• Shifts in grain based foods consumption patterns.
• Changes in cultural habits of consumers.
• Changes in perceptions regarding bread and wheat products as a result of rising health awareness.
• The bakery market is dominated by industrial bakeries at the expense of craft bakeries.
• Shifting trade flows (Rabobank, 2010).
Global wheat supply challenges:
• New grain supply chain.
• Climate changes impacts wheat production and supply.
• Demand for grains as a source for “green” energy.
• Variation in quality of wheat.
• Contamination and the presence of impurities in wheat batches (Schlauri, 2005).
Consumer trends based on wheat products:
• Population increases and urbanization raises staple food demand.
• Changing needs to more convenient food related products.
• Consumers demanding food that is healthy and safe.
• Luxury and live style products are becoming increasingly more important to consumers (Schlauri,
2005).
Challenges faced by the wheat milling industry:
• Increase yields by using raw materials optimally.
• Lower production costs by operating milling plants efficiently.
• Produce high quality products by using the best technology and equipment.
• Increase food safety with high sanitation measures and plant engineering (Schlauri, 2005).

43
3.2 SOUTHERN AFRICAN DEVELOPMENT COMMUNITY (SADC) OVERVIEW
3.2.1 PRODUCTION LEVELS
Wheat production in Southern Africa has up until recent times not been common practice as only half of the
SADC countries have produced wheat since the 1995/96 season (Moyo, 2008). The leading wheat producer
has been South Africa with production levels that reached a peak at 2.8 million tonnes in the 1996/97
marketing year. Since then South Africa’s production levels have dropped to 1.5 million tonnes and 1.9 million
tonnes in the marketing years 2003/04 and 2006/07 respectively. South Africa’s production level for the 2009
season was 2 million metric tons compared to a recent low of 1.5 million metric tons in 2003. Zimbabwe was
the next largest producer of wheat in the region reaching a peak of 3.2 million tonnes in 1999/2000 marketing
season. Since then, production levels have dropped to 80 000 tonnes in 2005/2006 marketing year and to the
recent low of 12 000 tons in the 2009/10 marketing year (Reuters, 2009). Zimbabwe’s severe decrease in
production of wheat can be ascribed to the droughts in 2001 and 2002 but more specifically to the
government’s land reform policy and implementation (Moyo, 2008). Other significant producers in the SADC
region are Zambia and Tanzania who managed to reach peak production levels of 136 000 tonnes (in
2003/04) and 115 000 tonnes (in 2005/06). Production in Zambia and Tanzania has increased from their
lowest levels of 50 000 tonnes (in 1996/97) and 33 000 tonnes respectively. Namibia and Malawi also produce
wheat but in very small amounts, where peak production levels were 2000 (in 2002/03) and 11 000 (in
2005/06) tons respectively (Moyo, 2008). Figure 27 below indicates the total production on wheat by SADC
countries including South Africa from 1994 to 2006.
Figure 27: Total SADC Wheat production from 1990 to 2009 Source: USDA, 2010b
0
500
1000
1500
2000
2500
3000
3500
1990
1991
1992
1993
1994
1995
1996
1997
1998
1999
2000
2001
2002
2003
2004
2005
2006
2007
2008
2009
1000 M
etr
ic T
ons
SADC total

44
3.2.2 CONSUMPTION LEVELS
In Southern Africa the staple food for most households is maize, due to its availability and the high volumes
produced. Wheat is considered an alternative food crop to maize especially in areas where it is more
available. Wheat is consumed mainly in the form of bread by wealthier households normally in a more
urbanised setting as wheat is a costlier cereal compared to maize (FEWS NET, 2010). Domestic requirements
needed for the SADC region in the 2006/2007 marketing year amounted to 4 575 000 metric tonnes,
increasing slightly in the 2008/2009 marketing year to 4 619 000 metric tonnes (SADC 2006, 2009). Figure 28
indicates the total SADC consumption from 1990 to 2009. From the figure it is clear that consumption within
SADC has increased over the last two decades. Consumption within the SADC region has increased annually
by 2.68 percent for the last two decades.
Figure 28: Total SADC consumption from 1990 to 2009 Source: USDA, 2010b 3.2.3 STOCK LEVELS
During the 2009/2010 marketing year the wheat stock for the Southern African Development Community
(SADC) region after all exports and imports were taken into account was 1 350 000 metric tons. The
2006/2007 marketing year’s wheat stock was 1 845 000 metric tons after all imports and exports were taken
into account. This amount indicates the volatility of wheat stocks within the region (SADC, 2006, 2009). This
decrease in wheat stocks is a worrying factor as wheat has to be imported. The main reason for this decrease
in stock levels has been due to the decrease in production in South Africa which is the region’s biggest wheat
0
1000
2000
3000
4000
5000
6000
7000
1990
1991
1992
1993
1994
1995
1996
1997
1998
1999
2000
2001
2002
2003
2004
2005
2006
2007
2008
2009
1000 m
etr
ic t
on
s
SADC consumption

45
producer. Farmers in South Africa are finding it less profitable to plant wheat due to poor harvests, increasing
input prices and low prices therefore less land is being planted to wheat (GAIN Report, 2010). The
establishment of a Strategic Food Reserve Facility for SADC was proposed at the Extra – Ordinary Summit on
Agriculture and Food Security as it would ensure SADC’s ability to cope with food emergencies and keeping
optimal stocks of grains like wheat to ensure consumers of supply (SADC, Not Dated).
3.2.4 IMPORT AND EXPORT LEVELS
According to the Famine Early Warning System Network’s (FEWS NET), Southern Africa Food Security
update October 2009, “the SADC region has an overall cereals shortfall because of the deficits in production of
wheat and rice and most countries rely on imports to cover requirements” (FEWS NET, 2009). This therefore
indicates the need for the SADC region to import most of its wheat requirements from countries outside the
region like Canada, Germany, Australia, United States of America (USA), Brazil and Argentina (FEWS NET,
2009). As stated in the paper by Flatters (2002), “Required imports of wheat in SADC have been increasing
over the past decade. This trend is expected to continue since demand for wheat flour is income elastic and
there are very limited prospects for growth of internationally competitive wheat production in the region”.
Therefore the SADC region is a net importer of wheat and in the 2008/2009 marketing year the amount
imported was 2275 000 metric tonnes, which is significantly more than for the 2006/2007 marketing year
where 306 000 metric tonnes were imported (SADC, 2006, 2009). Table 1 below indicates the 2009/2010
marketing season’s exports and imports for wheat.

46
Table 5: SADC Wheat Imports and Exports Progress
Wheat ('000MT)
Deficit/Surplus -2 081
Planned Imports 1 958
Planned Exports 234
Uncovered
Gap/Surplus -357
Imports Received 710
Exports shipped 76
Imports Progress in (percent) 36
Exports Progress in (percent) 32
* Balance sheets updated 22 January 2010
* Excludes Democratic Republic of Congo (DRC) and Madagascar
Source: FEWS NET, 2010
SADC, being a net importer of wheat, can therefore only export small amounts such as in the 2008/2009
marketing year when only 223 000 metric tonnes were exported which is a substantial increase from the
marketing year 2006/2007 when 1 000 metric tons were exported from the SADC region (SADC, 2006, 2009).
Wheat producing members of SADC like South Africa and Tanzania, protect their domestic wheat growers by
imposing tariffs on wheat imports. The South African wheat import tariff has been recently adjusted to a duty of
R140.81/ton and was implemented by the South African Revenue Service (SARS) on the 30 April 2010. This
was after an investigation by South Africa’s International Trade Administration Commission (ITAC) on an
increase, as producers lobbied for an even greater increase in duty of R470/ton (GAIN Report, 2010). Zambia
and Zimbabwe levy modest tariffs on their wheat import requirement and the only other country in the region to
impose a tariff of 2.5 percent is Mozambique. The other members such as Botswana, Lesotho, Namibia and
Swaziland (BLNS) do not impose tariffs on wheat imports. Botswana, Lesotho, Namibia and Swaziland (BLNS)
are zero wheat tariff members even though they are members of the South African Customs Union (SACU)
and therefore have maintained a uniform import duty regime with South Africa. To achieve this zero tariff levy
on wheat in these countries a duty rebate program is intended to maintain world price parity for wheat
(Flatters, 2002).

47
3.2.5 PRICES AND PRICE CYCLES
Moyo (2008) states that, “food price formation and trade in the SADC region involves prices transmitted from
global food, inputs and financial markets, as well as from pricing processes arising from food the production
and marketing processes within the region, especially in South Africa”. This gives a good indication that prices
SADC countries face, of especially wheat as SADC is a net importer of wheat are determined by global trends
and South African trade which occurs on the South African Futures Exchange (SAFEX). Therefore these
prices are similar to the prices that neighbouring countries like Lesotho, Namibia, Botswana and Swaziland
face (FEWS NET, 2010). The graph below indicates wheat grain prices on SAFEX from February 2004 to
February 2010. This is important to SADC countries as Moyo (2008) mentioned that price formation in South
Africa determines the SADC wheat pricing. Therefore the graph shows price movements of wheat over the
2004 to 2010 production years.
Figure 29: Wheat Grain Prices on the South African Futures Exchange (SAFEX)
Source: Grain SA, 2010
Figure 29 indicates the wheat price movements on SAFEX. Due to South Africa and the rest of SADC
importing wheat the price moves between import and export parity prices depending on the amount harvested
and the stocks on hand. What is noticeable is that because South Africa and the rest of SADC have to import
wheat to meet domestic requirements the price the wheat is acquired at is import parity pricing. Export parity
pricing can be achieved if a surplus is produced but this is not normally the case as one can see by the graph
above. The wheat price that affects South Africa and the rest of SADC moves between import and export
parity prices. However, wheat prices continually move back to import parity due to lack of production and the
0.00500.00
1000.001500.002000.00
2500.003000.003500.00
4000.004500.00
20
04
/02
/26
20
04
/08
/26
20
05
/02
/26
20
05
/08
/26
20
06
/02
/26
20
06
/08
/26
20
07
/02
/26
20
07
/08
/26
20
08
/02
/26
20
08
/08
/26
20
09
/02
/26
20
09
/08
/26
20
10
/02
/26
R/t
on
Wheat Prices

48
need to import wheat into the SADC region. Figure 30 illustrates the import parity levels, export parity levels
and the corresponding SAFEX prices from 2000 to 2010 at Randfontein.
Figure 30: Import and Export Parity levels for South Africa from 2000 to 2010 Source: Grain SA, 2010 3.2.6 FOOD SECURITY
Article 5 of the SADC treaty states two goals which are undeniably linked to food security, one being the
alleviation of poverty and the second being the achievement of higher standards of living for the people of
SADC (SADC, 1992). Food security is therefore an important goal for SADC as a whole, and as Moyo (2008)
states, “national food security can be more efficiently achieved through freer trade than through state
interventions in agriculture...” this statement indicates the need for progressive intra SADC trade agreements.
But in terms of wheat and wheat products within the SADC region, variations in production in different states
and past protectionist policies have led to differing views on intra SADC trade liberalization for these products.
The countries with established wheat production and processing industries tend to resist any form of free trade
within the region. But the consumers ultimately pay the price when protection provided for wheat and wheat
flour in the form of bread as it is an alternative to maize meal or an integral part of their staple diet (Erasmus &
Flatters, 2003). Therefore trade in the wheat and flour industry is an important issue in terms of food security
and the SADC Free Trade Agreement signed in August 2008 is a step forward to ensuring former barriers and
protection are minimized (Moyo, 2008).
0.00
1 000.00
2 000.00
3 000.00
4 000.00
5 000.00
6 000.00
Pri
ce (
R/t
)
SAFEX Price of Wheat Randfontein Import Parity Randfontein Export Parity

49
The food price crisis furthermore added to food insecurity in the region as maize and wheat prices remain high
which affect households access to adequate food supplies (FEWS NET, 2009). Figure 35 indicates the
substantial rise in the ordinary 700 gram brown loaf which is considered a basic consumer staple (Flatters
2002).
Figure 31: South African Wheat, flour and bread prices Source: Moyo, 2008
Angola’s overall food security situation in 2009/2010 is expected to be much better than the year before.
Currently the cereal deficit/ import requirement for the country is 404 000 tonnes compared to 698 000 tonnes
in the 2008/2009 season. The current assessment of Botswana’s cereal deficit is 288 000 tonnes, which
includes 96 000 tonnes of wheat. The food security situation is expected to remain stable as current import
plans cover the assessed deficit. Lesotho’s cereal production has suffered under poor rains and expensive
inputs, which has led to decreased production. Cereal production for the 2009 season in Lesotho came to 86
000 tonnes of which 10 000 tonnes was wheat. Food security in Lesotho is precarious and there is need for
humanitarian assistance. Malawi has had an overall cereal surplus for the last three years, mainly due to
increases in maize and sorghum production. But deficits still exist in terms of wheat and rice. Mozambique’s
food security situation in the 2009/2010 season as current assessment indicates a cereal surplus of 75 000
tonnes compared deficit of 167 000 tonnes in 2008/2009 season. Namibia’s food security situation for
2009/2010 season was dealt a setback due to the severe floods that occurred in the North of the country.
In the case of South Africa, even though low prices caused production to decline, the country still had 2.17
million tonnes of surplus cereal committed to export to cereal deficit member states. The food security situation
in Tanzania is stable for 2009/2010 season even with a cereal deficit. However non-cereal food crops
surpluses are expected to cover the cereal deficit. Zambia’s food security situation is satisfactory for the
2009/2010 season. But its neighbour to the South, Zimbabwe still faces severe food insecurity.

50
Supply/demand analyses for 2009/2010 year indicates a cereal deficit of 866 000 tonnes of which 192 000
tonnes is wheat (SADC, 2009).
3.2.7 CURRENT CHALLENGES AND ISSUES
Figure 31 indicates a major issue in the wheat industry especially in wheat producing countries like South
Africa. The price the producer receives for wheat is much lower than the price charged by millers and bakers
for flour and bread. Therefore this suggests that agro-processors are taking the majority share of the price
increases. This situation is aggravated by the import protection over the past 20 years of domestic flour
producers. In most of the SADC countries the protection for flour producers is more effective than the import
protection of wheat imports (Flatters, 2002). Wheat producers are then at the mercy of foreign imports and are
greatly affected by low producer prices.
Another issue that has plagued the wheat milling industry recently has been collusion and price fixing of the
major agro-processors in South Africa (Moyo, 2008). The bread cartel in South Africa was formed between the
major millers in the country such as Premier Foods, Pioneer Foods, Tiger Milling and Foodcorp (Competition
Tribunal, 2010). These recent events have put the wheat milling industry in a negative light as price fixing and
colluding has a direct impact on the consumer.
According to the Baker (2009), Premier Foods who produces Blue Ribbon bread significantly, decreased the
price of its bread on a national basis due to reduced commodity and input prices. This movement is an effort to
pass on savings to the consumers. Even though consumers may not see the price reductions due to the
nature of the value chain, Premier Foods is attempting to pass on any savings they may achieve as quickly as
possible on to the consumer.
3.2.8 MILLING INDUSTRY
According to Flatters (2002), “South Africa accounts for almost 60 percent of the milling capacity in SADC and
the Southern African Customs Union (SACU) for two-thirds of the total”. The concentration of the South African
wheat milling industry being such that 33 large mills produce 97 percent of South Africa’s flour (Department of
Agriculture, 2006) (Accessed 2010-03-26). Within the rest of SADC, excluding South Africa, milling capacity is
found to be equal or slightly more than the domestic market size but there are however three countries where
the milling capacity is greater than the domestic flour demand - they are Tanzania, Zimbabwe and South Africa
(Flatters, 2002).

Due to the fact that SADC nations are net importers of wheat and only a few countries can produce enough for
their own mills, flour milling is afforded substantial effective protection
on flour being higher than those on wheat. To add to the protection of local milling industries Non Tariff
Barriers (NTB) are implemented to further protect the local millers. The only countries in the region that
protect their wheat milling industries are Malawi and Mauritius (Flatters, 2002).
3.3 SOUTH AFRICAN OVERVIEW This section gives an outline of the current wheat situation in South Africa. It entails the current stock levels,
predicted stock levels and provincial
and the current import and export numbers
the volatility of prices. With food security as a
the milling and baking industry.
Wheat is the second most important grain crop produced in South Africa. A large
South Africa is bread wheat, with small quantities of durum wheat being produced in certain areas, and is used
to produce pasta. In South Africa, wheat is mainly used for human consumption (bre
cereals) and the remainder is used as seed and
production of alcohol for ethanol, absorbing agents for disposable diapers, adhesives and industrial uses as
starch on coatings (NDA, 2006).
3.3.1 STOCK LEVELS
The formula that is used to calculate the closing stocks is as follows:
As indicated in the table 1, February 2009 stock level of wheat for human consumption stood at 1
thousand tons and ended in February 2010 with 1678 thousand tons this is a decrease if 9 percent (SA
2010a). The February 2009 stock level of wheat for feed consumption stood at 20
February 2010 at 18 000 tons - a decrease
Due to the fact that SADC nations are net importers of wheat and only a few countries can produce enough for
their own mills, flour milling is afforded substantial effective protection. This reveals itself by import duty rates
on flour being higher than those on wheat. To add to the protection of local milling industries Non Tariff
Barriers (NTB) are implemented to further protect the local millers. The only countries in the region that
protect their wheat milling industries are Malawi and Mauritius (Flatters, 2002).
This section gives an outline of the current wheat situation in South Africa. It entails the current stock levels,
ial planted areas, consumption levels for both human and feed purposes,
numbers and exchange rates. There is also a discussion on
. With food security as an emerging issue in South Africa it is important to consider it
Wheat is the second most important grain crop produced in South Africa. A large portion of
is bread wheat, with small quantities of durum wheat being produced in certain areas, and is used
to produce pasta. In South Africa, wheat is mainly used for human consumption (bread, biscuits,
cereals) and the remainder is used as seed and animal feed. There are other non food uses such as
production of alcohol for ethanol, absorbing agents for disposable diapers, adhesives and industrial uses as
used to calculate the closing stocks is as follows:
As indicated in the table 1, February 2009 stock level of wheat for human consumption stood at 1
thousand tons and ended in February 2010 with 1678 thousand tons this is a decrease if 9 percent (SA
2010a). The February 2009 stock level of wheat for feed consumption stood at 20
a decrease of 10 percent (SAGIS, 2010a)
51
Due to the fact that SADC nations are net importers of wheat and only a few countries can produce enough for
. This reveals itself by import duty rates
on flour being higher than those on wheat. To add to the protection of local milling industries Non Tariff
Barriers (NTB) are implemented to further protect the local millers. The only countries in the region that do not
This section gives an outline of the current wheat situation in South Africa. It entails the current stock levels,
planted areas, consumption levels for both human and feed purposes,
discussion on the prices and
in South Africa it is important to consider it in
portion of wheat produced in
is bread wheat, with small quantities of durum wheat being produced in certain areas, and is used
ad, biscuits, and breakfast
animal feed. There are other non food uses such as
production of alcohol for ethanol, absorbing agents for disposable diapers, adhesives and industrial uses as
As indicated in the table 1, February 2009 stock level of wheat for human consumption stood at 1 848
thousand tons and ended in February 2010 with 1678 thousand tons this is a decrease if 9 percent (SAGIS,
2010a). The February 2009 stock level of wheat for feed consumption stood at 20 000 tons and ended in

52
Table 6: The progressive wheat stock levels from February 2009 to February 2010 in ‘000 ton
1Feb 2008 - 1Feb 2009 1Feb 2009 - 1Feb 2010
Human Feed Total Human Feed Total
‘000 tons ‘000 tons
Opening Stock 1 658 10 1 668 1 848 18 1 866
Acquisition 3 275 31 3 306 3 272 20 3 292
Utilisation -2 810 -7 -2 817 -3 175 -18 -3 193
RSA Exports -243 0 -243 -254 0 -254
Sundries -32 -16 -48 -13 -2 -15
Unutilised stock 1 848 18 1 866 1 678 18 1 696
Stock stored 1 848 18 1 866 1 678 18 1 696
Source: SAGIS, 2010a
3.3.2 PRODUCTION LEVELS
Figure 34 gives an indication of the production levels and average yields in South Africa from 1990/1991 to
2009/2010*. The 2009/2010* period is only an estimation by Grain SA (Grain SA, 2010). The total wheat area
planted in South Africa as indicated in Figure 34 decreased from 748 000 hectares in the 2008/2009 period to
642 500 hectare in the 2009/2010* period, this is a decrease of 14 percent. Western Cape and the Free State
are still the two main regions for planting wheat, with Western Cape at 300 000 hectares and Free State at
235 000 hectares. Figure 32 indicates that the Western Cape planted 47 percent which makes it the main
wheat planting region and the Free State planted 36 percent of wheat in South Africa (Grain SA, 2010).

53
Figure 32: The contribution of each province in RSA to area wheat planted Source: Grain SA, 2010
In Figure 34 the total production of wheat in South Africa decreased from 2,13 million tons in 2008/2009 period
to 1,92 million tons in the 2009/2010* period which is a decrease of 10 percent (Grain SA,2010). Since the
area that is planted for wheat decreased by 14 percent between 2008/09 to 2009/10* it is obvious that the total
production would also decrease, but at a smaller degree than the area planted. This can be explained by the
constant improvement in the technology, genetics that lead to more varieties and planting on better soil that
leads to an increase in yield per hectare. Figure 33 shows that the Western Cape is South Africa’s main wheat
producing area with 35 percent of total production. The Free State is second at 32 percent and the Northern
Cape at 15 percent production even though they only have 7 percent of the total area planted. The Northern
Cape has the second highest yield per hectare in South Africa at 6.3 t/ha (Grain SA, 2010). Irrigated wheat
production plays a major role here.
47%
7%
36%
1%
1%1% 3% 4%
Western Cape Northern Cape Free State Eastern Cape Kwazulu-Natal
Mpumalanga Limpopo Gauteng North West

Figure 33: The contribution of each province in Source: Grain SA, 2010
The area planted for wheat and total production is used to calculate the average yield per hectare specified for
each province.
Figure 34 indicates that the average yield for South Africa increased from 2.85t/ha to 2.99 t/ha and represents
a five (5) percent growth in the average yield. As seen in
Western Cape the lowest even though it is the main wheat producing reg
32%
1%
2%
2% 5%1%
Western Cape Northern Cape
Mpumalanga Limpopo
The contribution of each province in South Africa to wheat production
The area planted for wheat and total production is used to calculate the average yield per hectare specified for
indicates that the average yield for South Africa increased from 2.85t/ha to 2.99 t/ha and represents
percent growth in the average yield. As seen in Table 7 Gauteng achieves the highest yield and
Western Cape the lowest even though it is the main wheat producing region
35%
15%
7%
Northern Cape Free State Eastern Cape Kwazulu-Natal
Gauteng North West
54
to wheat production
The area planted for wheat and total production is used to calculate the average yield per hectare specified for
indicates that the average yield for South Africa increased from 2.85t/ha to 2.99 t/ha and represents
Gauteng achieves the highest yield and

55
Table 7: Average yield (t/ha) of wheat in the RSA per region over 2009/2010* period
Region 2009/10*
t/ha
Western Cape 2.25
Northern Cape 6.3
Free State 2.65
Eastern Cape 4.0
Kwazulu-Natal 5.0
Mpumalanga 5.5
Limpopo 5.5
Gauteng 6.4
North West 5.7
Total 2.99
Source: Grain SA, 2010

56
Figure 34: The total area planted for wheat in RSA, the total production and average yield per hectare for the period of 1990 to 2010 * Source: Grain SA, 2010
0
500
1000
1500
2000
2500
3000
1990/
01199
1/92
1992/
93199
3/94
1994/
95199
5/96
1996/
97199
7/98
1998/
1999
1999/
2000
2000/
01200
1/02
2002/
03200
3/04
2004/
05200
5/06
2006/
07200
7/08
2008/
09200
9/10*
Th
ou
san
ha
or
ton
0
0.5
1
1.5
2
2.5
3
3.5
t/h
a
Area Production Yield

57
3.3.3 CONSUMPTION LEVELS
During the period of 1 February 2009 to 1 February 2010 as indicated in

58
Table 6 the total utilization for human consumption was 3 180 000 tons. Consumption is further divide into 3
120 000 tons used in processing for the market for specifically human consumption, 2 000 tons was processed
into animal feed, 21 000 tons was withdrawn by producers, 5 000 tons was directly delivered to the end
consumers and 27 000 tons was used as seeds for planting (SAGIS, 2010a).
The total utilization for feed consumption stood at 18 000 tons, of the total 16 000 tons was processed into
animal feed, 1 000 tons was withdrawn by the producers and 1 000 tons was used as seeds for planting
purposes (SAGIS, 2010a).
Due to the economic crises households with a lower Life Style Measure (LSM) shifted back to the consumption
of maize meal. This did not cause a decrease in the wheat consumption itself as seen in Figure 36 but it only
slowed down the growth increase of consumption of wheat. The consumption stayed stable between the 2008
and 2010 (NDA, 2010). As the local economy recovers for the recession and household income improves,
wheat consumption will have and an upward trend over the baseline. This can be seen in the Figure 35
(BFAP, 2009).
Figure 35: Wheat production and utilisation in South Africa for 2006 to 2014 Source: BFAP, 2009
0
500
1000
1500
2000
2500
3000
3500
4000
2006 2007 2008 2009 2010 2011 2012 2013 2014
Tho
usa
nd
To
ns
Domestic use Production

59
Figure 36: Wheat consumption for South Africa (2001 – 2010*) Source: NDA, 2010
3.3.4 IMPORT AND EXPORT LEVELS
2200
2300
2400
2500
2600
2700
2800
2900
2001 2002 2003 2004 2005 2006 2007 2008 2009 2010*
10
00
to
ns
Wheat Consumption

60
Table 6 in section 3.3.1 indicated that during the period of 1 February 2009 to February 2010 wheat exports
amounted to a total of 254 000 tons, of which 28 000 tons of wheat products is exported to African countries
and 226 000 tons of whole wheat to border posts. No wheat was exported via harbours in this period (SAGIS,
2010a).
South Africa is expected to continue to produce less wheat than what is demanded and to remain a net
importer. The reason for this is that South Africa’s wheat prices are trading at the import parity levels exposing
the wheat industry to cheaper imports. To counter this, import tariffs must be increased, in order for the import
parity level to increase. This will relieve import pressure for local producers. If South Africa does not protect
their local wheat farmers, the total wheat production area will decrease as has been the case in recent times.
This will leave South Africa in a situation where they have to rely on wheat imports to keep up with domestic
demand. Exports into neighbouring African countries will continue to be relatively low. The high import and
low export trend can be seen in Figure 37 below (BFAP, 2009).
Figure 37: Wheat imports and exports of South Africa for 2006 – 2014 Source: BFAP, 2009
Import parity is the price that a purchaser pays or can expect to pay for an imported good. It is the cost
insurance and freight price which includes the import price plus tariff plus transport cost to the purchaser's
location (Deardorrf, 2010). The import parity changes along with the wheat prices on a daily basis. Table 8
indicates the import parity for 18 March 2010 as an example. Wheat is imported from the United States,
Argentina, Germany and Canada with each country’s import price to South Africa uniquely calculated for that
country. In this case the wheat from Germany is the cheapest to import. Wheat is imported from the United
States, Argentina, Germany and Canada with each country’s import price to South Africa uniquely calculated
for that country. Import parity is reached when there is an over demand for wheat and the supply is low - then
0
200
400
600
800
1000
1200
1400
1600
1800
2006 2007 2008 2009 2010 2011 2012 2013 2014
Th
ou
san
d t
on
s
Exports Imports

61
prices will rise until it reaches international price levels where a processor will be tempted to rather import
wheat than buy it domestically as the costs to import it are lower.

62
Table 8: Import parity of wheat (VAT excluded) on 18 March 2010
US HRW US DNS
Argentine
Trigo Pan
EU
Germany
B quality
Canada
CWRS
International FOB prices 206.00 263.00 210.00 176.00 273.00
Freight Rates 54.00 54.00 43.00 45.00 61.00
Insurance (0.3% of OFB) 0.62 0.79 0.63 0.53 0.82
1. Cost, of Insurance and freight $/T 260.62 317.79 253.63 221.53 334.82
Exchange rate 7.37 7.37 7.37 7.37 7.37
2. Cost insurance and freight R/T 1920.33 2341.57 1868.82 1632.30 2467.05
Financing cost 16.57 20.21 16.13 14.09 21.29
3. Cost, Insurance, Freight and
Financing R/T 1936.90 2361.78 1884.95 1646.39 2488.34
Discharging cost
3.1 Cape Town 135.00 135.00 135.00 135.00 135.00
3.2 Durban 112.00 112.00 112.00 112.00 112.00
Import Tariff on wheat 0.00 0.00 0.00 0.00 0.00
4. Free on rail R/T
4.1 Cape Town 2071.90 2496.78 2019.95 1781.39 2623.34
4.2 Durban 2048.90 2473.78 1996.95 1758.39 2600.34
Railage cost
Durban to Randfontein 254.00 254.00 254.00 254.00 254.00
5. Delivered - Durban to Randfontein
R/T 2302.90 2727.78 2250.95 2012.39 2854.34
Source: SAGIS, 2010b
Export parity is the price that a producer receives or can expect to receive if the product is exported, equal to
the free on board, which is the price minus the costs of getting the product from the farm or factory to the
border (Deardorff, 2010). As in the import parity’s case the export parity also changes on a daily basis.

63
Table 9 indicates the export parity on 18 March 2010 as an example. In

64
Table 9 the wheat export parity price is R916.70 for the United States. Export parity price is calculated on need
and may vary according to different needs of the buyer. Export parity is reached when there is an over supply
of wheat relative to demand. Then prices will fall until it reaches international price levels where a producer will
be tempted to rather export wheat than sell it domestically if export prices are higher. . This will usually be
during the harvest months when the supply of wheat is high. The wheat harvesting months are between
November and December in South Africa.
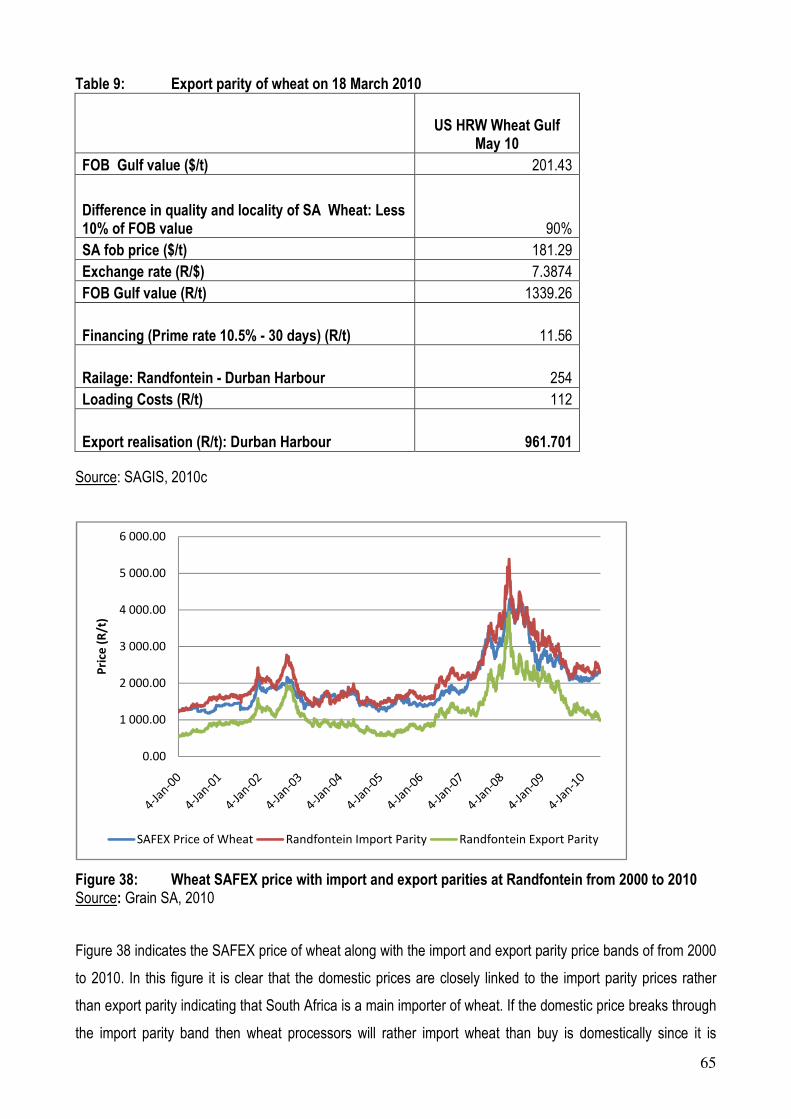
65
Table 9: Export parity of wheat on 18 March 2010
US HRW Wheat Gulf
May 10
FOB Gulf value ($/t) 201.43
Difference in quality and locality of SA Wheat: Less 10% of FOB value 90%
SA fob price ($/t) 181.29
Exchange rate (R/$) 7.3874
FOB Gulf value (R/t) 1339.26
Financing (Prime rate 10.5% - 30 days) (R/t) 11.56
Railage: Randfontein - Durban Harbour 254
Loading Costs (R/t) 112
Export realisation (R/t): Durban Harbour 961.701
Source: SAGIS, 2010c
Figure 38: Wheat SAFEX price with import and export parities at Randfontein from 2000 to 2010 Source: Grain SA, 2010
Figure 38 indicates the SAFEX price of wheat along with the import and export parity price bands of from 2000
to 2010. In this figure it is clear that the domestic prices are closely linked to the import parity prices rather
than export parity indicating that South Africa is a main importer of wheat. If the domestic price breaks through
the import parity band then wheat processors will rather import wheat than buy is domestically since it is
0.00
1 000.00
2 000.00
3 000.00
4 000.00
5 000.00
6 000.00
Pri
ce (
R/t
)
SAFEX Price of Wheat Randfontein Import Parity Randfontein Export Parity

66
cheaper to import. When this occurs it is important to protect the processors against the international market to
prevent international shocks and volatilities.
3.3.5 PRICE VOLATILITY
In 1995 grain marketing in South Africa was deregulated in terms of interventions relating to price
determination. The market for agricultural derivatives was established to provide market participants with a
price risk management facility as well as a price determination mechanism without distorting economic
principles. Wheat traders who act on behalf of clients for a fixed fee perform an important function in a free
market. These traders take positions (forward buying and selling), assume market risks, establish the value of
wheat and provide the real cash market for wheat (NAMC, 2004).
According to the NAMC’s Quarterly Food Price Monitor report (November 2009), world prices for most soft
commodities increased by approximately 20 percent from November 2008 to November 2009 as a result of the
world financial crisis. A depreciation of the US Dollar, higher crude oil prices and a strong demand from Asian
markets and bio-fuel markets in the US and Europe contributed to this increase. These world-price increases
were however not fully transmitted into South African markets due to the appreciation of the Rand relative to
the US Dollar during that period. Between March 2008 and December 2008 domestic wheat prices decreased
by 83 percent in the South African market. Between January and April 2009, the price of both wheat and
maize products came down – just 0.7 percent in the case of wheat products, despite the 36 percent decrease
in the price of wheat itself between April 2008 and April 2009 (Knowler, 2009). The prices of wheat between
January 2009 and January 2010 dropped by 24.6 percent, translating into a decrease of 4.9 percent of wheat
products in urban areas, whereas rural prices were 1.6 percent down (NAMC, 2010).

67
Figure 39: Wheat spot prices, Jan 2008-May 2010 Source: GrainSA, 2010.
Prices of agricultural commodities and "volatility" have been a significant concern since the drastic maize price
changes occurred in South Africa during the 2001/02-marketing season, also spilling over into the wheat
market. They have been in the spotlight again since agricultural commodity prices reached their peak in late
2007 and early 2008. The problem of price volatility is not new. The issue of how to address the discontinuity
of supply in the face of continued demand has been debated for ages. In addition, volatility discussions
nowadays overlap with discussions of greater uncertainty in a rapidly changing economic and natural
environment and the structural economic changes that occurred during the recent worldwide economic
recession.
The prices of agricultural commodities vary more than many other commodity prices (Alexandratos, 2009).
Prices could rise, for example by 50 percent and then drop in a short time period. The structure of the world
cereal markets is also quite thin as only a small proportion of world cereal production end up on the world
market as a large portion of the produced cereal is consumed in the domestic market (FAO, 2008). Only 17
percent of the wheat production and 7 percent of the rice production end up on the world market (FAO, 2008).
Thin markets react easily to the changes in global supply and demand (Alexandratos, 2009). The European
Commission (2009) published a report which focussed on historical price volatility and how it changed over
time. They found that wheat volatility has had an increasing trend over the period between 1980 and 2009,
ranging between 30 percent and 73 percent. By observing the evolution since 1980, the data can be divided
into four distinct intervals. During the first decade (1980 – 1990) volatility was decreasing while during the
1 000
1 500
2 000
2 500
3 000
3 500
4 000
4 500
20
08
/01
/02
20
08
/02
/02
20
08
/03
/02
20
08
/04
/02
20
08
/05
/02
20
08
/06
/02
20
08
/07
/02
20
08
/08
/02
20
08
/09
/02
20
08
/10
/02
20
08
/11
/02
20
08
/12
/02
20
09
/01
/02
20
09
/02
/02
20
09
/03
/02
20
09
/04
/02
20
09
/05
/02
20
09
/06
/02
20
09
/07
/02
20
09
/08
/02
20
09
/09
/02
20
09
/10
/02
20
09
/11
/02
20
09
/12
/02
20
10
/01
/02
20
10
/02
/02
20
10
/03
/02
20
10
/04
/02
20
10
/05
/02
Wheat
83%

68
second decade it had an increasing trend. Between 2001 and 2006 the trend in wheat volatility was relatively
stable although at a level that was higher than in the past. Since May 2006 a dramatic increase can be
observed.
The report published by the European Commission (2009) further stated that volatility can also fluctuate in any
given period. For wheat two peaks can be observed before the period of price hikes of 2007/8. The first one
occurred in June 1988 when historical volatility reached 62.5 percent, the second one in April 1996 when it
reached 50 percent. In 1988 and 1996, prices soared due to a shortfall in production. Another additional
reason for the peak in spring 1996 may have been speculation on futures contracts that took place in Chicago
resulting in wheat price spike. Analyses of other commodities share similarities with the trends observed in
wheat volatility. Although increased volatility can occur in any given period, actual peaks differ on the basis of
the commodity and developments of their fundamentals. Commodities traded on European exchanges,
although smaller in terms of volume, were not shielded from increased volatility.
In 2008, many articles were published about the food crisis, for example Abbot et al. (2008), Alexandratos
(2008), Baltzer et al.(2008), Heady and Fan (2008) and Trostle (2008), to name but a few. None of the authors
were able to identify a single factor which caused the rapid rise in cereal prices. Some factors identified have
influenced structural changes in demand and supply for decades and other factors have affected food prices in
the near run and some have been only sudden shocks (Trostle, 2008). Abbot et al. (2008) identified three
broad sets of forces driving food price increases:
• Global changes in production and consumption of the key commodities
• The depreciation of the dollar, and
• Growth in the production of biofuels.
Heady and Fan (2008) have built a model which explains the principal causes and the main causal mechanism
of the 2007/08 food crisis. Many factors are commodity-specific, some factors are highly significant and some
less. In Figure 40 the so-called less convincing factors are illustrated with dashed lines. The decline of the
dollar and the oil price are in the same box because they are both universal factors and because they may be
causally related to each other.

69
Figure 40: A model of the principal causes of the crisis Source: Heady & Fan, 2008.
3.3.6 RELATIONSHIP BETWEEN PRICE VOLATILITY AND RISK
Before discussing price volatility, it is necessary to understand what volatility is and how it is related to risk.
According to Hull, risk permits the assignment of probabilities to the different outcomes, and volatility is linked
to risk in that it provides a measure of the possible variation or movement in a particular economic variable or
some function of that variable, an example being a growth rate (Hull, 2006).
Volatility provides a measure of the possible variation or movement in a particular economic variable. It
provides a measure that describes the tendency of a commodity, for example the wheat and maize markets, to
move either up or down and to what extent the anticipated move could be. In essence it is a fear factor. If the
price jumps by large amounts in a short space of time then the volatility of the market will be high. If the market
movement is small, steady and predictable then the volatility will be low. Lack of predictability and uncertainty
associated with increased volatility may influence both producers and consumers. High volatility may limit the
ability of consumers (processors) to secure supplies and control input costs.
Two measures of volatility are used by European Commission (2009). These are:
• Historical (realised) volatility, based on observed (realised) movements of price over an historical period.
Historical volatility tells us how volatile an asset has been in the past. It represents past price
movements and reflects the resolution of supply and demand factors.
• Implicit volatility. Implicit volatility is the markets' view on how volatile an asset will be in the future. It
represents the market’s expectation of how much the price of a commodity is likely to move and tends to
be more responsive to current market conditions.

70
Historical volatility
Historical volatility is a statistical measure of the volatility of a futures contract, security, or other instrument
over a specified number of past trading days. www.cftc.gov/educationcenter/glossary/glossary_h.html. It is an
indication of past volatility in the market place. Historical volatility is calculated as the annualized standard
deviation of the first difference in the logarithmic values of nearby futures settlement prices. Mathematically,
As volatility is usually described in annualized terms, a factor of square root of 252 (estimated number of trade
days in a year) are used to annualize the historical volatility. Table 10 shows the historical volatility of the
wheat contract traded on the CME.
Table 10: Historical volatility of the wheat contract traded on CME (percentage)
Jan Feb Mar Apr May Jun Jul Aug Sep Oct Nov Dec
Yearly
Average
2000 16.9 23 24.6 19 22.7 26.6 16.8 22.4 21.7 19.2 18.9 18.4 20.8
2001 18.6 18.5 24.9 21.2 21.6 22 26.8 19.8 23.2 21.1 15.9 19.8 22
2002 20.4 15.6 22.0 16.6 22.2 27.7 24.4 22.6 41.1 41.7 28.8 25.6 25.8
2003 27.9 23.8 23.6 24.5 37.4 30 27.2 23.8 22.9 34.6 40.1 28 26.8
2004 27.2 28.9 37.1 30.1 34.2 22.3 24.4 27.2 29.2 21 22.1 19.6 26.9
2005 21.3 32.8 30.1 21.4 33.2 25 28.4 20 20.3 18.0 13.3 21 23.7
2006 22.4 25.4 26.1 21.7 32.9 27.8 43.2 29.3 33.4 45.8 26 29.9 30.4
2007 38 25.2 21.3 37.5 32.3 40 30.4 26.4 38.6 38.2 30.1 34.3 32.7
2008 35.1 73.4 72.8 44.8 30.0 52.3 31.4 63.5 50.8 60.4 50.6 41.6 50.6
2009 55.3 28.9 51.6 36.0 25.9 35.8 37.3 28.8 44.3 44.4 37.4 29.6 37.9
2010 33.4 36.2 27 32.2
Mean 28.1 25.5 26.3 24.0 29.6 27.7 28.1 28.3 31.2 33.3 27.3 23.2
High 55.3 73.4 72.8 50 39 62.5 48.1 63.5 50.8 60.4 50.6 41.6
Low 16.9 15.6 22 16.6 21.6 22 16.8 19.8 21.7 18 13.3 18.4
Source: CME (2010)
Table 11 shows the volatile nature of the South African wheat contract traded on SAFEX.

71
Table 11: Historical volatility of the wheat contract traded on SAFEX (percentage)
Jan Feb Mar Apr May Jun Jul Aug Sep Oct Nov Dec
Yearly
Average
2000 3.8 9.7 11.5 8.2 48.5 19.3 23.8 7.7 7.9 24.9 22.5 6.6 16.2
2001 22.7 30.1 25.1 16.9 21.2 18.3 30 26 16.9 27.5 30 34.6 24.9
2002 26.3 20.1 19.1 13 12 13.2 17.6 21.8 32.9 18.5 21.4 35 20.9
2003 29.6 44.5 31.9 24.5 26.3 23.4 22.5 23.2 14.8 20.9 19.4 30 25.9
2004 26.1 30.2 19.9 16.1 18.9 25.1 53.4 19.9 26.9 15 21.6 22.7 24.7
2005 15.3 20.6 19.2 17.9 19.7 27.4 19.1 32,5 47.8 22 20.6 30.4 23.6
2006 12.9 16.1 9.9 12.7 13.3 24.8 31.9 12.4 47.8 29.6 22 24.8 21.5
2007 17.8 24.6 28.8 19.5 23 36.3 25 15.4 44.7 23.8 24.2 33.1 26.4
2008 31.2 26.5 28 26.3 30.0 18.1 50.5 25.1 29.6 42.1 35.2 47.1 32.7
2009 28.1 25.5 32.6 23.9 21.9 29.9 22.5 29.5 29.7 28.3 20.2 18.4 25.9
2010 26.1 15.7 16.8 19.5
Mean 21.8 24.0 22.1 17.9 22.8 23.6 29.6 20.1 29.9 25.2 23.7 28.3
High 31.2 30.2 32.6 26.3 48.5 36.3 53.4 32.5 47.8 42.1 35.2 47.1
Low 3.8 9.7 9.9 8.2 12 18.1 17.6 7.7 7.9 15 19.4 6.6
Source: Based on calculations from GrainSA data (2010).
Interesting to note is the fact that the wheat traded on SAFEX is less volatile than the wheat traded on the
CME. Furthermore, during 2008 and 2009 (the world financial crisis) the volatility of the wheat contract traded
on SAFEX was less than the volatility of the wheat contract traded on the CME. A possible explanation can be
that the South African market has a smaller portion of funds traded the contract compared to the CME.
Another interesting fact to observe is the large changes in volatility experienced from month to month. Take
the year 2004 as an example. The volatility changed from June to July by 28,3 percent and from July to
August by 33.5 percent. This large monthly changes makes it very difficult for option writers to maintain a
delta neutral position on their books.
Implicit volatility
Implied volatility represents the market's expectation of how much the price of a commodity is likely to move in
the future. It is called "implied" because, by dealing with future events, it cannot be observed, and can only be
inferred from the prices of option contracts. Since it is such an unknown, a question easily asked is: Does
implied volatility matter? Prices of derivative commodities are determined by underlying expectations and
uncertainties about such expectations, pertinent to the market and the commodity. Hence, implied volatility, as
reflected or inferred by the prices of derivative contracts, is an important component of the price discovery
process and is a barometer as to how traders expect prices to evolve in the shorter term (FAO, 2009).

72
According to the FAO Food Outlook Bulletin (2009) the implied volatilities for wheat and maize have increased
steadily over the past two decades. Although implied volatility is much higher than previous decades, it seems
that the implied volatility of wheat and maize may have stabilized and might have reached a turning point. At
the peak of the turmoil in international wheat markets, implied volatility for wheat climbed to 55 percent, but
have retraced to lower levels and stood at 35 percent during November 2009. These percentages are a
measure of the deviation in the futures price (six months ahead) from underlying expected values. Under
reasonable assumptions, one can say 'the market estimates with 68 percent certainty that prices will rise or fall
by 35 percent for wheat and the likelihood that prices will exceed their current values by more than 50 percent
in six months time is perceived to have a probability of around 2 percent, in other words quite unlikely.
Price variability is an important component of the grain farmers’ and a miller’s planning because of its impact
on farm and miller profitability. Knowledge about price volatility and the factors affecting it will benefit derivative
instrument users and will aid in price risk management. South Africa shows high levels of both implied option
volatility and price volatility. Meyer et al (2006) state that the equilibrium price in the smaller market can be
estimated as a function of the equilibrium price in the dominant market, the exchange rate and the transaction
costs. Thus when trade occurs between markets, the difference in price is equal to the transaction costs.
Jordaan, et al (2007) conducted a study where they measured the conditional volatility in the daily spot prices
of wheat traded on SAFEX. The volatility in the prices of wheat and soybeans was found to be constant over
time; hence the standard error of the ARIMA process was used as the measure of volatility in the prices of
these two crops. When comparing the medians of the conditional standard deviations in the prices of white
maize, yellow maize and sunflower seed to the constant volatilities of wheat and soybeans, the price of white
maize was found to be the most volatile, followed by yellow maize, sunflower seed, soybeans, and wheat
respectively. These results suggest that the more risk-averse farmers will more likely produce wheat,
sunflower seed and to a lesser extent soybeans, while maize producers are expected to utilise forward pricing
methods, especially put options, at a high level to manage the higher volatility.
3.3.7 PRICE AND PRICE CYCLES
Figure 41 shows the production price of wheat that increased dramatically from 2006 to 2009. This can be due
to the input cost increases of fuel, fertilizers, labour, etc. The drop in fertilizer prices in 2009 resulted in input
costs decreasing. Figure 41 indicates the decrease in producer prices as a result of the decrease in input
costs (NDA, 2010).

73
Figure 41: Producer price of wheat 1991 – 2010 Source: NDA, 2010
Figure 42 below indicates a dramatic drop in the prices for wheat between May and September of 2009 it
dropped from R2 700/ton in May 2009 to R2 200/ton in September where it stayed with some fluctuation
(SAFEX, 2010). Between the period of 2008 and 2010 the price of wheat was under the production price. This
caused wheat production to be unsustainable with lower wheat areas planted and decreased production as
shown in Figure 34. Processors moved to imported wheat that supplemented the short fall in the domestic
markets in delivering sufficient quantities. Producers need to be protected against the international
competition at import parity prices especially at times with high producer prices and low SAFEX wheat prices.
0
500
1000
1500
2000
2500
3000
19
91
19
92
19
93
19
94
19
95
19
96
19
97
19
98
19
99
20
00
20
01
20
02
20
03
20
04
20
05
20
06
20
07
20
08
20
09
20
10
R/t
Producer Price

74
Figure 42: SAFEX prices of wheat from May 2009 to March 2010 Source: SAFEX, 2010
Wheat prices experienced a large peak in the first quarter of 2008 as seen in the Figure 42 above. Local wheat
prices then declined by following the decrease in world wheat prices seen in Figure 24. The price is not
expected to recover in 2010 since import parities continue to be low with a strengthening of the exchange rate
and no recovery in the world prices.
3.3.8 THE SOUTH AFRICAN WHEAT SUPPLY CHAIN
Before 1991 the Wheat Board controlled prices and almost all of the wheat marketing chain, but in 1991, with
the abolishment of the Wheat Board, the milling and baking industries were deregulated. This change in
modus operandi in the wheat industry resulted in more direct marketing on a regular basis between producers
and millers, processors and bakers. The deregulation of the industry opened the door for large buyers and
traders to play an important role in securing specific quantities and cultivars for their clients such as millers and
bakers. There has also been a preference by some large millers and bakers to import their own wheat from
countries like Argentina, Australia, Germany and the United States of America (USA) (NAMC, 2009).
Of the wheat produced domestically almost all is used for human consumption and less than 1 percent is used
for animal feed. Domestic consumption includes also on-farm usage for instance seed and other uses but this
makes a very small part of consumption. Wheat is purchased by the manufacturers of flour and other wheat
products from the producers, traders and silo owners. The manufacturers produce mostly branded products of
2000
2100
2200
2300
2400
2500
2600
2700
2800
2900
2009/
05/14
2009/
05/26
2009/
06/05
2009/
06/18
2009/
06/30
2009/
07/10
2009/
07/22
2009/
08/03
2009/
08/14
2009/
08/26
2009/
09/07
2009/
09/17
2009/
09/30
2009/
10/12
2009/
10/22
2009/
11/03
2009/
11/13
2009/
11/25
2009/
12/07
2009/
12/18
2009/
12/31
2010/
01/13
2010/
01/25
2010/
02/04
2010/
02/16
2010/
02/26
2010/
03/10
Price
(R/Ton)
75
which the majority is sold in the large supermarkets. The large processors tend to be found located near the
large metropolitan markets such as Johannesburg, Cape Town and Durban. Some of the large manufacturers
also have industrial business units which supply in bulk, wheat products to other food sector and hospitality
industries (NAMC, 2009).
The flour and wheaten products industry is currently experiencing some challenges like the big millers and
producers of wheaten products such as Pioneer Foods, Tiger Brands, Foodcorp and Premier Foods being
involved in a countrywide cartel. The uncompetitive behaviour of the firms was investigated by the Competition
Commission. The Commission found that these large wheat millers and bakers of bread were not only fixing
prices but also dividing markets between them. This has been rather unfortunate for the industry and the
culprits have been fined significant amounts in an attempt to curb such coordinated and anti competitive
behaviour (Competition Tribunal, 2009).
The South African wheat-to-bread value chain consists of a numerous stages from research and technology all
the way to the consumer who normally consumes wheat in a processed form as indicated in Figure 43. Each
step in the chain adds value to the wheat produced by the farmer. The producer and the rest of the industry
are supported by the South African Grain Information Service (SAGIS) which provides information on all grains
including wheat and manages databases for research. Another organisation that adds value to the industry is
the Southern African Grain Laboratory (SAGL) which ensures that laboratory work and research for the whole
value chain continued after the Wheat and Maize Boards closed. Funding for research in the wheat industry is
gained by the Winter Cereals Trust which administers a levy on wheat sold by producers and importers.
Therefore the main objective of the Trust is to perform or financially support technical, scientific and industrial
research of the winter cereals in South Africa (NAMC, 2009).

76
Figure 43: The Wheat industry value chain
Source: NAMC, 2009
Once wheat is harvested by the farmers, it is delivered to a milling company. The price of wheat delivered is
known as the mill door price and is based on the South African Futures Exchange (SAFEX) price plus
transport, handling, and storage costs. To finally get to the cost of producing flour, the cost of milling and the
cost of wheat are added. But the rate of extraction from the wheat to flour is different between white and brown
bread flour. According to the NAMC (2009), it is stated that “the extraction rate from one ton of wheat is 0.87
tons of brown bread flour is extracted and 0.76 tons of white bread flour extracted. Similarly, one ton of brown
bread flour can produce 2 278 standard 700g loaves of brown bread while a ton of white bread flour produces
2 135 loaves.” This therefore indicates that more wheat is required for white bread meal than for brown bread
meal, hence farmers gain a greater eventual share in the retail price of white bread than from the retail price of
brown bread (NAMC, 2006). Finally to gain the cost of producing one loaf of bread the cost of baking needs to
be added to the cost of flour. The cost of baking includes energy, packaging, raw materials (yeast), labour,
packaging, distribution and all the overheads.
77
Table 12 below indicate the shares each of the nodes have in the end retail price of bread. The nodes being
various actors or processors in the value chain such as the producers, logistics, millers, bakers, retailers and
finally government. These sub-sector’s shares in the retail price of a loaf of bread within the wheat to bread
value chain is just the difference between the sectors input in terms of wheat, flour and bread and their output
price of flour and bread. This is taken as a percentage of the retail price of bread (NAMC, 2009).
Table 12 further indicates that the producer share in the retail price of wheat fell from 33.3 percent in the
1990/91 year to 17.9 percent in the 1998/99 year. The producer share in the retail price of bread continued to
remain below or equal to the 20 percent mark from 1999 through to 2006, but managed to break out to 25.9
percent in 2007. This increase in 2007 according to the NAMC (2009) was due “high global wheat prices and
the local supply and demand situation.” In the case of brown bread the wheat producers share in the price
followed more or less that of the white bread trend.

78
Table 12: Share trends of the various nodes in the retail price of bread
White bread (%) Year
Node 1990/91 1996/97 1998/99 2002 2004 2005 2006 2007
Producer 33.3 24.2 17.9 20.2 18.1 15.8 17.9 25.9
Logistics 6.7 3.3 4.4 3.5 2.6 2.9 3 2.9
Miller 16.7 10.8 9.8 10.6 6.9 7.7 7 6.5
Baker 40 42 43.9 41.7 48.4 49.5 47.1 39.7
Retailer 3.3 7.4 11.8 11.7 11.8 11.8 12.7 12.7
Government 0 12.3 12.2 12.2 12.2 12.3 12.3 12.3
Total 100 100 100 100 100 100 100 100 Brown bread (%) Year
Node 1990/91 1996/97 1998/99 2002 2004 2005 2006 2007
Producer 32.4 23.4 16.7 16.9 18.5 16.1 16.6 24
Logistics 6.7 3.8 4.1 3 2.7 2.9 2.8 2.6
Miller 21 15.7 12.6 8 6.5 8.8 6.2 7
Baker 36.2 46 46.3 53.3 54.1 56.8 54.9 46.9
Retailer 3.8 11.1 20.4 18.8 18.1 15.4 19.4 19.4
Government 0 0 0 0 0 0 0 0
Total 100 100 100 100 100 100 100 100
Source: NAMC, 2009
The share of logistics which includes the transport and storage of wheat, in the retail price of bread has
dropped according to Table 12 below. Logistics also includes the grain traders who have taken over many of
the former Wheat Board’s activities in the deregulated market that now occurs. This means that traders buy
from producers, provide market information and advice to producers and millers, they also undertake logistical,
administrative functions, financing and hedging against price fluctuations (NAMC, 2009). The downward
movement as shown in Table 12 was from 6.7 percent in 1991 to 2.9 percent in 2007 for white bread and
relatively the same drop can be seen in brown bread. According to the NAMC (2009) this decline is thought to
be the result of an increase in the wheat producer’s share and the bakers share.

79
The share of the milling node has dropped significantly in especially in brown bread, from 21 percent to 7
percent. For white bread the milling node’s share has dropped from 16.7 percent to 6.5 percent which
occurred soon after the deregulation of the market between 1991 and 1996/97, but the drop in brown bread
was more spread out (NAMC, 2009).
Table 12 indicates the baker’s share has been increasing steadily from 1990/91 to 2005 where in both white
and brown bread it reached a peak of 49.5 percent and 56.8 percent respectively this was due to the fact that
bakers paid less for flour during this period (NAMC, 2009).
Retailers being the final sellers of bread to the consumer benefited from the deregulated market as no price
controls being imposed. This can be seen in table 1 where from 1990/91 to 2007 the retail sector’s share in
white bread increased from 3.3 percent to 12.7 percent and in brown bread from 3.8 percent to 19.4 percent.
Bread as a product has a very low price elasticity of demand which indicates that prices may vary but that
would not influence by too much the quantity demanded. Therefore the retail price of bread would fluctuate
according to the market but the quantity demanded would remain relatively the same (NAMC, 2009).
The Government also has a share in the value chain but only when it comes to white bread, this share is 12.3
percent which is the Value Added Tax (VAT) imposed only on white bread since 1991. As shown in Table 12
Government has a 0 percent share in brown bread as it is seen as a basic food, but white bread has the VAT
incorporated into the price. Retailers are therefore able to take a higher margin on brown bread than they can
on white (NAMC, 2009).
3.3.9 FOOD SECURITY
Food security can be a global population issue or a single household’s issue; it is defined to have access to
sufficient and affordable food for everyone (One World, 2009). A lack in food security can be caused by either
no availability of food or non-affordability of that food even if it is available. The latter is especially true for
poverty struck regions. One of the main consequences of hunger is that livelihoods are put at risk by the
inability to work. With high unemployment rates, poverty increases and even less food can be obtained (One
World, 2009).
There are three direct negative influences on food security that prospered in the absence of firm governance.
First is the lack of investment in the agricultural sector in the developing world, second are the improper rules
for trade and investment between rich and poor countries, and thirdly is the global acceptance of severe
inequality which permits the diversion of valuable food resources. This is especially the case in the production

80
of bio-fuels and animal feed that accounts for over 5 percent and 33 percent respectively of the world’s grain
consumption (One World, 2009).
Commercial consumption of wheat is consistent at around the 2.8 million tons, commercial production and
closing stocks vary from season to season depending on the weather conditions (NDA, 2009).
Ideas for the proposal of food secured in South Africa (SAAPA, 2009) are:
• Bio-fuels should not be produces from food crops.
• If speculation on the JSE Securities Exchange (SAFEX) influences the food market then it should be
limited.
• South Africa should strive to become a preferred food aid supplier to the World Food Programme
especially in our African region
• Markets must be left to stable by itself if prices are driven high due to demand
• The World Trade Organization must strive to finalise the DOHA Round to obtain a free and fair trade
environment for agricultural commodities. Since South Africa is a wheat importer; free trade will result
in greater stability of supply and lower price volatility for wheat processors. Wheat producers will have
to compete on an international basis considering international price factors and not only domestic
price factors. .
The Southern African Development Community (SADC) is in the process of creating the Regional Food
Reserve Facility. The main purpose of this food reserve is to prevent, anticipate and prepare for any impacts
and shocks to food security in a way that will minimize disruptions in the long-term agricultural growth. The
main activities of the Food Reserve Facility (SADC, 2010) are:
• Coordination of National Stocks (Collective Food Stockpiling)
• Strengthening Information systems and building capacity for forecasting
• Creating an Disaster Preparedness Framework
3.3.10 MILLING AND BAKING INDUSTRY
The Figure 44 below illustrates a simplified market value chain of the milling and baking industry (as opposed
to the more detailed supply chain presented in Figure 43).

Figure 44: The market value chain of wheat
Source: NDA, 2006
Table 13 indicates the tonnage that
definite annual increase. The milling industry produces on average 2.5 million tons of milled wheat
which is converted into flour. The milled products include white bread flour, brown bread flour, whole
flour, cake flour, industrial flour and self raising flour. The industry sells milled wheat to wholesalers, industrial
users and the BLNS (Botswana, Lesotho, Namibia and Swaziland) countries. During milling about 67
of flour and meal produced is used for bread. The millers source their raw material either from the domestic
market or from the international market
The market value chain of wheat
tonnage that was milled in South Africa from 1998 to 2009 (NCM, 2009). There is a
he milling industry produces on average 2.5 million tons of milled wheat
which is converted into flour. The milled products include white bread flour, brown bread flour, whole
flour, cake flour, industrial flour and self raising flour. The industry sells milled wheat to wholesalers, industrial
users and the BLNS (Botswana, Lesotho, Namibia and Swaziland) countries. During milling about 67
is used for bread. The millers source their raw material either from the domestic
market or from the international markets through imports (NDA, 2006).
81
from 1998 to 2009 (NCM, 2009). There is a
he milling industry produces on average 2.5 million tons of milled wheat annually
which is converted into flour. The milled products include white bread flour, brown bread flour, whole-wheat
flour, cake flour, industrial flour and self raising flour. The industry sells milled wheat to wholesalers, industrial
users and the BLNS (Botswana, Lesotho, Namibia and Swaziland) countries. During milling about 67 percent
is used for bread. The millers source their raw material either from the domestic

82
Table 13: Monthly wheat milling in tons
2009/2010 2008/2009
2007/2008
2006/2007
2005/2006
2004/2005
2003/2004
2002/2003
2001/2002
2000/2001 1999/2000
1998/1999
October 222 809 211 916 238 591 223 567 214 364 204 676 216 343 219 805 211 513 219 468 205 930 205 597 November 230 649 210 890 235 668 226 450 212 362 221 128 200 695 212 757 204 316 203 780 199 942 207 298 December 211 855 215 451 206 423 205 625 199 643 207 101 197 394 193 865 186 174 179 539 193 082 January 194 374 223 346 204 521 188 328 180 397 184 316 182 201 214 148 192 120 167 955 170 452 February 190 130 213 891 177 475 171 422 178 494 193 616 164 264 181 409 169 817 173 710 169 519 March 234 157 225 760 216 680 218 599 192 853 209 228 193 507 191 740 196 056 189 522 185 736 April 196 708 208 368 193 719 193 477 204 903 181 059 186 346 190 358 172 634 165 827 168 696 May 223 574 210 748 219 520 215 602 211 459 200 516 209 632 203 004 214 046 215 530 202 709 June 234 326 218 472 229 249 227 845 213 835 199 612 211 029 198 387 212 549 195 859 179 018 July 230 780 215 998 222 648 209 572 207 231 194 956 204 749 213 445 189 982 193 388 196 239 August 225 593 205 673 216 099 216 213 211 035 218 162 198 942 200 216 200 400 206 277 200 542 September 242 093 222 246 227 382 232 553 216 811 208 892 208 981 210 521 197 127 180 349 181 633 TOTAL 453 458 2 606 397 2 634 210 2 563 734 2 505 962 2 442 462 2 414 495 2 389 607 2 412 921 2 354 152 2 273 827 2 260 520
Source: NCM, 2009

83
There are five different types of baking units, namely: plant, wholesale, industrial, in-store and other bakeries.
There are a large number of informal bakers that operate in non licensed premises. The bakers produce
mainly bread and other products such as cakes, muffins, pizzas, etc. The plant bakeries are still popular
although there are a significant number of retail-bakers, which may impact negatively on the plant bakeries.
Growth in this industry took place through the establishment of franchises and in-store bakeries. The major
companies are Albany, Blue Ribbon, Sasko, Sunbake and BB Cereals (NDA, 2006).The industry statistics on
the major processors is unattainable since the National Chamber of Milling has discontinued with the
dissemination and distribution of industry statistics until such time when the Commission has given clear
guidelines regarding information sharing on an industry basis (NCM, 2010).
3.4 PORTER ANALYSIS OF THE WHEAT PROCESSING INDUSTRY
The Porter model is used to analyze the determinants of competitiveness in the wheat processing sector.
Porter uses barriers to entry, bargaining power of suppliers and buyers and the threat of substitutes to explain
the rivalry in the wheat processing industry. Figure 45 summarizes Porter’s five forces of model competition.
Figure 45: Porter’s 5 forces model of competition Source: Filling the Gaps, 2008
Rivalry
• Concentration and volume of competitors- If competing wheat millers are more concentrated and if the
larger portion of the market share is owned by only a few large wheat millers the competitive
landscape is less competitive.

84
• Industry growth rate and capacity utilization and expansion- A slow industry growth rate results in
wheat mills fighting for market share. If a market is still growing wheat mills can easily increase
revenues by expanding in the market.
• High wheat storage costs (silo’s), high input costs in the wheat production and processing industries
and perishability of wheat products increases rivalry in the wheat milling sector.
• Low switching costs and low levels of product differentiation increase rivalry in the wheat milling
sector.
• High exit barriers, especially regarding expensive equipment bought in the wheat milling industry to
run a wheat milling plant, make it pricy to abandon a particular product. .
Entry Barriers (Threat of new Entrants)
• Economies of scale- Larger wheat millers have economies of scale as the cost per unit decreases as
the size of the milling plant increases or expands.
• Cost advantages- Large milling companies can bargain for better prices or discounts due to the fact
that they buy more equipment or products.
• Product differentiation- A reduction in cost and economies of scale of larger wheat millers enable
these companies to cut costs and invest these savings in producing differentiated products.
• Switching cost- Switching cost is the cost of switching suppliers. This is a relatively high barrier to
entry as small and large millers are faced with this barrier.
• Capital requirements- Starting a wheat mill is a very capital intensive procedure and the capital
requirements are frequently the strongest barrier to entry.
• Access to distribution channels- Access to distribution channels to get wheat from the farmer to the
mill and to get the processed wheat form the mill to the bakeries and consumers is often hampered by
high transportation costs and poor logistical management.
• Governmental policies- Governmental policies regarding health and safety, traceability, the use of GM
products and other standards and policies is another barrier to enter the wheat milling industry (Quick
MBA, 2007).
Bargaining power of Buyers
• Buyer concentration, volume and information- The concentration and volume of the buyers as well as
the information that they have regarding a specific product often influence the power that they have to
influence the demand and thus prices of milled wheat products.

85
• Ability to backward integrate- The ability of the buyer to buy directly from the miller instead of through
supermarkets or from other sources that sell the same product at a cheaper price increases the
buyer’s ability to bargain.
• Availability of substitutes and product variety- The buyer’s bargaining power will increase as the
amount of substitutes increase but also if the variety of products available increase.
• Price sensitivity- Buyers are less sensitive to price changes in inferior or normal goods, like bread,
than to price changes in luxury goods.
• Brand identification- Different brands of a variety of wheat products are available and buyers will
typically choose to buy those products that satisfy their needs the best in terms of quality, quantity and
price.
Bargaining power of Suppliers
• The more wheat millers there are in a certain region the higher the rivalry and the lower the bargaining
power of one miller.
• Supplier’s knowledge of product’s value to the buyer- An increased knowledge of what the buyer
requires from a specific product increases the miller’s ability to bargain for higher prices.
• The bargaining power of millers decreases as soon as products become standardized.
• Threat of forward integration- Millers that deal directly with consumers have an advantage and
increased bargaining power to millers that lack this.
Threat of Substitutes
• Relative price performance of substitutes and price elasticity’s. As more substitutes become available
the demand for the product becomes more elastic. Cheaper substitutes for certain wheat products will
be preferred especially if quality are not given up on. Millers who produce wheat products cheaper will
thus have a competitive advantage to those millers who cannot afford to produce wheat products more
cheaply.
• Buyer propensity to substitute - The success of cheaper substitute products however does not only
depend on the product itself but also on the buyer or consumer’s ability and willingness to substitute
the one product for the other.

86
Figure 46: Porter’s diamond Source: Esterhuizen, 2006
Porter is also well known for his ‘diamond model’ (Figure 46) that explains the competitive strength of nations
and by implication their industries. According to Porter (1990) these determinants create an environment in
which companies are born into and are taught how to compete in a competitive environment. The effect of one
point of Porter’s diamond depends on the other points of the model; factor disadvantages will thus only lead to
innovative action in industries if there is adequate competition between these industries. The Porter diamond
is also a self-reinforcing system, thus high competition will lead to exclusive specialized factors being formed.
Factor Conditions
The production factors needed for a miller to be successful in the wheat milling industry includes:
• Cost of capital
• Input cost
• Water and land availability
• Productivity, cost and availability of labour
• Access to finance
• Infrastructure and operational infrastructure
• Cost and agreement on traceability
• Distance to the market
87
Demand Conditions
The demand conditions capture the nature and degree of demand within the nation regarding processed
wheat products. These conditions are:
• Purchasing power
• Changing consumer trends
• Growth of informal market
• Size and growth of market
Related Industries
Related industries include the continuation, degree and the international competitive power of various other
industries in a country that aid the wheat milling industry. The factors that influence this matter are:
• Logistics
• Quality and availability of imported and local inputs as well as reliability of input suppliers
• State of technology, training and skills development
• State of research and development and the availability of quality of information in the industry
Corporate Strategy, Structure and Rivalry
Corporate strategy, structure and rivalry entail the circumstances in the home market that influence the ways
in which corporations are created to grow with proper management. Generally local wheat mills that fight for
survival locally have a better chance to compete internationally.
• Relationships and networks
• Supply chain coordination
• Regulations and standards
• Level of competition
• Business behaviour
• Nature of barriers to entry
• Nature and activities of industry organizations
• Pricing strategies
• Diversification strategies

88
The role of Government in the model
Government’s role in the Porter diamond is to act as a contender and medium to push companies to increase
their goals and move to higher levels of competitive performance, thus government should:
• Encourage millers in the wheat milling industry to raise their performance by implementing strict
standards.
• Create early demands for superior processed wheat products.
• Focus on unique factor formation.
• Stimulate domestic competition by restraining direct cooperation and implementing anti-competitive
strategies.
The role of chance
Chance events are events that have nothing to do with current situations and that cannot be controlled or
influenced by a nation, government or firms such as decreases in demand, political decisions by foreign
governments, shifts exchange rates, input demands and various other factors (van Rooyen, Esterhuizen &
Doyer, 1999). Chance can destroy or create new sources of competitive advantage (Esterhuizen, 2006).
3.5 CURRENT GLOBAL CHALLENGES FACED BY THE WHEAT INDUSTRY
The global wheat industry is faced with numerous challenges and issues that affect the effectiveness of the
industry and the movement of wheat through the supply chain from the producer to the consumer. Listed
below are challenges brought about by the recent economic crisis, challenges faced by farmers on farm level,
challenges due to a changing market as well as more recent issues and challenges.
Economic challenges
• Financial crisis
The number of undernourished people is estimated at 1.02 billion (FAO, 2009), increasing up due to the recent
economic crisis. Under nourishment is due to unemployment, a reduction in disposable income as well as
unstable commodity prices and limited access to food. The economic crisis might also impact negatively on
agricultural productivity and investment which will further hamper food security and nutrition especially in
developing countries. During times of economic crises banks immediately reduce the availability of credit. This
will prevent farmers and millers from obtaining loans to invest in production of agricultural products. Farmers
and millers that obtained loans before the crisis will struggle to repay these loans possibly resulting in farmers

89
and millers possible going bankrupt. High interest rates also constrain the farmer’s ability to lend money or to
make decent profits to invest or reinvest in his production process. This reduction in production will result in
higher dependence on imports to counter the decrease in production (Suresh, 2009).
• Exchange rate volatility
Volatility in the exchange rate poses a major threat to producers, millers, bakers and consumers of wheat
internationally. As a wheat importing country, wheat prices in South Africa is highly affected by exchange rate
volatility. However exchange rates not only influence the price of wheat but also have an impact on the
volumes of exchange imported and exported and the destined countries.
Challenges faced on farm level
The challenges faced at farm level in the wheat industry have a direct impact on the current and future
availability of quality and volumes of wheat available to the miller and bakery industry. There is a need to take
notice of these issues as they impact on procurement practices of key players in the wheat value chain. .
• Global warming
Developing countries are expected to be the most affected by this phenomena as they are the least likely to
adapt in time. Global warming brings about various problems such as drought and a reduction of yields, floods
and hail and total crop losses because of this. Global warming can also create favourable conditions for pests
and diseases which can wipe out entire crops (www.africaclimatesolution.org, 2008).
• El Niño
El Niño is a very important weather phenomenon to take into consideration as it puts global wheat production,
especially producers in the southern hemisphere, under severe strain due to the dry conditions that are
brought about by El Niño. These dry conditions result in sharp declines in wheat yields. El Niño can, on the
other hand, also have a positive influence on wheat production, especially when its timing corresponds with
the vital pollinating stage of wheat crops (CCAA, 2006).
El Niño is expected to occur once again in the 2009/10 production season. Thus it is important to note the
effects of El Niño and the impact that this weather phenomenon may have on the production of wheat and thus
indirectly on the wheat processing sectors, the supply of various wheat products to the consumers and the
prices. El Niño may reduce or increase production in some regions and this will influence the ending stock of
wheat as well as the wheat available to the processing sector. A reduction or increase in the ending stocks will

90
influence wheat imports, the prices of wheat and the prices of wheat products. It is thus clear that El Niño will
have far reaching price effects not only for producers but also for processors and consumers (CCAA, 2006).
• Technology and Input costs
Technology and the lack thereof, especially on farm level and in the emerging farming sector, often handicaps
prosperity on farms. High input costs will reduce the area of wheat planted which will lead to a reduction in
supply and thus a reduction in profits in the wheat industry value chain.
• Labour
The labour force in the agricultural sector is facing many problems. HIV, especially in Africa, poses a
significant threat to the labour force as millions of people are infected with and die from the virus world wide.
High minimum wages and the high levels of unskilled labour further contribute to the global high cost of labour
(www.avert.org, 2008).
• Water scarcity
The agricultural sector is one of the major users of groundwater. It is thus of the utmost importance to ensure
that water is used sparingly and with caution by the agricultural sector without reducing yields and thus income
generated by the sector (www.fao.org, 2008).
• Cost price squeeze
According to economist Dennis Shields (2009) the cost price squeeze is a result of farmers buying inputs and
not using home-grown inputs. Crop producers face volatile energy and fertilizer costs which influence their
returns. Shields also stated that periods of high commodity prices lead to expansion in crop production and
this result in higher input prices which reduce profits. This in turn reduces production and ultimately leads to
farmers going out of business if they cannot come up with ulterior motives, such as increasing production to
increase output for given levels of input, to try and avoid the negative effect of the cost price squeeze (Ellis,
2009).
Challenges brought about by a changing market
• Population growth
The current low availability of grain is not only due to the increase in population but also to world demand for
food increasing at a much faster rate than the associated increases in production. Joachim von Bruan from
IFPRI has stated that while world food production is increasing by between one and two percent per annum,
the world population increased by around four percent per annum (World Food Crisis, 2008).

91
• Consumer driven
The integration of the demand side of the food chain changed the world from a production driven market to a
consumption driven market. This led to an increase in the variety and options of products available to
consumers (www.newmediaexplorer.org). This is primarily caused by higher consumer awareness and will
increase in future as consumer awareness increases.
• Changing disposable incomes
A shift to more luxurious products can be seen as the consumer’s disposable income increases. Consumers
will generally not buy more bread when a higher disposable income is earned. A shift towards starch substitute
foods such as pasta, potatoes and rice is often seen.
• Convenience and health
Consumers are increasingly seeking for products that are healthy without compromising convenience.
Consumers prefer to use and or eat “on the go” food products as they want to buy, prepare and eat in the
quickest, easiest way possible (Staff reporter, 2005).
More recent issues
• Traceability
Another future high growth area is traceability. It is becoming increasingly important for consumers to know the
exact origin of the seed stock as well as the process of production from planting, harvesting and post harvest
processing to guarantee the purity of the final product (www.newmediaexplorer.org, 2007).
• Sustainability, food safety and green movement
Sustainability in the agricultural sector has become an important issue as consumers demand safe, clean, as
well as green products because of diseases related to health scares and uneasiness regarding the production
and consumption of genetically modified products such as wheat (www.reeis.usda.gov, 2007). The application
of genetically modified wheat will however aid in increasing production as more valued crops will be planted on
less land (www.newmediaexplorer.org, 2007). The issue of producing agricultural produce in a green
environment makes the provision of food to the hungry a difficult task.
• Emerging farmers
Emerging farmers in the wheat industry face problems regarding affordable storage facilities and transport,
much needed mentorship programs guiding them to become commercial farmers as well as the lack of
opportunities to obtain loans to produce high quality, marketable wheat (Nyathi, 2009).

92
• Land reform
According to Tina Joemat-Pettersson, South African minister of Agriculture, Forestry and Fisheries,
commercial farmers in South Africa play a vital role when it comes to producing sufficient quantities to try and
change South Africa from being a net importer of food to being a net exporter. She stated that this will not be
possible if all arable land is in the hands of subsistence farmers. Critics of land reform have argued that the
current land reform policy harmed agricultural investment more because it took agricultural land out of the
hands of commercial farmers (www.sagoodnews.co.za, 2009).
• Food security
Consumers of the world’s poorest nations are often the hardest struck when it comes to the food security
crisis. Consumers in these countries are suffering form severe, unrelieved malnutrition. The World Health
Organization (WHO) identified 7 factors that may add to the global food security crisis. These are (WHO,
2010):
- Increasing prices of energy
- Insufficient investment in global agriculture
- Higher incomes and economic growth stimulate demand for food
- Subsidies leading to trade distortions
- Persistent unfavourable weather conditions and environmental degradation
- Subsidized bio-fuel production substituting the production of food
- Imposition of export limitations leading to hoarding and consumers buying out of panic

93
3.6 CURRENT ISSUES IN THE GLOBAL WHEAT INDUSTRY
Genetic improvements in wheat production
Greater genetic improvements are possible when public and private institutions collaborate especially
regarding investment in wheat breeding. The National Association of Wheat Growers (NAWG) would like to
see biotech traits like drought, disease and cold tolerance, nitrogen efficiency, improved yields and
improvements in colour and flavour. All of these could possibly lead to increased profits on farm level
(Schroeder, 2010).
South American wheat production
Vilmorin Corporation is one of the largest seed producers in the world and operates under Limagrain, the
French cooperative, who just created a joint venture with Don Mario the Argentine seed producer. This
partnership is aimed becoming the global leading supplier of wheat seed and at developing wheat and the
production of wheat in South America with special focus on Argentinean wheat production. The focus on
increasing Argentinean wheat production is partly due to the reduction in wheat production over the past ten
years (Kroll, 2010).
Recession impacting on bread consumption
During times of recession competition, especially in the milling industry is extremely fierce. It was reported that
consumers respond to the recession by switching the types of breads that they eat. Consumers typically
switched from consuming rolls and baps to consuming less expensive sliced breads. A drop in organic,
‘healthy’ bread and whole-meal bread sales was also noted. It seems as if consumers are less prone to
experiment during times of recession and prefers the basics. Consumers thus prefer cheaper products that
they know and like (Lyddon, 2010).
Trends in global wheat flour trade
Flour shipments are expected to set a new record for the third consecutive year. The International Grains
Council (IGC) expects the world wheat flour trade to increase with 3 percent to reach a new peak of 12.85
million tones for the year ending June 2010. Kazakhstan, Turkey and the EU are the main exporters of wheat
flour with 23.8 percent, 18.3 percent and 11.1 percent respectively. Afghanistan is regarded as the largest
importer of wheat flour with 1.6 million tones (Sosland, 2010).

3.7 BUSINESS MODELS OF THE FUTURE
The wheat milling industry and all stake
current and future business and market environment. Continuous
development is required to be able to cope with changes and to be able to ensure sustainable growth.
47 below is a representation of the elements needed for a business model to be able to function successfully
given that all three aspects are included into the strategic knowledge of t
Figure 47: Business Model Template
Source: Abell, 2009
Based on the model of Abell (2009) management of a business must focus on the three segments as follows:
• Customer: Who is the customer that the
• Value proposition: What will be offered to the customer in the future?
• Resources & capabilities: How will the ‘offer’ to the customer be delivered and value added in the
processes
The development of business models
sustainability as the core for decision
Pearson (2010), a renowned futurologist
in 2020.The following trends were discussed by him:
• “The increasing political and economic dominance of emerging markets will cause global companies to
rethink and customize their corporate strategies.
BUSINESS MODELS OF THE FUTURE
The wheat milling industry and all stake-holders need to be able to engage successfully in the rapidly ch
current and future business and market environment. Continuous changing business models and structure
development is required to be able to cope with changes and to be able to ensure sustainable growth.
below is a representation of the elements needed for a business model to be able to function successfully
given that all three aspects are included into the strategic knowledge of thinking in an organisation.
Business Model Template
Based on the model of Abell (2009) management of a business must focus on the three segments as follows:
Customer: Who is the customer that the business will be serving in the future?
Value proposition: What will be offered to the customer in the future?
Resources & capabilities: How will the ‘offer’ to the customer be delivered and value added in the
The development of business models for the future should focus on the customer with the environment and
sustainability as the core for decision-making and strategy, according to the IIED (2009).
Pearson (2010), a renowned futurologist, shared his personal view on how the world of business
in 2020.The following trends were discussed by him:
The increasing political and economic dominance of emerging markets will cause global companies to
rethink and customize their corporate strategies.
94
need to be able to engage successfully in the rapidly changing
business models and structure
development is required to be able to cope with changes and to be able to ensure sustainable growth. Figure
below is a representation of the elements needed for a business model to be able to function successfully
hinking in an organisation.
Based on the model of Abell (2009) management of a business must focus on the three segments as follows:
Resources & capabilities: How will the ‘offer’ to the customer be delivered and value added in the
for the future should focus on the customer with the environment and
making and strategy, according to the IIED (2009).
shared his personal view on how the world of business can look like
The increasing political and economic dominance of emerging markets will cause global companies to

95
• Climate change will remain high on the agenda as companies seek to explore resource efficiency to
improve the bottom line and drive competitive advantage.
• The financial landscape will look vastly different as increasing regulation and government intervention
drive restructuring and new business models.
• Governments will play an increasingly prominent role in the private sector as demand for greater
regulation and increasing fiscal pressures dominate the agenda.
• In its next evolution, technology will be driven by emerging-market innovations and a focus on instant
communication anytime, anywhere.
• Leaders will need to address the needs and aspirations of an increasingly diverse 21st century
workforce.
The way that business leaders plan for — and respond to — these trends over the next decade will help
determine who the market leading companies of tomorrow will be (Pearson, 2010 in [Earnest & Young, 2010).
Professor Mohammed Karan addressed the conference of the Agricultural Business Chamber (ABC) congress
2010, held in Somerset-West in the Western Cape on behalf of the National Planning Commission (NPC). The
NPC have a vision towards 2025 to look at agriculture in a new light. They are currently searching for a new
paradigm for agriculture. The main focus of the strategy planning according to Professor Karan (2010) is to
answer ‘what is urgent’ and ‘what is important’. Thus the NPC will focus on the following:
• ‘Cry the beloved countryside’
• Rediscover our role in the economy
• Getting past the ethical issues and stigmas
• The viability and role of the small scale farmers
• Assisting new entrants
• How to help the poor do better
• Serious lack of transformation
• Trust and contracted arrangements
• Implicit subsidization and multi-functionality
• The food security conundrum
• Water

96
• Competition issues
• Extending into Africa
• Public research quo vadis
• Future of family farms
• Private equity in agribusinesses
• Education and professional development
• Nature of growth
• Gender issues
• Climate change
If the NPC can succeed in finding effective solutions to overcome these paradigms, then agriculture in South
Africa can grow sustainably. However in the mean time, agribusinesses will have to adapt their business
models to make provisions for these paradigms as well.
“Business must build their own capacities to work effectively for sustainable development, and engage in
strategic alliances with other enterprises, financial service providers, government agencies development
practitioners and communities” (IIED, 2009). This should also apply to the National Chamber of Milling.
As indicated by the IIED (2009) the following key principles incorporated in the three elements of a business
model need to be joined in strategic planning:
• “...the ‘value proposition’ of a business model for sustainable development needs to be considered in
terms of financial, environmental and social values.”
• “...the company needs to look not only at value creation and capture for itself and its customers, but
also value distribution throughout the market chain.”
• “The more effective the long-term business model for sustainable development are designed and
implemented via collaboration.” (IIED, 2009)

97
Although each business and industry have a different approach to these core principles, at the end the value
added to the business, the value chain and final customer remains paramount. Agriculture and agribusinesses
today faces huge challenges. Cooperation and co-creation of new knowledge markets is essential in the
debates concerning the future of agribusiness, agriculture and the environment. Most issues require
involvement not only from the business community and knowledge institutions, but also different levels of
government and a diverse set of societal organizations.
Many (international) organization and companies are working to ensure a future for agriculture that is
sustainable in terms of economic growth and environmental and societal values. In a broader perspective,
those organizations generally work towards the same goal, but focus on different aspects of the agricultural
arena or have a different mode of operation. Still, there is no clear recipe on how to work on this challenge and
with whom. We are still in the experimental stages.
Organisations and businesses of the future will have to adapt and change their current core business models
and short sighted visions of the present. This is to be able to facilitate the following and ongoing changes in
the business and market environment, and answer the questions raised on the future of the milling industry.
The continuing reshaping and changes in the world’s economies and financial markets are key principles to
consider how to manage the external business environment and retain and develop current core businesses.
Business’s scenarios of the future and how the unfolding of these scenario’s can potentially impact on the
business must be developed and tested by expertise within the organisational and strategical planning of the
board of directors. Dynamic and pragmatic business models for the future are required and contingency plans
must be in place to focus on current and future risks, structural changes and unforeseen shocks.
Environmental conflicts within the food system are not a new concept to agriculture, rather an overlooked
concept. Business models of the future will have to determine continuously creating sustainable growth given
the environmental impact. In South Africa, for example, the rights of water are beginning to have a major
impact as a restriction on farm expansion. Without farm expansions, industries cannot grow sufficiently and
thus do not adhere to the goal of sustainable growth.
Technology and innovation implementation in meeting food system challenges needs to be up to standard and
globally competitive. New methods and machinery needs to be implemented to lower costs and increase
production efficiency and competitiveness without increasing the cost to the consumer. The harness of
renewable energy needs to be used in running this technologically advanced machinery to further reduce harm
to the environment.

98
Responsible food supply systems as well as the effectiveness of system optimalisation are critical for
businesses to build their business models for the future. The effectiveness of today’s systems means the
downfall tomorrow if no improvements are made to the supply chain infrastructure, communication systems,
logistics and control.
Human capital development and management issues are a growing concern for the future. During the 2009
AEASA conference in Durban, it was emphasised that there are not sufficient technical expertise, trained
agricultural economists, extension officers and industry leaders in South Africa to supply in the demand for
trained expertise. Organisations must invest into programmes to train new graduates in the respective fields of
agriculture.
The following issues can impact on the South African agricultural landscape and new questions needs to be
asked about the future environment in which they operate:
• Correcting the structural imbalance of maize exports, soybean and wheat imports in SA agriculture
• The impact of government policies on various aspects of agriculture and economy of SA
• EU farm subsidies that will phase out
• USA exports will be competitive given the devaluating currency
• South Africa will have a strong currency because of other structural weaknesses in other countries
• Agricultural growth markets will shift with the realignment of exchange rates
• In the past there has been too large focus on traditional markets. This lead to increasing the South
African concentration risks
• The South African agricultural industries are under pressure. The increase in economies of scale as
well as capital intensity, yield increases and diversifying can result in lower numbers of small scale
shareholders because they have difficulty to establish themselves in the current market environment –
a dichotomy in terms of establishing more emerging farmers.
• The lack of agricultural policy guidelines will change the way in which markets are shaped
• The impact of the emerging BRIC countries, and how these countries will handle imports and exports
• The impact of China on the world, and how this impact will change exports and imports

99
• The current state of the South African infrastructure. The lack of maintenance and infrastructural
development will result in decreased competitiveness and higher costs to the consumers
• The environment and green movements are becoming a major concern to all. This needs to be
factored into the strategical thinking of organisations to address value adding without damaging the
environment
• The alliances and relationships formed within the supply chains as well as the ownership of an entire
supply chain structure
• The continuous investigation of the Competition Commission and the impact on businesses. If the
Competition Commission keeps focussing on individual large businesses (being highly integrated on
all levels in the supply chain) the result may be that these groups may source from outside companies.
• Continuous talk on land redistribution and the nationalisation of farm land in South Africa
• The lack of appropriate governmental involvement in creating a sustainable growing agricultural sector
without down grading methods
• Ownership arrangements into BEE
Given the above, the business model of the future will have to be pragmatic and focus on the following:
• Sustainability
• Climate change
• Emerging farmers/markets
• Technology
• Systemic risks
• The balance of power
Wheat farmers, wheat millers and the industry as a whole can develop an acceptable business model to focus
not only on the current market environment but also to create value to customers in the future. The SWOT
analysis of these industries, as earlier mentioned, assists in forming the core foundation and structure of the
business model. Without this vision structure to expand upon and revise continuously, a business will not be
able to create sustainable growth for the future.

100
3.8 THE ROLE OF THE COMPETITION COMMISSION
The Competition Commission of South Africa is a statutory body constituted in terms of the Competition Act,
No 89 of 1998 by the government of South Africa that has the power to investigate, control and evaluate
restrictive business practices, abuse of dominant positions and mergers to achieve equity and efficiency in the
South African economy (CompCom, 2010A)
From the preceding paragraph it is eminent that the Competition Commission’s main role and purpose is to
establish an environment that is conducive for business and sound competition. The milling industry has been
under investigation by the Competition Commission during the past five years. In a press release by the
Competition Commission on 15 March 2010 findings of research done was referred to the Competition
Tribunal against various wheat milling businesses. In the investigation, the Competition Commission found that
various wheat milling businesses contravened the Competition Act by engaging in price fixing and dividing
markets by allocating customers (CompCom, 2010B). They further feel that this action inhibited small bakeries
from being effective competitors (CompCom, 2010B).
The Competition Commission is of the opinion that this unlawful action by some millers resulted in them being
dominant and have excessive market power. According to the Kirsten (2007), market power refers to the ability
of millers to raise their selling price and depress input prices to deter entry, to redistribute profits to oneself,
from other firms and to sustain these benefits over time. Kirsten (2007), further identifies that a firm is
dominant in a market if it has at least 45 percent market share. In the case of the top four wheat millers in
South Africa, they represent 40 percent of the market share in 2007, according to the IDC (2010).
Following the investigation by the Competition Commission and findings to the Competition Tribunal, the
Competition Commission issued another press release on 3 June 2010. In this press release the Competition
Commission urged all millers of white maize and wheat to come forward and to settle the cases by
cooperating. This cooperation implies full disclosure of information, facts, communication or data relating to the
firm’s participation in, or information about cartel activity in the milling industry (CompCom, 2010C).
From the preceding section it is clear that the Competition Commission succeeded in its role to investigate,
control and evaluate restrictive business practises. The relevant importance of a Competition Commission in
South Africa is very important and will ensure that business is conducted in a fair manner and that competition
within an industry is enhanced. However, at present conducting business within the milling industry is very
uncertain. Millers in the industry are very hesitant in providing information to anyone out of fear of prosecution
by the Competition Commission. Various wheat millers were unwilling to participate in the interviews or share

101
information about the industry or their business environment in the proposed study, making a representative
and accurate study that adds more value to various stake holders within the industry, difficult. Policy makers
can also benefit from an industry where information is shared freely, in that decisions made will be based on
accurate data and information.
The Commission should ensure that the industry, which in principle is in favour of what the Commission does,
plays the role of a fair watch dog that protects businesses and prosecutes guilty parties. Clear rules of the
game regarding exchange of information at various levels are required. The Competition Commission should
establish a business environment where information is collated, and shared freely and where there is trust
amongst the relevant parties. This will increase the wheat milling industry’s potential to develop and compete
freely, and also supply important relevant industry information to make policy decisions, to create industry
benchmarks, to develop new business models and for purposes of research.

102
CHAPTER 4 DATA ANALYSIS AND RESULTS
4.1 INTRODUCTION
The chapter that follows, provides an in depth analysis of the results that were obtained in the study. As
mentioned in chapter 1, in total 15 interviews were conducted of which 10 were wheat millers and five bakers.
An effort was made to conduct interviews with small, medium and large scale wheat millers and bakers. One
of the four biggest wheat millers was interviewed to capture the opinions of the four largest wheat millers. This
was only to provide a level of measurement between the large scale wheat millers and baker and their smaller
scale counterparts. For the purpose of the study, wheat millers and bakers will be seen as a holistic unit,
because of their interrelatedness between them..
It must be noted that many wheat millers and bakers were in general unwilling to make themselves available
for the study, pending the investigation by the Competition Commission. Especially larger scale bakers were
unwilling or unavailable. It is however, important to take note that over the years the number of bakers has
declined as they were forced out of the markets by retail outlets. The retail outlets had the advantage of a one-
stop shopping experience over the bakers. An effort was also made to capture the opinions of retail outlets to
supply information on how they perceive the wheat milling and baking industries. This was not successful.
4.2 STRUCTURE OF THE INTERVIEWS
The wheat millers and bakers differed from one another in the number of years in business, the milling and
baking capacities and the total investment in buildings and machinery. This classification ensured that a more
precise and consistent study can be conducted and that the opinions of all millers and bakers are captured.
The structure section of the study was divided into wheat millers and bakers, to give a general feeling on the
various interviewees that were conducted.
4.2.1 STRUCTURE OF WHEAT MILLERS INTERVIEWED
As mentioned above, wheat millers can be classified according to the number of years of experience and the
size and scale of production. The years of experience category ranged from less than 10 years, from 11 to 20
years and more than 20 years of experience. Figure 48 below shows that of the total wheat millers
interviewed, 44 percent has less than 10 years of experience, 33 percent has between 11 and 20 years and
the remaining 22 percent has more than 20 years of experience.

103
Figure 48: Years of experience of wheat millers
The study further divided the wheat millers into either a small, medium and large scale milling capacity. A small
scale wheat miller mills between 0.5 and 25 tons per day, a medium scale wheat miller mills between 26 and a
100 tons per day and a large scale wheat miller mills more than a 100 tons per day. Figure 49 gives a
breakdown of the size and scale of the wheat millers interviewed. From the figure it is clear that out of the total
wheat millers interviewed, 10 percent are in the large scale category, 30 percent represents the medium scale
category, with the remaining 60 percent milling wheat on a small scale.
Figure 49: Size and scale of wheat millers interviewed
The last classification of wheat millers indicates the capital investment the miller has made.. Various efforts
were made to identify the cost of machinery a new wheat miller would have to pay. Mill equipment sellers
indicated that for a milling machine that has a small scale capacity, a new market entrant can expect to pay
10 - 20 years
33 %
>20 years
22 %
<10 years
44 %
Small scale
60 %
Medium Scale,
30 %
Large scale
10 %

104
R700 000. A milling machine that has a medium scale capacity, would require a capital investment in
machinery of between R1.2 million and R5 million . For a large scale milling machine, one can expect to pay
R1 million per ton per hour. The above classification is only for the milling equipment and excludes the capital
requirements in storage, buildings, raw materials, other overheads and vehicles. This is an illustration of the
capital requirements that is needed by wheat millers to start operations. A new market entrant must have
access to more than a R1 million to start operations, if he/she mills on a small scale. This is a reason for the
large number of small scale millers who participated in the study. Access to capital is a constraint for new
market entrants. Milling equipment sellers indicated that in order to make the milling of wheat worth while,
more than 300 tons of wheat must be milled per month. That is equivalent to around R1.5 million in capital
requirements.
In conclusion, the average wheat miller interviewed has less than 10 years experience, mills on a small scale
and has a total capital investment in machineries, buildings and vehicles of between R1 million and R2 million.
For the purposes of the study to identify factors that limit agro-processing development in rural areas, the
interviews conducted with the average wheat miller as explained will be a true reflection of the wheat milling
industry.
4.2.2 STRUCTURE OF BAKERS INTERVIEWED
As was mentioned in section 4.2.1 classification of the interviewees was on the basis of the number of years of
experience and the size and scale of operations. The years of experience for the interviewees ranged from
one to 10 years, from 11 to 20 years and more than 20 years experience. Out of the total bakers interviewed,
20 percent indicated that they have more than 20 years experience, 40 percent indicated that they have
between 11 and 20 years experience and the remaining 40 percent indicated that they have less than 10 years
experience. Figure 50 indicates the years of experience for the bakers interviewed.
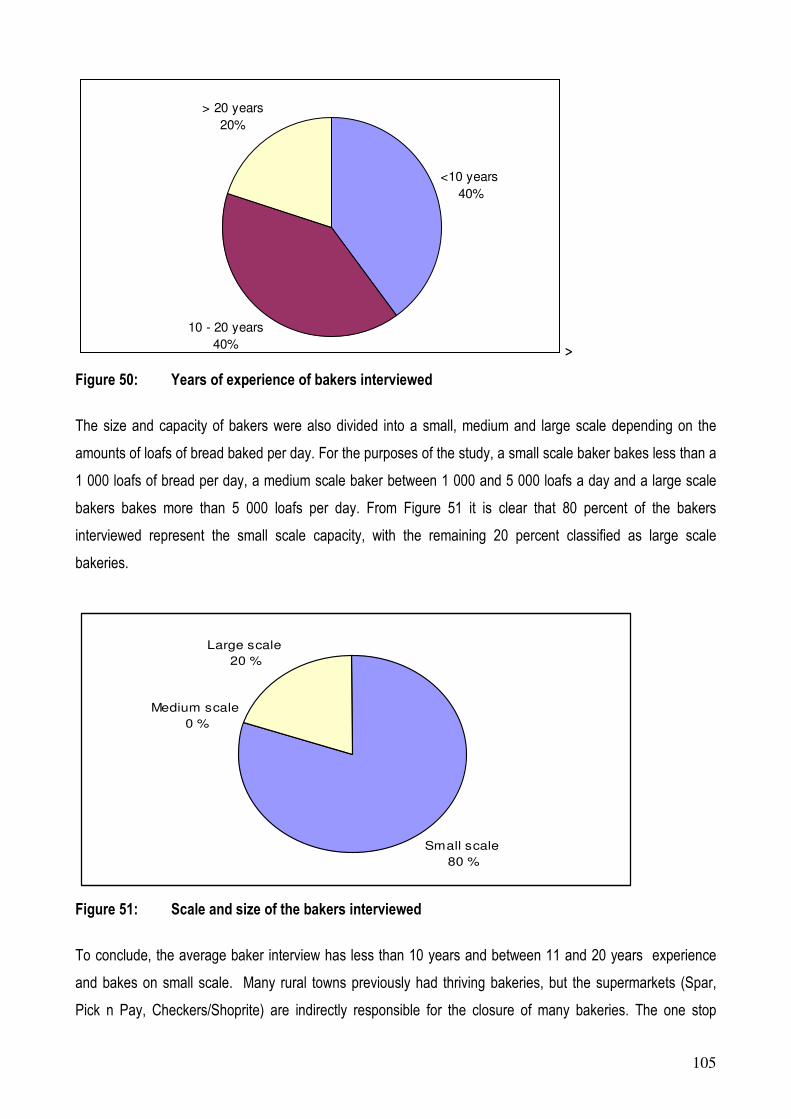
105
>
Figure 50: Years of experience of bakers interviewed
The size and capacity of bakers were also divided into a small, medium and large scale depending on the
amounts of loafs of bread baked per day. For the purposes of the study, a small scale baker bakes less than a
1 000 loafs of bread per day, a medium scale baker between 1 000 and 5 000 loafs a day and a large scale
bakers bakes more than 5 000 loafs per day. From Figure 51 it is clear that 80 percent of the bakers
interviewed represent the small scale capacity, with the remaining 20 percent classified as large scale
bakeries.
Figure 51: Scale and size of the bakers interviewed
To conclude, the average baker interview has less than 10 years and between 11 and 20 years experience
and bakes on small scale. Many rural towns previously had thriving bakeries, but the supermarkets (Spar,
Pick n Pay, Checkers/Shoprite) are indirectly responsible for the closure of many bakeries. The one stop
10 - 20 years
40%
<10 years
40%
> 20 years
20%
Small scale
80 %
Medium scale
0 %
Large scale
20 %

106
service offered by the supermarkets changed the buying behaviour of many rural consumers. For the
purposes of the study, this average baker will give valuable insight into the objective of the study to identify
factors that limit development in the baking industry.
4.3 CONDUCT OF WHEAT MILLERS AND BAKERS INTERVIEWED
4.3.1 INTRODUCTION
As mentioned before, the data results and interpretations will capture the opinions of wheat millers and bakers
because of their interrelatedness with each other. The conduct of the wheat millers and bakers interviewed
refers to the patterns of behaviour that market participants adopt to affect or adjust to the market in which they
buy or sells (Aleksandrova & Lubys, 2004) The conduct of wheat millers and bakers section includes the
following; a detailed analysis of the competitive environment in which they must operate, a detailed analysis of
the Strengths, Weaknesses, Opportunities and Threats (SWOT) of the various wheat millers and bakers
interviewed, the identification of the critical areas of a wheat milling and baking business, the reporting of the
associated issues/constraints/challenges of the industries, the identification of barriers to entry and exit of
wheat millers and bakers, the procurement decisions wheat millers and bakers make, the impact of imports,
exports and sales on the wheat milling and baking business, the identification of risks that impact on the daily
operations of wheat millers and bakers and the evaluation of support structures by the Dti and government.
The section concludes with an analysis of the financial performance of wheat millers and bakers over the past
years.
4.3.2 LEVEL OF COMPETITION IN WHEAT MILLING AND BAKING
The level of competition serves as an indicator of the long term sustainability of an industry. A high level of
competition indicates market powers and monopolistic behaviours of key stakeholders within an industry. A
high level of competition further enhances product differentiation and makes sure that the needs of the
customers are met. The level of competition should not be too high to prevent new market entrants from
entering the market while it should also not be too low that it will lead to a monopolistic situation. Low levels of
competition will lead to customers being exposed to unnecessarily high prices and a one dimensional product.
It is therefore vitally important to ensure that the level of competition is at a healthy level which will benefit
producers and customers alike. From the outset of the study, special emphasis was put on the relevant
importance of the level of competition within the wheat milling and baking industries.

107
The opinions express by wheat millers and bakers on the level of competition within the wheat milling and
baking industry is illustrated in Figure 52. From this figure it is clear that not one respondent indicated that
there is no competition in the wheat milling and baking industry. Out of the total respondents, 40 percent
indicated that the level of competition within the wheat milling and baking industry is competitive. Having said
that, it does not mean that there is more competition in the wheat milling and baking industry than what one
would find in any normal business environment. The remaining 60 percent indicated that the wheat milling and
baking industry is highly competitive and forces new market entrants out of the market. This is in stark contrast
to the findings of the Competition Commission who found that there is a cartel in the milling industry. This
investigation is the next step in a process that began in the Western Cape in 2006 when a shopkeeper, Imraan
Ismail Mukaddam, complained to the Commission about the existence of a bread cartel.
The parties investigated possible cartels amongst Pioneer Foods, Foodcorp, Godrich Milling, Premier Foods
and Tiger Brands. Premier Foods, Tiger Brands, Foodcorp and Pioneer Foods control about 90% of the local
wheat flour market and supplied their own bakeries, as well as independent bakeries with flour, with only
Godrich with less significant size. A cartel was found to exist and those involved were fined. But the bread and
wheat industries are highly intertwined — for example 40% of the flour milled at Foodcorp’s Ruto Mills is used
in the production of its own brand of bread, Sunbake. When Premier confessed to its involvement in the bread
cartel, it revealed the existence of the national wheat milling cartel.
Figure 52: The level of competition perceived by wheat millers and bakers interviewed
The respondents indicated that the only way to cope with this high level of competition is to deliver a high
quality product on time and with good service at a market related price. Small scale millers and bakers felt
exposed to prices, especially when the large scale millers and bakers want to enter their markets. They feel
No competition
0%
Competitive
40 %
Highly
competitive
60 %

108
that large scale millers and bakers have the necessary cash flow to start price wars which forces small scale
millers and bakers out of the markets. Large scale millers and bakers, on the other hand feel that the wheat
milling and baking industry has low barriers to entry which makes it easy for new market entrants to enter the
market, thereby increase the level of competition in their market environment. Small scale bakers also
indicated that the larger bakers offer a bread less than 700g to the consumer. It is difficult for the small scale
baker to adapt his/her baking process to accommodate for smaller bread and looses as a result cash strapped
consumers. Many consumers are also unaware of the different weights. Commissioner Shan Tamburuth from
the Competition Commission commented that “In addition to the negative effect of this conduct on consumers,
it has also inhibited small bakeries from being effective competitors”
(http://www.researchchannel.co.za/article/competition-commission-seeks-fine-for-wheat-milling-cartel-2010-03-
15).
The competition between large scale millers and bakers vs. the rest of the industry, was also a very important
objective of the study. It aimed to identify the role the large scale millers play in the wheat milling and baking
industry in terms of competition. Out of all the respondents, 85 percent indicated that they have direct
competition from the large scale millers and bakers, with only 15 percent indicating that the large scale millers
have no influence on their wheat milling and baking business. From the 85 percent that indicated that they
have direct competition from the large scale millers and bakers, 82 percent indicated that this competition from
the large scale millers and bakers is detrimental to their operations. Figure 53 below indicates the perception
by the respondents on whether they have competition from the large scale millers and bakers or not.
Figure 53: Perceived competition with large scale wheat millers and bakers
The major reason given for this perception by the respondents, is that they feel large scale millers and bakers
can start price wars to enter a smaller scale wheat miller or bakers’ market. This position of large scale millers
0
10
20
30
40
50
60
70
80
90
Percentage 85 82 18 15
Yes Detrimental Beneficial No

109
and bakers to start price wars is backed by their strong cash flow positions. Many bakeries also alluded to the
fact that many of the large scale wheat millers own nearby bakeries against which the smaller scale bakeries
compete. This leaves the smaller scale bakery exposed to the situation where the large scale wheat millers’
sells flour to his own bakery at a much lower price than what the smaller scale bakery can procure. The
smaller scale bakery’s competitors can deliver a product at a much lower rate than what he can, forcing him
out of the market.
In conclusion, the level of competition perceived by wheat millers and bakers are high as they feel that all the
wheat millers and bakers sell a homogenous product, at a price set by market conditions and that a large
number of millers serve the same market space. Some of the respondents feel that it is too high, forcing them
out of the market. However, a large portion of respondents indicated that there is still capacity left in the county
to increase wheat milling and baking on a small scale. What the study did find is that much more must be done
to protect the smaller scale wheat millers and bakers against the large scale millers and bakers as they have
the capital and cash flow requirements to distort the markets and increase the level of competition in the
market.
4.3.3 STRENGTHS, WEAKNESSES, OPPORTUNITIES AND THREATS (SWOT) ANALYSIS
The Strength, Weaknesses, Opportunities and Threats (SWOT) analyses is useful tool when analysing an
industry.. For the purposes of this study, it was vitally important to identify the strengths of existing wheat
millers and bakers, as this will aid in understanding the reason why they are still in business. The strengths of
any business are those factors that an existing wheat miller or baker has over his competitors and rivals and
which gives him a competitive edge in doing business. On the other hand, by identifying weaknesses of
existing wheat millers and bakers, the study can discover what areas in the wheat miller and baker’s business
are in need of attention. In a perfect world, a wheat miller and baker would want to, as far as possible, address
these weak areas of the business and eventually turn them into relative strong areas of the business. By doing
this, the long term sustainability of the wheat miller and baker will be assured. The weak areas represent those
areas of the business in which the wheat miller and baker has a competitive disadvantage compared to his
competitors. Opportunities are vitally important in any industry and represent an indicator of the overall well-
being of the industry. It is crucial for the long term sustainability of the industries that opportunities be
identified. The study emphasised this fact and also identified possible opportunities. An opportunity therefore
can be classified as a new market idea or product development. The last part of the SWOT analysis is to
identify the threats that exist in the wheat milling and baking industries. Threats are issues external to the
business and over which the wheat miller and baker has little control and needs to take account of and plan
for.
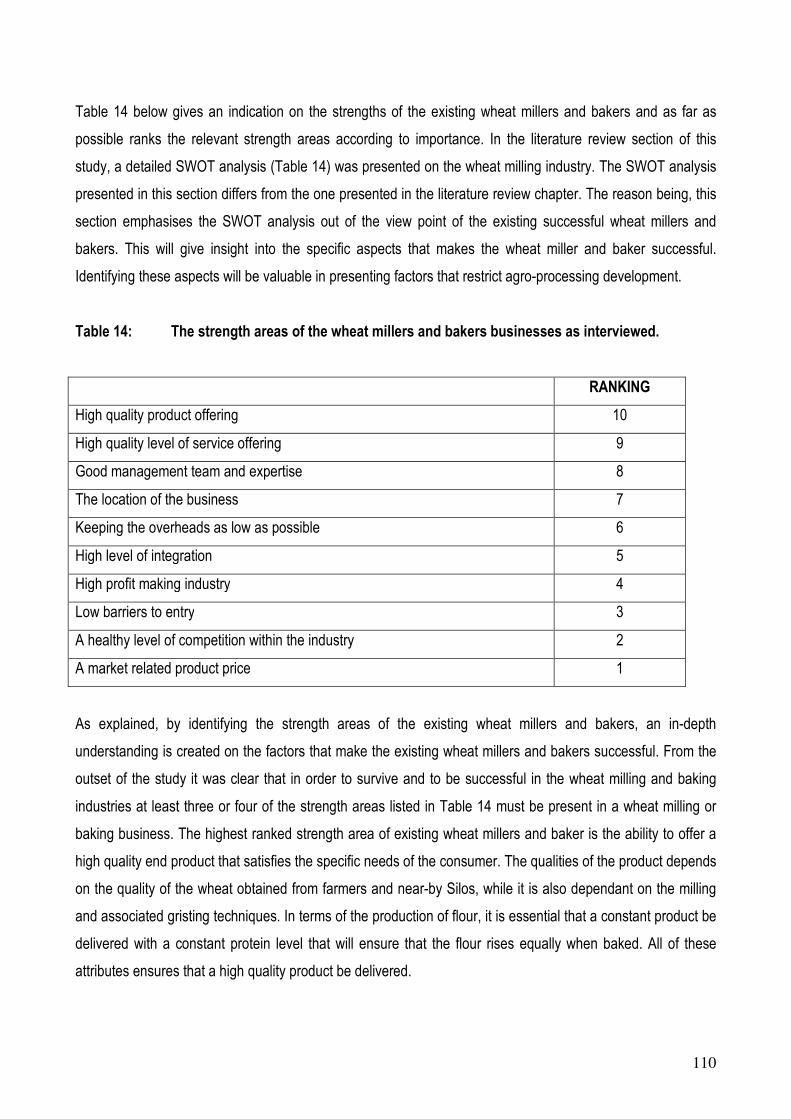
110
Table 14 below gives an indication on the strengths of the existing wheat millers and bakers and as far as
possible ranks the relevant strength areas according to importance. In the literature review section of this
study, a detailed SWOT analysis (Table 14) was presented on the wheat milling industry. The SWOT analysis
presented in this section differs from the one presented in the literature review chapter. The reason being, this
section emphasises the SWOT analysis out of the view point of the existing successful wheat millers and
bakers. This will give insight into the specific aspects that makes the wheat miller and baker successful.
Identifying these aspects will be valuable in presenting factors that restrict agro-processing development.
Table 14: The strength areas of the wheat millers and bakers businesses as interviewed.
RANKING
High quality product offering 10
High quality level of service offering 9
Good management team and expertise 8
The location of the business 7
Keeping the overheads as low as possible 6
High level of integration 5
High profit making industry 4
Low barriers to entry 3
A healthy level of competition within the industry 2
A market related product price 1
As explained, by identifying the strength areas of the existing wheat millers and bakers, an in-depth
understanding is created on the factors that make the existing wheat millers and bakers successful. From the
outset of the study it was clear that in order to survive and to be successful in the wheat milling and baking
industries at least three or four of the strength areas listed in Table 14 must be present in a wheat milling or
baking business. The highest ranked strength area of existing wheat millers and baker is the ability to offer a
high quality end product that satisfies the specific needs of the consumer. The qualities of the product depends
on the quality of the wheat obtained from farmers and near-by Silos, while it is also dependant on the milling
and associated gristing techniques. In terms of the production of flour, it is essential that a constant product be
delivered with a constant protein level that will ensure that the flour rises equally when baked. All of these
attributes ensures that a high quality product be delivered.

111
The second highest ranked strength area of wheat millers and bakers is their level of service delivery. This is
especially important for small scale wheat millers and bakers if they want to survive in these industries.
Smaller scale millers and bakers pointed out that they have a competitive advantage over the large scale
millers and bakers in that they can deliver a constant quality product on time and on a short notice. Large
scale millers and bakers do not have the structure to deliver products on short notice. However, smaller
millers and bakers must do more to exploit this competitive advantage which they have over large scale millers
and bakers.
The two highest ranked strength areas of wheat millers and bakers coincide with the third highest ranked
strength area, in that good managerial skills and expertise of management is essential to survive. One can not
produce a high quality product on time and on short notice without having the necessary managerial skills from
management. The interviewees also indicated that the wheat milling and baking industry requires
management to be actively involved at the business for almost 24 hours a day, 7 days of the week. This will
ensure that operations run smoothly and that wastage is kept to a minimum.
The location of the business was ranked as the fourth highest strength area of a wheat milling and baking
industry. The location is vitally important in that it should be close to silo’s which makes procurement of raw
material easier or it should also be close to your final consumer. Identifying the location of a wheat milling and
baking operations is the first crucial step in setting up the business for success.
In order to survive and to compete against the large scale millers and bakers in terms of product prices,
business overheads must be kept as low as possible. This overheads area of the business was ranked as the
fifth highest strength area of existing wheat millers and bakers. In order to keep overheads as low as possible,
a proactive step must be taken to do running repairs and maintenance of machineries by one self, specifically
the small millers.
The sixth highest ranked strength area of existing wheat millers and bakers is their ability to vertically integrate
their business as far as possible. The days are long gone that only one final product be produced in a
business. In order to survive, a wheat miller must create greater value by establishing a bakery, while a baker
must develop his business into a one-stop shopping experience for customer. The perfect scenario is where a
milling business is integrated with a bakery. However, this high level of integration requires top level skills. It
also requires additional capital outlays. Like any other large scale operation, it becomes more difficult to run
the business effectively. Nevertheless, a high level of integration is vitally important for the sustainability of the
business.

112
The seventh, eight, ninth and tenth highest ranked strength area of existing wheat milling and baking business
can be summarised as follows. The industry, when managed correctly is highly profitable, with low barriers to
entry. This results in a healthy level of competition which ensures that the various existing businesses stay
sharp and dynamic which will result in new product developments and ideas. It is lastly vitally important that
the pricing of the product be market related in order to survive and to sell products.
To conclude, the strength areas of existing wheat millers range from a high quality product to keep overheads
as low as possible and to pricing the product at a market related level. In order to survive any combination of
three or four of the above mentioned strength areas must be present. This gives valuable insight into the
factors that should be exploited in order to develop the wheat milling and baking industries in rural areas.
As mentioned before, the weaknesses of wheat millers and bakers as identified in this section vastly differ
from the weaknesses identified in Table 1 of the literature review section. The main purpose of this section is
to identify weaknesses of the various wheat millers and bakers still in operation. This will give some insight into
various weak areas that can be exploited and be changed into strength areas. Table 15 below summarises
and ranks the relative weak areas of wheat millers and bakers as interviewed.
Table 15: The weak areas of the wheat millers and bakers businesses as interviewed
RANKING
Motivated, loyal labour force 10
Obtaining the necessary capital requirements 9
Developing an effective marketing campaign 8
Handling bad debts 7
Acting against theft 6
Procurement and logistics management 5
Having high overhead costs 4
Increasing milling and baking capacity 3
Limit product differentiation 2
Cash flow positions 1
The first highest rank weak area of wheat millers and bakers are the inability of millers and bakers to find loyal
and motivated labourers. This problem is especially the fact in the rural areas where it becomes difficult to find
motivated and loyal labourers. The industry must attract dedicated and motivated labourers back to the
industry and provide them with the necessary skills to do the jobs. According to the Baker’s forum (2006), the
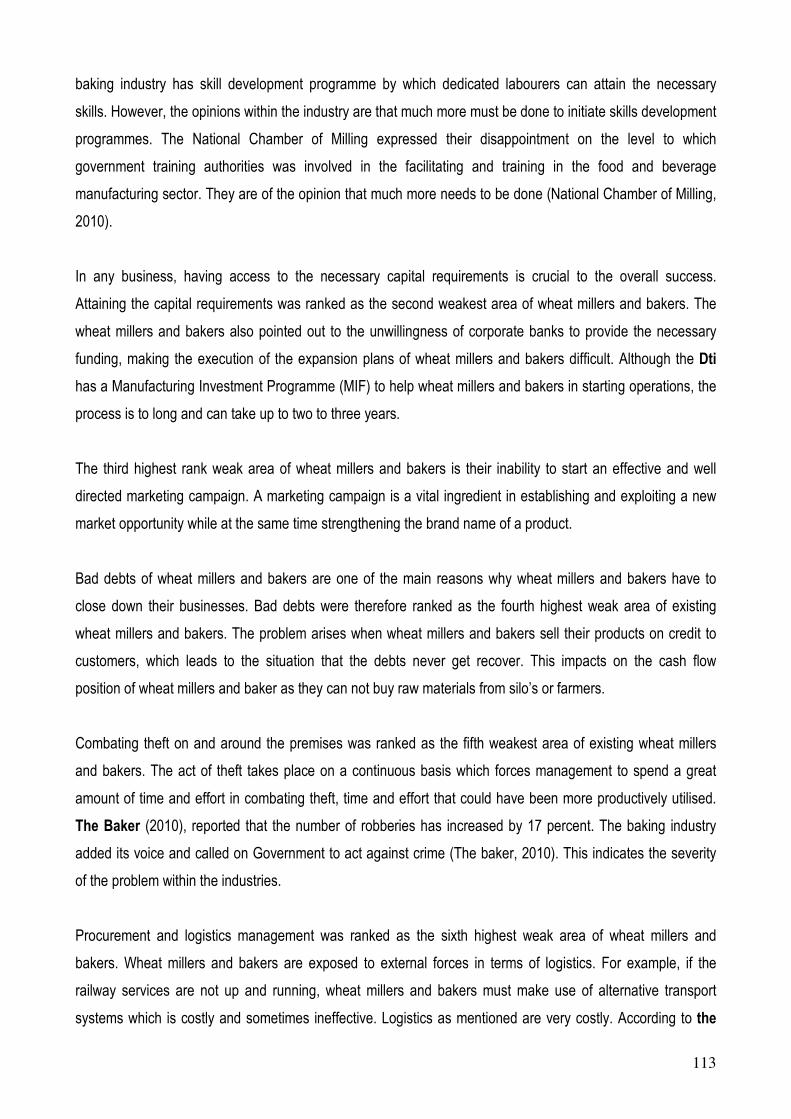
113
baking industry has skill development programme by which dedicated labourers can attain the necessary
skills. However, the opinions within the industry are that much more must be done to initiate skills development
programmes. The National Chamber of Milling expressed their disappointment on the level to which
government training authorities was involved in the facilitating and training in the food and beverage
manufacturing sector. They are of the opinion that much more needs to be done (National Chamber of Milling,
2010).
In any business, having access to the necessary capital requirements is crucial to the overall success.
Attaining the capital requirements was ranked as the second weakest area of wheat millers and bakers. The
wheat millers and bakers also pointed out to the unwillingness of corporate banks to provide the necessary
funding, making the execution of the expansion plans of wheat millers and bakers difficult. Although the Dti
has a Manufacturing Investment Programme (MIF) to help wheat millers and bakers in starting operations, the
process is to long and can take up to two to three years.
The third highest rank weak area of wheat millers and bakers is their inability to start an effective and well
directed marketing campaign. A marketing campaign is a vital ingredient in establishing and exploiting a new
market opportunity while at the same time strengthening the brand name of a product.
Bad debts of wheat millers and bakers are one of the main reasons why wheat millers and bakers have to
close down their businesses. Bad debts were therefore ranked as the fourth highest weak area of existing
wheat millers and bakers. The problem arises when wheat millers and bakers sell their products on credit to
customers, which leads to the situation that the debts never get recover. This impacts on the cash flow
position of wheat millers and baker as they can not buy raw materials from silo’s or farmers.
Combating theft on and around the premises was ranked as the fifth weakest area of existing wheat millers
and bakers. The act of theft takes place on a continuous basis which forces management to spend a great
amount of time and effort in combating theft, time and effort that could have been more productively utilised.
The Baker (2010), reported that the number of robberies has increased by 17 percent. The baking industry
added its voice and called on Government to act against crime (The baker, 2010). This indicates the severity
of the problem within the industries.
Procurement and logistics management was ranked as the sixth highest weak area of wheat millers and
bakers. Wheat millers and bakers are exposed to external forces in terms of logistics. For example, if the
railway services are not up and running, wheat millers and bakers must make use of alternative transport
systems which is costly and sometimes ineffective. Logistics as mentioned are very costly. According to the

114
Baker (2010) logistic costs increases around 1 percent per annum and represented 15.9 of the GDP. On
procurement, wheat millers and bakers are exposed to price volatility of wheat prices. A detailed analysis of
price volatility was presented in section 3.3.5.
As explained in the strength area section, keeping the overheads as low as possible is vitally important for the
success of the business. This fact was again stressed in the weak area section as some wheat millers and
bakers acknowledged the fact that they have high overhead cost, which they must offset against higher output
prices. The ability to keep overheads low was ranked as the seventh highest weak area of their businesses.
The ability to increase the milling and baking capacity was seen as a weak area of their respective businesses.
This inability to increase the milling and baking capacity when necessary is a function of the inability to attain
the necessary capital requirements as explained earlier. Milling and baking capacity was ranked as the eight
highest weak area of existing wheat millers and bakers.
The wheat milling industry is characterised as an industry with very little product differentiation abilities. Wheat
millers and bakers also pointed out this fact and mentioned and ranked it as their ninth highest weak area of
their business.
The last weak area mentioned by wheat millers and bakers was their respective cash flow positions. Wheat
millers and bakers indicated that managing the cash flow of the business is crucial to the overall success.
Cash flow positions are effected by wheat millers and bakers as they have to procure raw material on a cash
basis but in turn have to sometimes sell their product on a 30 to 60 day payback period. This was especially
the case for wheat millers and bakers that sell their product to retailers.
In conclusion, by identifying weak areas of existing wheat millers and bakers, valuable insight is given on the
areas of their businesses in which they struggle. The weak areas ranged from the inability to attain labourers
to their respective cash flow positions. In the efforts to identify factors that limit agro-processing development,
a great deal of the industry is learnt from reviewing the weak areas of existing wheat millers and bakers.
Opportunities of any industry can be defined as the ability of stakeholders in the industry to see new product
and market developments. From a long term sustainability point of view of the industry, identifying new market
and products developments is crucial. From the outset of the study, it was vitally important to identify possible
new opportunities as seen by the existing wheat millers and bakers. If new opportunities are identified, agro-
processing development in rural areas can be initiated. Table 16 below identifies possible opportunities that
can be exploited by the industry.

115
Table 16: Wheat milling and baking opportunities as identified by the interviewees
RANKING
Vertical integration of the various businesses 5
Wheat milling in rural areas 4
Expansion into retail market 3
Opportunity in milling other grain types (Diversification) 2
Increase in milling capacity 1
From the outset of the study it was clear that wheat millers and bakers feel that the biggest opportunity that
presents itself in the industry is vertical integration. As explained in the strength area section, vertical
integration represents the process by which wheat millers and bakers become one entity and sell a product
that has been processed to add value on the premises from the raw material (wheat grain) to the final product
being bread. This will ensure that input costs are been kept to a minimum which will result in a lower output
price. However, the trade off between having a lower input costs against a higher capital requirement that will
increase your overhead costs must be examined.
The respondents also indicated that there exists an opportunity to increase wheat milling in rural areas as
there is a lesser degree of competition. They also indicated that they feel consumption of flour increases in
rural areas when there is a shift in the communities’ level of income. Consumers’ preferences changes when
there is a shift in their level of income as they will change their consumption from maize meal to bread
products. Therefore, a shift in the level of income in rural areas presents the wheat milling and baking industry
with an opportunity to expand production.
Another form of opportunity, much the same as the opportunity as described above is to expand sales in the
retail sector during the periods when there is a change in the consumers’ preferences from maize meal to
bread products. However, this opportunity can lead to another problem in terms of cash flow as some retailers
have a 30 to 60 day payback period.
Diversification was another opportunity, especially for wheat millers. Some of the respondents indicated that
there is an opportunity in milling other types of grains for example maize and oats. However, the capital
requirements needed in adjusting the machinery can prove to be expensive.
The last opportunity encapsulates all of the opportunities presented above in that there exists an opportunity
for wheat millers and bakers to increase their production capacity as individuals.

116
From the above opportunities it can be summarised that there are opportunities within wheat milling and
baking, provided that the necessary capital requirements are available.
The last section of the SWOT analysis is dedicated to the threats that are present in the wheat milling and
baking industries. Threats as defined earlier, presents that issues that is external to the operations of the
wheat millers and bakers and over which he has no control. Table 17 summarises the threats as indicated by
existing wheat millers and bakers.
Table 17: Threats in the wheat milling and baking industries
RANKING
Ever increasing input costs (Electricity prices & Fuel prices) 5
An unhealthy level of competition within the industries 4
High levels of imported flour 3
Hiring motivated and loyal labourers 2
The act of theft taking place at premises 1
The highest ranked threat that exists within the industry, and over which wheat millers and bakers have little
control, is the rise in input costs. Wheat millers and bakers specifically amended to the increase in electricity
prices and fuel costs. With the 25 percent per annum increase in electricity prices for the next three years
looming over South Africa, wheat millers and bakers are exposed because of the industries high level of
electricity usage. This increase can lead to more wheat millers and bakers taken out of business because of
their inability to offset these increases into higher output prices. Smaller wheat millers and bakers will
especially be more exposed to electricity price increases.
Following the recent investigation by the competition commission into the wheat milling and baking industry,
tension was created on the level of competition that exists in the industry. Some wheat millers and bakers feel
that this investigation will leave the industry with a negative perception, impacting the long term sustainability
of the industry.
The third highest ranked threat that exists in the wheat milling and baking industries is the level of imports of
flour. A situation is created where wheat millers can be exposed to increases in the level of imports in the near
future.. However, at present the wheat milling industry is protected by additional import tariffs above the tariffs
imposed on wheat imports.

117
The fourth and fifth highest ranked threat was already mentioned in the previous section and can be
summarised as the threat of hiring highly skilled, dedicated and motivated labourers and the act of theft taking
place on wheat millers and bakers premises.
In conclusion, there exists many threats in the wheat milling and baking industry. The five highest ranked
threats that exist are presented and explained above. From a development point of view, much more should
be done to protect the wheat milling and baking industries against these threats.
4.3.4 CRITICAL AREAS OF A WHEAT MILLING AND BAKING BUSINESS
One of the objectives of the study is to identify the critical areas of a wheat milling and baking business. The
critical areas of the business represent the areas of the business that must be effectively managed in order to
secure the successfulness of the wheat milling or baking business. By identifying the critical areas of the
existing wheat millers and bakers, valuable insight on how successfully managed a wheat milling and baking
business are run. The views and opinions of the wheat millers and bakers interviewed can be summarised as
in Table 18. The table below ranked the ten most important areas of a wheat milling and baking business.
Table 18: The critical areas of a wheat milling and baking business as identified by the interviewees.
RANKING
Establishing of a well defined market (end consumer) 10
Effective management of the cash flow position 9
Knowledge of the wheat milling and baking 8
Effective cost management strategy 7
Procurement management 6
Obtaining and managing the required Capital 5
A high level of service delivery 4
The management of labour 3
Applied wheat gristing techniques 2
A well managed marketing campaign 1
From Table 18, the highest ranked area of a wheat milling and baking business is to clearly define and
establish the business end consumer or market. Before starting operations, questions including; who the final

118
consumer will be, in what geographical area will I sell my product, what distribution channel will I make use of
etc. must be answered. Identifying your market is the first crucial step in setting up your business for success.
As mentioned before, managing the cash flow of a wheat milling and baking business is crucial. The
interviewees indicated that managing the cash flow position is the second highest ranked area of the business.
Management of the cash flow position is especially important in the wheat milling and baking industries as
procurement and selling is mainly done a cash basis. Any delay in payment from the consumer can result in
cash flow problems.
The third highest ranked area of a wheat milling and baking business is the level of knowledge and experience
of management in the milling and baking industry. In order to be successful, knowledge and experience of
management is essential. Knowledge and experience refers to overall management of the business and the
techniques of milling and baking.
The wheat milling and baking industries are characterised as high volumes, low margin industries. Cost
management therefore is very important and will ensure that costs are kept to a minimum, crucial for the
overall success of the industries. Cost management refers to exploiting opportunities in reducing costs when it
presents itself, for example buying necessary raw material in bulk to reduce the cost per item, etc. and setting
the correct output price given the input and overhead costs. Cost management therefore was ranked as the
fourth highest area of a wheat milling and baking business.
Procurement management entails the procurement decisions of raw materials (including wheat grain) that
must be made in order to produce a consistent quality product. Procurement management further refers to
decisions of whom the suppliers of the raw materials will be, what percentage of the procurement will be done
on contractual basis, will SAFEX be used and what percentage of total procurement will be done on SAFEX?
Procurement management therefore was ranked as the fifth highest critical area of wheat millers and bakers.
As mentioned earlier, obtaining the necessary capital requirements and managing it in the correct manner, is
crucial to the overall success of wheat millers and bakers. Expansion of the business and increasing the
milling and baking capacities is dependant on the availability of capital. Wheat millers and bakers further
indicated that the correct management of the available capital is crucial and will ensure that funds are
available when necessary. Obtaining and managing capital was ranked as the sixth highest critical area of
wheat milling and baking businesses.
Service delivery in the wheat milling and baking industry, especially for smaller scale businesses, provides a
119
competitive advantage over competitors. As mentioned before, smaller scale wheat millers and bakers uses
service delivery as a competitive edge over large scale wheat millers and bakers. Service delivery entails the
ability to produce a high quality end product on time and within a short period in time. It is therefore not
uncommon the rank service delivery as the seventh highest critical area of wheat milling and baking
businesses.
Management of labour was indicated as the eight highest critical area of a wheat milling and baking business.
Management of labour involves hiring dedicated and motivated labourers with a relatively high level of
knowledge and experience. As aforementioned, hiring dedicated and motivated labourers is an issue of
concern that needs attention.
Wheat gristing technique entails the process of mixing different grades of wheat grain, to produce the desired
product. Wheat millers most often than not, mixed a B1 grade with a B2 grade wheat to produce the desired
quality of flour. Wheat gristing techniques were indicated as the ninth highest ranked critical area of wheat
milling.
The tenth highest ranked critical area of wheat millers and bakers are the successful implementation of a well
directed marketing campaign. This area of the business will aid in establishing a brand name and to sell the
final product to the desired end consumers. In any business, managing a marketing campaign is crucial, none
more so in the wheat milling and baking industries.
Wheat millers and bakers, apart from the ten highest ranked critical areas listed above, also indicated the
following areas of the business that is crucial for the overall success. It is worth noting these areas:
• Keeping bad debts as low as possible.
• Locating the business at the correct spot, close to the Silos and your final consumer.
• Keeping your overheads as low as possible.
• To be as effective and cost efficient as possible.
To conclude, in order to be successful, a wheat miller and baker must successfully manage the critical areas
as mentioned above, in order to be successful. In identifying the critical areas of a wheat milling and baking
business, some light is shed on how to successfully and effectively manage a wheat milling and baking
business.

120
4.3.5 THE KEY ISSUES/ CONSTRAINTS/ CHALLENGES CURRENTLY BEING EXPERIENCED BY
WHEAT MILLERS AND BAKERS
The issues, constraints and challenges currently being experienced by the wheat millers and bakers resulted
in a wide range of opinions. The opinions of wheat millers and bakers in terms of the challenges in the wheat
milling industry were also very diverse. Table 19 reflects the ten most important issues, constraints and
challenges that wheat millers and bakers feel impact the industries dramatically
Table 19: The ten most important issues/constraints/challenges currently being experienced by
wheat millers and bakers.
RANKING
The knowledge levels of labourers 10
The act of theft taking place on and around premises 9
Availability of wheat 8
Electricity supply and costs 7
Credit availability from Banks and support of the Dti 6
The deteriorating infrastructure 5
The collusion of wheat millers. 4
Imports of wheat and flour 3
The respective cash flow positions 2
The ability of large scale millers to have high volumes of raw material in hand 1
As mentioned before,, the wheat milling and baking industries suffer from an inability to attract motivated,
dedicated and knowledgeable labourers. Although the baking industry does have a skills development
programme, more must be done to exploit this programme especially in rural areas of South Africa. The milling
industry must follow this example and initiate skill development programmes. The ability of the industry to
attract knowledgeable labourers was ranked as the highest challenge of the industries. As previously
mentioned, the National Chamber of Milling expressed their disappointment in the level in which government
training authorities was involved in the industry (National Chamber of Milling, 2010).
Theft which is a very serious issue takes place on a continuous basis on and around the premises. Theft was
ranked as the second highest challenge within the wheat milling and baking industry. It forces wheat millers
and bakers to spend time and effort on combating crime and theft that could have been more productively
used. The industry must find an answer and solve the problem of theft.

121
Availability of wheat at the right price and place in South Africa was also a challenge identified by wheat millers
and bakers and was ranked as the third highest challenge currently being experienced by the industries. South
Africa must do more to protect and develop local production of wheat. If not, a constant restructuring of the
prices of the industries takes place, increasing the procurement risks.
The recent announcement of electricity price increases coupled with inconsistent supply in electricity will
hamper the sustainability of the industry. Electricity price increases means higher input costs to produce the
final product. In an industry that is classified as a low margin, high volume industry, increases in input costs
could lead to wheat milling and baking businesses taken out of production. The inconsistent supply of
electricity (power dips and load shedding) incurs a lot of unnecessary costs which increases the overhead
costs. As explained earlier, it is vitally important to keep the overheads as low as possible. A solution must be
found for the electricity price increase and supply in order to promote the development of the industry.
Electricity price increase and inconsistent supply therefore was ranked as the fourth highest challenge in the
industries.
The fifth highest ranked challenge currently being experienced by the industries was the level of credit
availability from the commercial banks and support structures of the Dti. Wheat millers and bakers indicated
that it is difficult to obtain the necessary funds from banks as the industries are deemed as a high risk low
return industry. Although there are grants available from the Dti, the process takes too long – up to a couple of
years. This long duration of the process was also stated in a study of the Department of Health (2007). In this
study it is stated that the process can take up to four years to get approval for funding. Often, the applicant
must make use of professional services of a consultant, incurring unnecessary costs. The process of allocating
grants to the various wheat millers and bakers must be speedier to ensure the business survives or is able to
take an opportunity. .
The deteriorating infrastructure (railways and roads) impacts severely on the industry in terms of service
delivery and the quality of the product being delivered. As recalled earlier, in order to be successful in these
industries, a constant quality product must be delivered with a high quality of service. However, with the
deteriorating infrastructure delivering a high quality product with a high level of services becomes difficult and
incurs significant amount of unnecessary costs. Government should improve the infrastructure, especially in
the rural areas as this will aid in the development of the wheat milling and baking industries.
The recent investigation into the wheat milling and baking industry by the Competition Commission found that
large scale wheat millers and bakers are engaging in price fixing and dividing markets. This was ranked as the

122
seventh highest ranked issue/challenge/constraint the industries are currently experiencing. Many small scale
wheat millers and bakers feel that this prosecution, although necessary, had a negative impact in terms the
reputation of the industry. They further perceive that the collusion by the large scale wheat millers and bakers
forced the smaller scale wheat millers and bakers out of business, which limits development in the wheat
milling and baking industries. Another indirect impact of this collusion came in the form of many wheat millers’
and bakers’ unwillingness to share information. This in turn makes research studies difficult which does not
bode well for development in the industries. Stake holders and government must ensure that such collusion
will not happen in the future, in order for the wheat milling and baking industries to develop.
The eighth highest ranked challenge in the wheat milling and baking industry is the level of flour and wheat
imports. As mentioned, wheat millers and bakers are forced to import flour and wheat when local supply is
insufficient. Wheat farmers and millers must be protected against imports, whether by non tariff barriers or a
higher import tariff.
The cash flow position as mentioned before is important for the sustainability of any wheat milling or baking
business. Managing the cash flow was ranked as the ninth highest challenge in the industries. The tenth
highest ranked challenge in the industry is more appropriate to small scale wheat millers and bakers and
refers to the ability of large scale wheat millers and bakers to stock up on high volumes of raw materials. This
creates the advantage to the large scale wheat millers and bakers in that they can take advantage of the
situation when the price of wheat grain and flour increases. However, the opposite is the case when the wheat
grain and flour prices decreases, reversing the advantage back to the smaller scale wheat millers and bakers.
In summary, in order to identify factors that restrict development in the wheat milling and baking industry, a
clear understanding of the industries key challenges must be drawn. In order to develop the industries,
solutions to the challenges must first be found in order to eliminate the challenges.
4.3.6 BARRIERS TO ENTRY AND EXIT OF WHEAT MILLERS AND BAKERS
One of the main objectives of the study is to identify barriers to entry and exit within the wheat milling and
baking industries. A barrier to entry is any factor that restricts potential wheat millers and bakers from entering
the market, whereas barriers to exit are any factors that restrict current wheat millers and bakers from exiting
the market. The wheat milling and baking industry is characterised as an industry which has relatively high
barriers to entry. By identifying the barriers to entry, emphasis is placed on the industry in terms of the
potential to expand and grow in a relatively short period of time. Table 20 below identifies and ranks the ten
most important barriers to entry that exists in the wheat milling and baking industries.

123
Table 20: Barriers to entry for the wheat milling and baking industries.
RANKING
Obtaining the necessary capital to start operations 10
Establishing a market 9
Knowledge of the wheat and wheat milling industry 8
Sound business skills 7
A well maintained infrastructure around the premises 6
A lack of marketing management knowledge 5
A trusted relationship with suppliers and buyers 4
Availability of the necessary cash flow 3
The location of the business 2
Obtaining a highly skilled labour force 1
A barrier to entry is any factor that restricts potential wheat millers and bakers from entering the market or any
factor that restricts development in existing wheat millers and bakers. The highest ranked barrier to entry that
exists in the wheat milling and baking industry lies the acquisition of the necessary capital requirements. This
is especially the case in the wheat milling industry where the capital requirements exceed the capital
requirements needed in the maize milling industry. Start-up finance in the maize milling industry is estimated at
R850 000, whereas in the wheat milling start-up finance can exceed over the R1.5 million. The capital
requirements, therefore was indicated as the largest barrier that exists in the wheat milling and baking
industries.
Before starting a milling or baking business, an end-consumer/market must be identified. The second highest
barrier to entry that exists in the wheat milling and baking industry is the establishment of an end market. A
prospective wheat miller and baker must exploit a new market opportunity or product development. However,
wheat millers and bakers indicated that there is space in the rural areas to increase the wheat milling and
baking capacity.
The level of knowledge the new wheat miller and baker has in terms of wheat, wheat milling and/or baking can
restrict a new wheat miller or baker from entering the market,. A new wheat miller or baker must for example,
have knowledge on the grades of wheat that is used for milling, knowledge on the steps and processes of

124
wheat milling and baking and on how to manage the overall wheat milling and baking business. The large
scale millers have a definite edge over smaller scale millers in that they hire specialised labourers for each
process in wheat milling and baking. For example, they will hire a procurement, financial, marketing specialist,
etc. each having a high level of knowledge and experience in their respective fields. On the contrary, smaller
scale wheat millers is more of a one man show, where the owner must do the procurement, finance, etc.
Knowledge of a new wheat miller and baker in the industries was indicated as the third highest barrier to entry
that exists in the wheat milling and baking industries.
The level of knowledge led to the fourth highest barrier to entry that exists in the industries, in that a wheat
miller and baker must have sound business skills. Business skills refer to the overall management of the
business. At the end of the day, a wheat milling and baking business must be managed like any other
business. That means exploiting business opportunities, managing a business in a cost efficient way, getting
the labourers to work together towards one specific goal, etc. Without sound business skills, a small scale
wheat miller or baker will be unsuccessful.
The fifth highest barrier to entry is the quality of the infrastructure on and around the premises. A lack of a
high quality infrastructure on and around the premises will incur unnecessary cost and can further lead to a
product that is not of a high quality and that is not delivered on time. The infrastructure refers the quality and
quantity of water, the railway and road infrastructure and electricity supply to the premises. Without these
basic requirements a wheat milling and baking business can not function properly.
As explained in the level of knowledge barrier to entry section, it is important to have the necessary marketing
management skills. A lack of marketing management skills of new market entrants was indicated as the sixth
highest ranked barrier to entry. The large scale wheat millers and bakers definitely have an advantage over
the smaller scale wheat millers and bakers in that they hire marketers that have the necessary skills and
experience to manage and direct a well thought out marketing campaign. Smaller scale millers and bakers are
more dependant on word of mouth marketing campaigns and do not have the necessary skills and experience
to initiate a well directed campaign. From a barrier to entry point of view, a new market entrant must have a
marketing plan in place.
Having well established relationships in the wheat milling and baking industry was indicated as the seventh
highest barrier to entry that exists in the wheat milling and baking industry. A trusted relationship with suppliers
of raw materials and buyers of the final product will certainly aid in the establishment of a new business.
The eighth highest barrier to entry relates to the first barrier to entry as mentioned above, in that a new market

125
entrant must have the necessary cash flow available and furthermore have the necessary skills to manage the
cash flow position of the respective business. Managing the cash flow position will help the business to take
advantage of opportunities when they present themselves. Large scale millers have the cash flow positions
available to take a position in the wheat market for a long period. Should the wheat prices increase, larger
scale millers take the advantage. However, should prices decrease smaller scale millers and bakers are in a
better position.
Situating the business at the correct location is very important and is one of the first crucial decisions that need
to be taken in setting up the business for success. The location of the business was indicated as the ninth
highest barrier to entry that exists in the industries. Wheat milling and baking business should be located near
silos or the end consumer, especially for small scale wheat millers and bakers.
The last barrier to entry that exists is that of obtaining labourers with high levels of knowledge and experience.
The wheat milling and baking industries are dependant on labourers with high levels of experience and
knowledge. A new market entrant must be able to obtain highly skilled labourers.
To conclude, the wheat milling and baking industry have relatively high barriers to entry. The biggest barriers
that exist are the high capital requirements and the ability of new market entrants in establishing a new market.
As mentioned before, a barrier to exit is any factor that restricts an existing wheat miller and baker from exiting
the market. All the respondents indicated that the only barrier to exit that exists in the wheat milling and baking
industry is the ability to sell the machinery at a price that is acceptable for the owner of the machinery. If the
wheat mill owner or bakery wants to stop operations, a willing buyer of the assets is required. This is
sometimes a tiresome task in that new market entrants are hard to come by, following the high barriers to
entry that exists within the market. The industry does not have willing new market entrants that want to start
milling and baking operations. It is therefore perceived that finding a suitable buyer for your assets is a tough
task and could potential restrict the wheat miller or baker from exiting the market. Even if a new buyer of the
assets is found, it does not guarantee the wheat miller or baker that he/she will receive a price that is on
average the same as the book value of the assets. The buyer can offer him/her a price much lower than the
book value of the assets, thus demotivating the wheat miller or baker to sell his/her assets.
4.3.7 PROCUREMENT DECISION
One of the most important areas of running a successful milling business is to make the right procurement
decisions. The ability develops over a long period of time. As was explained in barrier to entry section,

126
experience and business knowledge are key to the overall success of any business, none more so in the
milling and baking industry. Procurement decisions entail making the right decisions in terms of the quantity of
raw material that need to be bought and buying from the right supplier at the correct price given the specific
market conditions. It further entails whether to buy the raw materials on a contract basis. These types of
decisions are dependant on experience and business knowledge. This section provides some insight in to the
type of procurement decisions a wheat mill owner and baker makes daily.
One of the most important raw materials a wheat miller buys is wheat grain and in the case of the baker, the
procurement of flour. It is therefore vitally important that the correct procurement decisions are made and that
the raw material is bought at the right time and price. In the case of wheat milling two different procurement
channels exists. The first one and most commonly used channel is the procurement of wheat from silos. The
alternative to this channel is the procurement of wheat directly from farmers; however this in itself creates
challenges and problems in that the incorrect grades of wheat can be delivered by the farmer. There is
basically only one procurement channel for flour and that is directly from the miller to the baker. Bakers are
therefore dependant on millers to deliver a high quality product on time.
As aforementioned, wheat prices represent the largest part of the input costs in milling wheat to flour. Wheat
price volatility therefore can have a big impact on the profitability of the wheat mill business. The same is the
case for bakers; flour price volatility will impact on the profitability of the baking business. The perceptions of
wheat millers and bakers interviewed on the impact of price volatility of raw materials on the profitability of their
business are presented in Figure 54.
Figure 54: The impact of input price volatility on the profitability of raw materials.
High
40%
Medium
40%
Low
20%

127
From the figure above it is clear that 40 percent of the respondents indicated that the impact of input price
volatility of raw materials on the profitability of their business is high, 40 percent indicated that this impact is
medium and the remaining 20 percent indicated that the impact is low.
The majority of the respondents indicating that the impact is high are the small scale wheat millers and bakers.
These small scale wheat millers and bakers feel exposed to input price volatility as they do not have the cash
flow positions and knowledge to counteract these input price risks by using risk mitigating strategies such as
SAFEX. The large scale millers in turn make use of SAFEX as a risk mitigating strategy, some of the large
scale millers indicated that around 50 percent of their total wheat procurement is done on a three month
SAFEX contract and between 10 and 20 percent of wheat procurement is done on a six month SAFEX
contract basis. This ability of large scale wheat millers to mitigate risk on SAFEX creates an advantage for
large scale millers over smaller scale millers in that they can offset the input price volatility. This case in point
is further emphasised by Figure 55 that indicates the percentage of wheat millers and bakers that acquire raw
materials on a contractual basis.
Figure 55: Procurement done on contractual basis
From the figure above it is eminent that only 30 percent of wheat millers and bakers procure wheat and flour
on a contractual basis. This contractual basis can include the use of SAFEX or over-the-counter contracts. The
majority of respondents indicated that procurement is not done on contractual basis, especially the smaller
scale wheat millers and bakers for reason described above.
Yes
30%
No
70%
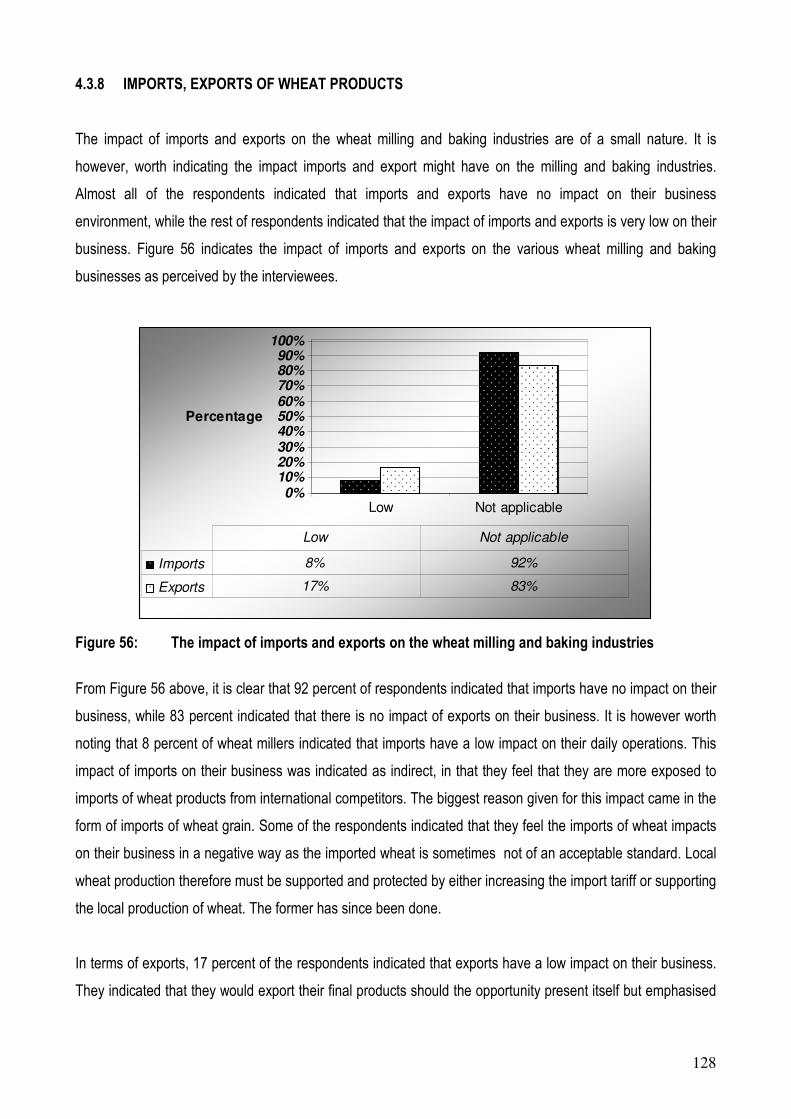
128
4.3.8 IMPORTS, EXPORTS OF WHEAT PRODUCTS
The impact of imports and exports on the wheat milling and baking industries are of a small nature. It is
however, worth indicating the impact imports and export might have on the milling and baking industries.
Almost all of the respondents indicated that imports and exports have no impact on their business
environment, while the rest of respondents indicated that the impact of imports and exports is very low on their
business. Figure 56 indicates the impact of imports and exports on the various wheat milling and baking
businesses as perceived by the interviewees.
Figure 56: The impact of imports and exports on the wheat milling and baking industries
From Figure 56 above, it is clear that 92 percent of respondents indicated that imports have no impact on their
business, while 83 percent indicated that there is no impact of exports on their business. It is however worth
noting that 8 percent of wheat millers indicated that imports have a low impact on their daily operations. This
impact of imports on their business was indicated as indirect, in that they feel that they are more exposed to
imports of wheat products from international competitors. The biggest reason given for this impact came in the
form of imports of wheat grain. Some of the respondents indicated that they feel the imports of wheat impacts
on their business in a negative way as the imported wheat is sometimes not of an acceptable standard. Local
wheat production therefore must be supported and protected by either increasing the import tariff or supporting
the local production of wheat. The former has since been done.
In terms of exports, 17 percent of the respondents indicated that exports have a low impact on their business.
They indicated that they would export their final products should the opportunity present itself but emphasised
0%
10%
20%
30%
40%
50%
60%
70%
80%
90%
100%
Percentage
Low Not applicable
Imports 8% 92%
Exports 17% 83%
Low Not applicable

129
that exports are not their core business. They would rather concentrate on local markets and expand where
possible.
From the above mentioned it is eminent that imports and exports play a very small role in the daily operations
of the wheat milling and baking industries. Local production of wheat must be supported and enhanced to
minimise the imports of wheat grain.
4.3.9 RISK MANAGEMENT
As explained in the methodology chapter, risks are divided into a macro and micro level. Risks identified as
macro are those risks over which the wheat miller and baker has little or no control. Macro risks are further
divided into Political, Economical, Socio-economic, Technological and Environmental risks. Table 21 below
identifies risks at a macro level.
Table 21: Risks at a Macro level
Risk Risk Background
Political Risk
Change of legal framework
The legal framework in any country depicts the way in which business is done and structured. Changes in legislation impacts any business in a positive or negative way and can ultimately have an impact on investment confidence and profitability.
Changes in government priorities
An established governmental environment is crucial for the sustainability of businesses, any changes in the fiscal and monetary policies and priorities of government can impact on a business or business venture negatively.
Decrease in government spending A decrease in government spending impacts on the level of demand in the economy negatively - therefore spending by consumers can decrease
Changes in the direct and indirect tax structures.
Changes in a country’s tax structures impacts on disposable income of the consumers and businesses and can impact the sales in the wheat milling and baking industry due to lower consumer spending.
Change in subsidies or support by government
Any changes in the support by government to entities that are dependant on subsidies or tariffs can have a negative impact on the profitability of the entity.
AgriBEE BEE plays an increasing important role in South Africa. Not having competent BEE partners can impact a business negatively.
Education and Training
The success of a business depends on the level of quality of its human capital. A country’s inability to maintain a high quality school system creates problems for all businesses in terms of capacity building, service delivery and other aspects of the economy.

130
Economic Risk
Globalization Globalization changed the way in which businesses are conducted. It creates opportunities for business to exploit world markets; however it also created new competition for existing businesses.
Inflation Inflation can affect a business in many ways. If the cost of inputs increases at a more rapid pace than the business’ income, the business will experience a loss in profitability.
Interest rate changes
High interest rates have a negative impact on a company’s ability to repay debt or other loan instruments which in turn decreases profitability. It impacts on consumers’ disposable income and buying patterns. Also impacts on investments, ROI.
Volatility of exchange rate Volatility in exchange rates for importing and exporting companies can have a harmful effect on the profitability of the company.
Credit crunch
The current world wide recession and credit crunch impacts on the consumers’ perception of the economy, spending patterns, disposable income, employment, etc and this can result in the decrease of demand and investment
FDI (Foreign Direct Investment) FDI in South Africa is very speculative and short term which creates problems in terms of sustainability of investment which is necessary for businesses to invest longer term.
Changes in international trade structures
The global international trade environment is vibrant and ever changing. Not adjusting to these changes will result in a loss of export opportunities.
Infrastructure
Roads, railroads, harbours, communication, water systems, etc are all required investments by government at a certain standards. If not available or not maintained it impacts negatively on investment confidence.
Economic development The stage of economic development of a country will determine the products, quality and services that can be marketed.
Urbanization
The migration from rural areas to urban areas changes demand patterns and quantities in both areas hence impacting the sales and profitability of businesses. It also puts pressure on infrastructure and employment.
House and stock market prices The decline in the prices on the house markets and stock markets impacts the consumer confidence in terms of the economy, consumer disposable income and spending that decreases.
Eskom (load shedding)
Load shedding or the lack of sustainable electricity in South Africa is a reality that creates problems for businesses in terms of service delivery, transportation, communication, etc which in turn has negative impact on profitability.
Socio-Economic risk
Changes in consumer trends It is vital for companies to keep up with the ever changing consumer trends in order to ensure competitiveness and sustainable profits. Changes in consumer trends can impact on sales/ profits.
Changes in disposable income Changes in disposable which can occur due to taxation, interest rates, etc will dampen the consumption expenditure and spending patterns of consumers - demand changes for certain products.

131
Unemployment High levels of unemployment in a country/region will decrease disposable income thereby decreasing demand which in turn decreases sales and ultimately profits.
Changing demographics
A decreasing growth rate in a country will affect the speed at which the consumer base grows hence consumer demand will decrease. Changes in the age structure of a country will have implications in terms of spending and saving patterns, which in turn can impact consumer demand negatively or positively.
Infrastructure Businesses struggle in an environment that lacks a high-quality infrastructure. Not having a world-class infrastructure could also impact on competitiveness.
HIV/Aids HIV/AIDS provides a serious threat for countries in terms of population growth, lower productivity and lower income levels. It again impacts on the demand for food.
Ethical/religious trends Ethical or religious trends determine the demand of certain products. A company’s should identify such trends and needs.
Security, corruption and theft Security, corruption and theft presents a wide range of risks for businesses that all conclude in a loss of profit.
Technological Risk
Lack of new production methods New production methods (using technology) can increase productivity and decrease cost of production. A company’s lack of innovation in terms of production creates a risk in the long run.
Lack of investment in research and development
This results in the lack of innovation for new products and new product development
Environmental Risk
Water quality & availability Water of adequate quality is essential for wheat milling and baking businesses. In recent times water has become scarce. It can impact on business profits and confidence.
Pollution Pollution creates external costs to all businesses. Polluted water for example needs to be purified before use. Polluted water can cause unnecessary risks and higher input costs.
Climatic & natural risk / global warming?
Climatic changes and natural disasters are predicted to increase in future creating uncertainty. This requires more proactive thinking and innovation.
Transport system The supply chain of wheat products has to be fast and responsive to deliver a product of high quality to markets. Not having a high-quality transport system will hamper these objectives.
Source: Louw (2007)
Having identified the risks at macro level, it is also important to identify risks at a micro level. Micro level risks
are those risks that have an impact on the daily operations of the wheat milling and baking industries.

132
Table 22: Risks at micro level
Risk Risk Background
Operational Risk
Loss of market share Requires meeting & exceeding requirements of all stakeholders at different levels in the value chain.
Stakeholders with different agendas Lack of alignment in terms of the wheat milling and baking strategic and operational goals. Different stakeholders with different objectives and agendas.
Food safety An international & domestic requirement. Impacts on business, consumers & suppliers. Requires that necessary control systems are in place.
Systemic risk
The risk that one party involved in the wheat milling and baking industries fail, may lead to the collapse of the entire market. If for example the nearby Silo fails, the wheat milling business that depends on the silo for wheat grain will also fail as it will not have wheat grain to produce flour with.
Machinery break-down Not having high quality, well maintained, accessible wheat milling machines can effect the profitability of the wheat milling business.
Quality of infrastructure & logistics The risk of not having a high quality infrastructure at the various wheat milling and baking businesses can lead to a loss in terms of market share, suppliers and customers.
Power outages
Contingency plans need to be implemented in the case of power outages. The business still needs to function as efficiently as possible in the case of load shedding, power outages and power dips.
Employee errors Well trained employees are required at different levels of value chain in the wheat milling and baking industries. If not available and sustainable, it can impact on reputation risk, etc.
Inventory becoming outdated The risk of insufficient and inconsistent supply of flour can have a negative impact on the various wheat milling businesses.
Product defects or loss of quality in terms of produce.
The quality of the end product of the businesses must at all times be of a high and consistent standard; the risk of inferior quality will have serious repercussions for the wheat milling and baking industry. Role players must adhere to minimum quality standards.
Security risk The risk of security and safety at wheat milling and baking businesses plays a vital role in terms of the long term sustainability.

133
Product Market Risk
Loss of customers There is always the risk of losing customers to other wheat milling or baking businesses.
Competition increases New market entrants in the wheat milling and baking industry. Especially, on farm operations of local farmers that can lead to a risk in terms of a loss of suppliers or customers
Supply decreases
A loss in terms of suppliers of consistent quality & quantity can lead to the industry becoming stagnated and predictable. With the recent increases in production costs, the lack of sufficient supply becomes a reality.
Sudden demand changes
The demand for flour and flour related products can change significantly in a short time period. This creates risk in terms of inadequate supply of products.. For example, the day to day sales of flour and flour related products can change dramatically, one day you will sell one unit of a specific product and the next day you can sell forty units of the same product.
Price volatility
As explained in this study, price volatility can lead to a procurement risk of wheat grain. Large scale millers have the cash flow position to adapt to price volatility, which is an advantage over the smaller millers.
Lack of innovation and differentiation of products
The value adding, processing and branding of all products needs to be in line with the developments and changes of consumer trends – risk of not taking note of the trends..
Mismanagement Issues of bad leadership, lack of vision, innovation, trust, lack of correct information and payment systems all add to this problem.
Financial risk
Lack in private sector investment confidence
When financing is required sufficient private sector interest & investment is required. Require a 51:49 financing of expansion. Private sector investment, expertise required.
Interest rate changes Sudden changes in interest rates create risks in terms of credit repayment, which in turn will have a negative effect for the various wheat milling and baking businesses.
Capital cost changes (interest costs) Capital cost can change or increase which creates the risk in terms of adequate capital resources necessary to expand.

134
Default on debt Depending on financial structuring, default on debt is possible due to the above risks.
Control of overheads The risk of not controlling overheads can lead to deficiencies in the functioning, service levels, etc of the market.
Cash flow problems Out of cash or cash flow problems can lead to management problems, payment problems, loss of suppliers, problems with service delivery, security, etc.
Inadequate marketing The effective marketing of value proposition to the public is critical for the development and sustainability of the various wheat milling and baking businesses.
Input Risk
Staff skills
The continuous increase in the investment into staff in the milling industry is crucial for capacity building. The employees of the various wheat milling and baking businesses are key to the success of the development and expansion of the industry.
Key employees leave Contract of key senior management expire simultaneously. Requires effective succession planning.
Import risk
Consignments not arriving on time Consignments not arriving on time will create problems in terms of food safety, loss of reputation.
Consignments arriving damaged Consignments arriving damaged at the final retailer/consumer will result in products with low quality. Negative perceptions are created.
Counterparty risk The loss that may occur in the event of a failure to honour contractual obligations by counterparty creates risk in terms of future contractual agreements.
Source: Louw (2007)

135
4.3.10 LEGAL FRAMEWORK IMPACTING THE WHEAT MILLING AND BAKING INDUSTRY
From the outset of the study, emphasis was placed on the legal environment and the impact thereof on the
wheat milling and baking industry. Although the majority of interviewees indicated that the impact of the legal
framework on the wheat milling and baking industry is on average the same as any other industry, it is worth
summarising the legal framework and the impact it potentially can have on the wheat milling and baking
industry.
Table 23: Legal framework of the wheat milling and baking industry
Foodstuffs, cosmetics and disinfectants act (Act no 54 of 1972)
(Regulations relating to the fortification and
labelling of certain foodstuffs)
Any person who manufactures, imports or sells foodstuffs identified as food vehicles
which has not been fortified and labelled in the correct way shall be guilty of an
offence (DOH, 2003)
This regulation ensures that the process of food fortification is executed by millers (wheat & maize), as well as to provide guidelines as to the correct procedure of labelling and fortification
standards (DOH, 2003)
Legislation Definition Purpose / Impact
Legislation impacting Exporting and Marketing of Fresh Produce
Agricultural Product Standards Act
(119 of 1990) – as amended in 1993
To provide for the control over the sale and export of certain agricultural products
and other related products (PPECB, 2007).
The Minister may prohibit the export of products unless each quantity of that
product has been approved by the executive officer (PPECB, 2007).
Consumer Protection Bill
(B 19 – 2008)
To promote a fair, accessible and sustainable market place for consumer
products, to establish national norms and standards relating to consumer protection
and to prohibit unfair marketing (DTI, 2008)
This Bill ensures that consumers have access to a fair marketplace, where
market information is shared by suppliers and buyers. To enhance the
social and economic welfare of consumers (DTI, 2008)
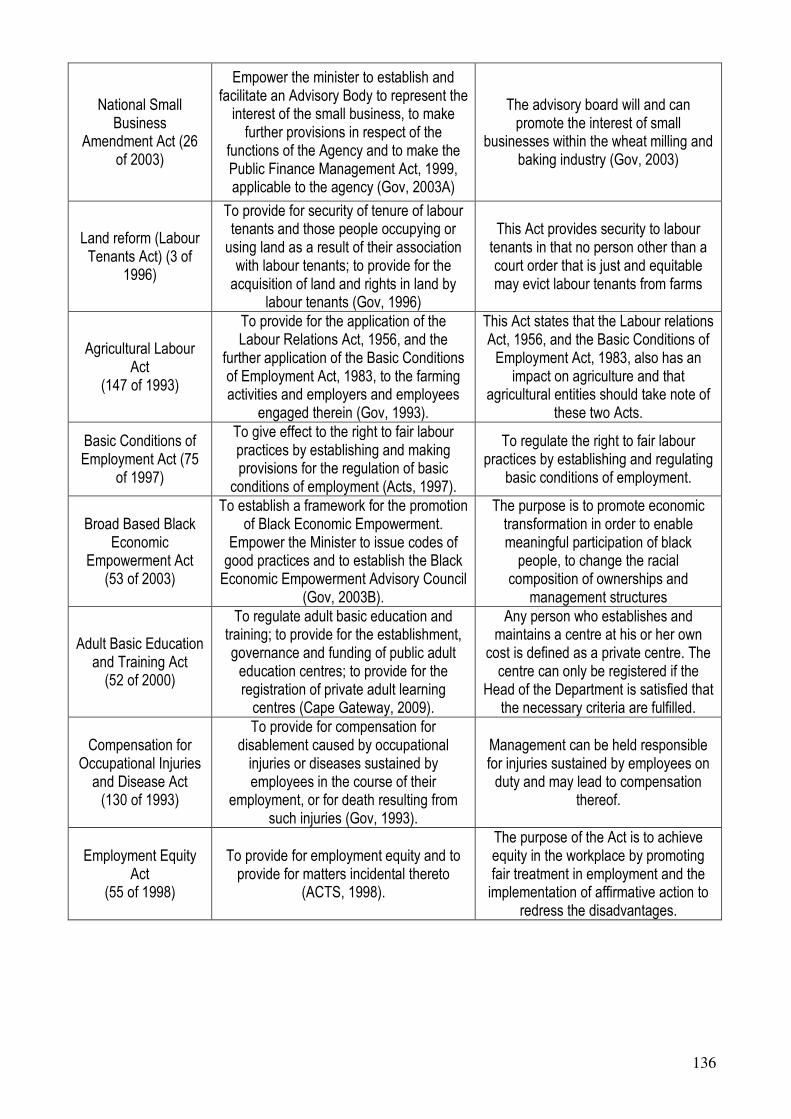
136
National Small Business
Amendment Act (26 of 2003)
Empower the minister to establish and facilitate an Advisory Body to represent the
interest of the small business, to make further provisions in respect of the
functions of the Agency and to make the Public Finance Management Act, 1999, applicable to the agency (Gov, 2003A)
The advisory board will and can promote the interest of small
businesses within the wheat milling and baking industry (Gov, 2003)
Land reform (Labour Tenants Act) (3 of
1996)
To provide for security of tenure of labour tenants and those people occupying or
using land as a result of their association with labour tenants; to provide for the
acquisition of land and rights in land by labour tenants (Gov, 1996)
This Act provides security to labour tenants in that no person other than a court order that is just and equitable may evict labour tenants from farms
Agricultural Labour Act
(147 of 1993)
To provide for the application of the Labour Relations Act, 1956, and the
further application of the Basic Conditions of Employment Act, 1983, to the farming activities and employers and employees
engaged therein (Gov, 1993).
This Act states that the Labour relations Act, 1956, and the Basic Conditions of
Employment Act, 1983, also has an impact on agriculture and that
agricultural entities should take note of these two Acts.
Basic Conditions of Employment Act (75
of 1997)
To give effect to the right to fair labour practices by establishing and making provisions for the regulation of basic
conditions of employment (Acts, 1997).
To regulate the right to fair labour practices by establishing and regulating
basic conditions of employment.
Broad Based Black Economic
Empowerment Act (53 of 2003)
To establish a framework for the promotion of Black Economic Empowerment.
Empower the Minister to issue codes of good practices and to establish the Black
Economic Empowerment Advisory Council (Gov, 2003B).
The purpose is to promote economic transformation in order to enable meaningful participation of black
people, to change the racial composition of ownerships and
management structures
Adult Basic Education and Training Act
(52 of 2000)
To regulate adult basic education and training; to provide for the establishment,
governance and funding of public adult education centres; to provide for the registration of private adult learning
centres (Cape Gateway, 2009).
Any person who establishes and maintains a centre at his or her own
cost is defined as a private centre. The centre can only be registered if the
Head of the Department is satisfied that the necessary criteria are fulfilled.
Compensation for Occupational Injuries
and Disease Act (130 of 1993)
To provide for compensation for disablement caused by occupational
injuries or diseases sustained by employees in the course of their
employment, or for death resulting from such injuries (Gov, 1993).
Management can be held responsible for injuries sustained by employees on
duty and may lead to compensation thereof.
Employment Equity Act
(55 of 1998)
To provide for employment equity and to provide for matters incidental thereto
(ACTS, 1998).
The purpose of the Act is to achieve equity in the workplace by promoting fair treatment in employment and the
implementation of affirmative action to redress the disadvantages.

137
In discussing the legal framework that impacts the wheat milling industry, one specific act was mentioned on a
continuous basis by wheat millers and bakers and had a two-fold impact on these industries. The act is the
Foodstuffs, cosmetics and disinfectants act (Act no 54 of 1972), and has regulations relating to the fortification
of certain foodstuffs as well as the newly revised labelling regulation imposed by the Department of Health.
This act provides guidelines and principles on the correct procedure and standards, in terms of the fortification
and labelling process of foodstuffs that must be executed by millers in South Africa. This act creates problems
and issues within the wheat milling industry. The most important issue is that small wheat millers feel that this
act increases the barrier to entry of the industry, as it causes a great amount of unnecessary costs. This act is
supported by the National Chamber of Milling, which in turn represents the large scale millers of South Africa.
This creates an advantage for large scale millers over small scale millers. According to the National Chamber
of milling, this has changed over the past few years. The National Chamber of Milling at present has more
members who are small scale millers and bakers than those who are large scale millers and bakers. Bakers in
turn also expressed their concerned about the labelling regulation and also feel that the input costs in
producing a loaf of bread are increased by the added regulation in terms of labelling the bread product.
Labour Relations Act (66 of 1995)
To regulate the organisational rights of trade unions, to promote collective
bargaining at the workplace. To regulate the right to strike and to promote employee
participation in decision-making and to provide simple procedures of labour
disputes (Gov, 1995)
To advance economic development, social justice, labour peace and
democratisation of the workplace.
Occupational Health and Safety Act (85 of
1993)
To provide for heath and safety of persons at work, the protection of persons other than persons at work against hazards to health arising in connection with persons
at work (Gov, 1993).
Every employer shall provide and maintain, as far as possible, a working
environment that is safe and without risk to the health of his employees
Prevention of Illegal Eviction and Unlawful Occupational of Land
Act (19 of 1998)
The prohibition of unlawful eviction and to provide procedures for the eviction of
unlawful occupiers (Gov, 1998A).
No person may directly or indirectly permit a person to occupy land without
the consent of the owner of the land.
Skills Development Act (97 of 1998)
To provide a framework to implement national, sector and workplace strategies to develop and improve the skills of the
workforce; to provide for financing of skills development by means of a levy-grant
scheme and a national skills fund (Gov, 1998B).
The purpose of the Act is to develop the skills of the workforce, to increase the
level of investment in education, to encourage workers to participate in
training programmes and to improve the prospects of disadvantaged employers
138
4.3.11 SUPPORT STRUCTURES OF THE GOVERNMENT AND DTI
The Department of Trade and Industry (the Dti) launched a new incentive programme called the
Manufacturing Investment Programme (MIP) which commenced in 2008 and will end in 2014. The objectives
of the MIP are to stimulate much needed investment within the manufacturing industry, while further aiming to
enhance the sustainability of manufacturing investment projects by small enterprises and to support large-to-
medium scale projects in manufacturing that would not have been established without a grant. The MIP forms
part of the Industrial Policy Action Plan. The incentive programme supports both local and foreign owned
entities by offering an investment grant of up to 30 percent. The qualifying investment costs include machinery,
equipment, land and buildings and commercial vehicles. The investment grant can be summarised as follows
(DTI, 2009):
• Investment projects of R5 million and below may qualify for an investment grant of up to 30 percent of
the total investment costs.
• Investment projects above R5 million may qualify for an investment grant of between 15 percent and 30
percent of the total investment costs payable over a two year period.
• Foreign investment projects may qualify for an additional grant for the cost of transporting their
machinery and equipment to South Africa.
To qualify for the MIP, projects are assessed to determine their importance to the Dti’s priority sectors, job
creation, Broad Based Black Economic Empowerment (BBBEE) as well as location in areas of high
unemployment. This programme will aid wheat millers with the investment costs. This is much needed
assistance for new entrants in the wheat milling and baking industry and helps towards long term sustainability
(DTI, 2009). To date, a limited number of millers have qualified for the programme as credit conditions from
commercial banks are currently very stringent.
4.4 PERFORMANCE OF WHEAT MILLERS AND BAKERS
The performance of the wheat millers and bakers is shown by an analysis of the finance performance of wheat
millers and bakers. This financial performance of wheat millers and bakers will include their perception on how
their turnover of the past five was and what impact increases in costs have on their respective business.
4.4.1 FINANCIAL PERFORMANCE OF WHEAT MILLERS AND BAKERS
Evaluating the financial performance of wheat millers and bakers will provide valuable insight into the ability of

139
the existing wheat millers and bakers to be sustainable. In order to capture the financial performance of wheat
millers and bakers, the perceptions of the existing wheat millers and bakers on their turnover performance
over the past five years was evaluated. Respondents were asked to indicate on a scale of very good, good,
average, bad and very bad how they performed over the past five years. Figure 57 below indicates the
perception of existing wheat millers and bakers on how their turnover performed over the past five years.
Figure 57: The perception of turnover over the past five years
Figure 57 shows an interesting occurrence on the perception of wheat millers and bakers on their turnover
over the past five years. The figure indicates a clear bell shaped phenomenon, illustrating that for some wheat
millers and bakers, their turnover was very good while for others it was very bad. Approximately 34 percent of
respondents indicated that their financial performance over the past five years was average. Out of all the
respondents, another 33 percent indicated that their respective turnover over the past five years was above
average. Out of this 33 percent, 11 percent indicated that their turnover was very good, while 22 percent
indicated that their turnover was good. It is worth noting that this proportion of wheat millers and bakers was
represented by small, medium and large scale wheat millers and bakers, indicating that there is room in the
market for different size and scale wheat millers and bakers. The key lies in identifying new market
opportunities and fully exploiting the opportunity. The last bracket of wheat millers and bakers were
represented by 33 percent of respondents. This bracket of wheat millers and bakers indicated that their
turnover over the past five years was below average and that they have experienced a drop in sales over the
past few years. Out of this 33 percent, 22 percent indicated that their turnover performed badly, while 11
percent indicated that it performed very badly. It is however, interesting to note that this bracket of respondents
was solely represented by small scale wheat millers. This indicates that the financial performance of large
scale wheat millers and bakers are superior to smaller scale wheat millers and bakers. Smaller scale wheat
0
5
10
15
20
25
30
35
Very good Good Average Bad Very bad
Perc
en
tag
e

140
millers and bakers therefore need more support from the Dti and government institutions that will aid in the
sustainability of smaller scale wheat millers and bakers.
4.4.2 THE IMPACT OF INCREASES IN INPUT COSTS ON WHEAT MILLERS AND BAKERS
After discussing the perception of wheat millers and bakers, it is only normal to analyse the perception of
wheat millers and bakers on the impact of increases in input costs on their respective businesses. Increases of
input costs in today’s business environment is a given and requires a business to be as adaptable to changes
as possible to minimise the impact on the business. Increases in input costs in today’s milling and baking
business environment include electricity prices, fuel prices, packaging material costs, labour costs, and
logistics costs. This section is dedicated to the perception of existing wheat millers and bakers on the impact of
increases in input costs on their respective businesses. Respondents were asked to indicate whether they feel
the impact is dramatic, significant, average or no impact. Figure 58 below clearly indicates this perception of
existing wheat millers and bakers.
Figure 58: The perceived impact of increases in input costs on milling and baking businesses
From the figure above, it is notable that the majority of wheat millers and bakers feel that the impact of
increases in input costs on their respective businesses is dramatic. Out of all the respondents, 44 percent
indicated that there is a dramatic impact on their business if input costs increase. The majority of wheat millers
and bakers in this bracket were represented by small scale wheat millers and bakers. Smaller scale wheat
millers and bakers are more exposed to changes in input costs as they do not have the necessary skills and
capital to mitigate this risk fully. They are vulnerable to changes in input costs. Another 23 percent of
respondents indicated that the impact of increases in input costs is significant on their business. This bracket
0
5
10
15
20
25
30
35
40
45
50
Dramatic
impact
Significant Average No impact
Perc
en
tag
e

141
again was represented by small and intermediate wheat millers and bakers, stressing the vulnerability of
smaller scale wheat millers and bakers to an increase in input costs. The last 33 percent of respondents
indicated that the impact of increases in input costs are on average the same as any other business venture
and that the key to success lies in adapting quickly to changes in input costs.
It can therefore be concluded that the smaller scale wheat millers and bakers are more exposed to input cost
increases and feel that this has a dramatic impact on their respective businesses. This problem arises from
smaller scale wheat millers and bakers inability to off-set this risk with proper risk mitigating strategies as they
do not have the necessary capital and skills. Large scale wheat millers and bakers have in this a big
advantage over smaller scale wheat millers and bakers as they hire the necessary skills to off-set this risk with
their available capital.

142
CHAPTER 5: CONCLUSIONS AND RECOMMENDATIONS
5.1 CONCLUSION OF THE STUDY
The main purpose of the study was to identify factors that restrict the development of the wheat milling and
baking industry. In order to conduct a proper study that adds value to various stake-holders within the
industries, various objectives and questions were addressed and a detailed analysis of the results was
performed. The objectives of the study can be summarised as follows.
• Report on previous studies conducted in South Africa on the wheat milling and agro-processing industry
• Identify the critical success factors of current wheat millers
• Analyse the wheat supply chain to understand the shorter and longer term issues in the sub-sector that
influence the effective establishment of agro-processing industries in rural areas.
• Determine the impact of input price volatility on the profit margins of the smaller commercial mills
• Identify factors that restrict and/or enhance the competitiveness and profitability of smaller commercial
mills.
• Identify the use of any risk mitigation strategies such as hedging, storage and branding applied by the
smaller commercial mills.
• Establish protocols within support structures that can assist in the development and sustainability of
agro-processing industries in the rural areas.
• To unpack the governance/business models of successful smaller mills; looking specifically at
contractual arrangements, hedging, infrastructure, and marketing strategies.
• Analyse the barriers to entry and barriers to exit.
• Analyse the power relations between the players, if any, with special emphasis on smaller commercial
mills and bakeries.
• Determine the impact of imports and exports of raw materials as well as the manufactured products.
• Analyse whether the current support measures provided by the Dti are applicable to the agro-
processing sector and to make recommendations on how such support measures can be adapted or
improved if needed.
• Make recommendations on key issues identified in the study.
The main purpose of the literature review section was to clearly demonstrate that the study will add to the
existing body of knowledge on factors that restrict agro-processing development. After a detailed literature
review it can be concluded that no study of this nature has been performed yet. The literature review did
however identify studies conducted on the wheat milling and baking industries. However, the purposes of
these studies differed vastly from the conducted study. The only resemblance found between previously

143
conducted studies on wheat millers and this study was the SWOT analysis that was performed. An effort was
made, to clearly demonstrate differences found between the SWOT analysis of previous studies and this
study. It can therefore be concluded that the study to determine factors that restricts development in the wheat
milling and baking industries will add value to various stake-holders within these industries.
From the outset of the study it was clear that conducting research within the wheat milling and baking
industries would be difficult. Due to the lack of information sharing and finding wheat millers and bakers that
were willing to provide information proved arduous following the investigations by the Competition
Commission. The National Chamber of Milling could not provide access to the industry statistics on their
website during the period of the study. It is important to note that this problem of information sharing was also
a problem before the investigations by the Competition Commission. The Department of Health (2007) did a
study on the fortification programme in South Africa and stated that “…many small scale millers did not want to
be found. Many of them also did not want to make themselves available to talk to strangers…”. This clearly
indicates that information sharing and data collection within the wheat milling and baking industries is a
problem and needs to be addressed. Research and development is the cornerstone of any expansion and
growth in any industry and an effort must be made in making information and data easily accessible.
The study conducted an extensive market overview on the wheat industry and was divided into a global wheat
overview, a Southern African Development Community (SADC) overview and a South Africa overview.
Production levels, consumption levels, stock levels and import and export levels as well as an overview of the
milling industry and current issues and challenges was discussed in detail. One of the objectives of the study
was to analyse the wheat supply chain which was done in the South African wheat market overview. The
objective of analysing the wheat supply chain was to understand the linkages associated with the wheat
industry in order to conduct an accurate and precise study. It can be concluded that the market overview of the
wheat industry on a global, SADC and South African basis did provide valuable insight into the current
production and consumption trends. From these trends, a more precise and concentrated study was
conducted to identify the factors that limit agro-processing development in the wheat milling industry in the
rural areas.
In order to identify factors that restrict development in the wheat milling and baking industries, one of the
objectives of the study was to identify critical success factors/areas of current wheat millers and bakers. The
analysis of the critical success factors/areas of current wheat millers and bakers provided valuable insight into
the areas of a wheat milling and baking businesses that must be successful in order to grow the business. The
study identified ten critical areas. The most important area identified was establishing a well defined market
(end consumer). Respondents stressed the value of defining a market more and identified that this is the first

144
crucial step in setting-up your business for success. Other critical areas of a wheat milling and baking business
included, amongst other things, the effective management of the respective cash flow, knowledge and know-
how of wheat milling and baking and the effective management of input costs.
As mentioned, it is crucial to manage input costs as effectively as possible. The study aimed to determine the
impact of input cost price volatility on the profitability of smaller scale wheat millers and bakers. Out of all the
respondents, 44 percent indicated that the input cost price volatility had a dramatic impact on their profitability.
It is important to note that the majority of the wheat millers and bakers that indicated this dramatic impact were
smaller scale wheat millers and bakers. Smaller scale wheat millers and bakers are more exposed to input
cost price volatility as they do not have the necessary skills and cash flow to make use of risk mitigating
strategies. The large scale wheat millers and bakers definitely have an advantage over the smaller scale
wheat millers and bakers in this regard.
A factor that clearly restricts development is the lack of government support in terms of the quality of
infrastructure and the grants that government provide. Many respondents expressed their concern over the
quality of infrastructure which affects their business. For many small scale wheat millers, service delivery is the
cornerstone of their business. Not having access to a proper maintained surrounding infrastructure incurs
unnecessary costs, decreasing the profitability of smaller scale wheat millers and bakers. For smaller scale
wheat millers and bakers, sustainability equals profitability. It is worth mentioning that electricity prices and
supply were specifically mentioned by wheat millers and bakers. Government grants was another specifically
mentioned issue that wheat millers and bakers felt hampered their prospects to expand. Expansion and start-
up operations require capital. Many small scale wheat millers and bakers expressed their concern over the
length of time it takes to qualify for the much needed grants and it takes several years before funds are made
available. Small scale wheat millers and bakers are then discouraged.
The wheat milling and baking industry is exposed to a number of risks. These risks can potentially restrict
development in the industry. The quality of the surrounding infrastructure and electricity supply and prices are
factors that restrict development as does the already mentioned micro-level risks. Other risks identified by
wheat millers and bakers included theft on-site, default on debt and the level of staff skills. All of these risks
incur unnecessary costs to smaller scale wheat millers and bakers. Theft on-site requires additional measures
and costs. Default on debt is another serious risk that impacts specifically smaller scale wheat millers and
bakers. The wheat milling and baking industry is cash flow driven, with sales being done on a cash basis. One
specific problem, especially in rural areas, is the lack of motivated and skilled labourers. On the issue of
obtaining a skilled labour force, the National Chamber of Milling expressed their disappointment on the level to
which government training authorities were involved in the facilitating and training in the food and beverage

145
manufacturing sector. They are of the opinion that much more needs to be done (National Chamber of Milling,
2010).
The major difference between smaller scale wheat millers and bakers and their larger scale counterparts are
the large scale millers’ and bakers’ ability to handle price volatility with the correct risk mitigating strategies.
Smaller scale millers and bakers do not have the necessary skills and capital to make use of SAFEX as a risk
mitigating strategy. This creates a situation where if wheat prices increase suddenly, small scale wheat millers
have to procure wheat at a higher price than their large scale counterparts which hedge wheat prices on
SAFEX. In other words, small scale wheat millers buy at a higher price than larger scale wheat millers, thereby
decreasing their profit margins. In an industry that is characterised by high volume output and low margins
decreases in profit margins are detrimental to the business. However, the opposite is also true that small scale
wheat millers benefit from a decreasing wheat price. Nevertheless, price volatility has a bigger impact on
smaller scale wheat millers and bakers than on their larger scale counterparts.
One of the cornerstone objectives of the study was to identify barriers to entry and exit that exists in the
industry. These barriers to entries are possible factors that restrict development in the wheat milling and
baking industries. Some of the barriers to entry identified were described in the above section. These barriers
include capital requirements, establishing a market, cash flow management and hiring motivated and skilled
labourers. Respondents also indicated that sound business knowledge was important that will ensure them to
take advantage of opportunities, to successfully manage their cash flow positions, procurement and marketing
campaigns.
The FPMC (2003) reported that approximately 80 percent of bread production is produced by six large baking
groups. The top four wheat milling companies have approximately 87 percent of the milling markets, according
to FPMC (2003). In terms of power relations between role-players, it can be concluded that the wheat milling
and baking industry is highly concentrated with the four largest milling and six baking companies dominating
the market. These large milling and baking companies furthermore have a high level of vertical integration.
Retailers on the other hand also have a relative high market power. The downside to this is that the barriers to
entry are increased with this high level of market concentration and vertical integration for smaller scale wheat
millers and bakers.
To conclude, the wheat milling industry is a high volume output, low profit margin industry. The days are long
gone that only one final product be produced in a business. In order to survive, a wheat miller must expand by
adding value to the product this can be done by establishing a bakery, while a baker must develop his
business into a one-stop shopping experience for customers.

146
5.2 RECOMMENDATIONS OF THE STUDY
Having done a proper study, some recommendations can be made on how to develop the wheat milling and
baking industry, with specific emphasis on the smaller scale wheat miller and baker. Some of the
recommendations are beyond the control of the wheat milling and baking industries. These recommendations
will be classified as general recommendations. However, there are also specific recommendations that can be
resolved by the industry.
5.2.1 GENERAL RECOMMENDATIONS
An important finding of the study was that the wheat milling and baking industries lack of information sharing
which would ensure more accurate information was available. From the viewpoint of the study, this lack of
information sharing was mainly attributed to the investigation by the Competition Commission into these
industries. The Competition Commission should ensure that the industry, which in principle is in favour of what
the Commission does, plays the role of a fair watch dog that protects businesses and prosecutes guilty parties.
There is a trend that businesses do not want to share information in fear of potential action by the Competition
Commission. Clear rules of the game regarding exchange of information at various levels are required. The
Competition Commission should establish a business environment where information can be shared freely.
This will increase the wheat milling industry’s potential to develop and compete freely. Although some
information by these industries are confidential in nature, some guidelines must be established in order to be
able to setup a benchmark. The industry must make information available in order to determine stock, supply
and demand levels, in order to make the correct policy decisions.
The low quality of infrastructure was mentioned on a continuous basis by respondents and indicated there are
unnecessary high costs incurred due to the low quality infrastructure. Government should upgrade the
infrastructure especially in rural areas. Another major point of concern in these industries is the high level of
theft and crime taking place on and around the premises of wheat millers and bakers. As mentioned,
unnecessary time, costs and efforts are incurred due to the level of crime and theft. An active step by
government and local communities must be taken, especially in rural areas, in order to combat crime.
In the end, large scale wheat millers and bakers have a larger buffer over their smaller scale counterparts to
overcome these infrastructure and theft issues. By alleviating these issues on a national level it would make it
easier for smaller scale wheat millers and bakers to survive and to do business. Development of wheat milling
and baking in rural areas is difficult if no support structures exist.

147
5.2.2 SPECIFIC RECOMMENDATIONS
The study was complicated by the fact that finding small scale wheat millers that are still in business and mill
wheat on a daily basis was difficult. This in itself restricts agro-processing development as wheat mill owners
are not supported by any institution and little information is available. According to SAGIS, any business that
stores grain at silos and adds value to grain products must be registered at SAGIS. SAGIS can contribute to
the milling and baking industries by issuing reports and releasing information and statistics on the current state
of small scale wheat millers and bakers in South Africa on a periodic basis. Having said this, SAGIS provides
the industry with valuable information on food safety issues, etc (National Chamber of Milling, 2010). The
National Chamber of Milling and the South African Chamber of Baking on the other hand must make it more
attractive for smaller scale wheat millers and bakers to become a registered member on their respective
membership lists. The registration of small scale wheat mill businesses at these organisations will provide
small scale wheat millers with a voice to discuss the various issues and challenges they experience in the
industry with government. Having said this, smaller scale wheat millers and bakers are sometimes not
interested to register at these organisations as they perceive that the fees are high and they feel that it is off
little value. According to the National Chamber of Milling, the fees are not high. Some of the smallest scale
wheat mill members only pay R80 membership fee per month and the smallest scale baker around R375 per
month (National Chamber of Milling, 2010).
As mentioned above, capital requirements in the wheat milling and baking industries are important in starting
operations. Many wheat millers and bakers depend on grants by government making the necessary capital
available. The study found that the process in making funds available can take several years. This process of
making funds available must be speedier, with funds made available within in a reasonable amount of time.
The lack of motivated and skilled labourers was indicated by respondents as a serious issue within the
industry. The perception of the industry is that the National Chamber of Milling should offer more programmes
that provide labourers with the necessary skills to excel in the industry. There are however, skills development
programmes that the National Chamber of milling and the South African Chamber of baking arrange. Current
wheat millers and bakers should be made aware of these courses that are available. As mentioned, the
National Chamber of Milling expressed their disappointment in the level in which government training
authorities was involved in facilitating and training within the industry (National Chamber of Milling, 2010).
The industry has a number of risks that impact on the daily operations of wheat millers and bakers. Again,
large scale wheat millers and bakers have an edge over their smaller scale counterparts as they have a larger

148
reserves and economies of scale to overcome these risks. A strategy is required to mitigate these risks as it
can save smaller scale wheat millers and bakers costs.
Smaller scale wheat millers and bakers should improve their level of skills, knowledge and cash flow to
overcome obstacles in a short period of time. They can take several months to recuperate proving sometimes
to be detrimental to the business. The factors identified by the study that restrict development must be
resolved in order for smaller scale wheat millers and bakers to have a fair chance of survival.

149
REFERENCES:
Abell, D. 2009. Business Model Template. EMBA Press 2009.
Acts online. (1997). Basic conditions of employment act. [Online]: http://www.acts.co.za/bcoe97/index.htm
ACTS online. (1998). Employment Equity Act. [Online]: http://www.acts.co.za/emp_equity/index.htm
Agmanager. 2010. Crops – Grain Supply and Demand. Spreadsheet with USDA WASDE data.
[Online] available from: http://www.agmanager.info/marketing/outlook/WASDE/default.asp
[Downloaded: 04-04-2010].
Agweb, 2010. Some interesting facts about wheat production. [Online] Available from:
http://www.agweb.com/Blogs/BlogPost.aspx?src=TheFarmCPA&PID=d56bed4a-7089-4df3-906d-
a68a84f81267 [Accessed: 4-06-2010].
ACCID.2009. Africa wide civil society climate change initiative for policy dialogues: Climate change is a
challenge and an opportunity. The Guardian, 18 May 2009. [Online] Available from:
http://www.africaclimatesolution.org/news.php?id=4228 [Downloaded: 23-06-2009].
Aleksandrova, A. & Lubys, J. (2004). Application of the Structure-Conduct-Performance Paradigm in a
Transition Economy: Explaining Reported Profitability of the Largest Latvian Firms. SSE Riga Working Papers,
8(63).
AVERT. 2008. HIV and Aids in South Africa. [Online] Available from: http://www.avert.org/
aidssouthafrica.htm [Downloaded 24-06-2009].
Bavorova M. & Hockmann H. 2008. Relationships’ sustainability: the case of German wheat-to-bread chain.
Martin Luther University - Farm Management Department, Halle, Germany, Leibniz Institute for Agricultural
Development in Central and Eastern Europe/Department Agricultural Markets, Halle, Germany. [Online]
Available from: http://ageconsearch.umn.edu/handle/44067 [Downloaded: 17-01-2010].
BFAP. 2009. The South African agricultural baseline. Bureau for Food and Agricultural Policy, 13:23-26.
[Online] Available from: http://www.sagis.org.za/ [Downloaded: 2010-03-22].

150
Bosserman, S. 2007. Agriculture Megatrends: Ten Trends Redefining the Practice of Agriculture in the World.
[Online] Available from: http://www.newmediaexplorer.org/steve_bosserman/2007/02/01/
agriculture_megatrends_ten_trends_redefining_the_practice_of_agriculture_in_the_world.htm [Downloaded:
24-06-2009].
Cape Gateway (2009). Adult basic education and training act. [Online]:
http://www.capegateway.gov.za/eng/your_life/10115
Competition Commission (CompCom). 2010A. Welcome to the Competition Commission. [Online] Available
from: http://www.compcom.co.za/ [Accessed: 2010-06-15].
Competition Commission (CompCom). 2010B. Wheat milling Cartel referred for prosecution. [Online] Available
from: http://www.compcom.co.za/assets/Uploads/AttachedFiles/MyDocuments/White-Maize-Milling-cartel-
referred-for-prosecution.pdf [Accessed: 2010-06-15].
Competition Commission (CompCom). 2010C. Competition Commission calls upon millers to come forward
and settle cartel cases. [Online] Available from: http://www.compcom.co.za/assets/Uploads
/AttachedFiles/MyDocuments/Competition-Commission-calls-upon-millers-to-come-forward-and-settle-cartel-
cases.pdf [Accessed: 2010-06-15].
Competition Commission South Africa. 2010. Competition Tribunal: In the matter between: The Competition
Commission and Pioneer Foods (Pty) Ltd case no. 15/CR/Feb07. 3 February. Competition Commission South
Africa.
Chabane, N., Rakhundu, M. & Simon Roberts. 2008. Market Power and Competition Concerns in Food: A
Review of Conduct and Outcomes Following Deregulation. Paper prepared for DPRU Conference, October
2008.
CME Group, 2010. Corn historical volatility. [Online] available from: http://www.cmegroup.com/market-
data/reports/historical-volatility/corn-volatility.html [Downloaded: 22-03-2010].
Creamer, T. 2010. Pioneer fined R195m for bread-cartel role, testimony slammed as false. Engineering
news. [Online}: http://www.engineeringnews.co.za/article/pioneer-fined-r195m-for-bread-cartel-role-testimony-
slammed-as-false-2010-02-03 [Downloaded: 23--4-2010].

151
De Kock. J.H.W. 1991. A strategic evaluation of the wheat industry in South Africa up to the year 2010.
Unpublished doctoral thesis. Stellenbosch. University of Stellenbosch
De Magistris T. & Gracia A. 2008. Co-operation and economic relationship as determinants for
competitiveness in the food sector: the Spanish wheat to bread chain. Agro-food Economics and Natural
Resources Unit , Centro de Investigación y Tecnología Agroalimentaria de Aragón (CITA). [Online]:
http://ageconsearch.umn.edu/handle/44066 [Downloaded: 17-01-2010].
Department of Health. 2007. A reflection of the South African Maize meal and wheat flour fortification
programme. Pretoria: South Africa.
Department of Health (2003). Foodstuff, cosmetics and disinfectants act, 1972: Regulations relating to the
fortification of certain foodstuffs. [Online]: http://www.doh.gov.za/docs/regulations/2003/ffortification.html
Department of Trade and Industry (2008). Consumer Protection Bill. [Online]:
http://www.dti.gov.za/parlimentary/bills/ConsumerProtectionBill.pdf [Accessed: 2010-05-10]
Ellis, S. 2009. How should congress respond to the cost price squeeze in agriculture? Published in Farmgate.
[Online]: http://www.farmgate.uiuc.edu/archive/2009/08/how_should_cong.html Downloaded: 25-03-2010]
Erasmus, H & Flatters, F. 2003. Rent Seeking in SADC Trade Liberalization: Rules of Origin and Other
Barriers to Trade in Wheat Products .Paper prepared under the auspices of the World Bank Netherlands
Partnership Program (BNPP). [Online] Available from:
http://qed.econ.queensu.ca/faculty/flatters/writings/ff&he_wheat_roo.pdf [Accessed: 2010-03-18].
Esterhuizen, D. 2006. An Evaluation of the competitiveness of the South African agribusiness sector.
Unpublished PhD thesis. University of Pretoria, South Africa.
FEWS NET. 2010. Southern Africa Food Security Outlook January to June 2010. [Online] Available from:
http://v4.fews.net/docs/Publications/South_Outlook_Jan_2010_final.pdf [Accessed 2010-03-16].
FEWS NET. 2009. Southern Africa Food Security Update October 2009. [Online] Available from:
http://www.fews.net/docs/Publications/South_FSU_October_2009_final.pdf [Accessed: 2010-03-16].

152
FEWS NET. 2009. Southern Africa Food Security Update May 2009. [Online] Available from:
http://www.reliefweb.int/rw/RWFiles2009.nsf/FilesByRWDocUnidFilename/STRI-7SHRJS-
full_report.pdf/$File/full_report.pdf [Accessed: 2010-03-16].
Filling the Gaps. 2008. Porter’s 5 forces model of competition. [Online] Available from:
http://images.google.co.za/imgres?imgurl=http://fillingthegaps.files.wordpress.com/2008/01/porter1.jpg&imgref
url=http://fillingthegaps.wordpress.com/2008/01/16/porters-5-forces-model-of-competition/&usg=__r-
t2_uPYz67MyGREQwceIYBofoM=&h=386&w=755&sz=19&hl=af&start=5&um=1&itbs=1&tbnid=o_U4jNLo4YK
pEM:&tbnh=73&tbnw=142&prev=/images%3Fq%3Dporter%2Bmodel%26hl%3Daf%26sa%3DX%26um%3D1
[Downloaded: 02-2010].
Flatters, F. 2002. Wheat flour in SADC: Rules of origin, tariff preferences and competition. Paper presented at
SADC TNF meeting, 11 – 14 March. Gaborone: Botswana.
Flatters, F. 2002. Wheat Flour in SADC: Rules of Origin, Tariff Preferences and Competition. Paper prepared
for SADC TNF and HLC MARO meetings held in Gabarone, Botswana March 11-14, 2002. [Online] Available
from: http://qed.econ.queensu.ca/faculty/flatters/writings/ff_wheat&flour.pdf [Accessed: 2010-03-17].
Food and Agriculture Organization (FAO), 2007. Coping with water scarcity. Agriculture Consumer and
Protection Department. [Online] available from: http://www.fao.org/ag/magazine/0704sp4.htm [Downloaded:
24-06-2009]
Government Gazette. 1993. Agricultural Labour act. [Online] Available from:
http://www.info.gov.za/view/DownloadFileAction?id=88653
Government Gazette 1993. Compensation for occupational injuries and disease act. [Online] Available from:
http://www.info.gov.za/view/DownloadFileAction?id=71058
Government Gazette (1993). Occupational health and safety act. [Online]:
http://www.info.gov.za/acts/1993/a85-93.pdf
Government Gazette 1995. Labour Relations Act. [Online]:
http://www.info.gov.za/view/DownloadFileAction?id=70985

153
Government Gazette. 1996. Land reform (labour tenants)act. [Online] Available from:
http://www.info.gov.za/gazette/acts/1996/a3-96.htm
Government Gazette (1998A). Prevention of illegal eviction and unlawful occupational of land act [Online]:
http://www.info.gov.za/view/DownloadFileAction?id=70676
Government Gazette (1998B). Skills development act. [Online]:
http://www.info.gov.za/view/DownloadFileAction?id=70755
Government Gazette. 2003. National Small Business Amendment Act. [Online] Available from:
http://www.info.gov.za/view/DownloadFileAction?id=68002.
Government Gazette. 2003B. Broad based black economic empowerment act. [Online] Available from:
http://www.info.gov.za/view/DownloadFileAction?id=68031
Grain Chain. 2010. Wheat milling process image. [Online] available from: http://www.grainchain.com
/14-to-16/technology/images/milling.gif
[Downloaded: 06-04-2010]
Grain Milling, 2010. Milling: Associations & Organisations. [Online] Available from:
http://www.grainmilling.org/text-only/milling/m-ao.php#2 [Accessed 4-06-2010]
GrainSA, Market info - stats. 2010. International grain prices (Presentation). [Online] available from:
http://www.grainsa.co.za/marketstat.asp [Downloaded: 04-04-2010]
Grain SA. 2010. Historic grain domestic versus international parity prices. Grain South Africa. [Online]
Available from: http://www.grainsa.co.za/body.php?mostvisited=1&quicklinkgroupid=243&subcatid
=91&pagetitle=Market Info&pagesubtitle=PRYS INLIGTING (PLAASLIK EN INTERNASIONAAL)/PRICE
INFORMATION (DOMESTIC AND INTERNATIONAL) [Downloaded: 2010-06-18].
Grain SA. 2010. Production info Stats/Data of wheat 2009/2010. Grain South Africa. [Online] Available from:
http://www.grainsa.co.za/prodstat.asp [Downloaded: 2010-03-21].

154
Hofstrand D.,(2007. Barriers to Entry and Exit. Agricultural Marketing Research Council, Iowa State University.
[Online]: http://www.agmrc.org/business_development/getting_prepared/business_
and_economic_concepts_and_principles/barriers_to_entry_and_exit.cfm [Downloaded: 20-01-2010]
IBISWorld. 2010. Flour Milling – US Industry Report. [Online] available from:
http://www.ibisworld.com/industry/default.aspx?indid=217[Downloaded: 06-04-2010].
Industrial Development Community. 2010. An overview of the grain milling industry. Unpublished report.
Pretoria
International Grains Council (IGC). 2010. Grain market report summary (GMR No. 397). [Online] available
from: www.igc.org.uk/downloads/gmrsummare.pdf [Downloaded: 04-04-2010]
INTERNATIONAL INSTITUTE FOR ENVIROMENT AND DEVELOPMENT. 2009. Innovating for environment
and society: an overview. [Online] Available from: www.iied.org/pubs/display.php?o=17056iied [Accessed:
2010/05/05].
Joemat-Pettersson, T. 2009. White commercial farmers won‘t be discarded. [Online] Available from:
http://www.sagoodnews.co.za/agriculture_land_reform/white_commercial_farmers_wont_be_
discarded_minister.html [Downloaded 24-06-2009].
Kachru R.P. 2009. Agro-Processing Industries in India—Growth, Status and Prospects. Status of farm
mechanization in India, Indian Ministry of Agriculture: Department of Agriculture and Cooperation.[Online]
Available from: http://agricoop.nic.in/Farm%20Mech.%20PDF/05024-06.pdf [Downloaded: 15-01-2010]
Kirsten, J.F. 2007. The impact of market power and dominance of supermarkets on agricultural producers in
South Africa: A case study of the South African dairy industry. [Online] Available from:
http://www.namc.co.za/ASSETS/NEWpdf_18_05_09/THE%20IMPACT%20OF
%20MARKET%20POWER%20AND%20DOMINANCE%20OF%20SUPERMARKET%20finalZ_09_05_15.pdf
[Accessed: 2010-06-18].
Kroll, C. 2010. Grain: The international business magazine for grain, flour and feed. Banking on wheat in
South America. [Online] Available from: http://am1.sosland.com/Olive/ODE/WorldGrain/ [Downloaded 09-05-
2010].

155
Louw, A. (2007).Risk management: managing enterprise risks. University of Pretoria
Louw, A. (2007). Risk management in agriculture. University of Pretoria
Lyddon, C. 2010. Grain: The international business magazine for grain, flour and feed. Market for
breadproducts changing. [Online] Available from: http://am1.sosand.com/Olive/ODE/WorldGrain/
[Downloaded 09-05-2010].
Mather, C. 2005. SMEs in SA's Food Processing Complex: Development prospects, constraints and
opportunities. TIPS working paper, TIPS: Pretoria
McDonald, S., Punt, C., Rantho, L. & M. van Schoor (2008). Costs and benefits of higher tariffs on wheat
imports to South Africa. Agrekon, Vol. 47 (1):19 – 51 [Online] Available from:
http://www.informaworld.com/smpp/title~db=all~content=t920230520~tab=issueslist~branches=47 - v47
Meyer, F & J. Kirsten. (2005). Modelling The Wheat Sector In South Africa. Agrekon, Vol 44 (2):225 – 237
[Online] Available from http://www.informaworld.com/smpp/title~db=all
~content=t920230520~tab=issueslist~branches=44
Mongabay. 2010. Wheat price chart. Commodity price chart (units): Wheat, US, (Hard Red Wheat). [Online]
available from: http://www.mongabay.com/images/commodities/charts/wheat.html [Downloaded: 04-04-2010]
Moyo, S. 2008. Who Will Feed the poor: The Future of Food Security in Southern Africa, A Policy Discussion.
Southern Africa Trust, 18-22.
National Department of Agriculture. 2003. Food price monitoring committee report on food prices.
Government printers: Pretoria.
National Agricultural Marketing Council (NAMC). 1999. The deregulation process: The wheat to bread value
chain. [Online] Available from: http://www.namc.co.za/dnn/LinkClick.aspx?fileticket
=2U4VBiCJeO0%3D&tabid=72&mid=535 [Accessed: 04-05-10].
National Agricultural Marketing Council (NAMC). 2004. Strategy document for the South African wheat to
bread value chain. [Online] Available from: http://www.grainmilling.org.za/_
document/WHEAT%20Strategy%20(April%202004).doc [Accessed: 04-05-10].

156
National Agricultural Marketing Council (NAMC) 2009. Report on the Section 7 Committee: Investigation into
the Wheat-to-bread Value chain. [Online] Available from: http://www.namc.co.za/ASSETS/August09
/NAMC%20-%20Section%207%20Wheat-to-bread%20investigation%20(Released%20August
%202009).pdf [Accessed: 04-05-10].
National Agricultural Marketing Council. 2006. The South African Food Cost Review. [Online] Available from:
www.namc.co.za/ASSETS/PDF/foodcostreview_new020807.pdf [Accessed: 2010-07-20].
NCM. 2009. Monthly wheat milling. National Council of Milling. [Online] Available from:
http://www.grainmilling.org.za/ [Downloaded: 2010-03-23].
NCM. 2010. Industry statistics. National Council of Milling. [Online] Available from:
http://www.grainmilling.org.za/ [Downloaded: 2010-05-23].
National Chamber of Milling. 2009. Monthly wheat milling in tons. [Online] Available from:
http://www.grainmilling.org.za/_document/wheatmilling.xls [Accessed: 08-05-2010]
National Chamber of Milling. ([email protected]). 2010. Discussion of Wheat Project. [E-mail to:]
Louw, A. ([email protected]) 2010-08-16.
National Department of Agriculture (NDA), (2006). [Online]: http://www.nda.agric.za/docs/Wheat06.pdf
[Accessed: 05-05-2010].
National Department of Agriculture. 2006. Wheat. [Online] Available from:
www.nda.agric.za/docs/Wheat06.pdf [Accessed: 2010-03-18].
NDA. 2009. Monthly food security bulletin of South Africa: July 2009. National Department of Agriculture,
Forestry and Fisheries. [Online] Available from:
http://www.nda.agric.za/docs/Cropsestimates/RSA%20Food%20Security%20Bulletin%20JULY2009.pdf
[Downloaded: 2010-03-21].
NDA. 2006. Wheat. National Department of Agriculture, Forestry and Fisheries. [Online] Available from:
http://www.nda.agric.za/docs/Wheat06.pdf [Downloaded: 2010-03-23].

157
NDA. 2010. Agricultural Abstract 2010. Natoinal Department of Agriculture. [Online] Available from:
www.nda.agric.za/publication [Downloaded: 2010-05-06]
NAMC. 2006. Report on the section 7 committee investigation into the wheat-to-bread value chain. National
Agricultural Marketing Council. [Online] Available from: http://www.grainmilling.org.za/NAMC
%20-%20Section%207%20Wheat-to-bread%20investigation%20(Released%20August%202009).pdf
[Downloaded: 2010-03-23].
National Agricultural Marketing Council. 2009. Report on the Section 7 Committee Investigation into the
Wheat- to- Bread Value Chain – Final Report. [Online] Available from:
http://www.grainmilling.org.za/NAMC%20-%20Section%207%20Wheat-to-
bread%20investigation%20(Released%20August%202009).pdf [Accessed: 2010-07-20].
Nyathi, S. 2009. Emerging farmers need help.[Online] Available from: http://www.news24.com/
Content/SouthAfrica/Politics/1057/1a23a398164e4d9b85140fdf51a584d7//Emerging_farmers_need_help
[Downloaded 24-06-2009]
One World. 2009. Food Security guide. One World. [Online] Availible from:
http://uk.oneworld.net/guides/food?gclid=CKmB276GzaACFVOY2Aod534OzQ [Acessed: 2010-03-22].
PEARSON, I. 2010. Business 2020. In: Business redefined. A look at the global trends that are changing the
world of business. Ernst & Young.
Perishable Products Export Control Board (PPECB), (2007). Agricultural products standards act 119 of 1990.
[Online]: www.ppecb.com/NR/rdonlyres/EE77877B-59F9-4629-8F58-
FAA505127FA3/67/APSAct119of1990.pdf
REUTERS. 2009. Zimbabwe: The bad news of a relative good maize harvest. [Online] Available from:
http://www.alertnet.org/thenews/newsdesk/IRIN/53fafa347df8dc3d070065827be0c96e.htm
Rabobank Group. 2010. The EU wheat flour milling industry.
[Online] available from: http://www.rabobank.com/content/research/FoodAndAgriResearch/grains_
and_oilseeds/publications/The_EU_wheat_flour_milling_industry.jsp [Downloaded: 06-04-2010]

158
Reuters. 2010. Table – The world top ten wheat importers and exporters. [Online] Available from:
http://in.reuters.com/article/idINSP49082020090713. [Accessed: 2010-06-21].
SAGIS. 2010. Historic International Wheat Prices. South African Grain Information Service. [Online] Availible
from: http://www.sagis.org.za/ [Accessed: 18-06-2010]
South African Chamber of Baking (2010). [Online] Available from: http://www.sacb.co.za/ [Accessed: 10-03-
2010]
Schlauri, M. 2005. Challenges and opportunities in the milling industry.
[Online] available from: http://www.grainmilling.org.za/AGM%20Challenges%20and%20opportunities
%20of%20the%20milling%20industry.pdf [Downloaded: 06-04-2010]
Shore, S. 2010. Wheat prices fall on abundant global supply.
[Online] available from: http://www.google.com/hostednews/ap/article/ALeqM5hLdQzzkk_
vLW3OsMLzbo-eZnRKbAD9ELSGV00 [Downloaded: 04-04-2010]
Sosland, M.I. (2009). World Grain: Wheat holds up well as global exporting collapses.
[Online] available from: http://am1.sosland.com/Olive/ODE/WorldGrain/Default.aspx?href=WG%2F2009
%2F05%2F01&pageno=42&view=document [Downloaded: 02-2010]
SAAPA. 2009. Food Security – A Proposal for South Africa. SA Agricultural Processing Association. [Online]
Available from: http://www.grainmilling.org.za/2010%20Food%20security%20-
%20proposal%20Sep%202009.pdf [Downloaded: 2010-03-23].
SAFEX. 2010. Wheat 3 Dec to date. South African Futures Exchange. [Online] Available from:
http://www.jse.co.za/Markets/Commodity-Derivatives-Market/Commodity-Derivatives-Price-
History.aspx#wheat [Downloaded: 2010-03-18]
SAGIS. 2010a. SAGIS monthly historic information for wheat 2009/2010. South African Grain Information
Service. [Online] Available from: http://www.sagis.org.za/ [Downloaded: 2010-03-21].
SAGIS. 2010b. Indicative import parity price of wheat. South African Grain Information Service. [Online]
Available from: http://www.sagis.org.za/ [Downloaded: 2010-03-18].
159
SAGIS. 2010c. Indicative export parity price of wheat. South African Grain Information Service. [Online]
Available from: http://www.sagis.org.za/ [Downloaded: 2010-03-18].
SADC. 2009. Food Security Early Warning System, SADC Food Security Update. Issue 1.
SADC. 2006. Food Security Early Warning System, SADC Food Security Update No.5.06.
SADC. Not Dated. SADC Regional Food Reserve Facility. [Online] Available from:
http://www.sadc.int/fanr/aims/rfrf/rfrf.php [Accessed: 2010-03-28].
SADC. 2010. Formation of the Regional Food Reserve Facility. Southern African Development Community.
[Online] Available from: http://www.sadc.int/fanr/aims/rfrf/rfrf.php
[Downloaded: 2010-05-06]
Schroeder, E. 2010. World Grain: The international business magazine for grain, flour and feed. Focusing on
wheat quality. [Online]: http://am1.sosland.com/Olive/ODE/WorldGrain/. [Downloaded 09-05-2010]
South African Grain Information Service. 2009. SADC Information, Wheat Situation in Southern Africa per
country. [Online] Available from: http://www.sagis.org.za/ [Accessed: 2010-03-16].
Sosland, M. 2010. World Grain: The international business magazine for grain, flour and feed. Flour exports
to set another record. [Online]: http://am1.sosland.com/Olive/ODE/WorldGrain/ [Downloaded 09-05-2010]
Staff reporter (2005). Mega-trends: convenience food and health to double in ten years. [Online]:
http://www.bakeryandsnacks.com/Formulation/Mega-trends-convenience-food-and-health-to-double-in-ten-
years [Downloaded 17-07-2009]
Suresh, B. (2009). Global economic crisis and nutrition security in Africa. Review Article. [Online]:
http://www.ajfand.net/Issue30/PDFs/Suresh9410.pdf [Downloaded: 01-2010]
Swanepoel, R. 2010. Farmwise Grain Trading: Morning Market Report. [Online] Available from:
http://www.farmwise.co.za/files/farmwise/FarmwiseXMorningXReportX.pdf [Accessed: 2010-03-26].
The Baker (2010). The State of logistics. [Online] Available from: http://www.thebaker.co.za
/ad_vol13no5warehousing.html [Accessed: 2010-05-18]

160
The Baker. 2010. Good market conditions challenging. Inside track (Vol 11:3) [Online] Available from:
http:www.thebaker.co.za/insidetrackvol11no4.html [Accessed: 2010/05/18].
Ueckermann, E.M., Blignaut, J.N., Gupta, R & J. Raubenheimer (2008) Modelling South African grain
farmers' preferences to adopt derivative contracts using discrete choice models. Agrekon, Vol. 47(2):222 –
239 [Online] Available from: http://www.informaworld.com/smpp/title~db=all~content=
t920230520~tab=issueslist~branches=47 - v47
USAID. (2006). Structure-Conduct-Performance and Food Security. FEWS NET Markets Guidance, No 2.
Washington.
USDA. 2009. Briefing room: Wheat trade – US wheat trade. [Online] available from:
http://www.ers.usda.gov/briefing/wheat/trade.htm [Downloaded: 05-004-2010]
USDA, 2010.
http://www.ers.usda.gov/data/wheat/YBtable04.asp [Accessed 4-06-2010]
http://www.ers.usda.gov/data/wheat/YBtable03.asp[Accessed 4-06-2010]
http://www.ers.usda.gov/data/wheat/output8_15_1_55[Accessed 4-06-2010]
USDA. 2010. United States department of agriculture: Foreign agricultural services. [Online] Available from:
http://www.fas.usda.gov/psdonline/psdDownload.aspx. [Accessed: 2010-05-06].
Wheat Foods Council (WFC). 2005. Grains of truth about “Wheat production and consumption.”WHEAT
[Online] available from: www.wheatfoods.org_FileLibrary/Product/43/Wheat%
20Prod.%20&%20Consumption.pdf [Downloaded: 05-04-2010].
Workman, D. 2006. Top ten wheat countries.
[Online] available from: http://internationaltrade.suite101.com/article.cfm/top_ten_wheat_countries
[Downloaded: 04-04-2010].
World health organization (WHO) (2010). Health impacts of the global food security crisis. [Online]:
http://www.who.int/food_crisis/en/ [Downloaded: 01-2010].