what’s the story? which place is the most developed?
DESCRIPTION
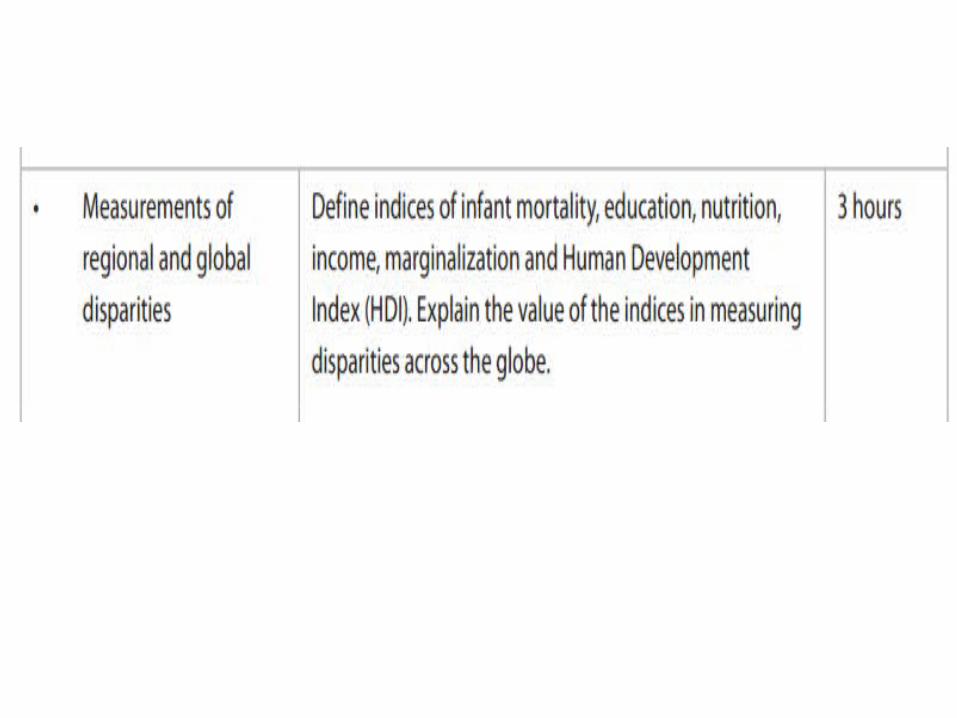
Measuring Development Objective – To learn the best way to measure and monitor the level of development in a country in a useful and reliable manner. Outcome – a completed composite model of development and an ability to be able to criticise other techniques.TRANSCRIPT
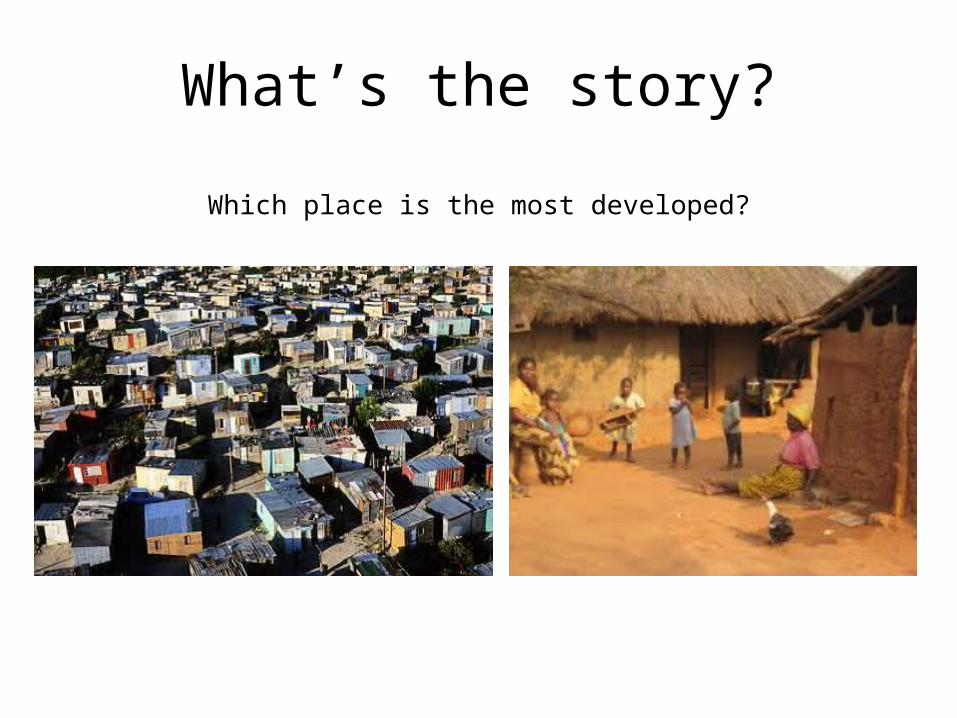
What’s the story?
Which place is the most developed?

Measuring Development
• Objective – To learn the best way to measure and monitor the level of development in a country in a useful and reliable manner.
• Outcome – a completed composite model of development and an ability to be able to criticise other techniques.
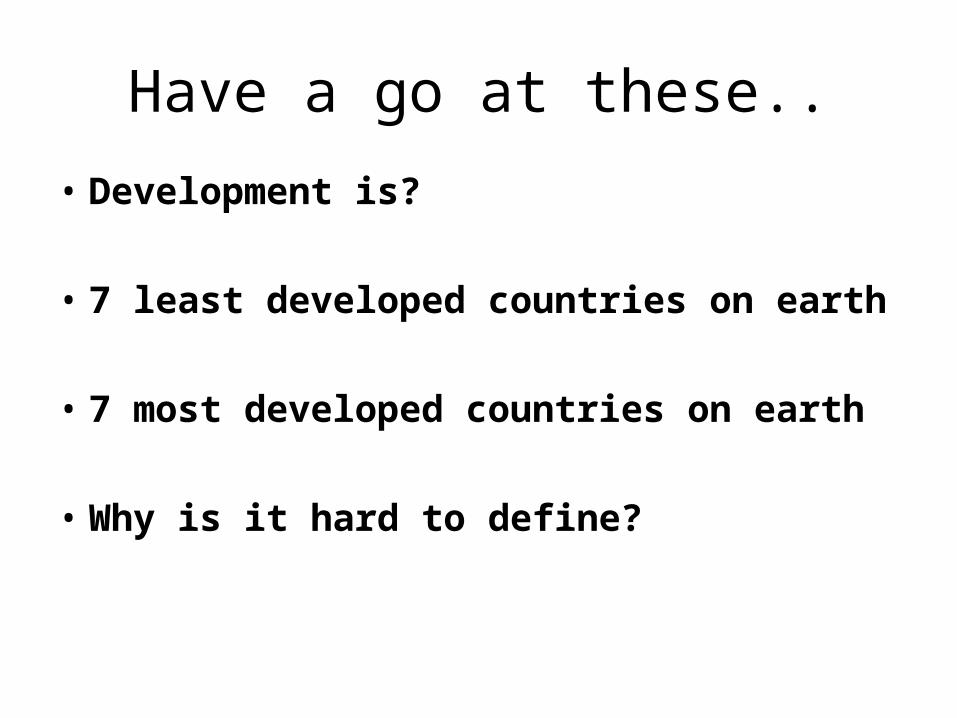
Have a go at these..
• Development is?
• 7 least developed countries on earth
• 7 most developed countries on earth
• Why is it hard to define?

‘The rich are getting richer and the poor are getting poorer’
True or False?

Gaps are important!
• https://www.ted.com/talks/richard_wilkinson
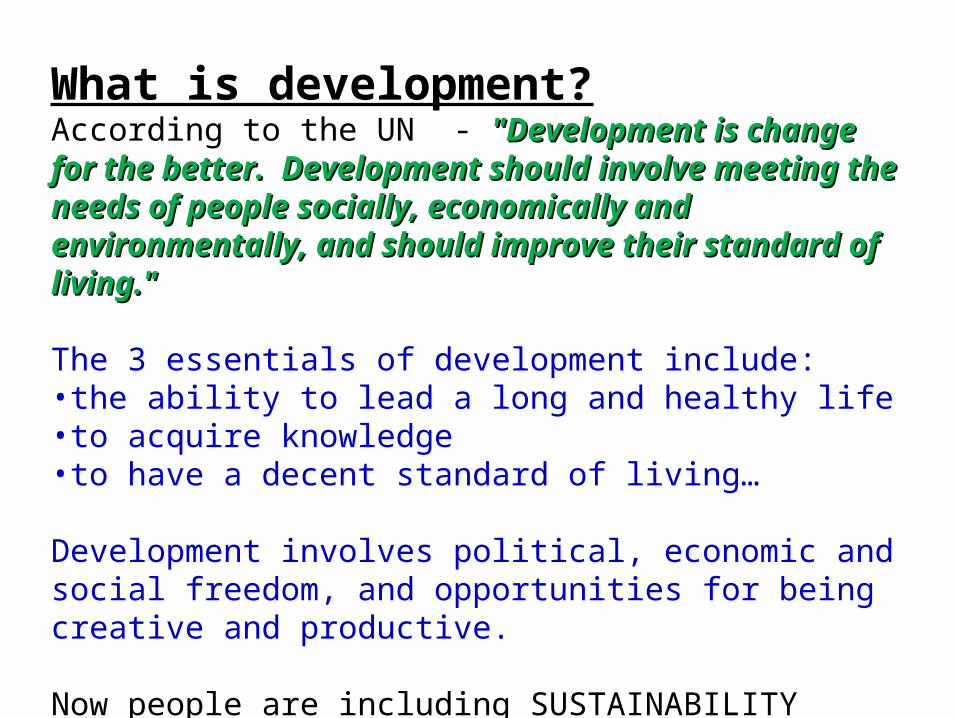
What is development?According to the UN - "Development is change "Development is change for the better. Development should involve for the better. Development should involve meeting the needs of people socially, meeting the needs of people socially, economically and environmentally, and should economically and environmentally, and should improve their standard of living."improve their standard of living."
The 3 essentials of development include: •the ability to lead a long and healthy life•to acquire knowledge•to have a decent standard of living…
Development involves political, economic and social freedom, and opportunities for being creative and productive.
Now people are including SUSTAINABILITY

Most of the world is actually quite undeveloped..

What indicators can you use to work out how
developed a country is?

Traditional measures of developmentTraditional measures of development• Gross Domestic Product (GDP)Gross Domestic Product (GDP) • Gross National Product (GNP)Gross National Product (GNP)
Now use GNINow use GNI• GROSS NATIONAL INCOMEGROSS NATIONAL INCOME‘‘total value of goods and services total value of goods and services
produced within a country produced within a country together with the balance of together with the balance of income and payments from or to income and payments from or to other countries’other countries’

an example of GNP an example of GNP Country GNP US$
Per capita MEDC’s Luxembourg 71,000
USA 44,000
LEDC’s Brazil 8,800
Philippines 5,000
Somalia 600
Malawi 600
Estimated 2012

What are the problems with What are the problems with using GNI as a measure of using GNI as a measure of
development?development?

What are the problems of using GNI per capita as a measure of
Development?
•It doesn’t take into account inequalities in income within countries, it only shows a national average. E.g. Saudi Arabia has a high GNI, but most money belongs to a few people•Doesn’t include subsistence sector•It doesn’t show regional variations (SE and NE Brazil)•It does not take into account the local cost of living •It fails to pick up on the social and environmental costs of development (e.g. air pollution)•A high GNI doesn’t necessarily mean money spent on other indicators e.g. health, education

What is the North/South What is the North/South Divide?Divide?
• By using GNI we can see that there is By using GNI we can see that there is a big divide between the ‘rich’ north a big divide between the ‘rich’ north and the ‘poor’ south and the ‘poor’ south
• Otherwise known as the Brandt line after Willy Brandy ‘discovered’ in 1966 that most MEDCs are in the northern hemisphere.


Brandt line
This term is now outdated
Poverty line is now USED
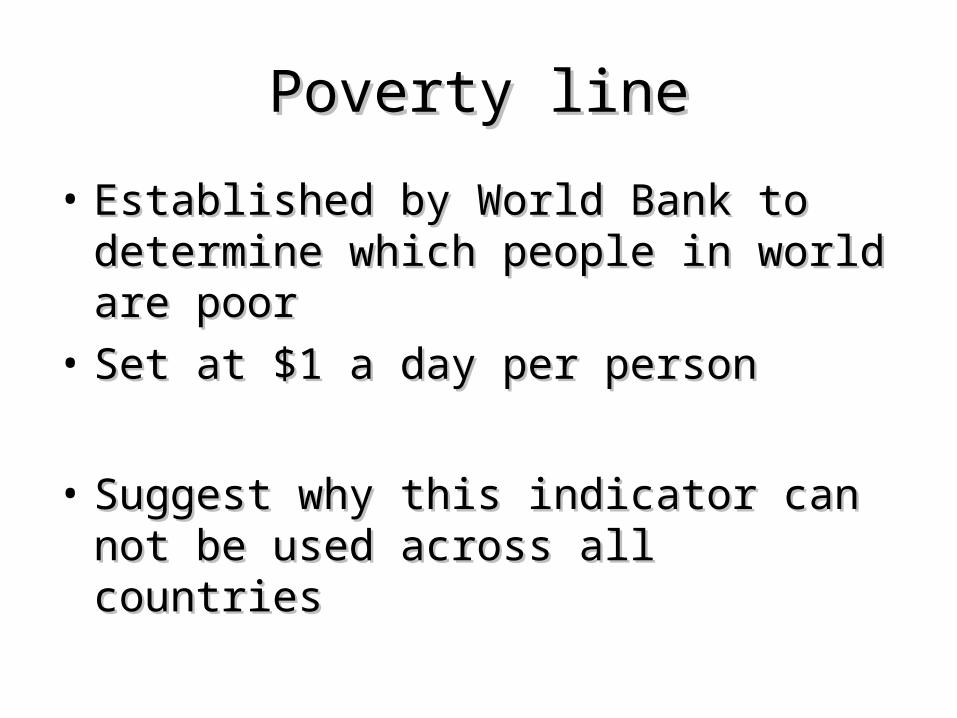
Poverty linePoverty line• Established by World Bank to Established by World Bank to
determine which people in world are determine which people in world are poorpoor
• Set at $1 a day per personSet at $1 a day per person
• Suggest why this indicator can not be Suggest why this indicator can not be used across all countriesused across all countries

Hmm.. How can we check the gap?• Measurement effectively began in the 1970’s. Willy Brandt published a report on the
wealth of nations. He used total money in the countries to draw up a crude map• It’s where the terms first, second and third world come from• It only includes wealth per person in the countries measured.… a bit flawed! What
else do you think should be included in any measurement?

Next up – during the early 1980’s the UN used Gross Domestic Product
• Measuring development levels is a challenge.• Traditionally development has measured using economic
data such as GDP or GNI per capita.
• You add up the total wealth in the country generated in a year and divide by the total population.
• These measures fail to recognise:
1. Income distribution 2. The local value of money3. The non-money economy e.g. barter and exchange
Development is not just about money…
• It is also important to recognise that development has social and quality of life aspects
• Measures such as life expectancy, education level, access to sanitation are important
• What else should be included in any measurement?

As a result, in 1986 the Overseas development Council introduced the first composite model for measuring development.
• Physical Quality of Life Index (PQLI) Life expectancy + Literacy rate + Infant Mortality rate
• It was deemed good to start with but by the mid 1990’s many HiC’s were scoring the same for all three indicators.
• Another criticism was that it didn’t include money directly..

Eventually in 1992 the UN came up with the current method of measurement and comparison
• The Human Development Index (HDI)
• Life expectancy at birth + Literacy rate + Enrolment rate + GDP per capita PPP - then it is ranked.. They measure every year and publish a ‘Development Report’
http://hdr.undp.org/en/data/trends/ http://hdrstats.undp.org/en/indicators/default.html
• What do the 2010 HDI figures tell us about – who is developed and what is happening to the gap

The Human Development IndexThe Human Development Index
• Since 1990, the UN has urged the use of Since 1990, the UN has urged the use of the HDI as a measure of development. It the HDI as a measure of development. It is a more accurate and reliable measure is a more accurate and reliable measure of development as it includes three of development as it includes three indices of well-being.indices of well-being.– Life ExpectancyLife Expectancy– Literacy and SchoolingLiteracy and Schooling– Purchasing Power Parity (PPP)Purchasing Power Parity (PPP)
• HDI is out of 1, therefore the closer to 1 HDI is out of 1, therefore the closer to 1 the more developed the countrythe more developed the country

Top countries in 1999 on HDI Iceland, Norway, Canada

Bottom countries in 1999 HDI Sierra Leone, CAR, DR Congo
Philippines in 2009 was 102 in the world out of 179 (in the medium category)
Has the top and bottom changed since then…?
Is the gap getting wider according to HDI…?
https://data.undp.org/dataset/Table-1-Human-Development-Index-and-its-components/wxub-qc5k
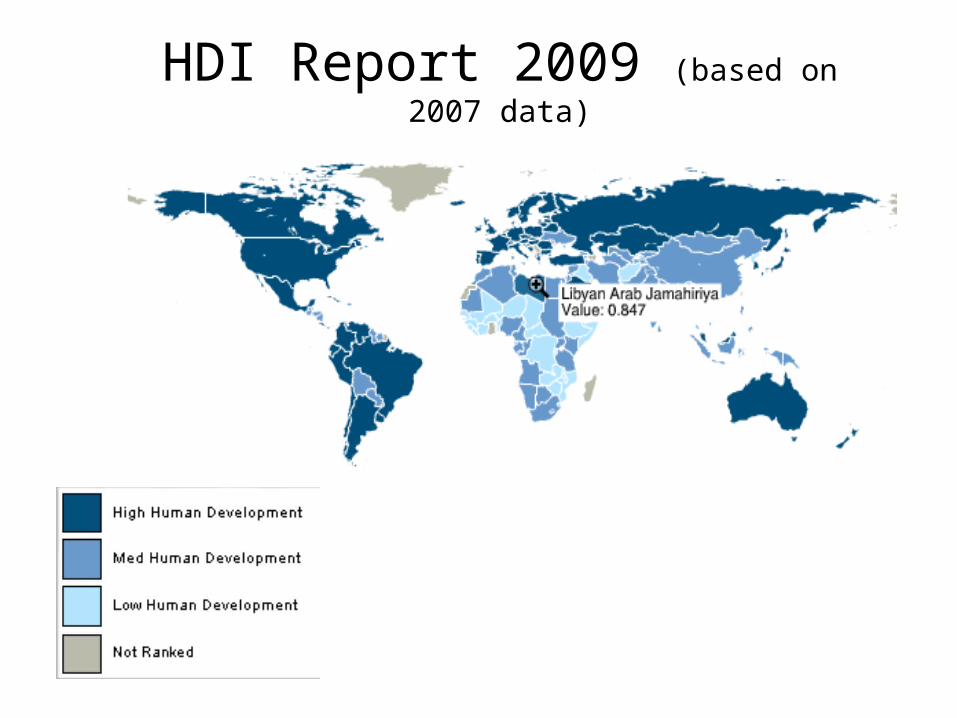
HDI Report 2009 (based on 2007 data)

Can you think of any problems with HDI?

What are the limitations of the HDI?What are the limitations of the HDI?
• Doesn’t focus on health and Environmental IssuesDoesn’t focus on health and Environmental Issues• Does not take into account youth and infant Does not take into account youth and infant
malnutritionmalnutrition• Masks regional disparitiesMasks regional disparities• It shows relative not absolute development, so that It shows relative not absolute development, so that
if all countries improve at the same rate the if all countries improve at the same rate the poorest countries will not get any credit for poorest countries will not get any credit for progress.progress.

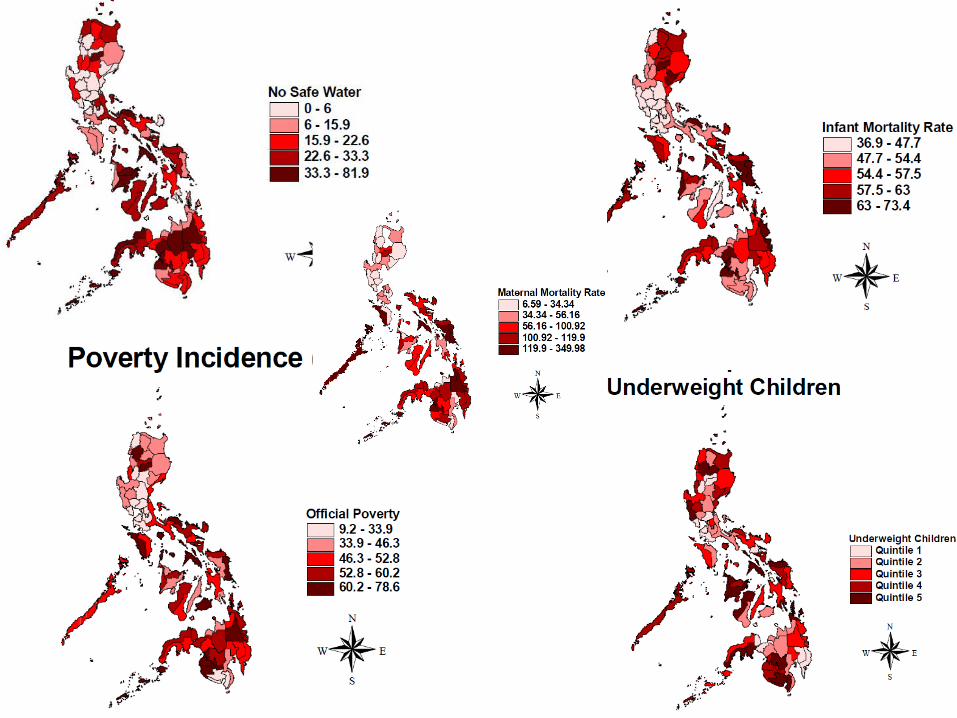
Philippines Case study - HDI

However national averages can conceal a great deal of information
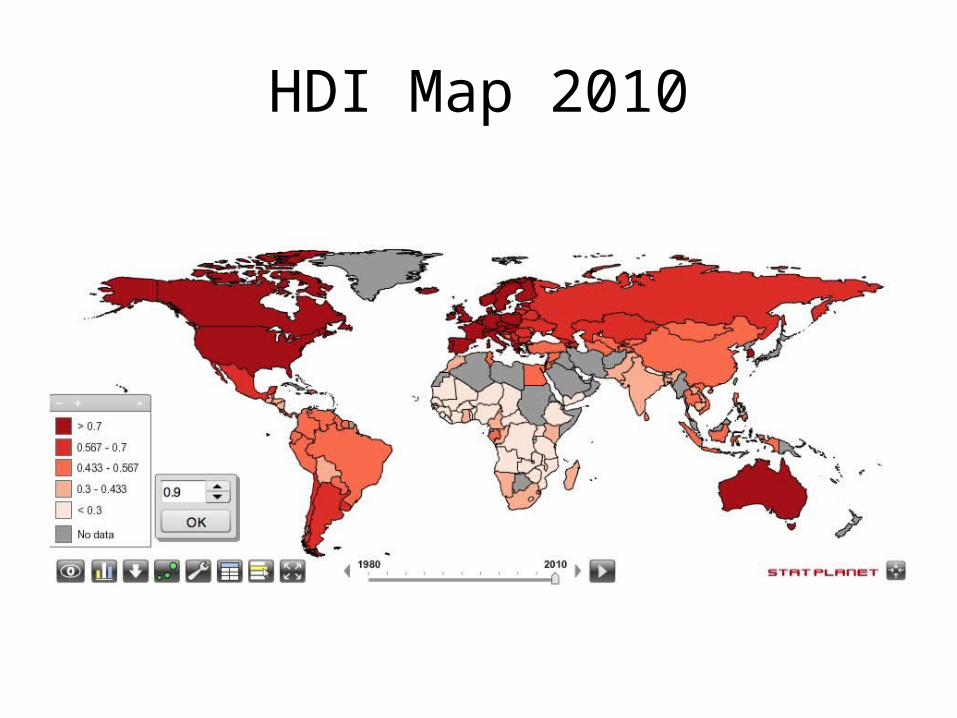
HDI Map 2010
HDI is now perhaps in need of updating
• It now suffers from the same problem as PQLI (see data table)
• Mind you, any tool for measurement is flawed due to logistics, time, money, reliability.. Still, we shall have a go.
• Its time for a new one and we are going to design it….
• That’s where you come in!

Back to the excel file…
Design your own development ‘composite measurement’ tool
• What shall we add to the excel file supplied?
• What do you think is important?
• We will use this excel file to compare countries in 2010 – is yours different to the UN?
• We will compare the size of the gap since 1990 when you complete your hw.

Source….
• http://hdr.undp.org/en/statistics/data/
• http://hdr.undp.org/en/reports/global/hdr2000/
• Going back further.. The atlas!
Is the gap between the winners and losers closing?
Since 1980, the percentage of people living in extreme poverty has fallen from 40% to
20% of world population.
But, because of population growth the total number of people is extreme poverty is still
very high.

• The development gap relates to global inequality
• Around 2.8 billion people live on under $2 per day (‘moderate poverty’)
• Some 1.1 billion people live on less than $1.25 per day (‘extreme poverty’)
• Over time a greater proportion of wealth has concentrated in the hands of the richest 20% of people, compared to the poorest 20% of people

• Who are the current winners and losers globally? According to the UN …
What is the development Gap?
• It is the gap between….
• Has it been like this for a long time?
• The winners and losers are pretty much the same as ten, twenty years ago.
http://hdr.undp.org/en/data/trends/ http://www.sacmeq.org/statplanet/StatPlanet.html
• Is the cliché ‘the rich get richer and the poor get poorer’ true? Is the gap at least closing….?

Task – Compare the value of a variety of methods of measuring wealth and development disparities. (15)
• GDP/GNI• PPP• Poverty line• PQLI• HDI• MDG’s• A new composite
Shocked?
• https://www.ted.com/talks/hans_rosling_shows_the_best_stats_you_ve_ever_seen