what’s the difference? diversity constructs as separation ... · what’s the difference?...
TRANSCRIPT

WHAT’S THE DIFFERENCE? DIVERSITYCONSTRUCTS AS SEPARATION, VARIETY,
OR DISPARITY IN ORGANIZATIONS
DAVID A. HARRISONThe Pennsylvania State University
KATHERINE J. KLEINUniversity of Pennsylvania
Research on organizational diversity, heterogeneity, and related concepts has prolif-erated in the past decade, but few consistent findings have emerged. We argue thatthe construct of diversity requires closer examination. We describe three distinctivetypes of diversity: separation, variety, and disparity. Failure to recognize the meaning,maximum shape, and assumptions underlying each type has held back theory devel-opment and yielded ambiguous research conclusions. We present guidelines forconceptualization, measurement, and theory testing, highlighting the special case ofdemographic diversity
Differences are a challenge. Organizationshave struggled to embrace and manage themsuccessfully. Researchers have struggled to con-ceptualize and study them effectively. Theoriespredict differing effects of such differences—that they will spark integrative insights, creativ-ity, and innovation (e.g., Finkelstein & Ham-brick, 1996; Hoffman & Maier, 1961), or that theywill provoke conflict, division, and dissolution(e.g., Chatman, 1991; Tajfel & Turner, 1979).Guided by these theories, research on differ-ences of many kinds, including demographicvariables, values, skills, personality, and pay,has burgeoned. The volume of such researchhas nearly doubled every five years, with a jointABI-Inform–PsycInfo search yielding 19 “diver-sity” investigations in 1988, 45 in 1993, 66 in 1998,and 134 in 2003.
Yet, as noted by many authors, the payoff fromthis profusion of research has been disappoint-ing (e.g., Harrison, Price, & Bell, 1998; Pitcher &
Smith, 2001). Cumulative findings about the con-sequences of within-unit differences have beenweak, inconsistent, or both. A recent meta-analysis of the effects of task-related (e.g. ten-ure) and non-task-related (e.g., ethnic and gen-der) diversity revealed no dependable effects onperformance or cohesiveness (Webber & Don-ahue, 2001). Summarizing a narrative review ofthe same domain, Jackson, Joshi, and Erhardtconcluded, “Our examination of these studiesyielded few discernible patterns in the results.For most diversity dimensions, the findingsacross studies were mixed” (2003: 810). Beyonddemographic diversity, Bloom and Michelreached a similar conclusion: “Research hasyielded mixed results about what amount of paydispersion is optimal. In some cases, more dis-persed pay distributions have been positivelyrelated to performance outcomes. . . . In othercases, greater dispersion has been negativelyrelated to performance outcomes” (2002: 33).
In response to these disappointing cumulativeresults, organizational scholars have refinedtheir theories and analyses, typically by elabo-rating possible mediators and moderators ofconnections between within-unit diversity andunit outcomes (e.g., Bloom & Michel, 2002; Car-penter, 2002; Chatman & Flynn, 2001; Simons,Pelled, & Smith, 1999; Williams & O’Reilly, 1998).We applaud these efforts. But we suggest thatthe very construct of diversity requires closerexamination and refinement. Authors frequently
Author order was determined by the flip of a coin. We aregrateful to guest editor Terry Mitchell and two anonymousreviewers for supportive and constructive suggestions. PaulGoodman, Don Hambrick, David Hofmann, Susan Jackson,Charles O’Reilly, Ben Schneider, and Jonathan Ziegert alsoprovided helpful feedback and recommendations on earlierdrafts of this manuscript. We further appreciate the assis-tance of several current and former doctoral students inbackground research for this manuscript: Ellen Godfrey, An-drew Knight, Jessica Saltz, Amy Nicole Salvaggio, and Hock-Peng Sin.
� Academy of Management Review2007, Vol. 32, No. 4, 1199–1228.
1199Copyright of the Academy of Management, all rights reserved. Contents may not be copied, emailed, posted to a listserv, or otherwise transmitted without the copyrightholder’s express written permission. Users may print, download, or email articles for individual use only.

and casually use the term diversity and suchsynonyms as heterogeneity, dissimilarity, anddispersion. Yet the precise meaning of diversityis not clear. Casting a deliberately broad net,we seek to clarify the meaning of differenceswithin organizational units. We use “diversity”to describe the distribution of differences amongthe members of a unit with respect to a commonattribute, X, such as tenure, ethnicity, conscien-tiousness, task attitude, or pay. Diversity is aunit-level, compositional construct. Thus, in de-scribing the diversity of a given attribute withina unit (e.g., a group or organization), one de-scribes the unit as a whole, not a focal member’sdifferences from other members—which is thesubject of most relational demography research(e.g., Tsui, Egan, & O’Reilly, 1992). Diversity, aswe use the term, is also attribute specific. A unitis not diverse per se. Rather, it is diverse withrespect to one or more specific features of itsmembers.
We propose that diversity is not one thing butthree things. The substance, pattern, operation-alization, and likely consequences of those threethings differ markedly. Diversity within an or-ganizational unit may be indicative of separa-tion: differences in position or opinion amongunit members. Such differences reflect disagree-ment or opposition—horizontal distance along asingle continuum representing dissimilarity in aparticular attitude or value, for example. Alter-natively, within-unit diversity may be indicativeof variety: differences in kind or category, pri-marily of information, knowledge, or experienceamong unit members. And, finally, within-unitdiversity may indicate disparity: differences inconcentration of valued social assets or re-sources such as pay and status among unitmembers—vertical differences that, at their ex-treme, privilege a few over many. We use thisinsight—implicit in some of the diversity litera-ture, but neither widely recognized across do-mains nor fully understood—as the startingpoint for an analysis of the construct definition,theoretical substance, and methodological im-plications of each diversity type. We present thistypology in the hope of bringing greater theoret-ical insight, as well as empirical rigor, to thestudy of organizational diversity of all forms.
Below, we first provide a brief overview ofseveral examples of diversity theory and re-search, noting conceptual confusion in defini-tions of diversity and some resulting ambigu-
ities in the literature. We then offer a detailedpresentation of our typology, highlighting differ-ences in the meanings, maxima, and major the-oretical streams associated with the separation,variety, and disparity types. We explore the ty-pology’s implications for the special case of de-mographic diversity, showing that the same de-mographic differences within units may beconceptualized as separation, variety, or dispar-ity. Following this, we describe methodologicalconsequences of our diversity typology. We em-phasize the importance of matching a specificoperationalization of diversity to a specific con-ceptualization of diversity. In the final section ofthe paper, we describe new directions for diver-sity theory and empirical investigation, enabledand motivated by the diversity typology we pro-pose.
WHAT DO WE TALK ABOUT WHEN WE TALKABOUT DIVERSITY?
For many reasons, the organizational litera-ture on diversity is confusing—difficult to un-derstand and difficult to synthesize. It is difficultto synthesize in part because consistent find-ings and cumulative insights have not emerged,but also simply because the diversity literatureitself is so diverse. Much of it addresses within-unit differences in demographic variables: gen-der (e.g., O’Reilly, Williams, & Barsade, 1997),race and ethnicity (e.g., Riordan & Shore, 1997),age (Pelled, 1996), tenure (e.g., Hambrick, Cho, &Chen, 1996), education (e.g., Jackson et al., 1991),functional background (e.g., Jehn, Northcraft, &Neale, 1999), and marital status (e.g., Harrison,Price, Gavin, & Florey, 2002). Further, research-ers have investigated differences in many non-demographic variables, including values (e.g.,Jehn et al., 1999), attitudes (e.g., Harrison et al.,1998), conscientiousness (e.g., Barrick, Stewart,Neubert, & Mount, 1998), affect (e.g., Barsade,Ward, Turner, & Sonnenfeld, 2000), dress (e.g.,Rafaeli & Pratt, 1993), network ties (e.g., Beck-man & Haunschild, 2002), individual perfor-mance (e.g., Doerr, Mitchell, Schriesheim, Freed,& Zhou, 2002), and pay (e.g., Pfeffer & Langton,1988).
Synthesis is also made difficult by the variedtheoretical perspectives used to guide diversityresearch. Often, these perspectives suggest con-tradictory effects. And each perspective has re-ceived some (albeit mixed) support in empirical
1200 OctoberAcademy of Management Review

studies. One such perspective draws on similar-ity attraction (Byrne, 1971) and social categoriza-tion (Tajfel, 1981; Turner, 1985) theories to sug-gest that diversity of attributes such as age,values, and personality limits within-unit be-havioral and social integration, fosters conflictand turnover, and diminishes morale, cohesion,and performance (Williams & O’Reilly, 1998). Asecond theoretical perspective draws from eco-logical and cognitive models of variation, selec-tion, and retention (e.g., Campbell, 1960) and thecybernetic principle of requisite variety (Ashby,1956) to highlight the benefits of heterogeneityin information resources. This perspective sug-gests that diversity of attributes such as func-tional background, tenure, and range of networkties may enrich the supply of ideas, unique ap-proaches, and knowledge available to a unit,enhancing unit creativity, quality of decisionmaking, and complex performance (Williams &O’Reilly, 1998). A third perspective builds on dis-tributive justice theory (e.g., Adams, 1963;Deutsch, 1985), tournament theory (e.g., Lazear,1995; Lazear & Rosen, 1981), and stratification,status hierarchy, or status characteristics theo-ries (e.g., Berger, Fisek, Norman, & Zelditch, 1977;Blau, 1960). This perspective highlights relativecomparisons among members to suggest thatwithin-unit diversity, typically of pay but also ofother valued assets or resources that connoteprestige or power, leads to internal competition,suppression of voice, reduced (quality of) com-munication, and interpersonal undermining.
Finally, synthesis is made difficult because,as a term, diversity has a taken-for-grantedquality in the organization literature; it is sel-dom explicitly defined. Researchers use a vari-ety of labels, often interchangeably, to refer todiversity, including dispersion, heterogeneity,dissimilarity, disagreement, divergence, varia-tion, and inequality, or their opposites, includ-ing homogeneity, similarity, agreement, consen-sus, convergence, and equality. But the moreserious problem is that diversity investigatorshave offered only spare or generic definitions ofthe principal construct. For example, Hambrickand his colleagues defined top managementteam heterogeneity as “variation in team mem-bers’ characteristics” (1996: 662). Pelled, Eisen-hardt, and Xin defined demographic diversity as“the extent to which a unit (e.g., a work group ororganization) is heterogeneous with respect todemographic attributes” (1999: 1). Jehn et al. de-
fined value diversity by noting that it “occurswhen members of a workgroup differ in terms ofwhat they think the group’s real task, goal, tar-get, or mission should be” (1999: 745).
None of these definitions is inappropriate. In-deed, our definition of diversity above is quitesimilar. However, even the most exacting ofthese definitions ties diversity to differencesand goes no further. The definitions do notpinpoint and substantiate the nature of thosedifferences, nor do they specify the collectivedistribution—the compositional pattern of dif-ferences—within a unit. On the one hand, read-ers may discern from such definitions the mean-ing of minimal diversity: it occurs when thereare no differences on attribute X among themembers of a unit. On the other hand, the dis-tribution, shape, and meaning of maximal diver-sity are less clear. We know what is least di-verse but not what is most diverse, and,therefore, the direction of “more” (or less) diver-sity can be ambiguous. For example, when aresearcher studies diversity in tenure, personal-ity, or pay, is diversity maximized when the at-tribute in question is evenly distributed amongunit members such that each point along thecontinuum or each category is represented? Oris diversity maximized when unit members arepolarized, half very high and half very low, onthe attribute in question? Could diversity bemaximized when one unit member clearly sur-passes all the other members? Last, is the shapeof maximum diversity different depending onthe X attribute a researcher is investigating, hisor her theoretical perspective, or the predictedeffects of increasing diversity? One can confi-dently order organizational units in terms of in-creasing amounts of cohesion, morale, size, orperformance. But units that are ordered in termsof increasing diversity are difficult to visualize.
Because the diversity literature has devotedlittle attention to these kinds of elemental ques-tions, the construct of diversity is murky. Thefield needs a deeper understanding of themeanings(s) of within-unit differences (Law-rence, 1997). Scholars lack a shared terminologyor typology to compare their conceptualizationsof within-unit differences. We present such atypology of diversity below. We believe it hasthe potential to aid scholars in refining theirtheoretical propositions, in matching their opera-tionalizations to their constructs, and in inte-grating their research findings.
2007 1201Harrison and Klein
A DIVERSITY TYPOLOGY: SEPARATION,VARIETY, AND DISPARITY
We start with a brief example to juxtaposeand preview the distinctive nature of each di-versity type. Consider three research teams.Each team is studying how patients experiencemedical treatment in hospitals. Each team con-sists of eight members. Members of Team S dif-fer in their attitude toward a particular researchparadigm. Half of the team’s members revererichly descriptive, interpretive inquiry; the otherhalf disparage it. The members of Team V differin their disciplinary backgrounds. One is a psy-chologist, another is a human factors engineer,and the others include a microeconomist, soci-ologist, anthropologist, linguist, hospital admin-istrator, and practicing physician. Finally, themembers of Team D vary in their research emi-nence or rank. One member of the team is ahighly accomplished professor who is renownedfor having formulated seminal theories of pa-tient interactions with health care professionals;the other members of the team are getting theirfirst behavioral science research experience.
Diversity is obvious within each team. Yet thecontent and likely outcomes of diversity differacross the teams. In Team S, diversity in teammembers’ endorsement of qualitative research
reflects separation: team members hold oppos-ing positions on a task- or team-relevant issue.In Team V, team member diversity in disciplin-ary background reflects variety: together, teammembers bring a multiplicity of informationsources to bear on the research question. InTeam D, diversity is associated with disparity:one member of the team is superior to the otherteam members in research expertise, and pre-sumably in status as well. The three teams notonly differ in the type of diversity they representbut also in the attribute of diversity present ineach team (attitude toward qualitative research,disciplinary background, and member prestige).
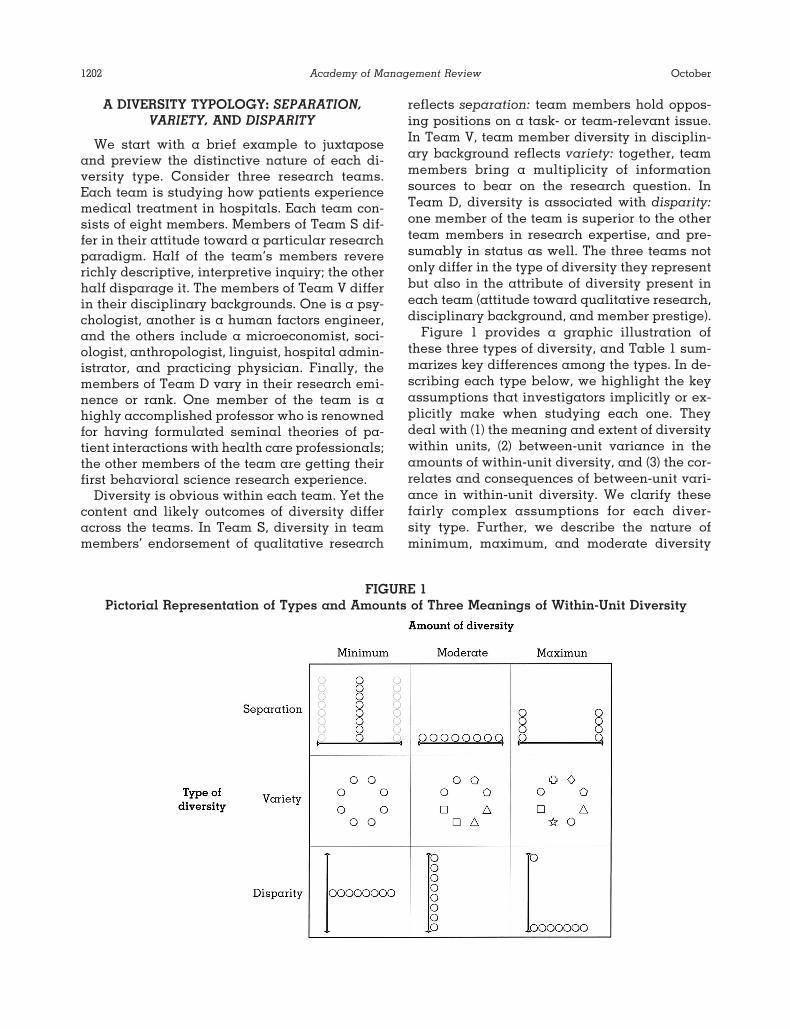
Figure 1 provides a graphic illustration ofthese three types of diversity, and Table 1 sum-marizes key differences among the types. In de-scribing each type below, we highlight the keyassumptions that investigators implicitly or ex-plicitly make when studying each one. Theydeal with (1) the meaning and extent of diversitywithin units, (2) between-unit variance in theamounts of within-unit diversity, and (3) the cor-relates and consequences of between-unit vari-ance in within-unit diversity. We clarify thesefairly complex assumptions for each diver-sity type. Further, we describe the nature ofminimum, maximum, and moderate diversity
FIGURE 1Pictorial Representation of Types and Amounts of Three Meanings of Within-Unit Diversity
1202 OctoberAcademy of Management Review

amounts for each type. Finally, we note exam-ples from the literature of theoretical and empir-ical analyses consistent with each diversitytype. In choosing examples, we have tempo-rarily excluded those involving organizationaldemography, precisely because demographicdiversity within a unit may be conceptualized asseparation or variety or inequality. We arguethat this uncertainty contributes to the difficultyin conceptualizing and testing diversity’s ef-fects. Accordingly, a discussion of alternativeconceptualizations of demographic differencesas separation, variety, or disparity follows ourinitial presentation of each diversity type.
Separation
Key assumptions. Many hypotheses or theo-ries about diversity propose that (1) within units,members differ from one another in their posi-tion along a single continuous attribute—a lat-eral continuum S (e.g., positive affect, percep-tions of leader charisma, organizationalcommitment); (2) units differ in the extent towhich their individual members are colocatedalong S—in some units, members are close to
one another, but in other units, members aremore widely spread; and (3) differences amongunits in the extent to which their members aredispersed along S lead to a set of systematicconsequences (e.g., higher or lower cohesion). Inour lexicon, theories and studies of this type reston an idea of diversity as separation. McGrath,Berdahl, and Arrow’s (1995) description of VBA(value, belief, attitude) diversity is generallyconsistent with the idea of diversity as separa-tion, as is the notion of value diversity (Williams& O’Reilly, 1998). Typically, theorists and re-searchers who examine separation also assumethat this diversity type has symmetric effects.That is, homogeneity on S is often predicted tobe beneficial whether all members are high on Sor all members are low on S.
Minimum, maximum, and moderate separa-tion. Row 1 of Figure 1 depicts minimum, mod-erate, and maximum separation within a unit.Minimum separation occurs when all of themembers of a unit occupy the same position atany location along the S continuum. In someresearch areas, minimum separation might bereferred to as perfect agreement within the unit(James, Demaree, & Wolf, 1993). Minimum sepa-
TABLE 1Meanings and Properties of Within-Unit Diversity Types
DiversityType
Meaning andSynonyms
Attribute Shape atMaximum Diversity
AttributeExamples
PredictedOutcomesa
FoundationalTheories
Separation (onattribute S)
Composition of differencesin (lateral) position oropinion among unitmembers, primarily ofvalue, belief, or attitude;disagreement oropposition
Bimodal distribution,with half of unitmembers athighest andlowest endpointsof S continuum
Opinions, beliefs,values, andattitudes,especiallyregarding teamgoals andprocesses
Reduced cohesiveness,more interpersonalconflict, distrust,decreased taskperformance
Similarity attraction;social categor-ization; attraction,selection, andattrition (ASA)
Variety (onattribute V)
Composition of differencesin kind, source, orcategory of relevantknowledge or experienceamong unit members;unique or distinctiveinformation
Uniform distribution,with even spreadof members acrossall possiblecategories of V (nocontinuum)
Content expertise,functionalbackground,nonredundantnetwork ties,industryexperience
Greater creativity,innovation, higherdecision quality,more task conflict,increased unitflexibility
Informationprocessing; law ofrequisite variety;variation,selection, andretention (VSR)
Disparity (onattribute D)
Composition of (vertical)differences in proportionof socially valued assetsor resources held amongunit members; inequalityor relative concentration
Positively skeweddistribution, withone member athighest endpointof D continuumand others atlowest
Pay, income,prestige, status,decision-makingauthority, socialpower
More within-unitcompetition,resentful deviance,reduced memberinput, withdrawal
Distributive(in)justice and(in)equity; statushierarchy;tournament; socialstratification
a Generally, but not in all diversity conceptualizations or studies.
2007 1203Harrison and Klein

ration can happen anywhere on the continuumof interest. Number theory, however, shows thatmaximum separation occurs only when unitmembers are equally split and at opposing end-points of the S continuum (Harrison & Sin, 2006).That is, the utmost separation occurs when thereare two (and only two) staunchly divided butbalanced blocs within a team, each holding aposition on S as far from the other as possible.Team S, above, shows maximum separationalong the continuum of “attitude toward inter-pretive research methods.” Moderate or limitedseparation occurs when unit members showsome, but only some, spread or disagreementalong the continuum. Perhaps most unit mem-bers occupy the same position, and only a fewhold differing positions. Or perhaps unit mem-bers are uniformly spread across the continuum,as Figure 1 shows (middle cell of first row).
Diversity as separation in theory and re-search. Theories of similarity attraction (Byrne,1971; Clore & Byrne, 1974; Newcomb, 1961), socialidentity and self-categorization (Hogg & Terry,2000; Tajfel & Turner, 1979), and attraction-selection-attrition (Schneider, 1987; Schneider &Goldstein, 1995) are invoked most often for di-versity as separation. Investigators adoptingthese arguments posit that greater similarity—reduced separation—yields higher levels of co-operation, trust, and social integration (e.g.,Locke & Horowitz, 1990). Conversely, diversityscholars often draw on these theories to positthat units whose members differ markedly on acontinuum will experience low cohesion, highconflict, high rates of withdrawal, and poor per-formance (e.g., Tsui, Ashford, St. Clair, & Xin,1995). For example, Harrison et al. examined theconsequences of team members’ diversity intask meaningfulness and outcome importance,positing that “people find it more pleasurable tointeract with others who have similar psycho-logical characteristics, because that interactionverifies and reinforces their own beliefs, affect,and expressed behaviors” (2002: 1031).
Minimum separation is thus likely to be psy-chologically comforting to unit members withregard to S. No one challenges anyone else’sposition on the S continuum, because each oftheir positions is equivalent. As many havenoted, this kind of attitudinal or psychologicalconformity on S may cause individuals to as-sume that they are not only similar on S but
similar in other ways as well (Janis & Mann,1977; Nemetz & Christensen, 1996).
Few diversity theorists have addressed theshape and likely consequences of maximumseparation. When separation is at its maximum,unit members are, by definition, polarized on S.The unit comprises two extreme and opposingfactions. If the diversity attribute is of centralimportance to team identity and task comple-tion, then a unit’s social network is also likely tobifurcate into two dense clusters or cliques, withfew or no team members bridging the structuralhole between them. Gibson and Vermeulen’sdiscussion of subgroups within teams is consis-tent with this notion: “Members of a subgroupmay . . . cohere and share opinions more oftenwithin the subgroup than with others, whichmay lead to irritation in the team and disputesbetween the different factions” (2003: 203).
Variety
Key assumptions. In a second approach towithin-unit diversity, theorists and researchersassume that (1) within units, members differfrom one another qualitatively—that is, on acategorical attribute V (e.g., functional back-ground, source of external information); (2) unitsdiffer in the extent to which their members areevenly spread across all the categories of V; and(3) differences between units in their relativespread or diversity on V will be associated, usu-ally positively, with vital unit consequences(e.g., problem-solving or group decision quality,firm performance). Symmetry or asymmetry withrespect to attribute V is a nonissue; V has nohigh or low. Instead, the distribution of V isassumed to indicate variety: the number andspread of “batches” of information content, ex-perience, or unique network ties availableacross unit members. Variety broadens the cog-nitive and behavioral repertoire of the unit.McGrath et al. (1995) borrow from human re-sources management in referring to one versionof variety as KSA (knowledge, skill, and ability)diversity. Blau (1977) originally termed a form ofthis diversity type heterogeneity, but that termitself has gained a variety of meanings in theliterature (Lau & Murnighan, 1998). Others (e.g.,Jehn et al., 1999; Williams & O’Reilly, 1998) referto a similar concept as information diversity.Miner, Haunschild, and Schwab call this type“categorical variability” (2003: 790).
1204 OctoberAcademy of Management Review

Minimum, maximum, and moderate variety.As with the other types of within-unit diversity,minimum variety is straightforward. It occurswhen all members belong to the same categoryof attribute V (see row 2 of Figure 1). Using com-munication theory terms, such members are re-dundant in that there is no information gainedby adding more persons to the unit who occupythe same V category (Shannon, 1948). Maximumvariety is the more interesting case. It is therichest possible distribution of information,when each member within a unit comes from aunique category of V. These lower and upperbounds of variety connect to how a number ofresearchers refer to “perfect homogeneity” ormaximum heterogeneity within a unit (e.g.,Priem, 1990). The hospital researchers in Team Vhave maximum heterogeneity or variety forscholarly background; each member representsa distinct scientific field.
The distinction between minimum and moder-ate variety is fairly stark. The latter requires atleast one member to come from a different cat-egory on attribute V than all the other members.That first, unique individual with respect to Vbrings the biggest step up or the largest mar-ginal increase in information for the unit (Shan-non, 1948). From a variety viewpoint, the “oddperson out” with respect to V is the most crucial.Note that because there are only two categories,a dyad can have only minimum or maximumvariety, but not moderate variety (a dyad canhave moderate separation and moderate dispar-ity). Hence, the study of diversity as variety isfundamentally altered for units with two versusmore than two members. A more extreme view(Harrison & Sin, 2006) would be that any type ofdiversity is undefined for dyads because there isonly a single difference—no distribution of dif-ferences—between members.
Diversity as variety in theory and research.Most formulations of diversity as variety areconsistent with the idea that an organizationalunit is an information processing instrument forthe organization (Hinsz, Tindale, & Vollrath,1997). The unit senses, evaluates, and respondsin ways that are designed to be adaptive to theenvironment. Based on well-known axioms ininformation processing or cybernetic theory (lawof requisite variety; Ashby, 1956), populationecology, and even human cognition theory (vari-ation and selective retention; Campbell, 1960),the fundamental idea is that teams in organiza-
tions can translate greater information richnesswithin a unit into better choices, plans, or prod-ucts. Units whose members draw from differentpools of informational resources—their knowl-edge, functional background, experience, orrange of external social ties (e.g., Argote & In-gram, 2000; Austin, 2003; Finkelstein & Ham-brick, 1996)—will make more effective decisionsand deliver more creative products than unitswhose members draw from the same pool ofresources (Jackson, May, & Whitney, 1995). Infact, Carpenter describes this type of diversityas “sociocognitive horsepower” (2002: 280). Mem-bers with diverse kinds of human capital or ac-cess to different sources of data (Hambrick &Mason, 1984; Marsch, 2002; Wiersema & Bantel,1992) collectively serve as a team’s lens, eachfiltering unique environmental cues and inter-preting them for the rest of the unit’s members.Similarly, units whose members have nonredun-dant (i.e., nonoverlapping) external network tieshave access to information that other units, lack-ing in such variety, cannot easily obtain (Austin,2003; Beckman & Haunschild, 2002). Units whosemembers bridge structural holes in an interunitnetwork are thus likely to be more creative andproductive (Burt, 2002; Hansen, 1999; Reagans &Zuckerman, 2001). As Ferrier describes it: “Byway of greater awareness in sensing strategicproblems, heterogeneous teams can match com-plex competitive challenges and uncertain con-texts with a requisite level of cognitive and ex-periential variety” (2001: 858).
When the within-unit distribution of V is at itsmaximum, “everybody is different, and every-body has a unique viewpoint to offer” (Gibson &Vermeulen, 2003: 208). When maximum variety ispresent, members may be quite open and recep-tive to one another’s views. Because each unitmember is different from everyone else, unitmembers cannot form coalitions with like oth-ers; they have to reach across category bound-aries to coordinate and connect. In contrast,moderate variety, evidenced by the presence ofsubstantial overlap in some but not all mem-bers’ knowledge, may lead to problems of “un-shared information” (Gruenfeld, Mannix, Wil-liams, & Neale, 1996; Stasser, Vaughan, &Stewart, 2000). Members may fail to discuss in-formation not shared by all or the majority of thegroup.
2007 1205Harrison and Klein

Disparity
Key assumptions. In the organizational litera-ture, conceptual and empirical treatments of di-versity as separation or as variety are relativelycommon. Treatments of diversity as disparityare not. They are more common and long-standing in sociology, where the term inequalityreigns (Blau, 1977). We forward disparity as adifferent term to clearly distinguish our within-unit discussion from the dominant focus of so-ciological studies on distributions of incomeacross entire populations. In developing andtesting hypotheses regarding the effects of with-in-unit diversity as disparity, theorists and re-searchers focus on a socially valued or desiredresource D (e.g., pay, power, prestige, status);more of D is always better. Disparity-based re-search assumes that (1) within units, memberscan differ in the extent to which they hold orreceive a share, amount, or proportion of D; (2)units differ in the extent to which D is distrib-uted among or possessed by their members—insome units members have equal shares of D, butin other units one or a few members hold adisproportionate share of D relative to other unitmembers; and (3) differences among units in theextent to which their D is distributed equallyamong unit members lead to predictable andimportant consequences (e.g., fewer member ex-pressions of voice).
A disparity conceptualization also involvesone more assumption that the direction of differ-ence along the D continuum matters. Disparityis asymmetric. This asymmetry assumption isnonintuitive. Because disparity describes therelative distribution of a valued asset or re-source, disparity is high if 10 percent of a unit’smembers “own” a great deal of D (e.g., prestigeor pay) while 90 percent of unit members havevery little. Disparity is low, however, if 90 per-cent of a unit’s members own a great deal of Dwhile only 10 percent have very little. In the firstcase, 90 percent of the unit’s members are dis-advantaged relative to the privileged few. In thesecond case, only 10 percent of the unit’s mem-bers are disadvantaged relative to the over-whelming majority.
Minimum, maximum, and moderate disparity.Row 3 of Figure 1 depicts minimum, moderate,and maximum disparity within a unit. Minimumdisparity occurs when all of the members of aunit occupy the same position. Minimum dispar-
ity is member parity with respect to D. Maximumdisparity, however, occurs when only one unitmember outranks all others—that is, when oneunit member’s level of D is at the top of thecontinuum and all other members’ levels are atthe bottom. Research Team D, studying patients’treatment experiences in hospitals, exhibitsmaximum diversity. There is one veteran re-searcher accompanied by seven rookies. Allisonaptly described maximum disparity as “one in-dividual has everything and everyone else hasnothing” (1978: 869). Moderate or limited dispar-ity occurs when unit members show some, butonly some, differences along the continuum de-fined by the valued resource. Some membersoutrank and outclass the others, but differencesamong unit members are compressed. Moderatedisparity is of focal interest in some areas ofsociology (Homans, 1961; Phillips & Zuckerman,2001) and social psychology (e.g., Berkowitz &McCaulay, 1961). Those in the middle of D con-form more readily to unit norms than those athigh and low ends (although the latter segmentshave different reasons for nonconformity).
Diversity as disparity in theory and research.Disparity (inequality) in asset, resource, or val-ued good distribution is a central pattern in so-ciological theories of stratification (Grusky,1994). Although inequality of valued resources isalso typical in organizational units, theories andinvestigations addressing diversity as disparityin organizations are surprisingly rare. The clear-est examples emerge from the literature on paydispersion (Bloom, 1999). As Bloom and Michelexplain, “More dispersed pay structures concen-trate pay among fewer employees at the top . . .thereby providing relatively rich rewards forthese employees and relatively poor rewards forthe rest” (2002: 33). Building on theories of rela-tive deprivation (e.g., Deutsch, 1985) and tourna-ment compensation (e.g., Lazear, 1995; Lazear &Rosen, 1981), researchers commonly predict thatstatus, power, or pay disparity incites competi-tion, differentiation, and (resentful) devianceamong some unit members (e.g., Bloom, 1999;Homans, 1961; Pfeffer & Langton, 1993; Siegel &Hambrick, 2005). Disparity might also foster con-formity, silence, suppression of creativity, andwithdrawal (Hollander, 1958; Pfeffer, 1998; Pfef-fer & Davis-Blake, 1992).
A conceptualization of diversity as disparity isalso apparent in theory and research address-ing status and power hierarchies in work units
1206 OctoberAcademy of Management Review

(for some of the foundational theories, see Phil-lips & Zuckerman, 2001). When disparity in agroup is at its maximum, one member of the unitoutranks all others. He or she holds the lion’sshare if not all of a valued unit resource. Eisen-hardt and Bourgeois’ (1988) study of top manage-ment team (TMT) strategic decision-making pro-cesses provides an example. When a CEO’spower far exceeded that of other TMT members,creating high power disparity in the team, theCEO was likely to engage in “tactics for control-ling and withholding information,” and theother executives in the team were likely to en-gage in “alliance and insurgency behaviors”(1988: 743). Ultimately, marked disparities inteam member power diminished team perfor-mance by distracting team members from keytasks and interrupting the flow of information.These team-level observations are corroboratedby research documenting behaviors when indi-viduals are located at (dis)advantaged or dis-parate status positions in teams (e.g., Berger,Rosenholtz, & Zelditch, 1980; Cohen & Zhou, 1991;Lefler, Gillespie, & Conaty, 1982). As Keltner,Gruenfeld, and Anderson summarize, “High-power individuals talk more, interrupt more, aremore likely to speak out of turn, and are moredirective of others’ verbal contributions than arelower-power individuals” (2003: 277).
Finally, social network analysis provides an-other intriguing link to this diversity type. If thevalued resource, D, is social capital, the struc-ture of a network might illustrate disparity. So-cial capital is accessed and conveyed throughinterpersonal ties (Adler & Kwon, 2002). When aunit’s network structure is highly centralized,network ties are unevenly distributed. Only oneor a few members are highly central and, thus,highly influential. The other unit members areon the periphery of the network, with few or evenno links to other unit members. Centralizationmay thus “be viewed as a measure of how un-equal the individual actor values are” (Wasser-man & Faust, 1994: 176). Suppose knowledge oftask process is conceptualized as a valued re-source, D (a form of expert power; French &Raven, 1959), and it is held by a single person.The unit therefore has maximum disparity. Sucha condition might translate into a social networkwith maximum centralization, in which unitmembers build ties or turn to only that personfor advice.
Implications of the Diversity Types for TheoryBuilding
The three diversity types are fundamentallydistinct. Separation describes differencesamong unit members in their position on a hor-izontal continuum. Variety describes differencesamong unit members from different categories,reflecting access to unique sources of knowl-edge. Disparity describes differences amongunit members in their portion of a valued re-source. Separation thus reflects stand point orposition: the distribution of where membersstand on a value, belief, attitude, or orientation.Variety reflects information: the distribution ofwhat each unit member knows that is uniquefrom other members, as a function of the distinctcontent of his or her education, training, or ex-perience. Disparity reflects possession: the dis-tribution of how much of a socially valued com-modity each unit member has.
The three diversity types also differ in theirrelevance to key theoretical perspectives andare commonly (but not necessarily) associatedwith different outcomes. These distinctions areobscured when researchers and theorists definediversity loosely or not at all. Conversely, ex-plicit reference to diversity types shouldsharpen researchers’ predictions, requiring theadoption, explanation, and justification of a spe-cific conceptualization. Further, explicit refer-ence to diversity types allows scholars to con-trast and debate their views; they will have acommon language to capture their convergentor divergent ideas. Finally, explicit reference todiversity types paves the way for researchers toaddress the potentially interactive effects ofseparation, variety, and disparity, a point wereturn to in the final section of the paper. Ac-cordingly, we propose the following.
Guideline 1: Theory building regard-ing diversity is enhanced by authors’explicit specification and justificationof the diversity type of interest: sepa-ration (S), variety (V), or disparity (D).
Despite distinctions among their meanings,there is little to distinguish the three types ofdiversity when each is minimized (see Figure 1).All members within a unit hold the same valueof a variable, regardless of what the variablerepresents. The three diversity types arestrongly differentiated, however, by their dis-
2007 1207Harrison and Klein

tinctive shape and meaning under maximumdiversity.
As shown in row 1 of Figure 1, maximum sep-aration occurs when a unit is divided into twodivergent camps. As separation increases fromminimum to maximum, unit members grow in-creasingly polarized in their placement along acontinuum. Were a researcher studying othertypes of diversity, however, the same distribu-tion would be indicative of modest variety (onlytwo of a possible eight categories are present) orof medium disparity (50 percent of the unit are“haves” and 50 percent are “have nots”). Maxi-mum variety, shown in row 2 of Figure 1, occurswhen a unit is composed of members who eachrepresent a different category. As variety in-creases from minimum to maximum, unit mem-bers grow increasingly differentiated in theirknowledge, experience, or perspectives; they oc-cupy distinct information categories within theunit. Were those eight categories reoriented aspoints along a continuum, however, the samedistribution would indicate only modest separa-tion or modest disparity. Distance among theunit members, which is part of the evidence foreither separation or disparity, is limited. Finally,maximum disparity is evident when a single(upper echelon) member towers over all other(lower echelon) members in a unit, as shown inrow 3 of Figure 1. As disparity increases fromminimum to maximum, the concentration of aunit’s resource in a single member grows dis-proportionately.
In contemplating these maxima, scholars maygain a new and deeper appreciation of themeaning of unit diversity. Attention shifts from aconsideration of isolated differences among themembers of dyads within a unit to a consider-ation of the pattern of differences within the unitas a whole. Maximum separation does not sim-ply mean that unit members are quite differentfrom one another; it means that they are polar-ized into opposing subunits. Maximum varietymeans that each member is one of a kind. Max-imum disparity means that power, status, orother valued resources are grossly unbalanced.
We see the possibility of new theoretical prop-ositions and hypotheses as scholars build onthese insights. Perhaps maximum separationleads to strong subunit identification and weakunit identification (Gibson & Vermeulen, 2003).In units with maximal separation on an impor-tant team-relevant attribute, members are likely
to have tight interpersonal bonds within theirsubunit and antipathy toward those in the op-posing subunit. Perhaps maximum variety doesnot lead to conflict, as is sometimes predicted(e.g., Jehn et al., 1999; Pelled et al., 1999), but toopenness toward other ideas, since no oneshares the same idea. These conjectures lead usto suggest the following.
Guideline 2: Theory building about di-versity is enhanced by a careful visu-alization of the shape and conse-quences of maximum separation,maximum variety, or maximum dis-parity. In contemplating these max-ima, scholars shift their focus from dif-ferences within dyads to the pattern ofdifferences within the unit as a whole.
Implications for Theories and Evidence AboutDemographic Diversity
In some areas of research, the conceptualiza-tion of diversity as separation, variety, or dis-parity is already quite clear (cf. Bloom, 1999). Inothers areas it is much less so. An important—even dominant—case under the latter conditionis investigation of demographic diversity. Thedemographic variables most frequently in-cluded in diversity studies are age, sex, race/ethnicity, organization and team tenure, educa-tion level, educational content, and functionalbackground (Jackson et al., 2003; Ragins &Gonzalez, 2003; Williams & O’Reilly, 1998). Thelast two on this list—educational content (majoror specialty) and functional background—seemto be obvious forms of diversity as variety. Thesetwo attributes capture qualitative differences inthe kinds of information held by unit members.But within-unit diversity with respect to each ofthe other demographic attributes may be mean-ingfully conceptualized as separation or as va-riety or as disparity. Uncertainty regarding theprecise meaning of tenure, age, gender, andrace/ethnicity differences within a unit has, webelieve, compounded the challenge of conceptu-alizing and testing diversity effects (Priem,Lyon, & Dess, 1999).
Tenure is a noteworthy and often studied ex-ample (Pfeffer, 1983). Researchers might arguethat tenure diversity within a unit is best con-ceptualized as separation; the less separatedteam members are along the tenure continuum,
1208 OctoberAcademy of Management Review

the more likely they are to have similar atti-tudes, beliefs, and values, to be drawn to oneanother, and to identify with one another.O’Reilly, Caldwell, and Barnett have positedthat “similarity in time of entrance into thegroup may facilitate both attraction and interac-tion” (1989: 33). Alternatively, tenure diversitymight be conceptualized as variety. In this view,teams that vary in tenure include members ofdiffering cohorts who thus differ in their experi-ences, their information bases, and their inter-nal and external network ties (e.g., Ancona &Caldwell, 1992; Hambrick et al., 1996). Finally,tenure diversity might be conceptualized as dis-parity (e.g., Tsui, Xin, & Egan, 1995). Becauseindividual tenure may be positively associatedwith status or authority within a team (e.g., Dra-zin & Rao, 1999), tenure diversity within a teammay result in empowerment (access to valuedresources) of the team’s long-entrenched elitesand disempowerment of the team’s initiates.
Gender diversity might also be conceptual-ized as separation, as variety, or as disparity. Itdoes not fall along a continuum. But if gender isinstead treated as a salient marker or a symbolfor a status continuum or for task preferenceswithin a unit (Konrad & Gutek, 1987; Ragins &Sundstrom, 1989; Ridgeway, Johnson, &Diekema, 1994), each of the other conceptualiza-tions of diversity appears plausible. Scholarsimplicitly conceptualize gender diversity asseparation when they suggest that (1) it reflectsa distribution of opposing beliefs about the ap-propriateness of critical team processes or out-comes, (2) it is negatively related to cohesionand identification within a unit, and (3) theseeffects are symmetric such that gender diversityhas comparable effects when a unit is numeri-cally dominated by men or by women. In sug-gesting that men and women have qualitativelydifferent caches of knowledge such that genderdiversity within a unit may spark creativity andinnovation, scholars instead invoke gender di-versity as variety (e.g., Wood, 1987). Finally, inhighlighting power differences between menand women and the asymmetric consequencesof within-unit gender diversity, scholars de-scribe gender diversity as disparity (e.g., Cohen& Zhou, 1991; Linnehan & Konrad, 1999; Ragins &Sundstrom, 1989; Tsui, Egan, & O’Reilly, 1992).Indeed, Konrad has proposed this conceptual-ization over a conceptualization of gender diver-sity as separation or variety: “Scholarship mak-
ing arguments that relationship difficultiesbetween identity groups are caused by misun-derstandings due to cultural differences whiledownplaying the effects of prejudice and dis-crimination denies the everyday inequalitiesexperienced by disadvantaged identity groups”(2003: 11).
Each of these examples still begs a generalquestion: Absent a deductive theory, if a demo-graphic variable distributed within a unit canindicate any diversity type, what meaningshould scholars impute for it? In short, whichtype is right? We believe that this depends, inpart, on unit members’ context-dependent in-terpretations of the variable in question. Thus,the meaning of within-unit diversity in demo-graphic attribute X is likely to be be shapedby the unit’s primary purpose or superordinategoal and unit members’ beliefs regarding theassociation between demographic attribute Xand deeper-level attributes (see Harrison et al.,1998).
Consider the following contexts for age diver-sity. In employee advisory committees for firmretirement benefits, member age might covarywith self-interest in particular policies. Further,members’ implicit theories of age may includethis link, leading age diversity to operate asseparation. In teams of software engineers as-sembled to solve problems in a firm’s informa-tion systems architecture (e.g., Year 2000 prob-lems), age might covary with a particular“legacy” versus “object-oriented” programmingorientation, and team members should recog-nize it. Here, age diversity might be taken tomark variety. In units such as orchestras, lawenforcement squads, or student project teams,older members (not just longer-tenured ones)might be seen as possessing higher levels oftask-relevant experience, tacit knowledge, orstreet smarts. Age would thus be associatedwith status, and diversity in age could betreated as disparity.
Parallel arguments can be made for within-unit diversity in education level, race, or eth-nicity as reflecting each of the three diversitytypes (e.g., Watson, Kumar, & Michaelson, 1995;see Ragins & Gonzalez, 2003, for a review). Be-cause demographic variables are the most com-monly studied vehicles of diversity, but perhapsthe least well connected to any of the three di-versity types, we offer the following recommen-dation.
2007 1209Harrison and Klein
Guideline 3: In cases for which diver-sity of unit members on the same char-acteristic (e.g., tenure) may be mean-ingfully conceptualized in differentways—that is, as separation, as vari-ety, or as disparity—precise specifica-tion of diversity type is essential. Itallows theorists to differentiate andcompare conceptual models, facilitat-ing understanding and cross-fertiliza-tion and paving the way for empiricaltests of contrasting conceptions.
METHODOLOGICAL IMPLICATIONS OF THEDIVERSITY TYPOLOGY: LINKING THEORY
ABOUT DIFFERENCES TO METHOD
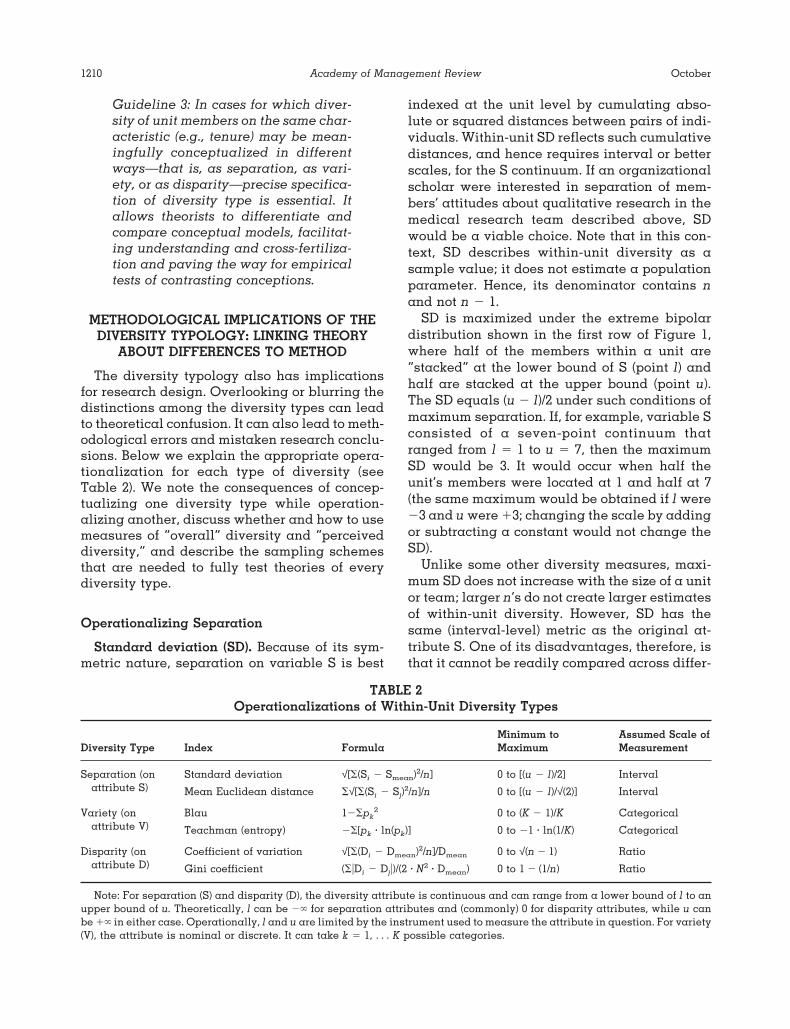
The diversity typology also has implicationsfor research design. Overlooking or blurring thedistinctions among the diversity types can leadto theoretical confusion. It can also lead to meth-odological errors and mistaken research conclu-sions. Below we explain the appropriate opera-tionalization for each type of diversity (seeTable 2). We note the consequences of concep-tualizing one diversity type while operation-alizing another, discuss whether and how to usemeasures of “overall” diversity and “perceiveddiversity,” and describe the sampling schemesthat are needed to fully test theories of everydiversity type.
Operationalizing Separation
Standard deviation (SD). Because of its sym-metric nature, separation on variable S is best
indexed at the unit level by cumulating abso-lute or squared distances between pairs of indi-viduals. Within-unit SD reflects such cumulativedistances, and hence requires interval or betterscales, for the S continuum. If an organizationalscholar were interested in separation of mem-bers’ attitudes about qualitative research in themedical research team described above, SDwould be a viable choice. Note that in this con-text, SD describes within-unit diversity as asample value; it does not estimate a populationparameter. Hence, its denominator contains nand not n � 1.
SD is maximized under the extreme bipolardistribution shown in the first row of Figure 1,where half of the members within a unit are“stacked” at the lower bound of S (point l) andhalf are stacked at the upper bound (point u).The SD equals (u � l)/2 under such conditions ofmaximum separation. If, for example, variable Sconsisted of a seven-point continuum thatranged from l � 1 to u � 7, then the maximumSD would be 3. It would occur when half theunit’s members were located at 1 and half at 7(the same maximum would be obtained if l were�3 and u were �3; changing the scale by addingor subtracting a constant would not change theSD).
Unlike some other diversity measures, maxi-mum SD does not increase with the size of a unitor team; larger n’s do not create larger estimatesof within-unit diversity. However, SD has thesame (interval-level) metric as the original at-tribute S. One of its disadvantages, therefore, isthat it cannot be readily compared across differ-
TABLE 2Operationalizations of Within-Unit Diversity Types
Diversity Type Index FormulaMinimum toMaximum
Assumed Scale ofMeasurement
Separation (on Standard deviation √[�(Si � Smean)2/n] 0 to [(u � l)/2] Intervalattribute S) Mean Euclidean distance �√[�(Si � Sj)
2/n]/n 0 to [(u � l)/√(2)] Interval
Variety (on Blau 1��pk2 0 to (K � 1)/K Categorical
attribute V) Teachman (entropy) ��[pk � ln(pk)] 0 to �1 � ln(1/K) Categorical
Disparity (on Coefficient of variation √[�(Di � Dmean)2/n]/Dmean 0 to √(n � 1) Ratioattribute D) Gini coefficient (��Di � Dj�)/(2 � N2 � Dmean) 0 to 1 � (1/n) Ratio
Note: For separation (S) and disparity (D), the diversity attribute is continuous and can range from a lower bound of l to anupper bound of u. Theoretically, l can be �� for separation attributes and (commonly) 0 for disparity attributes, while u canbe �� in either case. Operationally, l and u are limited by the instrument used to measure the attribute in question. For variety(V), the attribute is nominal or discrete. It can take k � 1, . . . K possible categories.
1210 OctoberAcademy of Management Review

ent separation variables. Relative amounts ofdiversity on, say, team members’ protestantwork ethic cannot be put side by side with theirattitudes toward their supervisor, if the protes-tant work ethic measure ranges from 1 to 7 andthe attitude toward supervisor measure rangesfrom 1 to 5.
Mean Euclidean distance. Within a unit, theEuclidean distance of one member, i, from allthe other members, j, is the root mean squareddistance between each of those i,j pairs on at-tribute S: √[�(Si � Sj)
2/(n)] (Tsui et al., 1992). TotalEuclidean distance is the sum of Euclidean dis-tances for all n unit members. The maximum(team-level) Euclidean distance is √[(n � 1)(u �l)2/n]. For our polarized team S, the maximum is5.61.
Because this—or any other diversity measuresummed over all possible dyads—increaseswith team size, we recommend use of an aver-age Euclidean distance, which has a maximumvalue of (u � l)/ [√(2)] � 4.24. That formula has avery similar structure to the maximum SD for-mula: [(u � l)/2]. Befitting proper indexes of sep-aration, both average Euclidean distance andSD reach their peak under the same conceptualconditions of maximum separation—a bimodaldistribution with the modes occurring on bothendpoints of the S continuum. The Euclideandistance index shares a weakness with SD inthat it also cannot be compared across variableswith different metrics. Given their conceptualand mathematical similarities, there is no par-ticular advantage of either operationalizationover the other, save for researcher familiaritywith SD (see Bedeian & Mossholder, 2000).
Operationalizing Variety
Blau’s index. Continuous distances are notmeaningful under a conceptualization of diver-sity as variety; qualitative distinctions are. Itis through the spread of members across quali-tatively different or novel categories that thecognitive and behavioral repertoire of a unit ispresumed to increase. When variable V is dis-persed across members who might be in one ofk � 1, . . . K possible categories, such as thedifferent scientific backgrounds represented bythe research team (V) studying hospital patientexperiences described above, SD is inappropri-ate. Euclidean distances are sensible only to theextent that a 0 or 1 “distance” refers to pairs of
individuals from the same or different catego-ries, respectively (see Figure 1; Harrison & Sin,2006). Blau’s index (1977) builds on this qualita-tive difference foundation, and it is the mostcommonly employed measure for diversity asvariety (e.g., Bunderson & Sutcliffe, 2002).
Blau’s index is also known as Herfindahl’s(1950) index and Hirschman’s (1964) index, but itwas originally proposed by Simpson (1949) as ameasure of species diversity in an ecosystem.Language from the latter domain can be helpfulin understanding the meaning of Blau’s indexscores. Its computational formula is 1 � �pk
2,where p is the proportion of unit members in kthcategory. Values of Blau’s index can range fromzero to (K � 1)/K. Its maximum occurs whenmembers of a team, Vk, are spread equally—called “evenness” or relative abundance of spe-cies in the ecological literature (Hill, 1973)—overall possible K categories—called “richness” ofspecies. Having an even spread of membersover the richest number of information sourcescorresponds well to our definition of maximumvariety; evenness and richness contribute to ahigher Blau’s index. A more statistical interpre-tation is that Blau’s index reflects the chancethat two randomly selected group members be-long to different categories (tap into differentinformation sources).1
Because its maximum is limited by K (but lessso as K gets larger; if K � ��, the limit would be1.0), Blau’s indexes are also not directly compa-rable when the number of categories is not thesame across diversity variables. For instance,one cannot equate Blau’s index for gender(maximum Blau value is .5) with Blau’s index forthe disciplinary backgrounds in team V (witheight persons spread evenly across K � 8 cate-gories, the maximum Blau value is .875). Somemight regard this difference in maxima as rea-sonable; if there are K � 2 versus K � 8 informa-tion categories, there is less potential varietyfrom gender than from disciplinary background.Further, if two groups differ in size but eachgroup shows maximum variety (i.e., in each
1 Blau’s index was originally developed by Simpson (1949)for sampling with replacement from an infinite population.When used to measure diversity within a group, sampling isdone with replacement from a finite population, and 1 ��pk
2 might be substituted by 1 � �[nk(nk � 1)/(n(n � 1))]. Inthe latter formula, nk is the frequency of unit members in thekth category, and n is unit size.
2007 1211Harrison and Klein
group no two members have the same func-tional background), there is a potential for moredistinct categories to be present in the largergroup. Therefore, if one takes Blau’s index (orTeachman’s, see below) as a literal or “true”value for variety, maximum possible variety in-creases with unit size; there is a “richer” set ofpossible information categories to draw from. Ifthis is an unpalatable assumption, a way tostandardize Blau’s index is to divide by its the-oretical maximum, yielding the Index of QualityVariation (IQV: Agresti & Agresti, 1978; Mueller,Schuessler, & Costner, 1970). Blau’s index andIQV are used in social network research to opera-tionalize availability of unique sources of infor-mation or social capital (Marsden, 1990).
Teachman’s (entropy) index. The computa-tional formula for Teachman’s index (1980; orig-inally developed by Shannon, 1948, in the com-munications literature) is ��[pk � ln(pk)], where pis again the proportion of unit members in thekth category. As unit members are spread moreevenly and across a richer number of V catego-ries, Teachman’s index rises. Its maximum oc-curs under the same conditions as Blau’s index,but it takes a slightly different value: �1 � ln(1/K).Therefore, Teachman’s index is likewise not di-rectly comparable across different V-type vari-ables, as long as each variable has a differenttotal number of categories. It is further limitedby the situation described above for Blau’s in-dex, when the number of unit members n is lessthan the possible total number of informationcategories K. Both indexes have been shown tobe part of a general class of diversity or infor-mation richness measures that have desirablemathematical properties (Hill, 1973), althoughTeachman’s index always yields a larger num-ber than Blau’s. The only advantage one opera-tionalization of variety would have over theother is that Blau’s index occupies a somewhattidier range of 0 to (a value close to) 1.
Operationalizing Disparity
Coefficient of variation. The formula for thecoefficient of variation (CV), √[�(Di � Dmean)2/n]/Dmean or, more simply, SD(D)/Dmean, captures theasymmetry that is fundamental to the conceptu-alization of diversity as disparity. Disparity re-flects both the distances between unit membersand the dominance of (concentration of the re-sources in) those who have higher amounts of
attribute D. When a privileged minority holdsmost of resource D relative to an underprivi-leged majority, there is greater disparity thanwhen the situation is reversed. Similarly, in theCV, division of the SD by the mean expresses theidea that diversity on a given attribute mattersless when resource D is typically high versustypically low (Sorenson, 2002). In the sociologyliterature, CV is often used as a measure ofincome inequality (Allison, 1978). There, thelogic of dividing the SD by the mean to capturedisparity is more obvious. The same amount ofvariability (say, SD[D] � $20K) in unit members’income is of less importance when unit mem-bers’ average income is higher (Dmean � $1M)than when it is lower (Dmean � $40K; Allison,1978; Sorenson, 2002).
The CV reaches its maximum when n � 1individuals are at the lower bound, l, of a ratio-level continuum (Allison, 1978; Bedeian & Moss-holder, 2000; Kimura, 1994). If l is zero, then allmembers of the unit but one hold none of D, andthe absolute value of the something held by thenth person does not matter. That sole person hasall of D in the unit. For example, if “number ofrefereed journal articles” were the status contin-uum being studied in Team D, the maximum CVwould not change if the single highly regardedand veteran researcher had 1 or 10 or 100 pub-lished papers—as long as the lower-rankingnovice members all had 0. Under these condi-tions, the CV is maximized in a way that reflectsonly within-unit size: √(n � 1) or, in this case, √(8� 1) � 2.65 (Champernowne, 1974).
Because the maximum CV is sensitive to sam-ple size, highly dispersed units with fewer mem-bers likely would be regarded as having lessdisparity than those with more members. Oneperson who has great power (D) over dozens ofothers is assumed to create more disparity thanthe individual who has great power over just ahandful of others. Martin and Gray (1971) offer astandardizing adjustment for unit size when thisassumption is untenable (see Beckman & Hauns-child, 2002, for an application to external net-work ties).
If the lower bound, l, is some number higherthan zero, the upper bound, u, does matter. Thefarther the distance on D that one or a few elitepersons are above the rest of the persons withina unit, the higher the CV. The more lopsided thewithin-unit distribution of D, with more personsat the bottom and a valued resource concen-
1212 OctoberAcademy of Management Review
trated in a few or one person at the top (see row3 of Figure 1), the larger the resulting CV value.These properties of CV (and of the Gini coeffi-cient, below) make disparity measures perhapsthe most volatile or sensitive of the three typesof diversity to the status of a single member. If asituation in which all unit members have none(or equally small portions) of the resource inquestion changes such that one person nowgains a large share, the unit quickly jumps fromminimum to maximum disparity.
Gini coefficient. The Gini coefficient or indexis used less often in organizational behavior orhuman resources research than in strategy andorganization theory, where it has been borrowedfrom its widespread application as a concentra-tion ratio in finance and economics. Its compu-tational formula is the sum of all pairwise ab-solute differences between unit members onvariable D, divided by [2 � Dmean � n2]; see Table1. Its maximum value is 1 � (1/n). Similar to CV,this maximum occurs when all but one unitmember have the lowest possible standing on D.Also as with CV, the Gini index is only appro-priate for D attributes that have ratio-level prop-erties (Allison, 1978; Kimura, 1994). Researchersmight choose the Gini index over CV if theyprefer their diversity measures to follow a com-mon metric, in this case ranging from 0 to(nearly) 1. The maximum value of the Gini indexdepends on n as well, but it should be less of alimiting factor than for CV when it is used inlarger versus smaller groups (see Martin &Gray, 1971, for a possible standardizing correc-tion for n).
On the Folly of Conceptualizing S or V WhileOperationalizing D
When researchers specify one diversity typebut operationalize another, they can draw erro-neous conclusions from their analyses. Figure 1helps to illustrate the point. As noted above, thedistribution of member scores or values that in-dicates maximum disparity is not indicative ofmaximum separation or maximum variety but,rather, of very limited separation or variety. Wil-liams and O’Reilly (1998) report CV to be themost widely applied diversity index in the liter-ature. Yet using CV (an appropriate operation-alization of disparity) to assess separation orvariety is misleading. Unfortunately, research-ers often do just this (e.g., Harrison et al., 1998;
Klein, Conn, Smith, & Sorra, 2001; Simons,Pelled, & Smith, 1999; Wiersema & Bird, 1993).
In using CV to operationalize diversity, re-searchers frequently cite Allison (1978), notinghis arguments that the use of CV is metriclessand that CV therefore provides a comparablemeasure of diversity in different attributes (un-like SD or Teachman’s index; Sorenson, 2002).However, Allison recommended CV for opera-tionalizing our disparity type of diversity. Forexample, he noted that CV provides a compara-ble measure of income inequality whether theattribute in question is dollars or yen. In thestudies cited above, and in many others, re-searchers sought to assess either separation(testing ideas based on similarity attraction) orvariety (testing ideas based on the leveraging ofunique information sources within a unit), butinstead assessed disparity. Hence, the conclu-sions of such research might be incorrect; theindex used was asymmetric but the conceptual-ization of diversity was symmetric.
Two examples may be instructive. Supposethat diversity in the variable “commitment tomeeting project deadlines” was conceptualizedin terms of separation. Also suppose the teamshad equal separation; SDs of commitment werethe same (SD � 10) in Team S1 and Team S2. Butin Team S1 the mean level of commitment was40 and in Team S2 it was 20. If an investigatorused CV as an operationalization of within-unitseparation, he or she would mistakenly con-clude that Team S2 (CV � .5) had twice theseparation as Team S1 (CV � .25).
Suppose that diversity in age was conceptu-alized in terms of variety: different age cohortslearn and know qualitatively different thingsthat might contribute to a unit. If one member ofan eight-person team were relatively old and allthe rest young (resulting in a low mean for age),a misapplied CV to member age would yield theconclusion of maximum team variety, but onlytwo “batches” of knowledge would exist. The CVwould be nearly minimized if there were oneyoung member and the rest were relatively old(resulting in a high mean for age), but this teamwould have, as above, just two “batches” ofknowledge.
These examples lead us to the guideline be-low. The basic principle is familiar: conceptual-ization must be aligned with operationalization.Theory must guide measurement, which is nu-
2007 1213Harrison and Klein

anced for diversity constructs. CV is not a uni-versal diversity index.
Guideline 4: The choice of a diversityindex should be driven by the theoret-ical specification of diversity type; re-searchers must answer what the vitaldifference is before they choose or de-sign indexes to measure it. If the spec-ified conceptualization and index ofdiversity are mismatched, researchconclusions may be misleading. Re-searchers specifying diversity as sep-aration should use versions of SD oraverage Euclidean distance. Re-searchers specifying diversity as vari-ety should use versions of Blau’s orTeachman’s (entropy) index. Re-searchers specifying diversity as dis-parity should use versions of CV or theGini coefficient.
Accounting for the Mean When Testing forDiversity Effects
The only difference between the formulasgiven above for CV and SD is that CV is a ratioof SD to the within-unit mean. This is more thana statistical quirk; it has significant substantiveimplications. Thus, it invites a consideration ofthe role of the within-unit mean in analyses ofdiversity effects.
The mean specifies the typical location of unitmembers on an S or D attribute. When separa-tion and disparity attributes have no upper orlower bounds (they can range from �� to ��),the within-unit mean tends to be uncorrelatedwith within-unit variability (Harrison & Sin,2006). However, most attributes do have upperand lower bounds in real data. Because the SDof a within-unit distribution is often lower whenthe mean is near the lower or upper bound(members are clustered near the “floor” or “ceil-ing”), there may be an artifactual overlap ofmeans and SDs across units. In short, mean andSD can be confounded.
Because of that potential confound, what ap-pears to be the effect of within-unit diversitymay be the (inverse) effect of the mean instead;the substantive interpretation of the latter effectis entirely different. Suppose, for example, a di-versity theory predicts that units with memberswho are part of more homogeneous (low-
variability) tenure cohorts tend to be more so-cially cohesive and committed to their unit, andtherefore will be less likely to quit. The theorypredicts a positive relationship at the unit levelbetween tenure diversity and turnover rate. Yetif lower variability in tenure was confoundedwith higher mean tenure across units, observingthe predicted positive relationship might be at-tributed to the empirical fact that those withlonger tenure (and greater investment with afirm) are simply less likely to leave. Thus, wejoin others (e.g., Jackson et al., 2003: 808) in urg-ing investigators to include the mean in tests ofdiversity as separation and disparity.
Guideline 5: In testing the relation-ship between separation or disparityof an attribute and other variables,researchers should first statisticallycontrol for the within-group mean ofthe attribute.
It might be asserted that because the mean isalready in the denominator of the CV formula, ifresearchers use CV as a disparity index, theywill already be controlling for the mean effectsmentioned above. However, as Sorenson (2002)shows, the CV ratio does not statistically controlfor the mean; it forces a particular moderatingstructure on within-unit data. Such a ratio forcesthe effect of SD(D) to be tempered or weakenedat a rate of 1/Dmean, mandating a SD(D) �1/Dmean interaction. The mean value of D has aneffect on the criterion of interest that opposesthe effect of variability at a very specific, 1/Dmeanrate. This mandated form of interaction in dis-parity measures is also a testable assumption.Researchers could enter both the SD(D) and1/Dmean in hypothesis testing, similar to the sug-gestion in Guideline 5. That is, in predicting unitturnover rate, Y, from disparity in tenure, thefirst regression model would be
Y � �0 � �1�SD(Tenure)� �
�2�1/mean(Tenure)� � �.
The second regression model that checks thecontribution of the specific functional form ofdisparity in the CV formula would be
Y � �0 � �1�SD(Tenure)� � �2�1/mean(Tenure)�
� �3�SD(Tenure) � 1/mean(Tenure)� � �.
1214 OctoberAcademy of Management Review
The impact of greatest interest to disparity re-searchers is reflected in the strength of �3.
Guideline 6: The use of common dis-parity measures carries an implicit as-sumption about the shape of a nega-tive interactive effect between thevariability and the mean of a diversityattribute. That assumption should betested by entering variability, mean,and the variability-by-mean interac-tion to see if the former is indeed mod-erated by the latter.
Operationalizing Demographic Diversity:Separation, Variety, and Disparity
The two guidelines above argue for a secondlook at previous studies of demographic diver-sity. As we have shown, diversity of age, sex,race, tenure, and education can all be, and havebeen, conceptualized as separation, variety, ordisparity. Researchers have often conceptual-ized one form of diversity (most commonly, sep-aration or variety) but then operationalized an-other (disparity). There is no post hoc statisticaladjustment that can be applied to publishedfindings from such research. Instead, authorswould need to revisit their previous work andreanalyze their primary data to match indexesto diversity types. In the absence of such reanal-yses, the validity of the conclusions of manyspecific studies, as well as of the narrative andquantitative reviews of the demographic diver-sity literature, may be called into question.Given the importance of the topic of demo-graphic diversity within organizations, we hopeour observations and guidelines will spur newresearch, as well as reexaminations of prior re-search. But the implications of our framework gobeyond the sphere of single demographic differ-ences, and we broaden our discussion below.
“Overall” Diversity
Diversity indexes are sometimes cumulated toindicate the “total” amount of dissimilarity, het-erogeneity, or difference within a unit—summedover several attributes. That is, researchersmight seek to assess overall within-unit diver-sity by adding or averaging diversity indexesfor, say, gender, education, race, and tenure.After doing so, they arrive at a single, global
value that characterizes each unit in the sample(e.g., Chatman & Flynn, 2001; Randel & Jaussi,2003).
For several reasons, we believe that this fus-ing of diversity indexes for several variables isunwise. First, as we have noted, a unit or teamitself does not have diversity (Jackson et al.,2003); an attribute of individuals within unitshas diversity, whether the within-unit distribu-tion of that attribute is thought of as separation,variety, or disparity. Second, it is clear that morediversity on such attributes has a unique mean-ing for each of the three diversity types. Thisprohibits summing, say, SD for separation inage with Blau’s index for variety in functionalbackground and CV for disparity in tenure. Theresulting amalgam has an indefinite interpreta-tion at best. Pitcher and Smith have noted this,stating, “Multiple proxies seem to cancel oneanother out and almost guarantee nonfindings”(2001: 14). Lau and Murnighan also have warnedthat such a combination would be “like cross-fertilizing apples and oranges” (1998: 327).
That leaves the possibility of adding severalvariables that, perhaps together, reflect a singlediversity type. For example, if diversity in gen-der and diversity in ethnic background wereboth conceptualized as variety, would it be rea-sonable to sum their diversity indexes and cre-ate an overall variety measure? To use the logicof conventional (reflective) measurement, oneassumes that different operationalizations arepositively correlated, manifesting the same un-derlying (variety) construct. Still, there is littlereason to expect measures of the variety (or sep-aration or disparity) of two independent at-tributes—such as gender and ethnicity—to beconsistently and positively correlated withinunits. Most diversity theories do not predict suchrelationships, nor do published correlationsamong diversity variables reveal convergentvalidity (e.g., Klein et al., 2001). Hence, we cau-tion against this approach.
It might be counterargued that measures ofdemographic diversity, such as gender varietyand ethnic background variety, serve not as re-flective indicators but as “formative” indicators(Bollen & Lennox, 1991; MacCallum & Browne,1993). As with the variables in a principle com-ponent, each formative indicator contributes to alinear composite that is simply the sum of itsparts. Diversity variables serving as formativeindicators would not need to share an underly-
2007 1215Harrison and Klein
ing construct that positively binds them together(although they would then have a different em-pirical meaning in every study), nor would theyhave to be the same diversity type.
However, there are two critical methodologi-cal drawbacks to this approach. First, a measureof overall diversity treats the causal force ofeach component variable as equal (Edwards,2001), masking effects that might be due mainlyto one variable (e.g., gender variety) rather thananother (e.g., ethnic background variety). Sec-ond, an overall diversity measure masks sub-stantive differences among units that have thesame overall composite score. Suppose that oneof the medical research teams described aboveis composed of six whites and two African-Americans, or six African-Americans and twowhites. Its Blau index for race is the same ineither case. Suppose, further, that the team iscomposed of six women and two men, or twowomen and six men. Again, its Blau index forgender is the same in either case. As a result,the team’s overall diversity would be the same ifthere were (1) six white men and two African-American women; (2) six African-American menand two white women; (3) six African-Americanwomen and two white men; (4) six white womenand two African-American men; (5) four whitemen, two white women, and two African-American men; and so on.2 Theory and evidencesuggest, however, that these groups would dif-fer markedly in their networks, coalitional dy-namics, and information sources (e.g., Ibarra,1993; Mollica, Gray, & Trevino, 2003; Tsui et al.,1992). To treat all of these groups as the same—and we have not listed all possible combina-tions that would yield the same overallscores—is to introduce a great deal of theoreti-cal ambiguity into one’s operationalization ofdiversity. Thus, we suggest the following.
Guideline 7: Simple (average or total)operationalizations of overall diver-sity should be avoided unless (a) the-oretical motivations for their aggre-gate (formative) effects are clear, or (b)evidence of their convergent validitycan be shown.
Perceived Diversity
Another approach sometimes used to opera-tionalize diversity is to ask individuals how theyperceive the diversity variable to be arrayedwithin their unit (Dooley, Fryxell, & Judge, 2000;Harrison et al., 1998; Harrison et al., 2002; Jehn etal., 1999; Miller, Burke, & Glick, 1998; Turban &Jones, 1988). Such measures are reasonable—even required—when authors seek to test theo-ries specifically addressing perceptions of dif-ferences (see Riordan, 2000, for a review).Indeed, perceived diversity within a unit mayhave unique and more proximal explanatorypower than actual diversity, as a stream of or-ganizational research suggests individuals’ per-ceptions of their social environment have stron-ger, more direct influences on behavior thandoes the social environment itself (Eisenberger,Huntington, Hutchison, & Sowa, 1986; Krack-hardt, 1990).
For several reasons, however, measures ofperceived diversity are not likely to be con-struct-valid measures of “actual” diversity(McGrath, 1984). First, individuals may lack thenecessary information to accurately assess thediversity of the rest of their unit members, espe-cially on the thornier and perhaps more sensi-tive psychological characteristics that mighthave sparked the researcher’s move toward us-ing perceptions in the first place. See the lowcorrelations in Harrison et al. (2002) for per-ceived and actual “deep” diversity, as well asMiller et al.’s (1998) correlations between per-ceived and actual cognitive diversity. Second,perceived diversity ratings are likely to be bi-ased, relative to measures of actual diversity.On the one hand, attraction and social desirabil-ity biases can promote perceptions of greatersimilarity (less diversity) than actually exists(Clore & Byrne, 1974). On the other hand, theoryand research regarding the outgroup homoge-neity effect suggest that, under some conditions,ingroup members may overestimate their ownunit’s diversity. This is particularly likely when
2 This example recalls Lau and Murnighan’s (1998) in-sightful analysis of group faultlines. The gender and racefaultline is stronger in the first four groups specified than inthe fifth. The construct of faultline strength, to which wereturn later in this article, bears some similarity to the notionof overall diversity, although the construct of faultlinestrength is far more precise and focused. Even so, it hasproven challenging to operationalize faultline strength out-side of environments such as the laboratory, where individ-uals can be assigned to groups to create weak versus strongcoalignments of differences. Recent developments in themeasurement of faultline strength in naturally occurringgroups are encouraging (Shaw, 2004) but remain little tested.
1216 OctoberAcademy of Management Review

judgments are made relative to other units (Lee& Ottati, 1993, 1995; Park & Judd, 1990; Park,Ryan, & Judd, 1992; Quattrone & Jones, 1980).Third, under either form of perceptual error,common method bias might inflate the observedcorrelation of perceived diversity measures andmember reports of group outcomes (e.g., groupcognition, conflict, performance, etc.; Harrison,McLaughlin, & Coalter, 1996). This renders sus-pect any comparison of the strength of relation-ships of perceived diversity relative to actualdiversity with such outcomes. Accordingly, wemake the following recommendation.
Guideline 8: Measures of perceived di-versity should not substitute for mea-sures of actual diversity. Measures ofperceived diversity can, however, pro-vide an operationalization of a useful,substantive construct—members’ per-ceptions of unit diversity—that maybe related to but is different from ac-tual unit diversity.
Our efforts to distinguish diversity as separa-tion, as variety, and as disparity suggest that ifmember perceptions of within-unit differencesserve a theoretical purpose, researchers mayneed to develop distinct instruments for per-ceived separation, perceived variety, and per-ceived disparity. Perhaps a researcher inter-ested in perceived separation in satisfactionwith a supervisor might ask, “How much doteam members differ in their satisfaction withthe team supervisor?” An appropriate responsescale might thus be “1 � Not at all; all teammembers feel the same way about the supervi-sor”; “3 � Somewhat; some team members aremore satisfied with the supervisor than others”;and “5 � A great deal; half of the team’s mem-bers are very satisfied with the supervisor andthe other half of the team’s members are verydissatisfied with the supervisor.”
A researcher interested in perceived variety offunctional backgrounds might ask respondents,“To what extent do group members differ in theirfunctional backgrounds?” An appropriate re-sponse scale might be “1 � All group membershave the same functional background”; “3 �Some group members’ functional backgroundsdiffer from others’ “; and “5 � Each group mem-ber has his/her own unique functional back-ground.”
Finally, a researcher interested in perceiveddisparity of team member influence in team de-cision making might ask, “To what extent doteam members differ in their influence over im-portant team decisions?” Here, an appropriateresponse scale might be “1 � Every member hasthe same amount of influence”; “3 � Some groupmembers have more influence than others”; and“5 � One team member has substantially moreinfluence than all other members.“
The examples above are only suggestions.However, their verbal descriptors map directlyonto our diversity typology, as well as onto theminimum, maximum, and moderate levels ofthose types. Regardless of the specific wordsused in such perceptual scales, we propose thefollowing.
Guideline 9: If researchers use mea-sures of perceived diversity, theirquestions, response formats, and an-chors should reflect the diversity typeunder consideration, following thedistributions shown in Figure 1.
Sampling the Full Range: Between-UnitVariance of Within-Unit Diversity
The recommendations above are designed toensure that a researcher’s diversity indexes areconstruct valid, capturing the specific diversitytype specified in the theory the investigator istesting. But researchers may still draw incorrectconclusions from their research if their sampleof units does not show the full breadth of diver-sity. To avoid range restriction, researchersseeking to test diversity theories must gathersamples in which there is sufficient between-unit variability in diversity to allow effects to berevealed.
The implications of this admonition differ forresearchers studying separation, variety, anddisparity. Investigators testing the unit-level ef-fects of separation must ensure not only thattheir sampled units vary in amount of (maxi-mum to minimum) separation but also that sam-pled units include different combinations thatlead to the same amount of separation on S.That is, for strong tests of the assumed symmet-ric effects of attitude separation on S, a re-searcher’s sample must include some units inwhich all members have negative attitudes,other units in which all members have positive
2007 1217Harrison and Klein

attitudes, still other units in which all membershave neutral attitudes, and, of course, someunits that are widely split on the focal attitude,representing maximum separation.3 This allowsthe researcher to assess whether the effects ofminimal separation are, in fact, symmetric. Sucha test would involve entering main effects of thewithin-unit SD and mean in an analysis, fol-lowed by the SD � mean interaction, reiteratingour Guideline 6 above. A significant interactionindicates asymmetric separation effects (i.e., theimpact of separation depends on the level of S).See Barsade et al. (2000) for an example.
Researchers testing the unit-level effects ofvariety require samples that have differentamounts of category richness or unevennessacross units. Samples must include units inwhich variety is very low and units is whichvariety is very high. Without this full sampling,researchers will underestimate relationshipsbetween variety and its antecedents or out-comes because of restricted range. Testing theunit-level effects of disparity requires, of course,samples in which units vary from a single indi-vidual lording resources over all the others(high disparity) to an even distribution of theresource across members (low disparity). Wethus make the following suggestion.
Guideline 10: To allow an adequatetest of hypotheses regarding separa-tion, variety, and disparity, respec-tively, a researcher’s sample must ev-idence substantial between-unitvariability in within-unit separation,variety, or disparity. Units should rep-resent the full range of minimum tomaximum separation, variety, or dis-parity, respectively. In the specificcase of separation, the sample mustallow verification of the symmetry as-
sumption fundamental to that diver-sity type.
FUTURE DIRECTIONS FOR THEORY ANDRESEARCH
By justifying their choice of separation, va-riety, or disparity, theorists may deepen theirunderstanding of the likely consequences ofattribute-specific diversity within units andmay refine their predictions. Further, precisespecification of diversity types facilitates con-struct-valid operationalizations and appropri-ate tests of the effects of each diversity type.The diversity typology we have presented alsosuggests new avenues of diversity research. Inexplicating the meaning of disparity, we notedhow little research addresses the unit-levelconsequences of within-unit inequality inpower, status, and other valued resources.This is an important and understudied aspectof diversity (Konrad, 2003). We also see realpromise in research integrating the study ofdiversity and social networks (e.g., Reagans &Zuckerman, 2001). Social network analysismay allow researchers to enrich their under-standing of the relational processes associ-ated with each diversity type, even allowing asingle demographic variable to be associatedwith more than one diversity type and to havesimultaneous, opposing effects (see Reagans,Zuckerman, & McEvily, 2004). Further, we en-courage more research on the antecedents ofseparation, variety, and disparity in organiza-tions. With some important exceptions (e.g.,Boone, van Olffen, van Witteloostuijn, & DeBrabander, 2004; Klein et al., 2001; Miner et al.,2003; Pfeffer & Davis-Blake, 1990), this territoryof research remains largely uncharted.
Finally, as we noted in previous sections, wesee both a real need and a real opportunity forresearch and theory building regarding therelationships among the three diversity types.Given the complexity of this broad topic, wefocus on it below, addressing three issues thateach touch on and may help to clarify theindependent and interdependent nature ofseparation, variety, and disparity in organiza-tions. More specifically, we consider (1) strat-egies for disentangling assumptions of demo-graphic separation, variety, and disparity; (2)relationships among and interactive impacts
3 Racial diversity—conceptualized as separation—mayprovide a more intuitively obvious example. If a researcherwants to argue that the effects of racial separation are sym-metric, he or she needs to show that the effects of homoge-neity (minimal separation) are the same regardless ofwhether the group is all African-American or all white. Fur-ther, he or she needs to show that the effects of separationare the same regardless of whether the group is numericallydominated by whites or by African-Americans (by definition,at the point of maximum separation, a team has an equalnumber of whites and African-Americans).
1218 OctoberAcademy of Management Review

of diversity types; and (3) multilevel diversityeffects.
Disentangling Separation, Variety, andDisparity: One Step Backward and SeveralSteps Forward for Demographic DiversityResearch?
We have urged theorists and researchers tospecify their chosen diversity types. But we havealso shown that within-unit diversity of severaldemographic variables, including tenure, age,gender, race or ethnicity, and education, can bemeaningfully conceptualized as separation orvariety or disparity. How, then, should scholarsinterested in demographic diversity proceed?
Our answer is to suggest research designed totest the theoretical assumptions specific to eachdiversity type. Suppose the demographic at-tribute in question is tenure. Within units, istenure significantly correlated with key percep-tions, beliefs, attitudes, values, or other vehiclesof separation? Or do tenure cohorts vary in theirknowledge, experience, or perspective, as sug-gested by a conceptualization of tenure diver-sity as variety?4 Alternatively, is tenure associ-ated with the unequal distribution of power andstatus, consistent with a conceptualization oftenure diversity as disparity? These are basicquestions of construct validity—so basic it isremarkable that, with few exceptions (e.g.,
Kilduff, Angelmar, & Mehra, 2000), they have re-ceived so little attention.
To answer these questions, a researcher mustexamine the individual-level relationship of thevariables within units. Suppose a researcherconceptualizes tenure diversity as separation,assuming that tenure is associated with orga-nizational commitment. A unit-level test of thatassumption would cloud interpretation. A signif-icant unit-level relationship between, say, ten-ure SD and commitment SD may occur even inthe absence of any connection between tenureand commitment within units (Ostroff & Harri-son, 1999). Random coefficient modeling (alsoreferred to as hierarchical linear modeling; Hof-mann, Griffin, & Gavin, 2000) allows a re-searcher to simultaneously test within-unit rela-tionships for each unit of his or her sample. Ofcourse, such a test requires careful measure-ment of demographic attributes and their theo-retical sources of diversity (e.g., separation inmember attitudes, variety of knowledge, or in-equality in prestige).
If this fine-grained, within-unit test revealsthat the data for most or all teams in the sampleconform to the predictions associated with onediversity type, the researcher has a powerfuland empirically grounded foundation for his orher subsequent investigation of the unit-levelcorrelates of attribute diversity of that type. Butthe results of such a test might be more complex,lending support to more than one diversity type,or revealing predicted relationships of the de-mographic attribute within some units but notothers. The test might even provide no supportfor any diversity type. The latter result wouldsuggest that diversity of the attribute in ques-tion is highly unlikely to have predicted unit-level consequences.
Is such extensive testing really called for,prior to the investigator’s examination of his orher real interest—the effects of tenure diversi-ty—just because there is uncertainty in the pre-cise conceptualization of it as one of the threearchetypes? We think so. The “no support” resultis within the realm of possibility given the in-consistent nature of past diversity findings. Inthe past two decades a wealth of theory andresearch on demographic diversity has yieldedfew cumulative or conclusive effects. Research-ers can, we believe, resolve some of this uncer-tainty by stepping backwards, and down a levelof analysis, to test the fundamental and distinc-
4 When conceptualizing tenure as variety, researchersmay be tempted to simply divide tenure into convenientsubgroupings: zero to five years, six to ten years, etc. But, infact, this choice warrants careful consideration, since it isnot always clear what the cohorts should be that representdifferent “batches” of knowledge or experience. Cohort def-initions should ideally be supported by a conceptualizationthat specifies why, for example, one to four years of tenure ismarkedly different from five to eight, or nine to fifteen (orwhatever cohort boundaries are chosen). Clear events in afirm or unit, such as before and after a reorganization oracquisition, might support demarcations of tenure cohorts assources of variety. These arguments are relevant beyond thebounds of demographic research. For example, if politicalideology is conceptualized not as a continuous variable fromconservative to liberal (engendering potential separationwithin a unit) but as a source of variety of perspectiveswithin a unit, a researcher faces a comparable puzzle:Where should he or she draw the lines distinguishing thosewho are very conservative from those who are conservative,those who are moderate from those who are liberal, and soon? Self-identification in one category or another is a rea-sonable starting point.
2007 1219Harrison and Klein

tive assumptions underlying diversity as sepa-ration, as variety, and as disparity. The payofffrom such research will come as researchersthen move several steps forward in decipheringthe nature and effects of demographic diversity.
Relationships Among and InterdependentEffects of Diversity Types
In describing the meaning, shape, mecha-nism, and ideal operationalization of each di-versity type, we have described them in turn. Yetseparation, variety, and disparity are likely tocooccur within units. Indeed, separation, vari-ety, and disparity may, in some cases, be caus-ally related. Further, they may well have jointconsequences for unit outcomes. New theory de-velopment and research are needed to examinethese possibilities. Does within-unit diversity ofone type lead to within-unit diversity of othertypes? Does diversity of one type moderate theeffects of diversity of other types? We offer somespeculative answers to these questions below,with the hope of sparking researchers’ interestin these topics.
Diversity begetting diversity. Although thethree diversity types are qualitatively and dis-tinctly different, they may nevertheless belinked to one another over time. Diversity of onetype might engender diversity of a second type.We briefly explore a few possibilities.
Separation can engender variety, particularlyincreases from minimum to moderate variety. Ifunit members are sharply separated—for exam-ple, in their endorsement of a particular unitgoal or strategy—they might be motivated to getnew information to support their position, in-cluding seeking out (external) others who sup-port their own perspective. In this way the mem-bers of a subunit may develop network contactsand information not shared by the members ofthe opposing subunit (Peterson & Thompson,1997). For example, the members of the subunitof Team S who favor interpretive research mayseek out experts in qualitative research in aneffort to bolster their own position. Conversely,the members of the subunit of Team S who op-pose that research paradigm may seek out ex-perts who are aligned with their own prefer-ences. In both cases the knowledge andargument base associated with each of the fac-tions is likely to increase and to be broughtforward to the rest of the unit when discussions
about interpretive methods arise. Polarization(sharp separation) of attitudes toward interpre-tive research may remain, but the variety ofresearch expertise may increase within the unit.
As separation can engender variety, so vari-ety can engender separation. Variety in disci-plinary or scientific training might lead to sep-aration in support for qualitative research inTeam V for example; some functional back-grounds may be more accepting and supportiveof qualitative research than others. This as-sumption can be seen in research treating vari-ety in functional background as a source of be-lief and attitude differences in top managementteams (e.g., Beyer et al., 1997; Chattopadhyay,Glick, Miller, & Huber, 1999). As separation leadsto conflict, separation might then mediate therelationship between variety and conflict. But itis also possible to imagine cases in which vari-ety leads to neither separation nor conflict.Rather, unit members who differ in their respec-tive areas of expertise may each fulfill a distinctrole in the team, coordinating efficiently andrespectfully with one another and paying dueattention to one another’s inputs (Stewart &Stasser, 1995). Further, when variety within aunit grows toward its maximum, the polariza-tion indicative of maximum separation seemsincreasingly unlikely; there are simply too manyV types represented for unit members to fallneatly into two clearly opposing factions. Insum, we suspect that variety may sometimeslead to separation and then conflict, but notinevitably or even generally.
Finally, we consider disparity. Disparity maylead to both an increase in separation and anincrease in variety. When the members of a unitdiffer sharply in their relative power, prestige,or pay, they perceive the unit’s policies and ac-tivities from different vantage points. Their in-terests differ as well. Those at the top of thehierarchy are likely to support the status quo.Those at the bottom may seek change. As aresult, disparity may cause separation in be-liefs, attitudes, or values related to unit pro-cesses and outcomes that might dislodge thecurrent status hierarchy (Phillips & Zuckerman,2001). Further, individuals who have less status,power, and influence than an “upper” minorityof their teammates are likely to respond by form-ing coalitions with others who are similarly lesspowerful, acquiring valued resources throughillicit means or through contacts outside the unit
1220 OctoberAcademy of Management Review

(e.g., Murnighan, 1978). In addition, those havingdifferent levels of such resources are likely tosocialize with different individuals and, thus, todevelop distinct sets of network ties (e.g., Ma-man, 2000; McGuire, 2000). In this way disparitymay engender variety in experiences, knowl-edge, and social contacts.
Diversity moderating diversity. The three di-versity types may also interact to influence unitoutcomes. Lau and Murnighan (1998) have al-ready forwarded a rich set of ideas about jointeffects of within-unit demographic differences.In their theory, for joint occurrences of demo-graphic attributes to become increasingly po-tent faultlines within a unit, the diversity at-tributes in question must (1) be apparent to unitmembers, (2) covary or coincide strongly withinthe unit, and (3) create a small number of homo-geneous subgroups or factions. Note that themere coincidence or correlation of two attributeswithin a unit is insufficient to form a faultline. If,for example, task satisfaction and organization-al commitment are positively correlated withina team, their joint occurrence will not neces-sarily divide the unit into two or more clearlydifferentiated factions. Moreover, as the numberof factions grows, faultlines will weaken (thereis no single, large “chasm” within the team but,rather, several small “cracks”). This suggeststhat strong faultlines are most likely to occurwithin a unit—translating Lau and Murnighan’spropositions into an important case in ourframework—when two or more variables havecoincidentally maximum separation or dispar-ity, or both, but also when they are coupled withonly modest variety. Strong or near maximumseparation within a unit creates opposing fac-tions, which is a building block of strong fault-lines. High disparity within a unit can do so aswell. In contrast, when variety is high, faultlineswill weaken (a clear distinction from our frame-work), since unit members cannot be dividedinto two or just a few sharply divided subsets.
Our differentiation of separation, variety, anddisparity suggests other intriguing interdepen-dent effects, complementing Lau and Mur-nighan’s (1998) insights. Consider our recurringexample of the research Teams S, V, and D, whoare studying patient experiences with medicaltreatment. What if Team V (maximum variety,with each member from one of eight differentdisciplines) and Team D (maximum disparity,with one prestigious researcher and seven nov-
ices) were the same team? Our speculative an-swer is that higher levels of disparity wouldtend to diminish or even neutralize the benefitsexpected from the presence of differing sourcesof task-relevant knowledge within the team.Unit members, such as the renowned expert inTeam D, who hold the highest concentration ofthe team’s valued resources and have the high-est status are likely to dictate the team’s prac-tices and performance. Team members with lesspower or status are likely to stay mum, deferringto the top members’ wishes and failing to sharecritical information (Cruz, Henningsen, & Smith,1999; Janis & Mann, 1977). Pitcher and Smith offera similar interpretation: “A significant powershift renders the heterogeneity and the diversecognitive perspectives that it represents lessand less influential in the strategic decision-making process” (2001: 9). Accordingly, we sus-pect that disparity within a team is likely tomoderate the expected positive relationship be-tween variety and positive team outcomes.5
The interdependent effects of within-unit sep-aration and variety may prove even more com-plex. What if Team V (maximum variety) andTeam S (maximum separation in attitude towardqualitative research) were the same team?Members would find it difficult to develop andimplement an integrative, creative plan of ac-tion. Conflict and division seem more likely thancreativity and performance. If sharing uniqueinformation requires motivated behavior fromunit members, even in the face of risk (others inthe unit cannot validate it), it is likely that mo-tivation would fall and the risk would rise asmembers saw themselves separated from oneanother on fundamental beliefs (Wittenbaum,Hollingshead, & Botero, 2004). Thus, low separa-tion, especially on team goals and task-relatedvalues, may allow a team to realize the benefitsof team members’ variety of expertise and expe-rience (cf. Edmondson, 1999; Gruenfeld et al.,1996; Harrison, Mohammed, McGrath, Florey, &Vanderstoep, 2003).
5 Disparity does not always trump variety. If the source ofdisparity is status based on task experience or expertise, theunit’s “ear” is likely to be tuned toward those who have thebest and most relevant information to share (Wittenbaum,1998). If, however, the source of disparity is based on anotherattribute unrelated to the unit’s task (physical attractiveness,wealth), disparity may mitigate the advantages of variety(Hollingshead, 1996).
2007 1221Harrison and Klein

And yet a team that has no separation inmember goals, attitudes, or beliefs but is high invariety may fail to recognize and make use ofmembers’ diverse areas of knowledge and ex-pertise (Larson, Christensen, Abbott, & Franz,1998; Stasser & Titus, 1985, 1987). Attention-capturing differences—if they are not toolarge—could motivate members to “dig deeperand to learn from contrasting examples” (Beck-man & Haunschild, 2002: 98). Members who seethemselves as identical on those underlyingfeatures might also assume that they share sim-ilar experiences and stores of knowledge and,thus, at least initially, might discuss shared ex-periences and information (Wittenbaum et al.,2004). Some minimal separation of attitudeswithin the unit— especially early, and aboutpreferences for task processes (Jehn & Bender-sky, 2003)—may trigger constructive debate anddiscussion, stimulating members to reveal toone another their distinctive knowledge and ex-pertise (Simons et al., 1999).
The above ideas deal with potential bivariateeffects of D, S, and V. What about the joint im-pact of all three forms of diversity? We considertwo possibilities. Suppose the hospital researchteam is indeed deeply divided on attitudes to-ward research paradigms and, hence, is maxi-mized on S. Suppose further that the two (inter-pretive, quantitative) factions are perfectlyaligned with D and V: one faction holds fre-quently published and renowned members withmedical backgrounds, and the other factionholds behavioral scientists with no establishedresearch records. Although the team is onlymoderate on V and D, it exhibits a strong fault-line (Lau & Murnighan, 1998; Li & Hambrick,2005). The team would be divided and dysfunc-tional, but it would not stalemate because of thepower of the first faction. In contrast, if D and Vcrosscut S (a weak faultline; Brewer & Miller,1984), with prestige and disciplinary back-ground equally vested in opposing S factions,the team would have conflict but would be ableto reach across factional boundaries to leverageits within-unit variety. Other trivariate configura-tions are viable and interesting and could readilybe studied in both field and laboratory designs.
Multilevel Influences
Diversity is inherently a multilevel construct.It describes a unit in terms of the collective
composition of its members. Still, most studiesof diversity are single-level studies, focusing onunit-level outcomes of within-unit diversity. Wejoin others (Jackson et al., 2003; Tsui & Gutek,1999) in urging a more in-depth and comprehen-sive multilevel analysis of diversity. One ap-proach would be to move up a level of analysisand consider diversity across units within orga-nizations along the S, V, or D attribute in ques-tion. The effects of within-unit diversity may de-pend, in part, on the composition—specifically,the diversity— of the organizational context(e.g., Alderfer & Smith, 1982). The effects of min-imum separation (perfect agreement) within afocal unit on S may depend on the extent towhich the unit’s perspective is itself close to orseparated from predominant views for S withinother units of the organization.
For example, minimum separation within amanagement department regarding the value ofpublishing in top-tier journals is likely to be amuch greater source of departmental cohesion ifother departments in the business school do notshare the management department’s perspec-tive. If other units do share the focal unit’s per-spective, constituting minimum separation inthe organization as a whole, then minimum sep-aration within the unit is likely to be less salientto unit members; it doesn’t make the unit dis-tinctive within the organization. Turning back toTeam S, members’ maximal separation on atti-tude toward interpretive research might betaken as a healthy state of task conflict if wide,within-unit splits in such attitudes (maximalseparation) are also characteristic of most otherresearch teams within their sponsoring organi-zation. If, however, the researchers who make upthe more positivistic faction of Team S know thatvirtually all of the other units in their sponsoringorganization are strongly positivistic (and notsplit), the presumption of normative correctnessof their own position might lead to deeper, moresevere, and more interpersonally charged bat-tles within the team.
A complementary multilevel approach wouldbe to consider the implications of diversity typesfor the experiences and reactions of individualswithin units. This is the focus of most studies ofrelational demography (e.g., Jackson et al., 1991)and other forms of dyadic similarity (e.g.,Turban & Jones, 1988). For example, Dose (1999)examined the correlates of an individual unitmember’s distance from the other members of
1222 OctoberAcademy of Management Review

the unit, testing whether individuals whose val-ues were similar to their teammates’ were moreattached to the team.
The extent of separation, variety, or disparitywithin a unit may color and shape an individu-al’s experience of difference from other unitmembers. For instance, if a research team is lowin variety of disciplinary backgrounds, say, witha single psychologist amidst an array of sevenphysicians, the lone psychologist is likely to beseen as an outlier on the team. This is docu-mented in theory and research on minoritiesand tokenism (distinctiveness theory—McGuire,1999; minority-majority influence—Nemeth,1986). From a multilevel perspective, however,the experiences of someone who is differentfrom all the others in the team will be radicallychanged depending on the unit context: Do allthe others on the team also differ from one an-other, or are they all the same? If the researchteam has maximum variety, like our Team V, thelone psychologist (whose average differencefrom everyone else is still “1”) is not an interper-sonal outlier on the team but, in effect, just likeeveryone else. As with every other team mem-ber, he or she is the only representative of aparticular background.
CONCLUSION
The challenge of differences—of diversity—isa crucial one for managers and scholars. How-ever, even as research has accumulated, thenature and effects of diversity have remaineduncertain. We have tried to address that chal-lenge by positing that diversity constructshave three fundamental types: separation, vari-ety, and disparity. The three types differ in theirsubstance, shape, maxima, and implications.Crucial attributes and relevant theoretical per-spectives differ for each type, as do the within-unit processes and outcomes likely to be asso-ciated with them. We urge investigators tospecify the diversity types they are studying andto align them with specific, appropriate opera-tionalizations. By systematically asking and an-swering, “What’s the difference?” managementscholars may reveal a clearer, more cumulativeunderstanding of diversity in organizations.
REFERENCESAdams, J. S. 1963. Toward an understanding of inequity.
Journal of Abnormal and Social Psychology, 67: 422–436.
Adler, P. S., & Kwon, S. W. 2002. Social capital: Prospects fora new concept. Academy of Management Review, 27:17–40.
Agresti, A., & Agresti, B. F. 1978. Statistical analysis of qual-itative variation. In K. F. Schuessler (Ed.), Sociologicalmethodology: 204–237. San Francisco: Jossey-Bass.
Alderfer, C. P., & Smith, K. K. 1982. Studying intergroup rela-tions embedded in organizations. Administrative Sci-ence Quarterly, 27: 35–65.
Allison, P. D. 1978. Measures of inequality. American Socio-logical Review, 43: 865–880.
Ancona, D. G., & Caldwell, D. F. 1992. Demography anddesign: Predictors of new product team performance.Organization Science, 3: 321–341.
Argote, L., & Ingram, P. 2000. Knowledge transfer: A basis forcompetitive advantage in firms. Organizational Behav-ior and Human Decision Processes, 82: 150–169.
Ashby, W. R. 1956. An introduction to cybernetics. New York:Wiley.
Austin, J. R. 2003. Transactive memory in organizationalgroups: The effects of content, consensus, specialization,and accuracy on group performance. Journal of AppliedPsychology, 88: 866–878.
Barrick, M. R., Stewart, G. L., Neubert, M. J., & Mount, M. K.1998. Relating member ability and personality to work-team processes and team effectiveness. Journal ofApplied Psychology, 83: 377–391.
Barsade, S. G., Ward, A. J., Turner, J. D. F., & Sonnenfeld, J.2000. To your heart’s content: A model of affective diver-sity in top management teams. Administrative ScienceQuarterly, 45: 802–836.
Beckman, C. M., & Haunschild, P. R. 2002. Network learning:The effects of partners’ heterogeneity of experience oncorporate acquisitions. Administrative Science Quar-terly, 47: 92–124.
Bedeian, A. G., & Mossholder, K. W. 2000. On the use of thecoefficient of variation as a measure of diversity. Orga-nizational Research Methods, 3: 285–297.
Berger, J., Fisek, M. H., Norman, R. Z., & Zelditch, M., Jr. 1977.Status characteristics and expectation states: A graph-theoretical formulation. In J. Berger (Ed.), Status charac-teristics and social interaction: An expectations statesapproach: 91–134. New York: Elsevier.
Berger, J., Rosenholtz, S. J., & Zelditch, M. 1980. Status orga-nizing processes. Annual Review of Sociology, 6: 479–508.
Berkowitz, L., & Macaulay, J. R. 1961. Some effects of differ-ences in status level and status stability. Human Rela-tions, 14: 135–147.
Beyer, J. M., Chattopadhyay, P., George, E., Glick, W. H.,Ogilvie, dt, & Pugliese, D. 1997. The selective perceptionof managers revisited. Academy of Management Jour-nal, 40: 716–737.
Blau, P. M. 1960. Patterns of deviation in work groups. So-ciometry, 23: 245–261.
2007 1223Harrison and Klein

Blau, P. M. 1977. Inequality and heterogeneity. New York:Free Press.
Bloom, M. 1999. The performance effects of pay dispersion onindividuals and organizations. Academy of Manage-ment Journal, 42: 25–40.
Bloom, M., & Michel, J. G. 2002. The relationships amongorganizational context, pay dispersion, and managerialturnover. Academy of Management Journal, 45: 33–42.
Bollen, K., & Lennox, R. 1991. Conventional wisdom on mea-surement: A structural equation perspective. Psycholog-ical Bulletin, 110: 305–314.
Boone, C., van Olffen, W., van Witteloostuijn, B., & De Bra-bander, B. 2004. The genesis of top management teamdiversity: Selective turnover among top managementteams in Dutch newspaper publishing, 1970–94. Acad-emy of Management Journal, 47: 633–656.
Brewer, M. B., & Miller, N. 1984. Beyond the contact hypoth-esis: Theoretical perspectives on desegregation. InN. Miller & M. B. Brewer (Eds.), Groups in contact: Thepsychology of desegregation: 281–302. Orlando, FL: Aca-demic Press.
Bunderson, J. S., & Sutcliffe, K. M. 2002. Comparing alterna-tive conceptualizations of functional diversity in man-agement teams: Process and performance effects. Acad-emy of Management Journal, 45: 875–893.
Burt, R. S. 2002. The social capital of structural holes. In M. F.Guillen, R. Collins, P. England, & M. Meyer (Eds.), Thenew economic sociology: 148–189. New York: RussellSage Foundation.
Byrne, D. 1971. The attraction paradigm. New York: AcademicPress.
Campbell, D. T. 1960. Blind variation and selective retentionin creative thought as in other knowledge processes.Psychological Review, 67: 380–400.
Carpenter, M. A. 2002. The implications of strategy and so-cial context for the relationship between top manage-ment team heterogeneity and firm performance. Strate-gic Management Journal, 23: 275–284.
Champernowne, D. 1974. A comparison of measures of in-equality of income distribution. Economic Journal, 84:26–54.
Chatman, J. A.. 1991. Matching people and organizations:Selection and socialization in public accounting firms.Administrative Science Quarterly, 36: 459–484.
Chatman, J. A., & Flynn, F. J. 2001. The influence of demo-graphic heterogeneity on the emergence and conse-quences of cooperative norms in work teams. Academyof Management Journal, 44: 956–974.
Chattopadhyay, P., Glick, W. H., Miller, C. C., & Huber, G. P.1999. Determinants of executive beliefs: Comparingfunctional conditioning and social influence. StrategicManagement Journal, 20: 763–789.
Clore, G. L., & Byrne, D. A. 1974. A reinforcement-affect modelof attraction. In T. L. Huston (Ed.), Foundations of inter-personal attraction: 143–170. New York: Academic Press.
Cohen, B. P., & Zhou, X. 1991. Status processes in enduringwork groups. American Sociological Review, 56: 179–188.
Cruz, M. G., Henningsen, D. D., & Smith, B. A. 1999. Theimpact of directive leadership on group’s informationsampling, decisions, and perceptions of the leaders.Communication Research, 26: 349–369.
Deutsch, M. 1985. Distributive justice: A social psychologicalperspective. New Haven, CT: Yale University Press.
Doerr, K. H., Mitchell, T. R., Schriesheim, C. A., Freed, T., &Zhou, X. 2002. Heterogeneity and variability in the con-text of flow lines. Academy of Management Review, 27:594–607.
Dooley, R. S., Fryxell, G. E., & Judge, W. Q. 2000. Belaboringthe not-so-obvious: Consensus, commitment, and strat-egy implementation speed and success. Journal of Man-agement, 26: 1237–1257.
Dose, J. J. 1999. The relationship between work values simi-larity and team-member and leader-member exchangerelationships. Group Dynamics: Theory, Research, andPractice, 3: 20–32.
Drazin, R., & Rao, H. 1999. Managerial power and succession:SBU managers of mutual funds. Organization Studies,20: 167–196.
Edmondson, A. 1999. Psychological safety and learning be-havior in work teams. Administrative Science Quarterly,44: 350–383.
Edwards, J. R. 2001. Multidimensional constructs in organi-zational behavior research: An integrative analyticalframework. Organizational Research Methods, 4: 144–192.
Eisenberger, R., Huntington, R., Hutchison, S., & Sowa, D.1986. Perceived organizational support. Journal of Ap-plied Psychology, 71: 500–507.
Eisenhardt, K. M., & Bourgeois, L. J. 1988. Politics of strategicdecision making in high-velocity environments: Towarda midrange theory. Academy of Management Journal,31: 737–770.
Ferrier, W. J. 2001. Navigating the competitive landscape:The drivers and consequences of competitive aggres-siveness. Academy of Management Journal, 44: 858–878.
Finkelstein, S., & Hambrick, D. C. 1996. Strategic leadership:Top executives and their effects on organizations. Min-neapolis: West Educational Publishing.
French, J. R. P., Jr., & Raven, B. 1959. The bases of socialpower. In D. Cartwright (Ed.), Studies in social power:150–165. Ann Arbor: University of Michigan Press.
Gibson, C., & Vermeulen, F. 2003. A healthy divide: Sub-groups as a stimulus for team learning behavior. Ad-ministrative Science Quarterly, 48: 202–239.
Gruenfeld, D. H., Mannix, E. A., Williams, K. Y., & Neale, M. A.1996. Group composition and decision making: Howmember familiarity and information distribution affectprocess and performance. Organizational Behavior andHuman Decision Processes, 67: 1–15.
Grusky, D. B. 1994. The contours of social stratification. InD. B. Grusky (Ed.), Social stratification: Class, race, andgender in sociological perspective: 3–35. Boulder, CO:Westview Press.
Hambrick, D. C., Cho, T. S., & Chen, M. 1996. The influence of
1224 OctoberAcademy of Management Review

top management team heterogeneity on firms’ compet-itive moves. Administrative Science Quarterly, 41: 659–684.
Hambrick, D. C., & Mason, P. A. 1984. Upper echelons: Theorganization as a reflection of its top managers. Acad-emy of Management Review, 9: 193–206.
Hansen, M. T. 1999. The search-transfer problem: The role ofweak ties in sharing knowledge across organizationsubunits. Administrative Science Quarterly, 44: 82–111.
Harrison, D. A., McLaughlin, M. E., & Coalter, T. M. 1996.Context, cognition, and common method variance: Psy-chometric and verbal protocol evidence. OrganizationalBehavior and Human Decision Processes, 68: 246–261.
Harrison, D. A., Mohammed, S., McGrath, J. E., Florey, A. T., &Vanderstoep, S. 2003. Time matters in team task perfor-mance: Effects of member familiarity, entrainment, andtask discontinuity on speed and quality. Personnel Psy-chology, 56: 633–669.
Harrison, D. A., Price, K. H., & Bell, M. P. 1998. Beyond rela-tional demography: Time and the effects of surface- anddeep-level diversity on work group cohesion. Academyof Management Journal, 41: 96–107.
Harrison, D. A., Price, K. H., Gavin, J. H., & Florey, A. T. 2002.Time, teams, and task performance: Changing effects ofsurface- and deep-level diversity on group functioning.Academy of Management Journal, 45: 1029–1045.
Harrison, D. A., & Sin, H.-S. 2006. What is diversity and howshould it be measured? In A. M. Konrad, P. Prasad, & J. K.Pringle (Eds.), Handbook of workplace diversity: 191–216.Newbury Park, CA: Sage.
Herfindahl, O. C. 1950. Concentration in the U.S. steel indus-try. Unpublished doctoral dissertation, Columbia Uni-versity, New York.
Hill, M. O. 1973. Diversity and evenness: A unifying notationand its consequences. Ecology, 54: 427–431.
Hinsz, V. B., Tindale, R. S., & Vollrath, D. A. 1997. The emerg-ing conceptualization of groups as information proces-sors. Psychological Bulletin, 121: 43–64.
Hirschman, A. O. 1964. The paternity of an index. AmericanEconomic Review, 54: 761–762.
Hoffman, L. R., & Maier, N. 1961. Quality and acceptance ofproblem solutions by members of homogeneous andheterogeneous groups. Journal of Abnormal and SocialPsychology, 62: 401–407.
Hofmann, D. A., Griffin, M., & Gavin, M. 2000. The applicationof hierarchical linear modeling to organizational re-search. In K. J. Klein & S. W. J. Kozlowski (Eds.), Multi-level theory, research, and methods in organizations:467–511. San Francisco: Jossey-Bass.
Hogg, M. A., & Terry, D. J. 2000. Social identity and self-categorization processes in organizational contexts.Academy of Management Review, 25: 121–140.
Hollander, E. P. 1958. Conformity, status, and idiosyncrasycredit. Psychological Review, 65: 117–277.
Hollingshead, A. B. 1996. Information suppression and statuspersistence in group decision making. Human Commu-nication Research, 23: 193–219.
Homans, G. C. 1961. Social behavior: Its elementary forms.New York: Harcourt, Brace, and World.
Ibarra, H. 1993. Personal networks of women and minoritiesin management: A conceptual framework. Academy ofManagement Review, 18: 56–87.
Jackson, S. E., Brett, J. F., Sessa, V. I., Cooper, D. M., Julin, J. A.,& Peyronnin, K. 1991. Some differences make a differ-ence: Individual dissimilarity and group heterogeneityas correlates of recruitment, promotions, and turnover.Journal of Applied Psychology, 76: 675–689.
Jackson, S. E., Joshi, A., & Erhardt, N. L. 2003. Recent researchon team and organizational diversity: SWOT analysisand implications. Journal of Management, 29: 801–830.
James, L. R., Demaree, R. G., & Wolf, G. 1993. rwg: An assess-ment of within-group interrater agreement. Journal ofApplied Psychology, 78: 306–309.
Janis, I. L., & Mann, L. 1977. Decision making: A psychologicalanalysis of conflict, choice, and commitment. New York:Free Press.
Jehn, K., & Bendersky, C. 2003. Intragroup conflict in organi-zations: A contingency perspective on the conflict-outcome relationship. Research in Organizational Be-havior, 25: 187–242.
Jehn, K. A., Northcraft, G. B., & Neale, M. A. 1999. Why differ-ences make a difference: A field study of diversity, con-flict, and performance in workgroups. AdministrativeScience Quarterly, 44: 741–763.
Keltner, D., Gruenfeld, D. H., & Anderson, C. 2003. Power,approach, and inhibition. Psychological Bulletin, 110:265–284.
Kilduff, M., Angelmar, R., & Mehra, A. 2000. Top manage-ment–team diversity and firm performance: Examiningthe role of cognitions. Organization Science, 11: 21–34.
Kimura, K. 1994. A micro-macro linkage in the measurementof inequality: Another look at the GINI coefficient.Quality and Quantity, 28: 83–97.
Klein, K. J., Conn, A. B., Smith, D. B., & Sorra, J. S. 2001. Iseveryone in agreement? An exploration of within-groupagreement in employee perceptions of the work environ-ment. Journal of Applied Psychology, 86: 3–16.
Konrad, A. M. 2003. Defining the domain of workplace diver-sity scholarship. Group and Organization Management,28: 4–17.
Konrad, A. M., & Gutek, B. A. 1987. Theory and research ongroup composition: Applications to the status of womenand ethnic minorities. In S. Oskamp & S. Spacapan(Eds.), Interpersonal processes: 85–121. Thousand Oaks,CA: Sage.
Krackhardt, D. 1990. Assessing the political landscape:Structure, cognition, and power in organizations. Ad-ministrative Science Quarterly, 35: 342–369.
Larson, J. R., Jr., Christensen, C., Abbott, A. S., & Franz, T. M.1998. Diagnosing groups: The pooling, management,and impact of shared and unshared case information inteam-based medical decision making. Journal of Person-ality and Social Psychology, 75: 93–108.
Lau, D. C., & Murnighan, J. K. 1998. Demographic diversity
2007 1225Harrison and Klein
and faultlines: The compositional dynamics of organi-zational groups. Academy of Management Review, 23:325–340.
Lawrence, B. S. 1997. The black box of organizational demog-raphy. Organization Science, 8: 1–22.
Lazear, E., & Rosen, S. 1981. Rank-order tournaments as op-timum labor contracts. Journal of Political Economy, 89:841–864.
Lazear, E. P. 1995. Personnel economics. Cambridge, MA: MITPress.
Lee, Y., & Ottati, V. 1993. Determinants of in-group and out-group perceptions of heterogeneity: An investigation ofSino-American stereotypes. Journal of Cross-CulturalPsychology, 24: 298–318.
Lee, Y., & Ottati, V. 1995. Perceived in-group homogeneity asa function of group membership salience and stereotypethreat. Personality and Social Psychology Bulletin, 21:610–619.
Lefler, A., Gillespie, D. L., & Conaty, J. C. 1982. The effects ofstatus differentiation on nonverbal behavior. Social Psy-chology Quarterly, 45: 153–161.
Li, J. T., & Hambrick, D. C. 2005. Factional groups: A newvantage on demographic faultlines, conflict, and disin-tegration in work teams. Academy of Management Jour-nal, 48: 794–813.
Linnehan, F., & Konrad, A. M. 1999. Diluting diversity: Impli-cations for intergroup inequality in organizations. Jour-nal of Management Inquiry, 8: 399–414.
Locke, K. D., & Horowitz, L. M. 1990. Satisfaction in interper-sonal interactions as a function of similarity in level ofdysphoria. Journal of Personality and Social Psychology,58: 823–831.
MacCallum, R. C., & Browne, M. W. 1993. The use of causalindicators in covariance structure models: Some practi-cal issues. Psychological Bulletin, 114: 533–541.
Maman, D. 2000. Who accumulates directorships of big busi-ness firms in Israel? Organizational structure, socialcapital and human capital. Human Relations, 53: 603–629.
Marsch, J. B. T. 2002. Cultural diversity as human capital.Communication and Cognition, 35: 37–49.
Marsden, P. V. 1990. Network diversity, substructures andopportunities for contact. In C. Calhoun, M. Meyer, &R. S. Schott (Eds.), Structures of power and constraint:Papers in honor of Peter Blau: 397– 410. Cambridge:Cambridge University Press.
Martin, J. D., & Gray, L. N. 1971. Measurement of relativevariation: Sociological examples. American Sociologi-cal Review, 36: 496–502.
McGrath, J. E. 1984. Groups: Interaction and performance.Englewood Cliffs, NJ: Prentice-Hall.
McGrath, J. E., Berdahl, J. L., & Arrow, H. 1995. Traits, expec-tations, culture, and clout: The dynamics of diversity inwork groups. In S. E. Jackson & M. N. Ruderman (Eds),Diversity in work teams: Research paradigms for achanging workplace: 17–45. Washington, DC: AmericanPsychological Association.
McGuire, G. M. 2000. Gender, race, ethnicity, and networks:The factors affecting the status of employees’ networkmembers. Work and Occupations, 27: 501–523.
McGuire, W. J. 1999. Constructing social psychology: Creativeand critical processes. New York: Cambridge UniversityPress.
Miller, C. C., Burke, L. M., & Glick, W. H. 1998. Cognitivediversity among upper-echelon executives: Implicationsfor strategic decision processes. Strategic ManagementJournal, 19: 39–58.
Miner, A. S., Haunschild, P. R., & Schwab, A. 2003. Experienceand convergence: Curiosities and speculation. Indus-trial and Corporate Change, 12: 789–813.
Mollica, K. A., Gray, B., & Trevino, L. 2003. Racial homophilyand its persistence in newcomers’ social networks. Or-ganization Science, 14: 123–137.
Mueller, J. H., Schuessler, H. L., & Costner, H. L. 1970. Statis-tical reasoning in sociology. Boston: Houghton Mifflin.
Murnighan, J. K. 1978. Models of coalition behavior: Gametheoretic, social psychological and political perspec-tives. Psychological Bulletin, 85: 1130–1153.
Nemeth, C. J. 1986. Differential contributions of majority andminority influence. Psychological Review, 93: 23–32.
Nemetz, P. L., & Christensen, S. L. 1996. The challenge ofcultural diversity: Harnessing a diversity of views tounderstand multiculturalism. Academy of ManagementReview, 21: 434–462.
Newcomb, T. M. 1961. The acquaintance process. New York:Holt, Rinehart & Winston.
O’Reilly, C. A., III, Caldwell, D. F., & Barnett, W. P. 1989. Workgroup demography, social integration, and turnover.Administrative Science Quarterly, 34: 21–37.
O’Reilly, C. A., III, Williams, K., & Barsade, S. 1997. Groupdemography and innovation: Does diversity help? Re-search in the Management of Groups and Teams, 1:183–207.
Ostroff, C., & Harrison, D. A. 1999. Meta-analysis, levels ofanalysis, and best estimates of population correlations:Cautions for interpreting meta-analytic results in orga-nizational behavior. Journal of Applied Psychology, 84:260–270.
Park, B., & Judd, C. M. 1990. Measures and models of per-ceived group variability. Journal of Personality and So-cial Psychology, 42: 1051–1068.
Park, B., Ryan, C. S., & Judd, C. M. 1992. Role of meaningfulsub-groups in explaining differences in perceived vari-ability for in-groups and out-groups. Journal of Person-ality and Social Psychology, 63: 553–567.
Pelled, L. H. 1996. Demographic diversity, conflict, and workgroup outcomes: An intervening process theory. Organi-zation Science, 6: 207–229.
Pelled, L. H., Eisenhardt, K. M., & Xin, K. R. 1999. Exploring theblack box: An analysis of work group diversity, conflict,and performance. Administrative Science Quarterly, 44:1–28.
Peterson, E., & Thompson, L. 1997. Negotiation teamwork: The
1226 OctoberAcademy of Management Review

impact of information distribution and accountabilityfor performance depends on the relationship amongteam members. Organization Behavior and Human De-cision Processes, 72: 364–383.
Pfeffer, J. 1983. Organizational demography. Research in Or-ganizational Behavior, 5: 299–357.
Pfeffer, J. 1998. The human equation: Building profits by put-ting people first. Boston: Harvard Business School Press.
Pfeffer, J., & Davis-Blake, A. 1990. Determinants of salarydispersion in organizations. Industrial Relations, 29: 38–57.
Pfeffer, J., & Davis-Blake, A. 1992. Salary dispersion: Locationin the salary distribution, and turn-over among collegeadministrators. Industrial and Labor Relations Review,45: 753–763.
Pfeffer, J., & Langton, N. 1988. Wage inequality and the or-ganization of work: The case of academic departments.Administrative Science Quarterly, 33: 588–606.
Pfeffer, J., & Langton, N. 1993. The effect of wage dispersionon satisfaction, productivity, and working collabora-tively: Evidence from college and university faculty.Administrative Science Quarterly, 38: 382–407.
Phillips, D. J., & Zuckerman, E. W. 2001. Middle-status con-formity: Theoretical restatement and empirical demon-stration in two markets. American Journal of Sociology,107: 379–429.
Pitcher, P., & Smith, A. D. 2001. Top management team het-erogeneity: Personality, power, and proxies. Organiza-tion Science, 12: 1–18.
Priem, R. L. 1990. Top management team group factors, con-sensus, and firm performance. Strategic ManagementJournal, 11: 469–478.
Priem, R. L., Lyon, D. W., & Dess, G. G. 1999. Inherent limita-tions of demographic proxies in top management teamheterogeneity research. Journal of Management, 25: 935–953.
Quattrone, G. A., & Jones, E. E. 1980. The perception of vari-ability within ingroups and outgroups: Implications forthe law of small numbers. Journal of Personality andSocial Psychology, 13: 269–277.
Rafaeli, A., & Pratt, M. 1993. Tailored meanings: On themeaning and impact of organizational dress. Academyof Management Review, 18: 32–55.
Ragins, B. R., & Gonzalez, J. A. 2003. Understanding diversityin organizations: Getting a grip on a slippery construct.In J. Greenberg (Ed.), Organizational behavior: The stateof the science: 125–163. Mahwah, NJ: Lawrence ErlbaumAssociates.
Ragins, B. R., & Sundstrom, E. 1989. Gender and power inorganizations: A longitudinal perspective. Psychologi-cal Bulletin, 105: 51–88.
Randel, A. E., & Jaussi, K. S. 2003. Functional backgroundidentity, diversity, and individual performance in cross-functional teams. Academy of Management Journal, 46:763–774.
Reagans, R., & Zuckerman, E. W. 2001. Network, diversity,
and productivity: The social capital of corporate R&Dteams. Organization Science, 12: 502–517.
Reagans, R., Zuckerman, E. W., & McEvily, B. 2004. How tomake the team: Social networks vs. demography as cri-teria for designing effective teams. Administrative Sci-ence Quarterly, 49: 101–133.
Ridgeway, C. L., Johnson, C., & Diekema, D. 1994. Externalstatus, legitimacy, and compliance in male and femalegroups. Social Forces, 72: 1051–1077.
Riordan, C. M. 2000. Relational demography within groups:Past developments, contradictions, and new directions.Research in Personnel and Human Resource Manage-ment, 19: 131–173.
Riordan, C. M., & Shore, L. 1997. Demographic diversity andemployee attitudes: Examination of relational demogra-phy within work units. Journal of Applied Psychology,82: 342–358.
Schneider, B. 1987. The people make the place. PersonnelPsychology, 40: 437–453.
Schneider, B., & Goldstein, H. W. 1995. The ASA framework:An update. Personnel Psychology, 48: 747–773.
Shannon, C. E. 1948. A mathematical theory of communica-tion. Bell System Technical Journal, 27: 379–423, 623–656.
Shaw, B. J. 2004. The development and analysis of a measureof group faultlines. Organizational Research Methods,7: 66–100.
Siegel, P. A., & Hambrick, D. C. 2005. Pay disparities withintop management groups: Evidence of harmful effectson performance of high-technology firms. OrganizationScience, 16: 259–274.
Simons, T., Pelled, L. H., & Smith, K. A. 1999. Making use ofdifference: Diversity, debate, and decision comprehen-siveness in top management teams. Academy of Man-agement Journal, 42: 662–673.
Simpson, E. H. 1949. Measurement of diversity. Nature, 163:688.
Sorenson, J. 2002. The use and misuse of the coefficient ofvariation in organizational demography research. So-ciological Methods and Research, 30: 475–491.
Stasser, G., & Titus, W. 1985. Pooling of unshared informationin group decision making. Journal of Personality andSocial Psychology, 48: 1467–1478.
Stasser, G., & Titus, W. 1987. Effects of information load andpercentage of shared information on the disseminationof unshared information during group discussion. Jour-nal of Personality and Social Psychology, 53: 81–93.
Stasser, G., Vaughan, S. I., & Stewart, D. D. 2000. Poolingunshared information: The benefits of knowing how ac-cess to information is distributed among group mem-bers. Organizational Behavior and Human Decision Pro-cesses, 82: 102–116.
Stewart, D. D., & Stasser G. 1995. Expert role assignment andinformation sampling during collective recall and deci-sion-making. Journal of Personality and Social Psychol-ogy, 69: 619–628.
Tajfel, H. 1981. Human groups and social categories: Studies
2007 1227Harrison and Klein

in social psychology. Cambridge: Cambridge UniversityPress.
Tajfel, H., & Turner, J. C. 1979. An integrative theory of inter-group conflict. In W. G. Austin & S. Worchel (Eds.), Thesocial psychology of intergroup relations: 33– 47.Monterey, CA: Brooks/Cole.
Teachman, J. D. 1980. Analysis of population diversity. So-ciological Methods and Research, 8: 341–362.
Tsui, A. S., Ashford, S. J., St. Clair, L., & Xin, K. R. 1995.Dealing with discrepant expectations: Response strate-gies and managerial effectiveness. Academy of Man-agement Journal, 38: 1515–1543.
Tsui, A. S., Egan, T. D., & O’Reilly, C. A., III. 1992. Beingdifferent: Relational demography and organizational at-tachment. Administrative Science Quarterly, 37: 549–579.
Tsui, A. S., & Gutek, B. A. 1999. Demographic differences inorganizations: Current research and future directions.Lanham, MD: Lexington Books.
Tsui, A. S., Xin, K. R., & Egan, T. D. 1995. Relational demog-raphy: The missing link in vertical dyad linkage. In S. E.Jackson & M. N. Ruderman (Eds.), Diversity in workteams: 97–129. Washington, DC: American PsychologicalAssociation.
Turban, D. B., & Jones, A. P. 1988. Supervisor-subordinatesimilarity: Types, effects, and mechanisms. Journal ofApplied Psychology, 73: 228–234.
Turner, J. C. 1985. Social categorization and the self-concept:A social cognitive theory of group behavior. Advances inGroup Processes: Theory and Research, 2: 77–122.
Wasserman, S., & Faust, K. 1994. Social network analysis:
Methods and applications. New York: Cambridge Uni-versity Press.
Watson, W. E., Kumar, K., & Michaelson, L. K. 1993. Culturaldiversity’s impact on interaction process and perfor-mance: Comparing homogenous and diverse taskgroups. Academy of Management Journal, 36: 590–602.
Webber, S. S., & Donahue, L. 2001. Impact of highly and lessjob related diversity on work group cohesion and per-formance: A meta analysis. Journal of Management, 27:141–162.
Wiersema, M. F., & Bantel, K. A. 1992. Top management teamturnover as an adaptation mechanism: The role of theenvironment. Strategic Management Journal, 14: 485–504.
Wiersema, M. F., & Bird, A. 1993. Organizational demographyin Japanese firms: Group heterogeneity, individual dis-similarity, and top management team turnover. Acad-emy of Management Journal, 36: 996–1025.
Williams, K. Y., & O’Reilly, C. A., III. 1998. Demography anddiversity in organizations: A review of 40 years of re-search. Research in Organizational Behavior, 20: 77–140.
Wittenbaum, G. M. 1998. Information sampling in decision-making groups: The impact of members’ task relevantstatus. Small Group Research, 29: 29–57.
Wittenbaum, G. M., Hollingshead, A. B., & Botero, I. C. 2004.From cooperative to motivated information sharing ingroups: Moving beyond the hidden profile paradigm.Communication Monographs, 7: 59–83.
Wood, W. L. 1987. Meta-analytic review of sex differences ingroup performance. Psychological Bulletin, 102: 53–71.
David A. Harrison ([email protected]) is Distinguished Professor of Management inthe Smeal College of Business, The Pennsylvania State University. He received hisPh.D. in social/organizational/individual differences psychology from the Universityof Illinois. His current research deals with time in organizations, team diversity, workrole adjustment, and executive decision making.
Katherine J. Klein ([email protected]) is the Edward H. Bowman Professor ofManagement at the University of Pennsylvania’s Wharton School. She received herPh.D. in community psychology from the University of Texas. Her current researchinterests include multilevel theory and processes, diversity, social networks, teamleadership and effectiveness, and employee ownership.
1228 OctoberAcademy of Management Review