what’s now. what’s next. - annualreports.com · what’s now. what’s next. ... has enabled us...
TRANSCRIPT

WHAT’S NOW. WHAT’S NEXT.
MANPOWER INC. 2004 ANNUAL REPORT
5 PERSPECTIVES ON THECHANGING WORLD OF WORK


What’s Now. What’s Next.
In the 57 years since Manpower opened its doors, we have enjoyed a birds-eyeview of the world of work and all of its changes, challenges and extraordinaryopportunities. We have seen the role of the Human Resources function evolve andexpand to become a core part of the business strategy. We have seen the role ofthe worker evolve to be viewed as an investment, and to include all people of allshapes and sizes.
While the heart and soul of our business remains the provision of temporary workersto help employers fulfill fluctuations in staffing demands, this is only one part of thestory. Today, we provide a complete range of services that span the employmentand business cycle. These offerings include: recruitment, assessment and selection;training; temporary staffing; permanent placement; organizational consulting, careertransition and professional financial services.
But this is too simplistic a view of the value we bring to our customers. In theireyes, we are the partner that helps them improve the productivity of their workforce.We are the extension of their HR department when they need a helping hand. Weare the answer when they find that they need to re-engineer their workforce to get theright people with the right skills in the right places to help their company succeed.We are the solution when change happens, as it frequently does, and they need helpto align their people with their strategy.
As the world of work continues to change, one thing remains true – Manpowercontinues to grow and adapt to be ready with the answers to help our clients createwinning HR strategies and successfully compete in their respective markets. On thefollowing pages, five of our clients give their perspectives on the people issuesthey face today, and those that are shaping the future of their organizations.

DONNA RILEYVICE PRESIDENT, GLOBAL TALENTIBMONJUST- IN-T IME TALENT MANAGEMENT
Originally founded to provideAmerican business customers withproductivity-enhancing accountingand measuring machines, IBM, theinternational company that has giventhe world many IT innovations, grewto become the world’s undisputed #1 computer business and todayoperates in more than 160 countriesworldwide.
But times change and IBM has beenquick to change with them. Over thepast several years, “Big Blue” hastransitioned from a production-basedsupplier of computer hardware to atalent-based provider of on demand IT services to its clients worldwide,leveraging the core skills of its globaltalent pool.

As the global economy has transitioned from manufac-turing into services, so has IBM, with more than 50 percentof our workforce today engaged in providing services forclients. And since service equates with people, that meanswe are investing far more in human than in physicalassets. The company and its workforce have also grownsignificantly, with more than 18,000 new employeesadded in 2004 alone. The world in which we operate ischanging at an accelerating pace and we need to keep upwith it – not least in the way we manage our global talent.
DEL IVER ING “ON-DEMAND” SERV ICES
Some two years ago, observing how our clients neededaccess to our services on very short lead times, weembarked on a program to redefine our business as an ondemand service provider, and to serve as a role modelfor clients of all types in all industries. We obviously hadto start by considering our people.
With the help of Manpower, whose just-in-time talent-management expertise clearly paralleled our on demandstrategic objectives, we created a consistent taxonomyfor defining the skills, capabilities, and experiences neededfor different positions along our talent supply chain. This
has enabled us to identify which talents are core value-delivering capabilities and which are less critical; to obtaininsights into achieving the right balance between alternativesources of talent; and to match our people strategy mostclosely to our overall business strategy.
ACHIEV ING FLEX IB IL I TY WITH QUAL ITY
Delivering on demand services requires an integrated,seamless, end-to-end approach to acquiring and deployingtalent right across your business, building flexibility intothe workforce to accommodate variability in demand. Itmeans determining which HR partners can best workalongside your own management, responding to both thetime dimension and the cultural fit to ensure the deliveryof talent to meet your business requirements.
In achieving our responsive on demand flexibility, we areworking with selected strategic HR partners to sourceand deploy a global range of talent, both permanent andcontingent. Our partners understand our requirement forquality and have the same commitment as we have tothe standards of capability and training that deliver thedifferentiation that yields our competitive advantage.
J U S T- I N - T I M E TA L E N T M A N A G E M E N T ( R I L E Y P E R S P E C T I V E )
In the era of production excellence, winning companies based their market dominating strategieson supply chain optimization. No process was left untouched, no matter how complex, in pursuitof the most cost-effective approaches to building and delivering their products wherever theirclients needed them…just in time. The resulting cost savings were significant; with some reportsshowing that these strategies saved the median Fortune 500 company five hundred million dollars.
Now and into the future, Manpower is partnering with many companies that are following anevolutionary path from a manufacturing-based business to a talent-centric enterprise, utilizing keysupply chain strategies. To help clients successfully achieve this objective, Manpower hasdeveloped a breakthrough approach to talent management derived from supply chain thinking.Talent Value Managementsm (TVMsm) is designed to create an integrated talent supply chain, wheretalent can be optimized and deployed using rigorous decision support tools with a foundation ofcommon data and processes.
Talent supply chain optimization can drive the answers to questions like:
Which talent requirements are the most critical?
How do I best source this talent?
What is the optimal mix of regular full-time and contract workforce?
What talent investments do I need to make and where?
Our ultimate objective as our client’s talent management partner is to help the organization ensurethat its investments in people are fully aligned with, and help drive, business strategy to yield themaximum return on investment.
J U S T- I N - T I M E TA L E N T M A N A G E M E N T

JUST- IN-T IME

PIERRE DANONCHIEF EXECUTIVE OFFICERBT RETAILONDEVELOPING A FLEXIBLE WORKFORCE
Once the UK’s monopoly nationaltelecommunications provider, BTGroup today operates competitively in5 continents, differentiating itself byproviding both telecommunications andIT services to its residential, business,and corporate customers worldwide.
Some 40 percent of the Group’s100,000 employees work for BTRetail, the residential and corporatetelephony services division, as customer service staff in the company’s 40 UK contact centersand as installation and network engineers in the field.

JUS
T IN
TIM
E S
TAFF
ING
The most important characteristic required by contactcenter staff and field engineers at BT Retail is to havegood customer-interface skills. They also need to beteam players and to have a “learning attitude” – adaptingreadily to fast-paced industry change, as we introduceenhanced new services and continually improve ourcompetitive offering. Our greatest HR challenge inrecent years has been to create a high-performanceenvironment among our 50,000 employees in BT Retail,to detect and develop our in-house talent pool, and tocreate greater workforce flexibility.
SERV ICE PERFORMANCE
We have done a lot to transform our workforce’s per-formance to meet service-business realities in the 21stcentury. A performance improvement plan has raised theindividual and collective employee contribution throughcoaching, raising expectations, rewarding, and introducinga Code of Conduct for our customer-facing “battalions,”monitored through customer feedback. We have pro-actively managed our talent pool, detecting, developing,sourcing anew, retaining key skill sets, and ensuring theright level of talent diversity for our ongoing businessand growth.
VARIAB IL I TY AND RESPONSIVENESS
Our industry faces enormous variability in HR demandover short time periods. Bad weather can create hugedemand for engineers to repair landlines after storms;and competitive initiatives generate a demand for extracontact center staff when we launch a new program,such as broadband. At such times, we need to have fastand flexible access to appropriately skilled and trainedresources or to create a pool of specialist talent (such asIT professionals) quickly, but without being locked intooperational constraints.
A FLEX IBLE EXTENDED ENTERPR ISE
Outsourcing massive contracts to just a couple of HRvendors has enabled us to focus management efforton fewer relationships and our vendors to invest time,effort, and resources into making them work. Temporaryand contract employees come in trained, prepared, andwell managed, with a good understanding of the BT culture.Having such close strategic partnerships has allowed usto build a highly flexible and scalable “extended enterprise”of contingent employees who hit the ground running andbecome assimilated seamlessly into the organization,working indistinguishably alongside our regular BTbattalions. And many of them end up working directly forBT – making for a risk-free source of quality recruitment.
D E V E L O P I N G A F L E X I B L E W O R K F O R C E ( D A N O N P E R S P E C T I V E )

The critical question for companies seeking optimal flexibility and responsiveness is: are weoptimizing the use of skills, and the cost of those skills, within this workforce? A perfectlybalanced workforce is achieved when the right people are performing work that is most critical toexecuting the business strategy…at the right value.
Demand management or talent planning is the key to determining which employees and positionsin the company will result in having the right people at the right value. Understanding which talentto invest in, and deciding which supply strategy (internal, external, contingent/supply partners,alternative sourcing) offers the most total savings, is a complex but rewarding process. A flexibleworkforce model allows clients to:
Align investments in compensation, development and training with strategic impact
Close the gaps between supply and demand
Develop strategies to describe roles and skills consistently internally and externally
Determine the best sources for talent
The net result of this effort is a sharp decrease in unnecessary labor spend, coupled with theimproved ability to invest more in those roles that will continue to drive demand for the company’sservices and products. Manpower’s capability to properly analyze the risks and costs of talentmanagement, while delivering innovative supply alternatives delivers competitive advantagesfor employers of all shapes and sizes around the world, and we expect this trend to continueinto the future.
D E V E L O P I N G A F L E X I B L E W O R K F O R C E

FLEXIBLE

LYNN C. MINELLAVICE PRESIDENT–HUMAN RESOURCESAIR PRODUCTSONCREATING A HIGH PERFORMANCE ORGANIZATION
Air Products is a global company that provides industrial gas and specialty chemicals to a wide varietyof sectors worldwide, ranging fromheavy industrial processing, such as steel, to paints and adhesives,healthcare consumables, and high-tech consumer electronics products,such as LCD TV screens.
The company’s workforce spansprocess and development engineers,a technically literate sales force that understands its products andcustomers’ business requirements,and a range of support staff operatingits complex facilities, and handling anddelivering its products where andwhen they are needed.

Although much of our output is used in industrialprocesses, we are truly a technology business. We haveto be at the forefront of technological developments inour growth markets, delivering products that addressour customers’ emerging needs. Our managers need tohave not only the insight and acumen to understandour customers’ products and devise solutions to theirbusiness needs, but also the right interpersonal skills todevelop and empower our highly diverse employeegroup to constantly improve their performance and fulfilltheir potential.
DEVELOPING PASS IONATE , ADAPTABLE TALENT
Today, both we and our customers are experiencingconstant and accelerating globalization and change. Wehave to stay alongside them as they move into newbusinesses and geographical markets and to recognizethat competition no longer always comes from where ittraditionally did. Our challenge is to develop, implement,and manage HR programs to meet those new realities,creating an environment in which our employees arehighly motivated, productive, open to change, passionateabout their work, and feel valued.
A ONE-COMPANY CULTURE
At Air Products we strive to have a “one-company” feel,where everyone shares the same guiding values, whilerecognizing and accommodating individual and culturaldiversity, and all have a sense of the corporate culture –and what it means to be “an Air Products employee.”This makes for an “accountable” workforce, in whichevery employee takes personal responsibility for givingof their best and operating with the highest level ofprofessional integrity, and acknowledges the vitalimportance of observing strict safety practices in theareas of health – for themselves and customers – andthe environment.
Our leadership development programs help individualsassess their strengths and weaknesses and providesthem with career-enriching opportunities. Our centers offunctional excellence, such as process engineering,develop skilled specialist teams that can be deployed towhere they are needed to capitalize on perceived growthand customer-service opportunities. Our HR planningprocess aims to provide employees with the necessaryexperiences to fulfill both their personal career aspira-tions and the company’s strategic needs, while at alltimes balancing the interests of individuals with thoseof the company in serving customers and deliveringshareholder value.
C R E AT I N G A H I G H P E R F O R M A N C E O R G A N I Z AT I O N ( M I N E L L A P E R S P E C T I V E )

Today more than ever, company performance relies on people. Not just management, but the entireworkforce – whether they be full-time staff, contractors or temporary workers. To be successful,everyone within the organization must be engaged; aligned to the business’ strategic goals andable to understand the role they play in achieving them. And above all, people must continue toperform throughout changing business conditions.
Our experts at Right Management Consultants play a pivotal role in helping companies develop ahigh performance workforce by attracting, selecting and retaining people who are the best fit withtheir organization’s strategies, culture and values. Our services in this area include defining andcommunicating employment value propositions, identifying critical competencies for success,designing and administering selection systems, developing new-hire assimilation programs, andcreating retention initiatives.
Companies must also understand that the continual development of their leaders is crucial tosupporting the business strategy and evolving corporate culture. Because when leaders areengaged, aligned and effective, they are the key to translating business strategy into performance.Companies need to ask themselves:
Do we have a pipeline of leadership consistent with our future business direction?
Are professional development and job rotation opportunities readily available?
Is a succession planning process in place?
Do our programs reflect the constant change in the business environment and help leaders developthe agility to lead under a variety of strategic scenarios?
In the years to come, organizations that are able to navigate the complex, global market environmentwhile developing a workforce comprised of agile, engaged and aligned employees, will be theones best positioned to win.
C R E AT I N G A H I G H P E R F O R M A N C E O R G A N I Z AT I O N

HIGH PERFORMANCE

ANDRÉ R VAN HEEMSTRAPERSONNEL DIRECTORUNILEVERONOUTSOURCING HR SERVICES
Unilever is a multi-national consumergoods company that resulted fromthe merger in 1930 of the UK soap-maker Lever Brothers and the Dutch Margarine Union – “Uni-”from “Union” and “-lever” fromLever – both of which already had awell-established worldwide presence.
The company’s 230,000 employeesworldwide produce and distributebranded food and home & personalcare products – “all the things thatmake people feel good, look goodand get more out of life” – which aremarketed and sold in almost everycountry in the world.

As a worldwide business operating in the fast-movingconsumer goods sector, we need a first-rate permanentlabor force for ongoing operations, as well as additionaltemporary staff for periods of seasonality, such as forice cream and frozen vegetables. While the nature of ourbusiness means employing predominantly local people atall levels, our management population includes expatriates,as we like our higher leadership to have had experiencein several parts of the Unilever world.
S IMULTANEOUSLY B IG AND SMALL
Rather than a global company, we see ourselves as amulti-local multinational. Our greatest challenge is tocombine the flexibility of a small organization with theimpact of a big company. Intense competition and theever-changing environment within our industry impose aconstant need to find new and more efficient ways ofdoing business – and to stay flexible and adaptable.
The global scope of our business and the local nature ofour customer base together lent themselves to taking aregional approach to our manufacturing supply chain. Wehave closed facilities in some areas and expanded them
in others, with a resulting reduction in manufacturingplants from 500 to 350; we rationalized our brand rangefrom 1,600 to some 400 by introducing more globalbrands; and we significantly reduced the number of ourvendors. While this has helped us improve on being big,we have also improved on being small, for example byhaving local “marketeers” regularly visit consumers’homes to understand their specific needs and achieve“consumer intimacy.”
OUTSOURCING FOR FLEX IB IL I TY
Regionalization has brought scale benefits and a concen-tration of assets that has enabled us to view our workforcemore strategically and develop skills over a longer time-frame. We have gained workforce flexibility by outsourcingrecruitment of seasonal and temporary staff, as well asthe provision of contract specialists to augment skills inareas such as IT. Further candidate functions that wehave identified for handling at a regional level, and possibleoutsourcing, lie in the transactional administration activitiesof HR and Finance. The objective is to free up our HRand Finance managers to concentrate on more strategic,transformational activities.
O U T S O U R C I N G H R S E R V I C E S ( VA N H E E M S T R A P E R S P E C T I V E )

Over the past several years, as employers embraced outsourcing to improve productivity in theirHuman Resources function, they began with transactional processes such as payroll processingand benefits administration, and moved toward recruiting, assessment, training and career transition.As outsourcing these processes proved successful, attention turned toward outsourcing non-corebusiness activities such as facility management, logistics, and even accounting. Leading companiesare now beginning to take advantage of the transformational opportunities that the outsourcingevolution can bring, as they look to fully optimize their talent management.
Talent optimization through HR outsourcing requires an objective analysis of how and wherehuman resources should be deployed across the organization, including:
The skills required in the business, where they can be found in a world of growing skills shortages,and where they are needed.
The business functions and roles that must be performed at the local level versus those thatcan be performed centrally, either at the national, regional or global headquarters.
Optimal staffing levels to ensure efficiency for the employer through fluctuation in demand, andquality service for its customers.
The functions, processes and roles that are core to the business versus those that can beoutsourced to a third party in order to focus internal resources on what matters most, andgenerate cost savings across the organization without sacrificing quality.
Across the employment and business cycle, Manpower is in a unique position to view the worldof work, both globally and locally. We see employment trends ahead of an individual customerwhose view is restricted by industry silos, and we serve as their partner and change agent as theyexecute their strategies. From outsourcing HR services to change management consulting,Manpower and Right Management Consultants work in tandem to help organizations achieve theproductivity, efficiency, and cost management gains they expect to realize from outsourcing.
O U T S O U R C I N G H R S E R V I C E S

OUTSOURCING

CARLOS ABASCALMINISTER OF LABOR AND SOCIAL WELFAREMEXICOONIMPROVING JOB SKILLS OF A NATION
Mexico has a population of 105 million,with 95 percent below the age of 65.Of its active labor force of 34 million,some 3.3 percent are unemployedand a further 25 percent underem-ployed. For some time, the countrywas seen only as a low-wage laborpool for U.S. manufacturers.
Faced with labor competition from otherdeveloping economies, the country is promoting social dialogue betweenlabor, business, and government; andeducating and training its young peopleto provide the productive, wealth-generating skills to fuel the nationaleconomy, raise living standards, andattract foreign investment.

Mexico is a very young country, with one-quarter of itspopulation currently aged 17 – 29. One of the greatestchallenges for our economy is to help our young peopledevelop their potential and realize their skills, so that theycan meet the needs of the labor market, not only in largemultinational enterprises, but also in small and medium-sized companies.
Over the past few decades, the country has gained a“demographic bonus” consisting of 33 million children andyoung people. Our aim is to ensure that, by 2010, at least40 percent of that population has graduated from highereducation. Our economic success will depend on how wellwe can raise the skill profile of our working populationboth for their own benefit and for the good of the wholenation, by committing to the individual person, who consti-tutes the origin, engine and end of the national economy.
A NEW SOCIO-ECONOMIC MODEL
Our country’s ideological legacy, supported by some ofits labor unions, sometimes held the economy back. Butin the past 10 years, we have built up a new model ofemployee–employer relations, framed in a New LaborCulture, promoting effective social dialogue, raising people’sawareness of the new competitive global realities, andbringing productivity and competitiveness – with socialjustice – into the labor arena.
We are committed to ongoing employee training andtechnological innovation to enhance productivity. We haveintroduced programs to enable unemployed and under-employed individuals to access and transition to productivejobs, contributing fully to the national economy. We alsohave introduced training schemes and financial supportprograms to foster self-employment in small businesses.
ADAPTAB IL I TY AND INCLUS IV ITY
Our Job Observatory project monitors available jobs andskills demand, and directs our education programs tofulfill this demand, so that businesses will find in Mexico aready pool of the right kind of skilled talent, and individualscan be certain of finding a suitable job on completion oftheir studies.
Alongside these programs, we have robust policies foreradicating discrimination on grounds of age, gender ordisability. In particular, our Inclusive Firm Program acknowl-edges Mexican companies’ efforts to include mentally andphysically disabled employees in their workforce.
We were pleased recently to be able to acknowledge themajor contribution in this area of Manpower’s ongoingCaminemos Juntos partnership program in Mexico andto grant them an Inclusive Firm award in recognition oftheir efforts in helping to place several hundred disabledpeople into productive employment.
I M P R O V I N G J O B S K I L L S O F A N AT I O N ( A B A S C A L P E R S P E C T I V E )

As the world becomes a smaller place, with commerce criss-crossing the globe in all industries,the world of work has also been transformed in profound ways. This is especially important fornational governments as they bear the responsibility for ensuring that their country and its peoplecan compete in the world economy.
Labor ministries play an increasingly important role in developing the Human Resources strategyand programs for current and future generations of their countrymen and women. For developingcountries, this strategic role is critically important to the country’s ability to compete for foreigninvestment, build their national commercial infrastructure and provide the means for individualsto succeed.
For more than 40 years, Manpower has played a unique role in the world’s labor markets, workingin partnership with national governments and non-government organizations to solve the mostpressing labor market needs. Many of our programs – like Working Links in the U.K. – aredesigned to serve as a bridge to employment, providing basic job skills to the unemployed,underemployed and people with disabilities, and placing them in jobs at the end of their training.Other programs – like TechReach in the U.S. and Canada – are designed to help individualstransition from jobs that have become obsolete, to sustainable new careers in fields where thereare shortages of skilled workers.
Increasingly, we are working with governments to identify underemployed populations such asolder workers, to engage or re-engage them in the labor market. The expertise that we have gainedfrom our commercial experience, coupled with our pragmatic approach to putting people to work,has proven invaluable to governments throughout the world.
I M P R O V I N G J O B S K I L L S O F A N AT I O N

JOB SKILLS

Fluctuations in business demand. Intensifying competition at both the global andlocal levels worldwide. Shortages of skilled workers. Movement of work andworkers across borders. Escalating requirements for efficiency and productivityimprovements. Succession planning and leadership development. These are the HRchallenges our clients are facing every day, and Manpower is uniquely positioned toprovide them with effective solutions. More importantly, we are already developingsolutions and services to help our clients navigate the many challenges that lieahead in the coming years.
What’s next?We’ll be ready.
M A N P O W E R I N C . 2004 Annua l Repo r t23
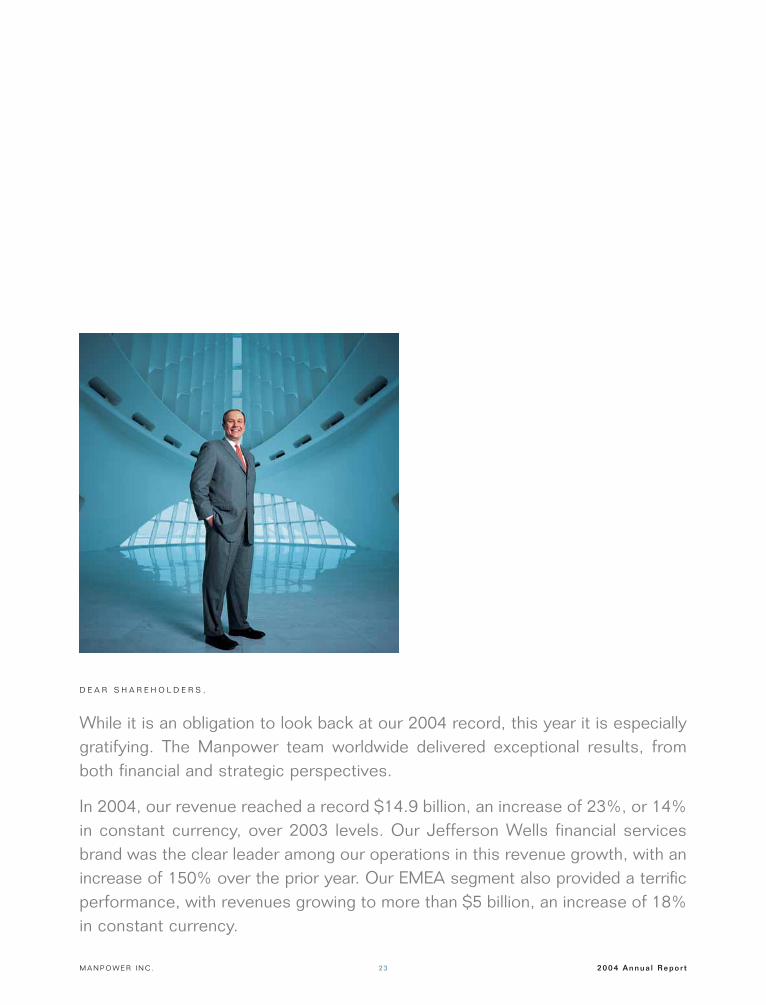
D E A R S H A R E H O L D E R S ,
While it is an obligation to look back at our 2004 record, this year it is especiallygratifying. The Manpower team worldwide delivered exceptional results, fromboth financial and strategic perspectives.
In 2004, our revenue reached a record $14.9 billion, an increase of 23%, or 14%in constant currency, over 2003 levels. Our Jefferson Wells financial servicesbrand was the clear leader among our operations in this revenue growth, with anincrease of 150% over the prior year. Our EMEA segment also provided a terrificperformance, with revenues growing to more than $5 billion, an increase of 18%in constant currency.

2004 Annua l Repo r t M A N P O W E R I N C .24
Earnings for 2004 were $246 million – a record for Manpower – and a significantincrease of 78% from 2003. We also continued to strengthen our balance sheet,with total debt as a percentage of capitalization improving from 39% in 2003 to29% in 2004. Given our confidence in the future and our commitment to deliveringshareholder value, we also doubled our semi-annual dividend in the second halfof 2004.
All said, it was a very good year with impressive results for Manpower and itsfamily of companies. The sustainability of business performance, however, is ourbenchmark for success, and we have proven that we have the ability, focus andexecution to deliver continued, sustainable results over time. Over the last fiveyears we have outperformed the S&P 500 by 43%. More importantly, each yearwe have continued to establish new baselines against which to measure ourperformance. As we move into 2005, we have set the bar even higher.
We believe that throughout 2004 we continued to build momentum, setting our-selves up for 2005 and beyond. The heart and soul of our business is, and willcontinue to be, temporary staffing, and that part of our business grew 20%. Wewere able to open new offices in expanding markets like India, Japan, Germanyand Italy, extending our network to a total of more than 4,300 offices worldwide.We also improved our efficiency and stayed very disciplined in our pricing strategyin the temporary staffing marketplace.
L E T T E R T O S H A R E H O L D E R S

M A N P O W E R I N C . 2004 Annua l Repo r t25
An imperative as we move into the future is balancing our mix of business.We have been making progress for several years, and 2004 marked the mostsuccessful year that we have had in working toward this goal. Jefferson Wellsadded $204 million of revenue for a total of $341 million in 2004; Elan, our ITspecialist brand, grew 39%, with total revenues of $540 million for the year; andthe acquisition of Right Management Consultants added $365 million in revenue.These three brands alone generated $1.3 billion in total revenue in 2004. Mostimportantly, these specialty services have enabled us to offer our customers thecomplementary range and scale of services that is changing the landscape of ourindustry by helping our customers to evolve their people strategies in ways thatno one else can.
Jefferson Wells, in particular, has made great strides in the past year, gaining thetrust and respect of top companies in the U.S. as they worked through themammoth task of the Sarbanes-Oxley compliance process. This work hasopened doors for the company to introduce clients to their full portfolio of internalaudit and controls, technology risk management, tax, finance and accountingservices. In addition to expanding Jefferson Wells’ network of offices in the U.S.and Canada, 2004 marked the opening of its first office in Europe, located inLondon. We expect this investment to pay off in 2005 and beyond, as the U.S.continues to work through financial reform measures, and Europe embarks on itsown journey toward greater accountability in corporate governance.
L E T T E R T O S H A R E H O L D E R S

2004 Annua l Repo r t M A N P O W E R I N C .26
Throughout 2004, we made great progress in expanding our permanent place-ment market share, adding over 450 dedicated permanent placement recruitersacross the world. Our goal is to become the de facto leader in permanentplacement worldwide, across all 67 countries and territories in our network. Thisincludes our French unit where a legislative change in late 2004 allows us, forthe first time, to provide permanent placement services to the French market.
So what’s next for Manpower? As I’ve stated before, we are determined toredefine the industry by offering a unique approach to solving our customers’problems, now, and as they are traveling the road that lies ahead. As we listento our customers and experience what’s happening in their workplaces throughoutthe globe, we see the next big need that we intend to fulfill. It is the requirementto optimize all of the talent that is involved in the company. It is the key todelivering a critical competitive advantage to companies that are facing fiercecompetition at both the global and local levels.
For many years, companies have optimized various facets of their businessthrough supply chain management and offshoring/outsourcing of transactionalfunctions or manufactured products. The one element that has been left outof this intense movement toward optimization, and one that companies arecoming to realize that they must address, is the entire talent pool that workswithin their organization, including permanent, temporary and contract staff, aswell as consultants.
L E T T E R T O S H A R E H O L D E R S

M A N P O W E R I N C . 2004 Annua l Repo r t27
Companies have come to realize it is a mandate to know what’s now and what’snext in their talent requirements, and to be able to manage these requirementseffectively across the full gamut of their available talent pool. Manpower isuniquely positioned to answer this call, and we intend to capitalize on this emergingneed. In our view, it’s about the employment life cycle and the business cyclemeshing together to optimize talent management and utilization. This is truly thenext frontier for our clients worldwide to achieve optimal efficiency, productivityand competitive advantage.
The Manpower solution is Talent Value Managementsm, a concept that we devel-oped over an 18-month period, to assist companies in determining where all ofthe various talent resides in their organization, and how the vast array of talentwithin that organization works together. This information then drives decisionsthat enable placement of the right people, with the right skills, in the right areas ofthe organization in order to improve productivity and efficiency, and drive the key out-comes required in the business strategy. We believe Talent Value Managementis the key to optimizing the most important investment in any company – people.
This is just one of the many ways that we are focused on what’s next in the worldof work, and how we can change the role of employees in fundamental ways.With our array of services and innovative solutions to today’s most pressingemployment challenges, Manpower has a distinct advantage that we intend toleverage toward further sustainable growth in the years ahead.
L E T T E R T O S H A R E H O L D E R S

2004 Annua l Repo r t M A N P O W E R I N C .28
We are confident that 2004 will be marked as a turning point year for Manpower.At the core, Manpower and its offerings today, and what we are creating for thefuture, will redefine the industry. This is a bold statement, but one that we atManpower believe in, strive for, and have the discipline and execution to achieve.The best is yet to come.
I would like to thank the 27,000 talented, hard-working people of Manpower whodeliver the best service in the industry, and make it all worthwhile through theirexceptional dedication.
In addition, I would also like to thank our Board of Directors for all of their insightand support. We welcome Marc Bolland, executive board member of HeinekenN.V., as our newest member of the board, joining in 2004.
And finally, I would like to thank our shareholders for their commitment toManpower and their continued confidence that we are poised for even greaterperformance in the years to come.
What’s next? We’ll be ready.
JEFFREY A. JOERRESCHAIRMAN, CEO & PRESIDENTFEBRUARY 9, 2005
L E T T E R T O S H A R E H O L D E R S
2005 and beyond will present employers with a number of workplace challenges that will impacttheir organizations. At the forefront of these challenges are skills shortages of various kinds,which are already being felt in countries around the globe. Whether it is truck drivers in theU.K., auditors in the U.S., or welders in Australia, finding people with the right skills will becomeincreasingly difficult and crucial to staying competitive.
Equally as important is training for people at all levels. From C-level on down, a strategy formaintaining and improving competitive skill sets will be required for companies to continue togrow, develop and deliver future technologies and services.
At the periphery of these issues are the underemployed, including the disabled, the elderly andother disadvantaged people. These people need extra assistance to help them participate in theworkforce. This is becoming ever more important as changing demographics will exacerbate theskills shortage issue in the future.
Manpower understands these issues and for more than five decades we have developed innovativeworkforce development programs – both large-scale national initiatives and smaller local efforts –to help thousands of people engage in sustainable employment. We understand that developingskills is a key component to helping people move into better paying jobs. We also understand thatpeople with the right job skills also need an employer that is willing to give them a chance to work,regardless of where they have come from, what they look like, or whether they have specialneeds. Our systems, programs and policies are designed to make the connection to work a viableoption for those who have struggled in the journey.
The following pages illustrate some of the ways over the past year Manpower has been able tohelp people improve their employability, engage in the workforce, and make a positive change intheir lives.
C O R P O R AT E S O C I A L R E S P O N S I B I L I T Y

employment option for disadvantaged individuals when otheravenues to employment have failed. This is important for bothemployers and employees, as stronger employment laws arebeing enacted in many countries to improve inclusion in theworkplace. More importantly, our systems are uniquelydesigned to match people to positions that are the right fit fortheir interests and abilities, where they can have a betterchance to succeed and establish a solid foundation in theiradopted countries.
B R E A K I N G T H E C U LT U R A L B A R R I E R S F O R I M M I G R A N T SA L E X A N D E R D E N H E L D E R
Alexander Denhelder arrived in Sweden as a Kurdish politicalrefugee from Iraq. He completed his economics degreefrom Stockholm University, but had great difficulty finding acompany that would hire him. For a year and a half, hesearched in frustration for employment, completing hundredsof applications without a single interview. Then, one day heresponded to an employment advertisement from Manpowerand everything changed.
“Manpower gave me a chance to work when no one elsewould,” said Alexander. “Since the day I started at Manpower,my managers have given me support and encouragement.They trust in me to make our customers happy and I trust inthem to find me rewarding work and support my ambitions.”
It was six years ago when we found work for Alexander atSiemens. Today, he is working as an archive assistant atSweden’s FMV (Försvarets Materielverk) defense materialsdepartment.
This story from Sweden illustrates how Manpower is uniquelypositioned to help immigrants find work in their “new”countries, and how we can help fill labor shortages in localmarkets. In many countries, it can be difficult for immigrantsto find jobs. This can be due to a variety of reasons: lack ofcertifications/education, lack of experience, language barriers,cultural misunderstandings, and racial discrimination. At thesame time, employers in these very same countries are facingskills shortages.
Because Manpower has proprietary assessment and selectionsystems that focus strictly on the competence of the worker– not nationality, race, gender or age – we are often the only
“What mattered to Manpower was my experience, my education and whether I could do a good job for the customer – not my name or where I came from.”

Patricia Merrick is no stranger to work. In fact, she managestwo careers – one as an actress, landing roles in TV dramas,theater and film; and one as a professional driver withManpower Driving in the U.K.
“Working for Manpower is great; it gives me the flexibility tocontinue my acting career and supplement my income whenI’m between acting jobs,” said Patricia. “As an actress I candisappear from my driving career for a few months and then pickup again where I left off when the acting job’s done. I can relyon Manpower to be there when I’m ready to go back to driving.”
When Patricia started driving nearly 14 years ago, womendrivers were a rare breed. “In the early ‘90s a woman truckdriver was an oddity, but that attitude has changed,”explained Patricia. “I’m a woman, but I’m also just anotherdriver who gets the job done. I think Manpower has done alot to bring about that change in attitude and defeat the ideathat women aren’t suited to driving.”
The shortage of skilled workers resulting from demographicshifts is providing a tremendous opportunity to engagegroups in the workforce who are currently underrepresentedin many career paths. Across the U.K., drivers are in shortsupply and Manpower has been successful in recruiting them,due in part to our diversity strategy. By marketing the drivingcareer to non-traditional groups in the U.K. – such as women,minorities and older persons – Manpower has been able tofind quality drivers when the transportation industry as a wholeis experiencing a severe shortage.
We are changing the image of driving as a career by eliminatingold stereotypes and providing excellent pay, benefits, and the
certification training that people need to succeed as drivers.While our driving recruits benefit from a stable career, ourclients also benefit from having high-caliber, reliable drivers.
People are surprised when Patricia tells them she’s been adriver for 14 years. “We drive for high-caliber clients that arevery friendly and accommodating. I’ve been offered full-timejobs, but I’d rather keep driving for Manpower.”
O P E N I N G D O O R S T O N O N - T R A D I T I O N A L C A R E E R SPAT R I C I A M E R R I C K
“In the early ‘90s, a woman truck driver was anoddity, but that attitude has changed. I thinkManpower has done a lot to help bring aboutthat change.”

Caresse Seguin, a single mom with two children, wasseeking a fresh start after moving back to Alberta fromOntario where she was employed as a healthcare worker forthe elderly. The wage difference for this occupation in Albertawouldn’t allow her to provide for her family, so she was onsocial assistance and looking for a job that could grow withher. Then a representative of the Alberta provincial governmentrecommended her for Manpower’s TechReach program.
“Like so many unemployed people, I just needed a helpinghand,” said Caresse. “Manpower gave me the chance to showwhat I could do.”
Manpower’s TechReach program, a workforce developmentinitiative in the United States and Canada, is designed toprepare unemployed and underemployed individuals for well-paying careers in information technology and other in-demandjobs. It includes intensive training, certification, job placementand mentoring in an effort to provide businesses with a newsource of skilled employees.
Not only does it provide companies with a new source ofemployees, but it also makes a difference in people’s lives.Caresse graduated from our TechReach program with a new-found confidence in her abilities and a “master” skills rankingin a variety of PC applications. She is currently making a goodhourly wage as a sales support assistant for Weyerhaeuser,an international forest products company, in Calgary, Canada.
“Manpower’s training program gave me the opportunity toempower myself with the skills I needed to work for amajor corporation,” noted Caresse. “I couldn’t have done itwithout them.”
“Like so many unemployed people, I just neededa helping hand. Manpower gave me the chanceto show what I could do.”
FA C I L I TAT I N G T H E T R A N S I T I O NT O A M O R E V I A B L E C A R E E RC A R E S S E S E G U I N
Today, TechReach is active in 45 locations throughout theUnited States and Canada and it is one of our larger programsthat helps teach people new skills so they can improve theiremployment situations and make career transitions. Morethan 1,000 people have graduated from the program since itsinception, including disabled, elderly and unemployed persons.

It’s very difficult, if not impossible, to advance in your careerwhen you lack the skills. That’s why Manpower developstraining programs to help its temporary workers improve theirskill sets so they can move into better paying jobs.
For example, Manpower France has created Alphabétisationet Techniques Culinaires (Literacy and Culinary Techniques),an innovative program that combines training in literacy withadvanced culinary techniques for its temporary workers in therestaurant field. Our program is a six-month, 210-hour coursetaught at the l’ École Grégoire-Ferrandi de Paris, a culinarytraining academy. Here, our employees learn French andmathematics in the context of the kitchen.
Mamadou Bala Ba, a Senegalese immigrant, came to France18 years ago. However, his command of the French languagewas still very rudimentary when he signed on with our Parisbranch as a dishwasher in the summer of 2003. But today,thanks to his motivation and our literacy program, he now hasthe skills and knowledge to work as a cook’s assistant. Thisallows Manpower to send him out on higher-skilled, higher-status assignments that pay more.
“Now I can speak French better and I write it well,” saidMamadou. “I learned to read a recipe and calculate theamounts of the different ingredients…now I also know cookingvocabulary and technical terms.”
Mamadou is also more interested in his new career path.
“Before the training I worked as a dishwasher, washingplates, glasses, etc. Now, I help prepare the food and I like ita lot,” explained Mamadou. “The Manpower class reallyhelped me develop – I work more often, the work is moreinteresting, and I’m paid better.”
Understandably, Mamadou has become an advocate ofManpower. “Manpower really stands out compared to otheragencies. I tell my family and friends to come sign up withManpower because here, temporary workers are reallyrespected. We are treated well and helped to advance in ourcareers. This course is proof of it!”
“I tell my family and friends to come sign upwith Manpower because here, temporaryworkers are really respected. We are treatedwell and helped to advance in our careers.”
I M P R O V I N G B A S I C S K I L L S T O E N A B L E A D VA N C E M E N TM A M A D O U B A L A B A
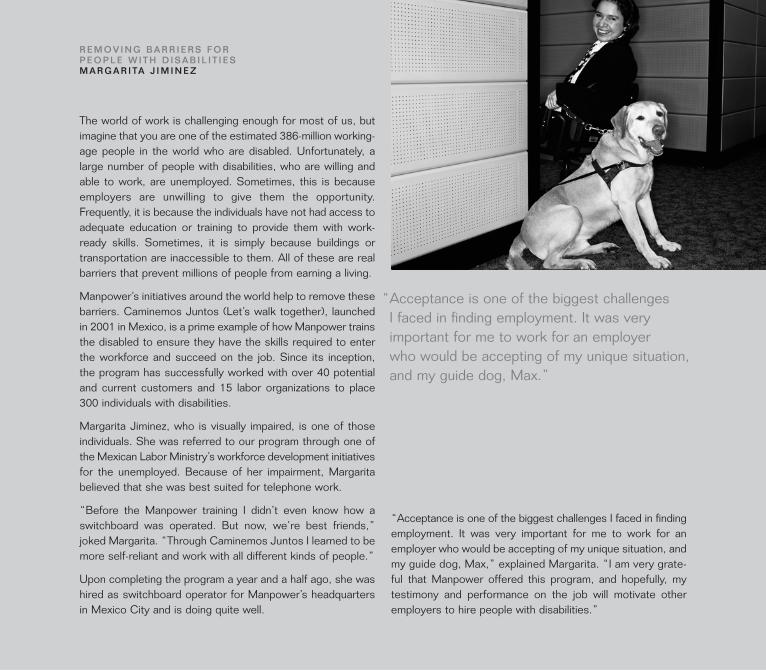
The world of work is challenging enough for most of us, butimagine that you are one of the estimated 386-million working-age people in the world who are disabled. Unfortunately, alarge number of people with disabilities, who are willing andable to work, are unemployed. Sometimes, this is becauseemployers are unwilling to give them the opportunity.Frequently, it is because the individuals have not had access toadequate education or training to provide them with work-ready skills. Sometimes, it is simply because buildings ortransportation are inaccessible to them. All of these are realbarriers that prevent millions of people from earning a living.
Manpower’s initiatives around the world help to remove thesebarriers. Caminemos Juntos (Let’s walk together), launchedin 2001 in Mexico, is a prime example of how Manpower trainsthe disabled to ensure they have the skills required to enterthe workforce and succeed on the job. Since its inception,the program has successfully worked with over 40 potentialand current customers and 15 labor organizations to place300 individuals with disabilities.
Margarita Jiminez, who is visually impaired, is one of thoseindividuals. She was referred to our program through one ofthe Mexican Labor Ministry’s workforce development initiativesfor the unemployed. Because of her impairment, Margaritabelieved that she was best suited for telephone work.
“Before the Manpower training I didn’t even know how aswitchboard was operated. But now, we’re best friends,”joked Margarita. “Through Caminemos Juntos I learned to bemore self-reliant and work with all different kinds of people.”
Upon completing the program a year and a half ago, she washired as switchboard operator for Manpower’s headquartersin Mexico City and is doing quite well.
“Acceptance is one of the biggest challenges I faced in findingemployment. It was very important for me to work for anemployer who would be accepting of my unique situation, andmy guide dog, Max,” explained Margarita. “I am very grate-ful that Manpower offered this program, and hopefully, mytestimony and performance on the job will motivate otheremployers to hire people with disabilities.”
“Acceptance is one of the biggest challenges I faced in finding employment. It was very important for me to work for an employer who would be accepting of my unique situation,and my guide dog, Max.”
R E M O V I N G B A R R I E R S F O R P E O P L E W I T H D I S A B I L I T I E SM A R G A R I TA J I M I N E Z
All over the world, Manpower employees, partnering with community organizations, businessesand governments, engage in workforce development programs and activities that make a differencein people’s lives.
Because of our relationships with both employers and workers, we are uniquely positionedto determine where current and future skills gaps are, identify people who need help, and developsolutions that bring these two groups together, mutually benefiting both. In this way, we functionas a “bridge” to full-time employment for many who would otherwise be unemployed. Ourindustry leading skills assessment methods and hiring policies help us ensure that people arenot discriminated against. Rather, we focus on people’s abilities – not their disabilities.
For us, being a responsible company extends well beyond just writing a donation check toa charitable cause. It’s about strengthening the diversity of our communities and creatingopportunities for all people to participate in the workforce. Whether it’s helping an unemployedsingle mother return to the workforce, or giving a job to an immigrant when no one else would,our reward comes knowing that we make a real difference – today and in the future.
C O R P O R AT E S O C I A L R E S P O N S I B I L I T Y
Manpower researched many potential activities that we could engage in to provide relief for thesurvivors of this tragic disaster. We concluded that India is where we could make the greatestimpact on the long-term recovery efforts, by helping those who have lost their jobs, or have lostthe primary income provider in their families, to move toward economic stability. Therefore,Manpower will be funding the development of a vocational training center in the Tamil Nadustate in India, one of the most affected areas hit by the Asian tsunami. Through the new vocationaltraining center in India, we hope to play a small role in rebuilding those lives most affected bythis tragic disaster. Donations from our operations around the world, combined with the newvocational training center, bring the total Manpower commitment to tsunami victims to $1.7 million.
R E L I E F F O R A S I A N T S U N A M I S U R V I V O R S

F I N A N C I A L H I G H L I G H T S
(a) Revenues from Services include fees received from our franchise offices of $37.4 million, $28.1 million, $25.8 million, $26.5 million, and $34.5 million for 2000, 2001,2002, 2003, and 2004, respectively. These fees are primarily based on revenues generated by the franchise operations, which were $1,639.5 million, $1,323.4 million,$1,179.8 million, $1,214.4 million and $1,487.1 million for 2000, 2001, 2002, 2003, and 2004, respectively.
In the United States, where a majority of our franchises operate, Revenues from Services include fees received from the related franchise operations of $32.5 million, $24.1million, $21.7 million, $21.9 million, and $25.0 million for 2000, 2001, 2002, 2003, and 2004, respectively. These fees are primarily based on revenues generatedby the franchise operations, which were $1,433.9 million, $1,135.5 million, $1,015.8 million, $1,026.2 million, and $1,181.5 million for 2000, 2001, 2002, 2003, and2004, respectively.
(b) Systemwide Offices represents our branch offices plus the offices operating under a franchise agreement with us.
(c) On January 1, 2002, we adopted SFAS No. 142, “Goodwill and Other Intangible Assets,” which prohibits the amortization of goodwill and identifiable intangible assetswith an indefinite life.
(d) In the fourth quarter of 2004, we adopted EITF Issue No. 04-8. Previously reported Earnings Per Share – Diluted amounts have been restated to reflect the impact ofapplying the “if-converted” method to our Debentures. (See note 3 to the consolidated financial statements for further information.)
2000
2001
2002
2003
2004 14,930.0
12,184.5
10,610.9
10,843.8
10,842.8
REVENUES FROM SERV ICES (a)
i n m i l l i o ns ( $ )
2000
2001
2002
2003
2004 395.8
257.9
234.8
237.6
311.0
OPERAT ING PROF IT (c )
i n m i l l i o ns ( $ )
2000
2001
2002
2003
2004 4338
4041
3932
3920
3685
SYSTEMWIDE OFF ICES (b)
2000
2001
2002
2003
2004 2.59
1.69
1.42
1.59
2.22
NET EARN INGS PER SHARE – D ILUTED ($ ) (c ) ( d )

F I N A N C I A L C O N T E N T S
39 MANAGEMENT’S DISCUSSION AND ANALYSIS57 MANAGEMENT REPORT ON INTERNAL CONTROL OVER F INANCIAL REPORTING58 REPORT OF INDEPENDENT REGISTERED PUBLIC ACCOUNTING F IRM59 CONSOLIDATED STATEMENTS OF OPERATIONS60 CONSOLIDATED BALANCE SHEETS61 CONSOLIDATED STATEMENTS OF CASH FLOWS62 CONSOLIDATED STATEMENTS OF SHAREHOLDERS’ EQUITY63 NOTES TO CONSOLIDATED F INANCIAL STATEMENTS90 FINANCIAL MEASURES91 SELECTED F INANCIAL DATA92 CORPORATE INFORMATION94 PRINCIPAL OPERATING UNITS

M A N P O W E R I N C . 2004 Annua l Repo r t39
B U S I N E S S O V E R V I E W
Manpower Inc. is a world leader in the employment services industry.Our global network of over 4,300 offices in 67 countries and territoriesallows us to meet the needs of our customers in all industry segments,whether they are global, multi-national or local companies. By offering acomplete range of services, we can help any company – no matterwhere they are in their business evolution – raise productivity throughimproved strategy, quality, efficiency and cost reduction.
We do this through the Manpower family of companies (see PrincipalOperating Units) which includes:
Manpower – temporary and permanent staffing, employee assess-ment, and training
Jefferson Wells – professional financial services
Right Management Consultants – career transition and organizational consulting services
Elan – IT recruitment and managed services
For example, to ensure that customers have the right person – with the right skills – when business demand is high,we offer permanent, temporary and contract recruitment, and employee assessment and training services. We alsoprovide highly specialized professional services, such as internal audit and controls, technology risk management, tax,finance and accounting services. If customers are searching for ways to work “smarter,” we also offer a wide rangeof organizational consulting services such as strategic talent management and leadership development. On the otherhand, if a customer’s business demand is low, we offer career transition (outplacement) services. We also offermanaged services if a customer wants to outsource a complete business function with us, such as call center, helpdesk, recruiting, or manufacturing operations. This balanced business mix allows us to offset the cyclical affects of thenational economies in which we operate.
Our leadership position also allows us to be a center for quality employment opportunities for people at all differentpoints in their career paths. Each year, we employ more than two million people who work to help our more than400,000 customers meet their business objectives. Laborers, seasoned professionals, mothers returning to work,elderly persons wanting to supplement pensions and disabled individuals – all turn to Manpower for employment.Similarly, governments of the nations in which we operate look to us to help them reduce unemployment and trainthe unemployed with the skills they need to enter the workforce. In this way, Manpower is a bridge to permanentemployment for those who desire it.
Our industry is large and fragmented, comprised of thousands of firms employing millions of people and generatingbillions of U.S. Dollars in annual revenues. It is also a highly competitive industry, reflecting several trends in the globalmarketplace, notably increasing demand for skilled people and consolidation among customers and in the employmentservices industry itself.
We manage these trends by leveraging established strengths, including one of the employment services industry’sbest-recognized brands; geographic diversification; size and service scope; an innovative product mix; and a strongcustomer base. While staffing is an important aspect of our business, our strategy is focused on providing both theskilled employees our customers need and high-value workforce management solutions.
Customer demand for employment services is dependent on the overall strength of the labor market and secular trendstoward greater workforce flexibility within each of the countries in which we operate. Improving economic growth typicallyresults in increasing demand for labor, resulting in greater demand for our services. Correspondingly, during periods ofweak economic growth or economic contraction, the demand for our staffing services typically declines, while demandfor our career transition services accelerates.
M A N A G E M E N T ’ S D I S C U S S I O N A N D A N A L Y S I So f f i n a n c i a l c o n d i t i o n a n d r e s u l t s o f o p e r a t i o n s
2,041.1 United States5,226.7 France5,084.3 EMEA
340.6 Jef ferson Wel ls431.1 Right
1,806.2 Other Operat ions
R E V E N U E S F R O M S E R V I C E Sin millions ($)
O P E R AT I N G U N I T P R O F I Tin millions ($)
49.3 United States178.8 France115.1 EMEA51.4 Jef ferson Wel ls24.5 Right46.0 Other Operat ions

2004 Annua l Repo r t M A N P O W E R I N C .40
During the last several years, secular trends toward greater workforce flexibility have had a favorable impact on demandfor our services in several markets. As companies attempt to increase the variability of their cost base, contemporarywork solutions help them to effectively address the fluctuating demand for their products or services. Due to our industry’sdependence on economic factors, the inherent difficulty in forecasting the direction and strength of the economy andthe short-term nature of staffing assignments, it is difficult to forecast future demand for our services with any certainty.As a result, we monitor a number of economic indicators, as well as recent business trends, to predict future revenuegrowth trends. Based upon these anticipated trends, we determine whether additional personnel and office investmentsare necessary to take full advantage of growth opportunities.
Our staffing business is organized and managed primarily on a geographic basis, and Jefferson Wells and Right areoperated as separate global business units. Each country and business unit primarily has its own distinct operations,and is managed locally by its own management team. Each operation reports directly, or indirectly, through a regionalmanager to a member of executive management. Given this reporting structure, all of our operations have been seg-regated into the following segments: United States; France; EMEA (Europe, Middle East and Africa, excluding France);Jefferson Wells; Right; and Other Operations.
The United States, France, EMEA, and Other Operations segments derive a significant majority of their revenues fromthe placement of temporary workers. The remaining revenues within these segments are derived from other humanresource services, including permanent employee recruitment, temporary and permanent employee testing, selection,and training and development. Jefferson Wells’ revenues are derived from internal audit and control services, technologyrisk management, tax, finance and accounting services. The Right segment revenues are derived from career transition(outplacement) services and organizational-performance consulting. Segment revenues represent sales to externalcustomers. Due to the nature of our business, we do not have export or intersegment sales. We provide services to awide variety of customers, none of which individually comprise a significant portion of revenue for us as a whole and bysegment, except for Jefferson Wells, in which approximately 19% of Jefferson Wells’ revenues for 2004 were generatedfrom providing services to one customer.
C O N S T A N T C U R R E N C Y
Changes in our revenues and operating profits include the impact of changes in foreign currency exchange rates andacquisitions and dispositions. We provide “constant currency” and “organic constant currency” calculations in thisannual report to remove the impact of these items. We typically express year-over-year variances that are calculated inconstant currency and organic constant currency as a percentage.
When we use the term “constant currency,” it means that we have translated financial data for a period into U.S.Dollars using the same foreign currency exchange rates that we used to translate financial data for the previous period.We believe that this calculation is a useful measure, indicating the actual growth of our operations. Earnings from oursubsidiaries are not generally repatriated to the United States, and we typically do not incur significant gains or losseson foreign currency transactions with our subsidiaries. Therefore, changes in foreign currency exchange rates primarilyimpact only reported earnings and not our actual cash flow or economic condition.
When we use the term “organic constant currency,” it means that we have further removed the impact of acquisitionsin the current period and dispositions from the prior period from our constant currency calculation. We believe that thiscalculation is useful because it allows us to show the actual growth of our pre-existing business.
Constant currency and organic constant currency percent variances, along with a reconciliation of these amounts tocertain of our reported results, are included on page 90.
M A N A G E M E N T ’ S D I S C U S S I O N A N D A N A L Y S I So f f i n a n c i a l c o n d i t i o n a n d r e s u l t s o f o p e r a t i o n s

M A N P O W E R I N C . 2004 Annua l Repo r t41
R E S U LT S O F O P E R A T I O N S – Y E A R S E N D E D D E C E M B E R 3 1 , 2 0 0 4 , 2 0 0 3 A N D 2 0 0 2
Consol idated Resul ts – 2004 compared to 2003
Revenues from Services increased 22.5% to $14.9 billion. Revenues were favorably impacted by changes in foreigncurrency exchange rates during the period due to the weakening of the U.S. Dollar relative to the currencies in mostof our non-U.S. markets. In constant currency, revenues increased 14.1%. Revenues were also favorably impacted byacquisitions, primarily the acquisition of Right Management Consultants, Inc. (“RMC”). Revenues increased 19.2%excluding acquisitions or 10.9% on an organic constant currency basis. This growth rate is a result of improving economicconditions and increased demand for our services in all of our major markets, particularly EMEA and Jefferson Wells,where revenues increased 18.0% and 149.6% respectively, on a constant currency basis.
Gross Profit increased 30.5% to $2.8 billion in 2004. The Gross Profit Margin increased 120 basis points (1.2%) to18.7% in 2004 from 17.5% in 2003. Gross Profit growth from acquisitions, primarily from RMC, was approximately$220 million, which favorably impacted the Gross Profit Margin by 100 basis points (1.0%). Excluding acquisitions,Gross Profit Margin was 17.7% in 2004, an increase of 20 basis points (0.2%) over the Gross Profit Margin of 17.5%in 2003. This improvement is a result of the change in the mix of services provided, toward those with higher GrossProfit Margins. Approximately one-half of this improvement is due to the relatively higher growth at Jefferson Wells,with the remaining improvement a result of an increase in our permanent placement business, particularly in the EMEA andthe Other Operations segments. While we saw Gross Profit Margin improvement in our temporary staffing business inseveral markets, this improvement was offset by decreases in others due to increased social costs, including increasedU.S. workers’ compensation costs and state unemployment taxes.
Selling and Administrative Expenses increased 27.3% during 2004 or 19.1% in constant currency. This increase isprimarily in response to the increase in business volume and the impact of acquisitions, including the intangible assetamortization of $12.3 million in 2004 resulting from the RMC acquisition. Excluding the impact of acquisitions, theseexpenses increased 16.6%, or 8.9% on an organic constant currency basis. As a percent of revenues, Selling andAdministrative Expenses were 16.0% in 2004 compared to 15.4% in 2003. This ratio is impacted by the acquisition ofRMC, because RMC has a different cost structure than our existing business. Excluding acquisitions, Selling andAdministrative Expenses were 15.1% of revenues in 2004, an improvement of 30 basis points (.3%) from 2003. Thisimprovement reflects continued productivity gains in conjunction with the revenue growth, as we were able to leverageour office network.
Operating Profit increased 53.5% over 2003, with an Operating Profit Margin of 2.7% in 2004 compared to 2.1% in2003. On a constant currency basis, Operating Profit increased 43.0%. Excluding the impact of acquisitions, OperatingProfit increased 46.0%, or 35.7% on an organic constant currency basis in 2004. Operating Profit Margin, excludingacquisitions, improved to 2.6% in 2004 compared to 2.1% in 2003. This improvement in Operating Profit Margin is dueto the increase in Gross Profit Margin coupled with the productivity gains.
Interest and Other Expense is comprised of interest, foreign exchange gains and losses, and other miscellaneous non-operating income and expenses. In total, Interest and Other Expenses decreased $9.5 million in 2004 from 2003. NetInterest Expense was $36.0 million in 2004 compared to $33.4 million in 2003. This increase is primarily due toincreased interest rates and the impact of higher exchange rates on our euro-denominated interest expense, offset byhigher interest income. Foreign exchange gains and losses primarily result from intercompany transactions between ourforeign subsidiaries and the United States. Such gains were $1.6 million and $1.3 million in 2004 and 2003, respectively.
Miscellaneous Income (Expense), Net, was income of $8.1 million in 2004 compared to expense of $3.7 million in 2003.The income in 2004 includes non-operating gains of $14.2 million ($0.11 per diluted share), primarily related to the sale ofour equity interest in a European internet job board during the first quarter of 2004. Net proceeds from this transactionwere $29.8 million.
M A N A G E M E N T ’ S D I S C U S S I O N A N D A N A L Y S I So f f i n a n c i a l c o n d i t i o n a n d r e s u l t s o f o p e r a t i o n s

2004 Annua l Repo r t M A N P O W E R I N C .42
We provided for income taxes at a rate of 33.5% in 2004 and 38.0% in 2003. Included in the 2004 rate is the impactof the non-operating gains recorded in the first quarter and the reversal of an $8.0 million tax contingency reserve inthe third quarter. Excluding these items, our rate for 2004 would have been 36.0%. This rate is higher than the U.S.Federal statutory rate of 35% due to higher foreign income tax rates and $9.5 million of taxes recorded on the unremittedearnings of foreign subsidiaries, offset by the tax benefits, including the reversal of $16.7 million of valuation allowances,of certain internal corporate restructurings and transactions.
Net Earnings Per Share – Diluted increased 53.3% to $2.59 in 2004 compared to $1.69 in 2003. In constant currency,Net Earnings Per Share – Diluted increased 45.0%. The higher foreign currency exchange rates positively impacted NetEarnings Per Share – Diluted by approximately $0.14 in 2004. On an undiluted basis, Net Earnings Per Share was $2.76in 2004 compared to $1.77 in 2003.
During September 2004, the Emerging Issues Task Force (“EITF”) issued Issue No. 04-8, “The Effect of ContingentlyConvertible Debt on Diluted Earnings Per Share”(“EITF 04-8”), which requires the effect of contingently convertibledebt securities with a market price trigger to be included in the calculation of diluted earnings per share, using the “if-converted” method, regardless of whether the market price trigger has been met. EITF 04-8 also requires restatementof previously reported earnings. Our convertible debentures, issued August 2001, have such a feature, and thereforewe have restated Net Earnings Per Share – Diluted for all periods since the issuance. (See note 3 to the consolidatedfinancial statements for further information.)
Consol idated Resul ts – 2003 compared to 2002
Revenues from Services increased 14.8% to $12.2 billion. Revenues were favorably impacted during the year bychanges in foreign currency exchange rates due to the weakening of the U.S. Dollar relative to the currencies in most ofour non-U.S. markets. In constant currency, revenues increased 2.2%. Revenue growth in 2003 attributable to acquisitionswas approximately $21.3 million or 0.2% of revenue. On an organic constant currency basis, revenues increased by2.0%. This growth rate is a result of increased activity in the Other Operations segment with stable revenue levels in theother markets.
Gross Profit increased 11.9% to $2.1 billion during 2003. The Gross Profit Margin declined 50 basis points (.5%) to17.5% in 2003 from 18.0% in 2002. This decrease was attributable to higher payroll taxes and social costs, increasedpricing pressures throughout the world, changes in the service mix of business (from higher margin service lines tolower margin service lines) and changes in the geographical mix of business (as revenue growth in countries with lowerGross Profit Margins, such as France, was higher than in some countries with higher Gross Profit Margins). GrossProfit growth from acquisitions was approximately $2.5 million and had an insignificant impact on Gross Profit Margin.
Selling and Administrative Expenses increased 12.1% during 2003. This increase is primarily due to the changes inexchange rates, as these expenses increased only 0.6% on a constant currency basis. As a percent of revenues,Selling and Administrative Expenses were 15.4% in 2003 compared to 15.8% in 2002. This improvement is a result ofcontinued productivity gains and careful expense management in conjunction with growing revenues.
Operating Profit increased 9.9% during 2003, however on a constant currency basis, Operating Profit declined 6.6%.The Operating Profit Margin was 2.1% compared to 2.2% for 2002. The Operating Profit level primarily reflects theimproved leveraging of the business offset by the Gross Profit Margin declines. Acquisitions made during 2003decreased Operating Profit by approximately $0.2 million. Excluding the impact of acquisitions, Operating Profitincreased 9.8% during 2003, however on an organic constant currency basis, Operating Profit decreased 6.6%.Acquisitions had no impact on Operating Profit Margin in 2003.
Interest and Other Expense is comprised of interest, foreign exchange gains and losses, and other miscellaneous non-operating income and expenses. In total, Interest and Other Expense decreased $11.0 million from 2002 to 2003. Netinterest expense was $33.4 million in 2003 and 2002. Average borrowing levels were lower throughout 2003 compared
M A N A G E M E N T ’ S D I S C U S S I O N A N D A N A L Y S I So f f i n a n c i a l c o n d i t i o n a n d r e s u l t s o f o p e r a t i o n s
M A N P O W E R I N C . 2004 Annua l Repo r t43
to 2002, however the impact of this was offset by our Euro-denominated interest expense which was translated at higherrates in 2003. Foreign exchange gains and losses primarily result from intercompany transactions between our foreignsubsidiaries and the United States. Such gains were $1.3 million and $1.8 million in 2003 and 2002, respectively.
Miscellaneous Expenses, Net, were $3.7 million in 2003 compared to $15.2 million in 2002. In the fourth quarter of2002, we recorded a charge of $5.1 million ($2.9 million net of tax, or $0.04 per share) related to a writedown of equitysecurity investments where the decline in market value was determined to be other-than-temporary, as defined byStatement of Financial Accounting Standards (“SFAS”) No. 115, “Accounting for Certain Debt and Equity Securities.”
We provided for income taxes at a rate of 38.0% in 2003. This rate is higher than the U.S. Federal statutory rate of35% due primarily to the impact of higher foreign income tax rates and valuation reserves recorded against foreign netoperating losses. This rate is lower than the 2002 effective tax rate of 39.8% due to an increase in the foreign tax creditsused to offset the U.S. taxes on foreign earnings, offset somewhat by a shift in the mix of taxable income toward countrieswith relatively higher tax rates.
Net Earnings Per Share – Diluted increased 19.0% to $1.69 in 2003 compared to $1.42 in 2002. Net Earnings PerShare – Diluted in 2003 was positively impacted by the higher foreign currency exchange rates during the year. In constantcurrency, 2003 Net Earnings Per Share – Diluted would have been $1.42, the same as 2002. On an undiluted basis,Net Earnings Per Share was $1.77 in 2003 compared to $1.48 in 2002.
Segment Resul ts
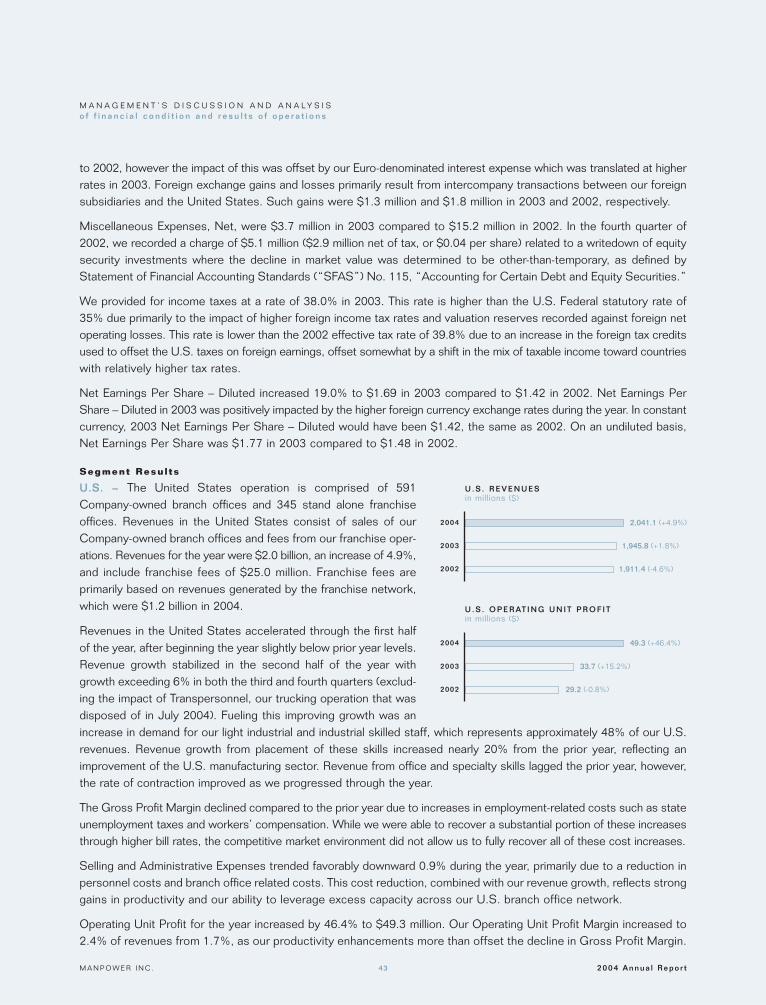
U.S. – The United States operation is comprised of 591Company-owned branch offices and 345 stand alone franchiseoffices. Revenues in the United States consist of sales of ourCompany-owned branch offices and fees from our franchise oper-ations. Revenues for the year were $2.0 billion, an increase of 4.9%,and include franchise fees of $25.0 million. Franchise fees areprimarily based on revenues generated by the franchise network,which were $1.2 billion in 2004.
Revenues in the United States accelerated through the first halfof the year, after beginning the year slightly below prior year levels.Revenue growth stabilized in the second half of the year withgrowth exceeding 6% in both the third and fourth quarters (exclud-ing the impact of Transpersonnel, our trucking operation that wasdisposed of in July 2004). Fueling this improving growth was anincrease in demand for our light industrial and industrial skilled staff, which represents approximately 48% of our U.S.revenues. Revenue growth from placement of these skills increased nearly 20% from the prior year, reflecting animprovement of the U.S. manufacturing sector. Revenue from office and specialty skills lagged the prior year, however,the rate of contraction improved as we progressed through the year.
The Gross Profit Margin declined compared to the prior year due to increases in employment-related costs such as stateunemployment taxes and workers’ compensation. While we were able to recover a substantial portion of these increasesthrough higher bill rates, the competitive market environment did not allow us to fully recover all of these cost increases.
Selling and Administrative Expenses trended favorably downward 0.9% during the year, primarily due to a reduction inpersonnel costs and branch office related costs. This cost reduction, combined with our revenue growth, reflects stronggains in productivity and our ability to leverage excess capacity across our U.S. branch office network.
Operating Unit Profit for the year increased by 46.4% to $49.3 million. Our Operating Unit Profit Margin increased to2.4% of revenues from 1.7%, as our productivity enhancements more than offset the decline in Gross Profit Margin.
M A N A G E M E N T ’ S D I S C U S S I O N A N D A N A L Y S I So f f i n a n c i a l c o n d i t i o n a n d r e s u l t s o f o p e r a t i o n s
2002
2003
2004
1,911.4 (-4.6%)
1,945.8 (+1.8%)
2,041.1 (+4.9%)
U . S . R E V E N U E Sin millions ($)
2002
2003
2004
29.2 (-0.8%)
33.7 (+15.2%)
49.3 (+46.4%)
U . S . O P E R AT I N G U N I T P R O F I Tin millions ($)

2004 Annua l Repo r t M A N P O W E R I N C .44
France – Revenues in France increased 12.7% to $5.2 billion. InEuros, French Revenues increased 2.8% to €4.2 billion. Themajority of this revenue increase reflects hourly rate increases asvolumes increased only slightly during the year. Revenue growthin Euro was modest in the first half of the year, growing by 2.7%,followed by softening in the third quarter to 1.0% and then accel-erating to 4.9% in the fourth quarter of the year.
Gross Profit Margins declined compared to the prior year, evenafter excluding adjustments to our estimated liability related tosocial program remittances in each year. (In 2004, there was anunfavorable adjustment of $12.8 million, and in 2003, there was a$16.1 million favorable adjustment.) This decline reflects increasingprice competition from large and small competitors, partially dueto their expansion of office network capacity during a period ofnominal growth in the total staffing market.
Selling and Administrative Expenses were well controlled during the year, decreasing slightly from 2003 despite continuedinvestment in new offices. A total of 49 new offices were opened during the year, bringing the total office count to 1,127.
Operating Unit Profit was $178.8 million, a decrease of 2.8% from the prior year. Operating Unit Profit Margin was3.4%, a decrease from 3.9% in 2003. Operating Unit Profit was unfavorably impacted by the adjustment for socialprogram remittances in 2004, and favorably impacted by the adjustments in 2003, as discussed above.
During 2004, a new law in France ended the French Job Center’s (ANPE’s) control of the placement of the unemployed.As a result of this law change, temporary staffing companies are allowed to offer placement and recruitment servicesbeginning January 1, 2005. We expect these services will have a long-term benefit on our French business, but will nothave a significant impact on 2005 results due to investments required to grow this service line.
EMEA – The EMEA region includes our operations in Europe, theMiddle East and Africa (excluding France), which covers a total of18 countries delivering services through 1,400 offices. In additionto employment services delivered under the Manpower brand, thisregion also includes Elan, which is a leading IT recruitment, staffingand managed services firm operating across 16 countries in theregion, and Brook Street, which provides general staffing andrecruitment services primarily in the United Kingdom.
Geographically, the largest operations in this segment are the U.K.,which comprises 27% of EMEA revenues, Germany, Italy, theNetherlands, Norway, Spain and Sweden, which combined comprise52% of EMEA revenues. Elan comprises 11% of EMEA revenues.
M A N A G E M E N T ’ S D I S C U S S I O N A N D A N A L Y S I So f f i n a n c i a l c o n d i t i o n a n d r e s u l t s o f o p e r a t i o n s
2002
2003
2004
3.848.2 (+2.2%)
4,638.8 (+20.5%)
5,226.7 (+12.7%)
F R A N C E R E V E N U E Sin millions ($)
2002
2003
2004
143.6 (+5.8%)
184.0 (+28.2%)
178.8 (-2.8%)
F R A N C E O P E R AT I N G U N I T P R O F I Tin millions ($)
2002
2003
2004
3,434.9 (+.2%)
3,920.2 (+14.1%)
5,084.3 (+29.7%)
E M E A R E V E N U E Sin millions ($)
2002
2003
2004
83.0 (-21.6%)
51.7 (-37.7%)
115.1 (+122.4%)
E M E A O P E R AT I N G U N I T P R O F I Tin millions ($)

M A N P O W E R I N C . 2004 Annua l Repo r t45
Revenues in EMEA increased 29.7% to $5.1 billion, or 18.0% in constant currency. Constant currency revenue growthaccelerated in the first half of the year and stabilized at 20% for the second half of the year. Fueling this strong revenuegrowth were investments in new offices, implementation of effective sales initiatives and positive secular trends in theusage of flexible staffing services. Revenue growth improved at all entities in the region, with significant local currencygrowth coming from Belgium (+27.3%), Elan (+24.6%), Italy (+18.9%) and Germany (+17.4%).
The Gross Profit Margin for the full year was slightly below the prior year, but was stable with the prior year in the secondhalf of the year. The decline in Gross Profit Margin is due to competitive pricing pressure in certain markets and changingbusiness mix, partially offset by the favorable impact of growth in permanent placement fees.
Selling and Administrative Expenses increased 22.3%, or 11.4% in constant currency. This growth in expenses reflectsthe necessary investments to support the rapid revenue growth. Additionally, we were able to achieve significantproductivity gains, as we were able to leverage our existing office infrastructure.
Operating Unit Profit more than doubled to $115.1 million, an increase of 122.4%, or 104.1% in constant currency. TheOperating Unit Profit Margin increased to 2.3% from 1.3%, reflecting the significant productivity gains.
Jefferson Wells – Jefferson Wells provides highly skilled projectpersonnel along three primary business lines – internal audit andcontrols, technology risk management, tax and finance andaccounting compliance. Our services are provided through 37offices, which include major United States metropolitan markets,Toronto and London. The majority of employees assigned byJefferson Wells are full-time company employees and thereforeemployee utilization is a significant factor in determining GrossProfit Margins.
Revenues increased dramatically during the year, to $340.6million from $136.4 million in 2003. This significant growth wasprimarily fueled by increased customer demand for technologyrisk management and internal audit and control services. Includedin these services are personnel who assist companies in complyingwith the Sarbanes-Oxley Act legislation.
Revenue trends grew sequentially throughout the year, and reached their peak levels in October. Revenues in the fourthquarter were $102.9 million, down 7.0% sequentially from the third quarter of 2004. This decline, which may continueinto 2005, reflects a lower level of demand for our services as companies complete the initial stages of Sarbanes-Oxleycompliance.
Gross Profit Margins have improved by more than 650 basis points (6.5%) over the prior year and are in excess of 40%for 2004. This improvement primarily reflects the improved utilization of employees assigned to customer engagements.
Selling and Administrative Expenses increased by 56.7% as we continued to invest in new office openings and additionalpersonnel to support the rapid revenue growth. As a percentage of revenues, these expenses declined dramatically aswe were able to grow into office capacity, in which we had invested in previous years.
Operating Unit Profit was $51.4 million or 15.1% of revenue, reflecting the high employee utilization levels and expenseleveraging discussed earlier.
M A N A G E M E N T ’ S D I S C U S S I O N A N D A N A L Y S I So f f i n a n c i a l c o n d i t i o n a n d r e s u l t s o f o p e r a t i o n s
2002
2003
2004
141.7 (+105.5%)
136.4 (-3.7%)
340.6 (+149.6%)
J E F F E R S O N W E L L S R E V E N U E Sin millions ($)
2002
2003
2004
(8.3)
(9.9)
51.4
J E F F E R S O N W E L L SO P E R AT I N G U N I T P R O F I Tin millions ($)
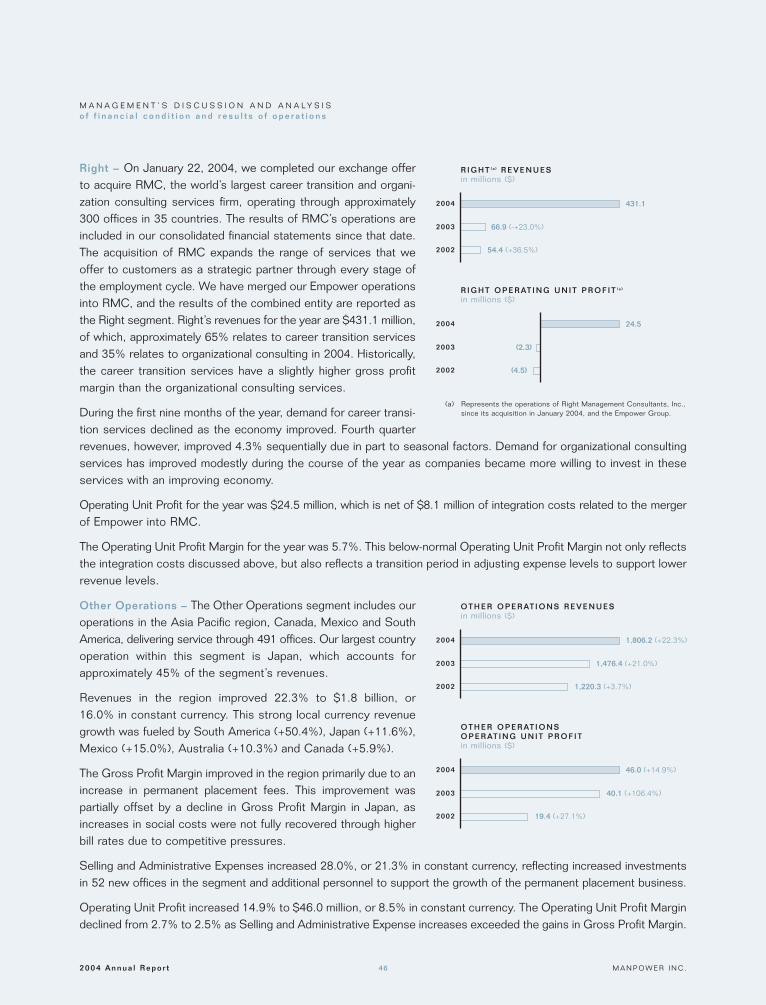
2004 Annua l Repo r t M A N P O W E R I N C .46
Right – On January 22, 2004, we completed our exchange offerto acquire RMC, the world’s largest career transition and organi-zation consulting services firm, operating through approximately300 offices in 35 countries. The results of RMC’s operations areincluded in our consolidated financial statements since that date.The acquisition of RMC expands the range of services that weoffer to customers as a strategic partner through every stage ofthe employment cycle. We have merged our Empower operationsinto RMC, and the results of the combined entity are reported asthe Right segment. Right’s revenues for the year are $431.1 million,of which, approximately 65% relates to career transition servicesand 35% relates to organizational consulting in 2004. Historically,the career transition services have a slightly higher gross profitmargin than the organizational consulting services.
During the first nine months of the year, demand for career transi-tion services declined as the economy improved. Fourth quarterrevenues, however, improved 4.3% sequentially due in part to seasonal factors. Demand for organizational consultingservices has improved modestly during the course of the year as companies became more willing to invest in theseservices with an improving economy.
Operating Unit Profit for the year was $24.5 million, which is net of $8.1 million of integration costs related to the mergerof Empower into RMC.
The Operating Unit Profit Margin for the year was 5.7%. This below-normal Operating Unit Profit Margin not only reflectsthe integration costs discussed above, but also reflects a transition period in adjusting expense levels to support lowerrevenue levels.
Other Operations – The Other Operations segment includes ouroperations in the Asia Pacific region, Canada, Mexico and SouthAmerica, delivering service through 491 offices. Our largest countryoperation within this segment is Japan, which accounts forapproximately 45% of the segment’s revenues.
Revenues in the region improved 22.3% to $1.8 billion, or16.0% in constant currency. This strong local currency revenuegrowth was fueled by South America (+50.4%), Japan (+11.6%),Mexico (+15.0%), Australia (+10.3%) and Canada (+5.9%).
The Gross Profit Margin improved in the region primarily due to anincrease in permanent placement fees. This improvement waspartially offset by a decline in Gross Profit Margin in Japan, asincreases in social costs were not fully recovered through higherbill rates due to competitive pressures.
Selling and Administrative Expenses increased 28.0%, or 21.3% in constant currency, reflecting increased investmentsin 52 new offices in the segment and additional personnel to support the growth of the permanent placement business.
Operating Unit Profit increased 14.9% to $46.0 million, or 8.5% in constant currency. The Operating Unit Profit Margindeclined from 2.7% to 2.5% as Selling and Administrative Expense increases exceeded the gains in Gross Profit Margin.
M A N A G E M E N T ’ S D I S C U S S I O N A N D A N A L Y S I So f f i n a n c i a l c o n d i t i o n a n d r e s u l t s o f o p e r a t i o n s
2002
2003
2004
54.4 (+36.5%)
66.9 (-+23.0%)
431.1
R I G H T ( a ) R E V E N U E Sin millions ($)
2002
2003
2004
(4.5)
(2.3)
24.5
R I G H T O P E R AT I N G U N I T P R O F I T ( a )
in millions ($)
2002
2003
2004
1,220.3 (+3.7%)
1,476.4 (+21.0%)
1,806.2 (+22.3%)
O T H E R O P E R AT I O N S R E V E N U E Sin millions ($)
2002
2003
2004
19.4 (+27.1%)
40.1 (+106.4%)
46.0 (+14.9%)
O T H E R O P E R AT I O N S O P E R AT I N G U N I T P R O F I Tin millions ($)
(a) Represents the operations of Right Management Consultants, Inc.,since its acquisition in January 2004, and the Empower Group.

M A N P O W E R I N C . 2004 Annua l Repo r t47
C A S H S O U R C E S A N D U S E S
Cash used to fund our operations is primarily generated through operating activities and our existing credit facilities.We believe that our internally generated funds and our existing credit facilities are sufficient to cover our near-termprojected cash needs.
Our principal ongoing cash needs are to finance working capital, capital expenditures, share repurchases, debt payments,and acquisitions. Working capital is primarily in the form of trade receivables, which generally increase as revenuesincrease. The amount of financing necessary to support revenue growth depends on receivable turnover, which differsin each market in which we operate.
During 2004, cash provided by operating activities was $187.4 million, compared to $223.4 million for 2003 and $227.9million for 2002. The strong results reflect the impact of our focus on working capital management over the past fewyears. The change in 2004 from 2003 is due primarily to the higher working capital requirements to fund the growth inour business, offset by the higher earnings level in 2004.
Accounts receivable increased to $3,227.8 million as of December 31, 2004 from $2,600.9 million as of December 31,2003. This increase is primarily due to increased business volumes, the acquisition of RMC, and changes in foreigncurrency exchange rates. At constant exchange rates, the 2004 Accounts Receivable balance would have been approx-imately $190 million less than reported. Days Sales Outstanding (“DSO”) has remained relatively stable during 2004,and has decreased one day since 2002. However, this calculation is impacted by the effect of exchange rates on our mixof accounts receivable by country. Excluding that impact, we have reduced DSO by approximately two days comparedto 2002.
One of our wholly-owned U.S. subsidiaries has an agreement to transfer, on an ongoing basis, up to $200.0 million ofan interest in its Accounts Receivable. The terms of this agreement are such that transfers do not qualify as a sale ofaccounts receivable. Accordingly, any advances under this agreement are reflected as debt on the consolidated balancesheets. Prior to an amendment to the agreement in November 2002, transfers of accounts receivable qualified as asale and the related amount of accounts receivable was removed from our consolidated balance sheets. In July 2004,we amended the agreement to extend it to July 2005. All other terms remain substantially unchanged. No amountswere advanced under this facility as of December 31, 2004 and 2003.
Capital expenditures were $67.9 million, $55.5 million, and $58.5 million during 2004, 2003 and 2002, respectively.These expenditures are primarily comprised of purchases of computer equipment, office furniture and other costs relatedto office openings and refurbishments, as well as capitalized software costs of $2.7 million, $8.2 million, and $17.7 millionin 2004, 2003,and 2002, respectively.
From time to time, we acquire and invest in companies throughout the world, including U.S. franchises. The total cashconsideration for such transactions was $117.3 million, $6.7 million, and $33.5 million in 2004, 2003 and 2002,respectively. The 2004 amount includes the payment of acquisition-related costs and the $123.8 million repayment ofRMC’s long-term debt that we were required to make due to change of control provisions contained in the agreements.We financed the acquisition-related costs and this repayment with excess cash and borrowings under our U.S.Receivables Facility, which was repaid in 2004. Cash acquired of approximately $39.5 million offsets these payments.In 2003 and 2002, in addition to the cash consideration, we acquired ownership interests in certain U.S. franchises inexchange for approximately 13,000 and 592,000 shares of our common stock, respectively, which had an aggregatemarket value of $0.7 million and $21.9 million, respectively, at the dates of acquisition.
M A N A G E M E N T ’ S D I S C U S S I O N A N D A N A L Y S I So f f i n a n c i a l c o n d i t i o n a n d r e s u l t s o f o p e r a t i o n s
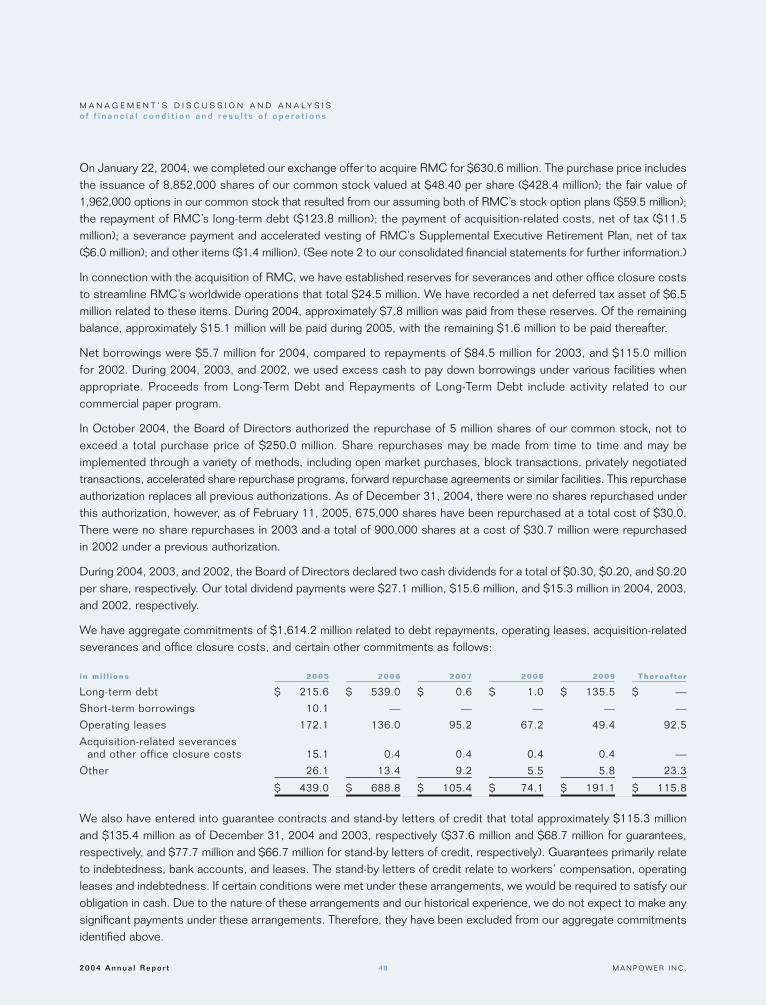
2004 Annua l Repo r t M A N P O W E R I N C .48
On January 22, 2004, we completed our exchange offer to acquire RMC for $630.6 million. The purchase price includesthe issuance of 8,852,000 shares of our common stock valued at $48.40 per share ($428.4 million); the fair value of1,962,000 options in our common stock that resulted from our assuming both of RMC’s stock option plans ($59.5 million);the repayment of RMC’s long-term debt ($123.8 million); the payment of acquisition-related costs, net of tax ($11.5million); a severance payment and accelerated vesting of RMC’s Supplemental Executive Retirement Plan, net of tax($6.0 million); and other items ($1.4 million). (See note 2 to our consolidated financial statements for further information.)
In connection with the acquisition of RMC, we have established reserves for severances and other office closure coststo streamline RMC’s worldwide operations that total $24.5 million. We have recorded a net deferred tax asset of $6.5million related to these items. During 2004, approximately $7.8 million was paid from these reserves. Of the remainingbalance, approximately $15.1 million will be paid during 2005, with the remaining $1.6 million to be paid thereafter.
Net borrowings were $5.7 million for 2004, compared to repayments of $84.5 million for 2003, and $115.0 millionfor 2002. During 2004, 2003, and 2002, we used excess cash to pay down borrowings under various facilities whenappropriate. Proceeds from Long-Term Debt and Repayments of Long-Term Debt include activity related to ourcommercial paper program.
In October 2004, the Board of Directors authorized the repurchase of 5 million shares of our common stock, not toexceed a total purchase price of $250.0 million. Share repurchases may be made from time to time and may beimplemented through a variety of methods, including open market purchases, block transactions, privately negotiatedtransactions, accelerated share repurchase programs, forward repurchase agreements or similar facilities. This repurchaseauthorization replaces all previous authorizations. As of December 31, 2004, there were no shares repurchased underthis authorization, however, as of February 11, 2005, 675,000 shares have been repurchased at a total cost of $30.0.There were no share repurchases in 2003 and a total of 900,000 shares at a cost of $30.7 million were repurchasedin 2002 under a previous authorization.
During 2004, 2003, and 2002, the Board of Directors declared two cash dividends for a total of $0.30, $0.20, and $0.20per share, respectively. Our total dividend payments were $27.1 million, $15.6 million, and $15.3 million in 2004, 2003,and 2002, respectively.
We have aggregate commitments of $1,614.2 million related to debt repayments, operating leases, acquisition-relatedseverances and office closure costs, and certain other commitments as follows:
in mi l l ions 2005 2006 2007 2008 2009 Thereaf ter
Long-term debt $ 215.6 $ 539.0 $ 0.6 $ 1.0 $ 135.5 $ —
Short-term borrowings 10.1 — — — — —
Operating leases 172.1 136.0 95.2 67.2 49.4 92.5
Acquisition-related severancesand other office closure costs 15.1 0.4 0.4 0.4 0.4 —
Other 26.1 13.4 9.2 5.5 5.8 23.3
$ 439.0 $ 688.8 $ 105.4 $ 74.1 $ 191.1 $ 115.8
We also have entered into guarantee contracts and stand-by letters of credit that total approximately $115.3 millionand $135.4 million as of December 31, 2004 and 2003, respectively ($37.6 million and $68.7 million for guarantees,respectively, and $77.7 million and $66.7 million for stand-by letters of credit, respectively). Guarantees primarily relateto indebtedness, bank accounts, and leases. The stand-by letters of credit relate to workers’ compensation, operatingleases and indebtedness. If certain conditions were met under these arrangements, we would be required to satisfy ourobligation in cash. Due to the nature of these arrangements and our historical experience, we do not expect to make anysignificant payments under these arrangements. Therefore, they have been excluded from our aggregate commitmentsidentified above.
M A N A G E M E N T ’ S D I S C U S S I O N A N D A N A L Y S I So f f i n a n c i a l c o n d i t i o n a n d r e s u l t s o f o p e r a t i o n s

M A N P O W E R I N C . 2004 Annua l Repo r t49
C A P I T A L R E S O U R C E S
Total capitalization as of December 31, 2004 was $3,075.8 million,comprised of $901.8 million in debt and $2,174.0 million in equity.Debt as a percentage of total capitalization was 29% as ofDecember 31, 2004 compared to 39% as of December 31, 2003.This decrease is primarily a result of the equity issued in connectionwith the acquisition of RMC.
We have $435.4 million in aggregate principal amount at maturity ofunsecured zero-coupon convertible debentures, due August 17,2021 (“Debentures”), with a carrying value of $265.3 million as ofDecember 31, 2004. These Debentures were issued in August 2001 at a discount to yield an effective interest rate of3% per year, and they rank equally with all of our existing and future senior unsecured indebtedness. There are noscheduled cash interest payments associated with the Debentures.
The Debentures are convertible into 6.1 million shares of our common stock if the closing price of our common stockon the New York Stock Exchange exceeds specified levels, or in certain other circumstances.
Holders of the Debentures may require us to purchase these Debentures at the issue price, plus accreted original issuediscount, on the first, third, fifth, tenth and fifteenth anniversary dates. We have the option to settle this obligation incash, common stock, or a combination thereof. There were no Debentures “put” to us on the first anniversary date.On the third anniversary date, $0.1 million of principal amount at maturity of the Debentures was tendered for repurchase,resulting in a payment of approximately $0.1 million. Our intent is to settle any future “put” in cash. In the event of asignificant change in the economic environment, we may choose to settle a future “put” with common stock, whichwould have a dilutive effect on existing shareholders. As of August 17, 2004, we may also now “call” the Debentures.
We have €150.0 million in unsecured notes due March 2005, at 6.25%, and €200.0 million in unsecured notes dueJuly 2006, at 5.63%. We plan to repay the €150.0 million notes with cash or other available borrowing facilities whenthey come due. (See Significant Matters Affecting Results of Operations and notes 7 and 13 to the consolidated financialstatements for further information.)
In October 2004, we entered into a new $625.0 million revolving credit agreement with a syndicate of commercial banksthat expires in October 2009. The new agreement replaces our $450.0 million five-year revolving credit facility and $200.0million 364-day revolving credit facility. Amounts borrowed under the $450.0 million five-year facility were transferredto this new facility.
The new revolving credit agreement allows for borrowings in various currencies and up to $150.0 million may be usedfor the issuance of stand-by letters of credit. Outstanding letters of credit totaled $77.7 million and $66.7 million as ofDecember 31, 2004 and 2003, respectively. Additional borrowings of $411.8 million were available to us under this newrevolving credit agreement as of December 31, 2004.
The interest rate and facility fee on the new agreement, as well as the fee paid for the issuance of letters of credit onthe facility, vary based on our public debt ratings and borrowing level. The current interest rate is LIBOR plus .675% andthe facility and issuance fees are .20% and .675%, respectively.
M A N A G E M E N T ’ S D I S C U S S I O N A N D A N A L Y S I So f f i n a n c i a l c o n d i t i o n a n d r e s u l t s o f o p e r a t i o n s
2000
2001
2002
740.4 557.5
814.3 834.8
999.9 821.8
1,310.3 841.7
2,174.0 901.8
T O TA L C A P I TA L I Z AT I O Nin millions ($)
2003
2004
equity debt

2004 Annua l Repo r t M A N P O W E R I N C .50
The new agreement requires, among other things, that we comply with a Debt-to-EBITDA ratio of less than 3.25 to 1and a fixed charge ratio of greater than 2.00 to 1. As defined in the agreement, we had a Debt-to-EBITDA ratio of 1.84to 1 and a fixed charge ratio of 2.69 to 1 as of December 31, 2004. Based upon current forecasts, we expect to be incompliance with these covenants throughout the coming year.
There were no borrowings outstanding under our $125.0 million U.S. commercial paper program as of December 31,2004 and 2003.
In addition to the previously mentioned facilities, we maintain separate bank facilities with foreign financial institutions tomeet working capital needs of our foreign operations. As of December 31, 2004, such facilities totaled $295.0 million,of which $284.9 million was unused.
Our current credit rating from Moody’s Corporation is Baa3 with a stable outlook and our credit rating from Standard& Poor’s is BBB- with a stable outlook. Both of these credit ratings are investment grade.
A P P L I C A T I O N O F C R I T I C A L A C C O U N T I N G P O L I C I E S
The preparation of our financial statements in conformity with accounting principles generally accepted in the UnitedStates requires us to make estimates and assumptions that affect the reported amounts. A discussion of the moresignificant estimates follows. Management has discussed the development, selection and disclosure of these estimatesand assumptions with the Audit Committee of our Board of Directors.
Allowance for Doubtfu l Accounts
We have an Allowance for Doubtful Accounts recorded as an estimate of the Accounts Receivable balance that may notbe collected. This allowance is calculated on an entity-by-entity basis with consideration for historical write-off experience,the current aging of receivables and a specific review for potential bad debts. Items that affect this balance mainlyinclude bad debt expense and write-offs of accounts receivable balances.
Bad Debt Expense, which increases our Allowance for Doubtful Accounts, is recorded as a Selling and AdministrativeExpense and was $27.3 million, $16.7 million, and $18.2 million for 2004, 2003, and 2002, respectively. Factors thatwould cause this provision to increase primarily relate to increased bankruptcies by our customers and other difficultiescollecting amounts billed. On the other hand, an improved write-off experience and aging of receivables would result ina decrease to the provision.
Write-offs, which decrease our Allowance for Doubtful Accounts, are recorded as a reduction to our AccountsReceivable balance and were $21.9 million, $19.5 million, and $18.4 million, for 2004, 2003 and 2002, respectively.
Employment -Related I tems
The employment of temporary workers and permanent staff throughout the world results in the recognition of liabilitiesrelated to defined benefit pension plans, self-insured workers’ compensation, social program remittances and payrolltax audit exposures that require us to make estimates and assumptions in determining the proper reserve levels.
We sponsor several qualified and non-qualified pension plans covering permanent employees. The most significant plans arelocated in the United States, France, the United Kingdom, Japan and other European countries. Annual expense relatingto these plans is recorded as Selling and Administrative Expense, in accordance with the accounting rules generallyaccepted in the United States. The calculations of annual pension expense and the pension liability required at year-endinclude various actuarial assumptions such as discount rates, expected rate of return on plan assets, compensationincreases and employee turnover rates. Changes to any of these assumptions will impact the level of annual expenserecorded related to the plans. We review the actuarial assumptions on an annual basis and make modifications to theassumptions as necessary. (See note 9 to the consolidated financial statements for further information.)
M A N A G E M E N T ’ S D I S C U S S I O N A N D A N A L Y S I So f f i n a n c i a l c o n d i t i o n a n d r e s u l t s o f o p e r a t i o n s
M A N P O W E R I N C . 2004 Annua l Repo r t51
In the United States, we are self-insured in most states for workers’ compensation claims for our temporary workers. Wedetermine the proper reserve balance using an actuarial valuation, which considers our historical payment experienceand current employee demographics. Our reserve for such claims as of December 31, 2004 and 2003 was $100.0 and$103.0 million, respectively. The workers’ compensation expense is recorded as a component of Cost of Services. Asignificant increase in claims or changes in laws may require us to record more expense related to workers’ compensation.On the other hand, significantly improved claim experience may result in a lower annual expense level.
In France, the government has various social programs that are aimed at reducing the cost of labor and encouragingemployment, particularly for low-wage workers, through the reduction of payroll taxes (or social contribution). A portion ofthese payroll tax reductions is remitted to our customers in certain circumstances. We are required to make an estimatefor the amount that will be remitted, which is recorded as a reduction of Revenue from Services. We make this estimatebased on our historical experience, including related trends. To the extent that our experience differs from our estimate,we will need to make adjustments to our reserve balance, which will impact the results of our French operation. In addition,future changes to laws governing these payroll tax reductions may require us to revise our estimates, which maysignificantly impact our consolidated financial statements. In the fourth quarter of 2003, we reduced our estimatedliability related to these remittances by $16.1 million due to the recent historical trends in the amounts remitted.
On a routine basis, governmental agencies in some of the countries in which we operate will audit our payroll taxcalculations and our compliance with other payroll-related regulations. These audits focus primarily on documentationrequirements and our support for our payroll tax remittances. Due to the nature of our business, the number of peoplethat we employ, and the complexity of some payroll tax regulations, we may have some adjustments to the payroll taxremittances as a result of these audits. We make an estimate of the additional remittances that may be required andrecord the estimate as a component of Cost of Services. The estimate is based on the results of past audits, withconsideration for changing business volumes and changes to the payroll tax regulations. To the extent that our actualexperience differs from our estimates, we will need to make adjustments to our reserve balance, which will impact theresults of the related operation and the operating segment in which it is reported.
In France, we are currently under audit for payroll tax remittances made during 2001 and for remittances made during2002 and 2003. We have received a preliminary notification related to 2001 and have responded to the notification withadditional information. During 2004, we increased our estimated liability related to these remittances by $12.8 million.
In the Netherlands, we are currently under audit for compliance with regulations related to the collection and mainte-nance of payroll-related documents for our temporary employees. We have not received any notification of findingsrelated to this audit, however we currently do not expect any assessment to have a significant impact on the consolidatedfinancial statements.
Deferred Revenue
We recognize revenue under the provisions of Staff Accounting Bulletin No. 104, “Revenue Recognition” (“SAB104”). SAB 104 generally provides that revenue for time-based services be recognized over the average length of theservices being provided. For the career transition line of business, we recognize revenue from individual programs on astraight-line basis over the average length of time for candidates to find jobs based on statistically valid data for the specifictype of program. If statistically valid data is not available, then we recognize career transition revenue on a straight-linebasis over the actual term of the agreements. For group programs and large projects within the career transition line ofbusiness, we defer and recognize revenue over the period in which the contracts are completed. The difference betweenthe amount billed for career transition services and the amount recognized as revenue is recorded as DeferredRevenue, which is included in Accrued Liabilities on our consolidated balance sheets.
M A N A G E M E N T ’ S D I S C U S S I O N A N D A N A L Y S I So f f i n a n c i a l c o n d i t i o n a n d r e s u l t s o f o p e r a t i o n s
2004 Annua l Repo r t M A N P O W E R I N C .52
Significant factors impacting Deferred Revenue are the type of programs sold, the level of current billings for newprograms and projects, and the average length of the programs. Over time, an increasing volume of new billings willgenerally result in higher amounts of Deferred Revenue, while decreasing levels of new billings will generally result inlower amounts of Deferred Revenue. As of December 31, 2004, we had $43.8 million of Deferred Revenue recorded.
Income Taxes
We account for income taxes in accordance with SFAS No. 109, “Accounting for Income Taxes.” Deferred tax assetsand liabilities are recognized for the future tax consequences attributable to differences between financial statementcarrying amounts of existing assets and liabilities and their respective tax bases, net operating loss and tax credit carry-forwards, and tax contingencies. Deferred tax assets and liabilities are measured using enacted tax rates expected toapply to taxable income in the years in which those temporary differences are expected to be recovered or settled. Werecord a valuation allowance against deferred tax assets for which utilization of the asset is not likely.
Our judgment is required in determining our deferred tax assets and liabilities, and any valuation allowances recorded.Our net deferred tax assets may need to be adjusted in the event that tax rates are modified, or our estimates of futuretaxable income change, such that deferred tax assets or liabilities are expected to be recovered or settled at a differenttax rate than currently estimated. In addition, valuation allowances may need to be adjusted in the event that our estimateof future taxable income changes from the amounts currently estimated. We have tax contingencies recorded relatedto items in various countries. To the extent these items are settled in our favor, a portion of our recorded contingencywill be reversed. To the extent items are settled for an amount greater than the amount we have recorded, an additionaltax provision will be recorded.
We provide for income taxes on a quarterly basis based on an estimated annual tax rate. In determining this rate, wemake estimates about taxable income for each of our largest locations worldwide, as well as the tax rate that will be ineffect for each location. To the extent these estimates change during the year, or that actual results differ from theseestimates, our estimated annual tax rate may change between quarterly periods and may differ from the actual effectivetax rate for the year. For 2005, we expect our effective tax rate will be approximately 36.5%.
Goodwi l l and Indef in i te - L ived Intangib le Asset Impairment
In connection with SFAS No. 142, “Goodwill and Other Intangible Assets,” we are required to perform goodwill andindefinite-lived intangible asset impairment reviews, at least annually, using a fair-value-based approach. The majority of ourgoodwill and indefinite-lived intangible assets result from our acquisition of RMC. Our remaining goodwill relates primarilyto our acquisitions of Elan and Jefferson Wells.
As part of our impairment reviews, we estimate fair value primarily by using a discounted cash flow analysis and, forcertain larger reporting units, we may also consider market comparables. Significant assumptions used in this analysisinclude: expected future revenue growth rates, operating unit profit margins, and working capital levels; a discount rate;and a terminal value multiple.
We have completed our annual impairment review for 2004 and determined there to be no impairment of either goodwill,or indefinite-lived intangible assets. We plan to perform our next annual impairment review during the third quarter of 2005.
We may be required to perform an impairment review prior to our scheduled annual review if certain events occur,including lower-than-forecasted earnings levels for various reporting units. In addition, changes to other assumptionscould significantly impact our estimate of the fair value of our reporting units. Such a change may result in an impairmentcharge, which could have a significant impact on the reportable segments that include the related reporting units andour consolidated financial statements.
M A N A G E M E N T ’ S D I S C U S S I O N A N D A N A L Y S I So f f i n a n c i a l c o n d i t i o n a n d r e s u l t s o f o p e r a t i o n s

M A N P O W E R I N C . 2004 Annua l Repo r t53
S I G N I F I C A N T M A T T E R S A F F E C T I N G R E S U LT S O F O P E R A T I O N S
Market Risks
We are exposed to the impact of foreign currency exchange rate fluctuations and interest rate changes.
Exchange Rates – Our exposure to foreign currency exchange rates relates primarily to our foreign subsidiaries andour Euro-denominated borrowings. For our foreign subsidiaries, exchange rates impact the U.S. Dollar value of ourreported earnings, our investments in the subsidiaries and the intercompany transactions with the subsidiaries.
Approximately 80% of our revenues and profits are generated outside of the United States, with approximately 50%generated from our European operations that use the Euro as their functional currency. As a result, fluctuations in thevalue of foreign currencies against the U.S. Dollar, particularly the Euro, may have a significant impact on our reportedresults. Revenues and expenses denominated in foreign currencies are translated into U.S. Dollars at the weighted-average exchange rate for the year. Consequently, as the value of the U.S. Dollar changes relative to the currencies ofour major markets, our reported results vary.
During 2004 and 2003, the U.S. Dollar weakened relative to many of the currencies of our major markets. In constantcurrency, 2004 Revenues from Services and Operating Profit were approximately 8.5% and 10.5% lower than reported,respectively. If the U.S. Dollar had weakened an additional 10% during 2004, Revenue would have further increased byapproximately 8.3% and Operating Profits would have increased by approximately 8.1%.
Fluctuations in currency exchange rates also impact the U.S. Dollar amount of our Shareholders’ Equity. The assetsand liabilities of our non-U.S. subsidiaries are translated into U.S. Dollars at the exchange rates in effect at year-end.The resulting translation adjustments are recorded in Shareholders’ Equity as a component of Accumulated OtherComprehensive Income. The U.S. Dollar weakened relative to many foreign currencies as of December 31, 2004compared to December 31, 2003. Consequently, Shareholders’ Equity increased by $86.3 million as a result of thechange in Accumulated Other Comprehensive Income during the year. If the U.S. Dollar had weakened an additional 10%during 2004, resulting translation adjustments recorded in Shareholders’ Equity would have increased by approximately$120.0 million.
Although currency fluctuations impact our reported results and Shareholders’ Equity, such fluctuations generally do notaffect our cash flow or result in actual economic gains or losses. Substantially all of our subsidiaries derive revenuesand incur expenses within a single country and consequently, do not generally incur currency risks in connection withthe conduct of their normal business operations. We generally have few cross border transfers of funds, except fortransfers to the United States for payment of license fees and interest expense on intercompany loans, working capitalloans made between the United States and our foreign subsidiaries, dividends from our foreign subsidiaries, and paymentsbetween our EMEA countries and our EMEA headquarters for services provided. To reduce the currency risk related tothese transactions, we may borrow funds in the relevant foreign currency under our revolving credit agreement or wemay enter into a forward contract to hedge the transfer. Foreign exchange gains and losses recognized on any forwardcontracts are included in the consolidated statements of operations. As of December 31, 2004, there were no forwardcontracts outstanding.
As of December 31, 2004, we had $406.6 million of long-term borrowings denominated in Euros (€300.0 million), whichhave been designated as a hedge of our net investment in subsidiaries with the Euro functional currency. Since our netinvestment in these subsidiaries exceeds the respective amount of the designated borrowings, all translation gains orlosses related to these borrowings are included as a component of Accumulated Other Comprehensive Income.Shareholders’ Equity decreased by $28.8 million due to changes in Accumulated Other Comprehensive Income duringthe year due to the currency impact on these borrowings.
M A N A G E M E N T ’ S D I S C U S S I O N A N D A N A L Y S I So f f i n a n c i a l c o n d i t i o n a n d r e s u l t s o f o p e r a t i o n s
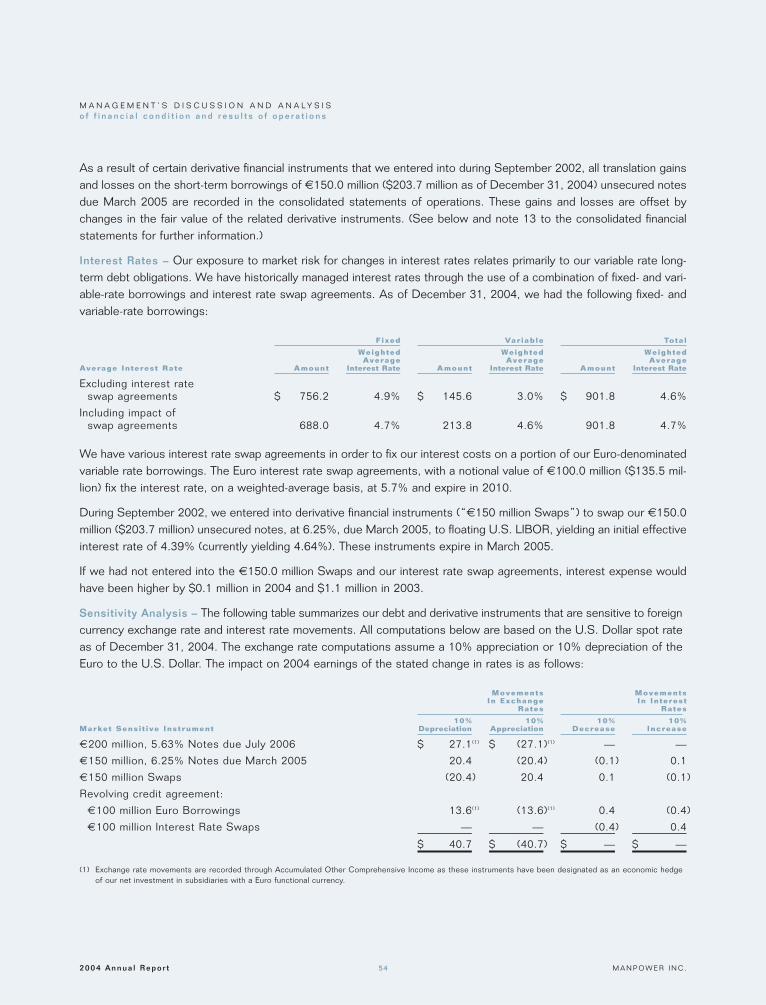
2004 Annua l Repo r t M A N P O W E R I N C .54
As a result of certain derivative financial instruments that we entered into during September 2002, all translation gainsand losses on the short-term borrowings of €150.0 million ($203.7 million as of December 31, 2004) unsecured notesdue March 2005 are recorded in the consolidated statements of operations. These gains and losses are offset bychanges in the fair value of the related derivative instruments. (See below and note 13 to the consolidated financialstatements for further information.)
Interest Rates – Our exposure to market risk for changes in interest rates relates primarily to our variable rate long-term debt obligations. We have historically managed interest rates through the use of a combination of fixed- and vari-able-rate borrowings and interest rate swap agreements. As of December 31, 2004, we had the following fixed- andvariable-rate borrowings:
Fixed Var iable Tota l
Weighted Weighted WeightedAverage Average Average
Average Interest Rate Amount Interest Rate Amount Interest Rate Amount Interest Rate
Excluding interest rate swap agreements $ 756.2 4.9% $ 145.6 3.0% $ 901.8 4.6%
Including impact of swap agreements 688.0 4.7% 213.8 4.6% 901.8 4.7%
We have various interest rate swap agreements in order to fix our interest costs on a portion of our Euro-denominatedvariable rate borrowings. The Euro interest rate swap agreements, with a notional value of €100.0 million ($135.5 mil-lion) fix the interest rate, on a weighted-average basis, at 5.7% and expire in 2010.
During September 2002, we entered into derivative financial instruments (“€150 million Swaps”) to swap our €150.0million ($203.7 million) unsecured notes, at 6.25%, due March 2005, to floating U.S. LIBOR, yielding an initial effectiveinterest rate of 4.39% (currently yielding 4.64%). These instruments expire in March 2005.
If we had not entered into the €150.0 million Swaps and our interest rate swap agreements, interest expense wouldhave been higher by $0.1 million in 2004 and $1.1 million in 2003.
Sensitivity Analysis – The following table summarizes our debt and derivative instruments that are sensitive to foreigncurrency exchange rate and interest rate movements. All computations below are based on the U.S. Dollar spot rateas of December 31, 2004. The exchange rate computations assume a 10% appreciation or 10% depreciation of theEuro to the U.S. Dollar. The impact on 2004 earnings of the stated change in rates is as follows:
Movements MovementsIn Exchange In Interest
Rates Rates
10% 10% 10% 10%Market Sensi t ive Instrument Depreciation Appreciation Decrease Increase
€200 million, 5.63% Notes due July 2006 $ 27.1(1) $ (27.1)(1) — —
€150 million, 6.25% Notes due March 2005 20.4 (20.4) (0.1) 0.1
€150 million Swaps (20.4) 20.4 0.1 (0.1)
Revolving credit agreement:
€100 million Euro Borrowings 13.6(1) (13.6)(1) 0.4 (0.4)
€100 million Interest Rate Swaps — — (0.4) 0.4
$ 40.7 $ (40.7) $ — $ —
(1) Exchange rate movements are recorded through Accumulated Other Comprehensive Income as these instruments have been designated as an economic hedgeof our net investment in subsidiaries with a Euro functional currency.
M A N A G E M E N T ’ S D I S C U S S I O N A N D A N A L Y S I So f f i n a n c i a l c o n d i t i o n a n d r e s u l t s o f o p e r a t i o n s

M A N P O W E R I N C . 2004 Annua l Repo r t55
The changes in fair value of our market sensitive instruments due to changes in interest rates, and changes in foreigncurrency exchange rates for the €150 million Swaps, is as follows:
Market Sensi t ive Instrument 10% Decrease 10% Increase
Fixed Rate Debt:
Zero-coupon convertible debentures $ 30.0(1) $ (30.0)(1)
€200 million, 5.63% Notes due July 2006 28.2(1) (28.2)(1)
€150 million, 6.25% Notes due March 2005 20.5 (20.5)
Derivative Instruments:
€150 million Swaps (20.3) 20.3
€100 million Interest Rate Swaps (1.8) 1.8
(1) This change in fair value is not recorded in the financial statements, however disclosure of the fair value is included in note 7 to the consolidated financial statements.
Impact of Economic Condi t ions
One of the principal attractions of using temporary staffing solutions is to maintain a flexible supply of labor to meetchanging economic conditions. Therefore, the industry has been and remains sensitive to economic cycles. To helpminimize the effects of these economic cycles, we offer customers a continuum of services to meet their needsthroughout the employment and business cycle. We believe that the breadth of our operations and the diversity of ourservice mix cushion us against the impact of an adverse economic cycle in any single country or industry. However,adverse economic conditions in any of our largest markets, or in several markets simultaneously, would have a materialimpact on our consolidated financial statements.
Legal Regulat ions
The temporary employment services industry is closely regulated in all of the major markets in which we operate exceptthe United States and Canada. Many countries impose licensing or registration requirements, substantive restrictions ontemporary employment services, either on the temporary staffing company or the ultimate client company, or minimumbenefits to be paid to the temporary employee either during or following the temporary assignment. Regulations alsomay restrict the length of temporary assignments, the type of work permitted for temporary workers or the occasionson which temporary workers may be used. Changes in applicable laws or regulations have occurred in the past and areexpected in the future to affect the extent to which temporary employment services firms may operate. These changescould impose additional costs, taxes, record keeping or reporting requirements; restrict the tasks to which temporariesmay be assigned; limit the duration of or otherwise impose restrictions on the nature of the temporary relationship (with usor the customer); or otherwise adversely affect the industry. Our career transition and organizational consulting servicesare currently not regulated.
In many markets, the existence or absence of collective bargaining agreements with labor organizations has a significantimpact on our operations and the ability of customers to utilize our services. In some markets, labor agreements arestructured on a national or industry-wide (rather than a company) basis. Changes in these collective labor agreementshave occurred in the past, are expected to occur in the future, and may have a material impact on the operations oftemporary staffing firms, including us.
M A N A G E M E N T ’ S D I S C U S S I O N A N D A N A L Y S I So f f i n a n c i a l c o n d i t i o n a n d r e s u l t s o f o p e r a t i o n s

2004 Annua l Repo r t M A N P O W E R I N C .56
A search warrant was executed on November 30, 2004, at our French headquarters authorizing the French RegionalDirector on Inquiries of Competition to enter the office and review and obtain documents that may be pertinent to theinvestigation. According to the search warrant, the investigation stems from a complaint submitted during 2003 to theEuropean Commission and subsequently transferred to France’s Direction Generale de la Concurrence, de laConsommation et de la Repression des Fraudes. We understand that the purpose of the investigation is to search forevidence of price fixing and allocation of market share within the French market. The investigation is continuing and wecurrently are not able to predict the outcome.
In 2002, the European Commission released proposed legislation, the Agency Workers Directive (“AWD”), aimed atimproving the quality of temporary staffing work through a principle of non-discrimination between temporary staff andpermanent employees. The AWD has been returned to a consultation and revision phase by the Commission and is thesubject of strong debate and suggested amendment by a number of member states. The AWD will be discussed in thefuture, but given the uncertainty surrounding the AWD, we cannot currently estimate the impact, if any, on the futureresults of our European operations or our consolidated financial statements.
Recent ly Issued Account ing Standards
During May 2004, the FASB (Financial Accounting Standards Board) issued FASB Staff Position (“FSP”) No. 106-2,“Accounting and Disclosure Requirements Related to the Medicare Prescription Drug, Improvement and ModernizationAct of 2003” (“FSP 106-2”), which provides guidance on accounting for the effects of the new Medicare prescriptiondrug legislation (“the Act”). The Act, which was signed into law on December 8, 2003, introduces a prescription drugbenefit under Medicare (Medicare Part D) as well as a federal subsidy to sponsors of retiree health care benefit plansthat provide a benefit that is at least actuarially equivalent to Medicare Part D. FSP 106-2 was adopted by us in thethird quarter of 2004 and did not have a material impact on our consolidated financial statements.
During September 2004, the Emerging Issues Task Force (“EITF”) issued Issue No. 04-8, “The Effect of ContingentlyConvertible Debt on Diluted Earnings Per Share” (“EITF 04-8”), which requires the effect of contingently convertibledebt securities with a market price trigger to be included in the calculation of diluted earnings per share, using the“if-converted” method, regardless of whether the market price trigger has been met. EITF 04-8 also requires thatpreviously reported diluted earnings per share be restated. We adopted EITF 04-8 in the fourth quarter of 2004. (Seenote 3 to our consolidated financial statements for further information.)
During December 2004, the FASB issued SFAS No. 123R “Share-Based Payment” (“SFAS 123R”), which replacesSFAS No. 123, “Accounting for Stock-Based Compensation,” (“SFAS 123”) and supercedes APB Opinion No. 25,“Accounting for Stock Issued to Employees.” SFAS 123R requires all share-based payments to employees, includinggrants of employee stock options, to be recognized as expense in the financial statements based on their fair valuesbeginning with the first interim or annual period after June 15, 2005, with early adoption encouraged. The pro formadisclosures previously permitted under SFAS 123 will no longer be an alternative to expense recognition. We will adoptSFAS 123R using the modified-prospective method in the third quarter of 2005. We expect SFAS 123R will haveapproximately a $0.06 per share impact on Net Earnings Per Share – Diluted in the second half of 2005.
During December 2004, the FASB issued FSP No. 109-2, “Accounting and Disclosure Guidance for the ForeignEarnings Repatriation Provision within the American Jobs Creation Act of 2004” (“FSP 109-2”), which provides guidanceon accounting for the potential impact of the repatriation provisions of the American Jobs Creation Act of 2004 (the“Jobs Act”) on enterprises’ income tax expense and deferred tax liability. The Jobs Act was enacted on October 22,2004. FSP 109-2 states that an enterprise is allowed time beyond the financial reporting period of enactment to evaluatethe effect of the Jobs Act on its plan for reinvestment or repatriation of foreign earnings for purposes of applying SFAS109. Based on our analysis to date, we are not yet in a position to decide on whether, or to what extent, we mightrepatriate foreign earnings under the provisions of the Jobs Act. However, we expect to be in a position to finalize ourassessment by June 2005.
M A N A G E M E N T ’ S D I S C U S S I O N A N D A N A L Y S I So f f i n a n c i a l c o n d i t i o n a n d r e s u l t s o f o p e r a t i o n s

M A N P O W E R I N C . 2004 Annua l Repo r t57
Forward-Looking Statements
Statements made in this annual report that are not statements of historical fact are forward-looking statements. Allforward-looking statements involve risks and uncertainties. The information under the heading “Forward-LookingStatements” in our annual report on Form 10-K for the year ended December 31, 2004, which information is incorporatedherein by reference, provides cautionary statements identifying, for purposes of the safe harbor provisions of thePrivate Securities Litigation Reform Act of 1995, important factors that could cause our actual results to differ materiallyfrom those contained in the forward-looking statements. Some or all of the factors identified in our annual report onForm 10-K may be beyond our control. Forward-looking statements can be identified by words such as “expect,”“anticipate,” “intend,” “plan,” “may,” “will,” “believe,” “seek,” “estimate,” and similar expressions. We caution that anyforward-looking statement reflects only our belief at the time the statement is made. We undertake no obligation toupdate any forward-looking statements to reflect subsequent events or circumstances.
M A N A G E M E N T ’ S D I S C U S S I O N A N D A N A L Y S I So f f i n a n c i a l c o n d i t i o n a n d r e s u l t s o f o p e r a t i o n s
We are responsible for establishing and maintaining effective internal control over financial reporting as defined in Rule13a-15(f) under the Securities Exchange Act of 1934. Our internal control over financial reporting is a process designed toprovide reasonable assurance to management and the board of directors regarding the reliability of financial reporting andthe preparation of financial statements for external purposes in accordance with generally accepted accounting principles.
Because of its inherent limitations, internal control over financial reporting may not prevent or detect misstatements. Also,projections of any evaluation of effectiveness to future periods are subject to the risk that controls may become inadequatebecause of changes in conditions, or that the degree of compliance with the policies or procedures may deteriorate.
Under the supervision and with the participation of management, including our Chairman and Chief Executive Officerand our Executive Vice President and Chief Financial Officer, we conducted an evaluation of the effectiveness of ourinternal control over financial reporting based on the framework in Internal Control – Integrated Framework issued bythe Committee of Sponsoring Organizations of the Treadway Commission. This evaluation included review of thedocumentation of controls, evaluation of the design effectiveness of controls, testing of the operating effectiveness ofcontrols and a conclusion on this evaluation. Based on our evaluation we have concluded that our internal control overfinancial reporting was effective as of December 31, 2004.
Our assessment of the effectiveness of our internal control over financial reporting as of December 31, 2004 has beenaudited by PricewaterhouseCoopers LLP, an independent registered public accounting firm, as stated in their reportwhich is included herein.
M A N A G E M E N T R E P O R T O N I N T E R N A L C O N T R O L O V E R F I N A N C I A L R E P O R T I N G

2004 Annua l Repo r t M A N P O W E R I N C .58
T O T H E B O A R D O F D I R E C T O R S A N D S H A R E H O L D E R S O F M A N P O W E R I N C . :
We have completed an integrated audit of Manpower Inc.’s 2004 consolidated financial statements and of its internal control overfinancial reporting as of December 31, 2004 and audits of its 2003 and 2002 consolidated financial statements in accordancewith the standards of the Public Company Accounting Oversight Board (United States). Our opinions, based on our audits, arepresented below.
Consol idated f inancia l s tatementsIn our opinion, the accompanying consolidated balance sheets and the related consolidated statements of operations, cash flowsand shareholders’ equity present fairly, in all material respects, the financial position of Manpower Inc. and its subsidiaries atDecember 31, 2004 and 2003, and the results of their operations and their cash flows for each of the three years in the periodended December 31, 2004 in conformity with accounting principles generally accepted in the United States of America. Thesefinancial statements are the responsibility of the Company’s management. Our responsibility is to express an opinion on thesefinancial statements based on our audits. We conducted our audits of these statements in accordance with the standards of thePublic Company Accounting Oversight Board (United States). Those standards require that we plan and perform the audit toobtain reasonable assurance about whether the financial statements are free of material misstatement. An audit of financial statementsincludes examining, on a test basis, evidence supporting the amounts and disclosures in the financial statements, assessing theaccounting principles used and significant estimates made by management, and evaluating the overall financial statement presentation.We believe that our audits provide a reasonable basis for our opinion.
As disclosed in Note 3 to the consolidated financial statements, effective in the fourth quarter of 2004, the Company retroactivelychanged for each of the three years in the period ended December 31, 2004 the manner in which it calculates diluted earningsper share upon the adoption of Emerging Issues Task Force Issue No. 04-8, The Effect of Contingently Convertible Debt onDiluted Earnings per Share.
Internal contro l over f inancia l report ingAlso, in our opinion, management’s assessment, included in the accompanying Management Report on Internal Control overFinancial Reporting, that the Company maintained effective internal control over financial reporting as of December 31, 2004based on criteria established in Internal Control – Integrated Framework issued by the Committee of Sponsoring Organizations ofthe Treadway Commission (COSO), is fairly stated, in all material respects, based on those criteria. Furthermore, in our opinion,the Company maintained, in all material respects, effective internal control over financial reporting as of December 31, 2004,based on criteria established in Internal Control – Integrated Framework issued by the COSO. The Company’s management isresponsible for maintaining effective internal control over financial reporting and for its assessment of the effectiveness of internalcontrol over financial reporting. Our responsibility is to express opinions on management’s assessment and on the effectivenessof the Company’s internal control over financial reporting based on our audit. We conducted our audit of internal control overfinancial reporting in accordance with the standards of the Public Company Accounting Oversight Board (United States). Thosestandards require that we plan and perform the audit to obtain reasonable assurance about whether effective internal control overfinancial reporting was maintained in all material respects. An audit of internal control over financial reporting includes obtaining anunderstanding of internal control over financial reporting, evaluating management’s assessment, testing and evaluating the designand operating effectiveness of internal control, and performing such other procedures as we consider necessary in the circum-stances. We believe that our audit provides a reasonable basis for our opinions.
A company’s internal control over financial reporting is a process designed to provide reasonable assurance regarding the reliabilityof financial reporting and the preparation of financial statements for external purposes in accordance with generally acceptedaccounting principles. A company’s internal control over financial reporting includes those policies and procedures that (i) pertainto the maintenance of records that, in reasonable detail, accurately and fairly reflect the transactions and dispositions of the assetsof the company; (ii) provide reasonable assurance that transactions are recorded as necessary to permit preparation of financialstatements in accordance with generally accepted accounting principles, and that receipts and expenditures of the company arebeing made only in accordance with authorizations of management and directors of the company; and (iii) provide reasonableassurance regarding prevention or timely detection of unauthorized acquisition, use, or disposition of the company’s assets thatcould have a material effect on the financial statements.
Because of its inherent limitations, internal control over financial reporting may not prevent or detect misstatements. Also, projectionsof any evaluation of effectiveness to future periods are subject to the risk that controls may become inadequate because ofchanges in conditions, or that the degree of compliance with the policies or procedures may deteriorate.
PRICEWATERHOUSECOOPERS LLPMILWAUKEE, WISCONSINFEBRUARY 16, 2005
R E P O R T O F I N D E P E N D E N T R E G I S T E R E D P U B L I C A C C O U N T I N G F I R M

M A N P O W E R I N C . 2004 Annua l Repo r t59
Year Ended December 31 2004 2003 2002
Revenues from services $ 14,930.0 $ 12,184.5 $ 10,610.9
Cost of services 12,141.9 10,047.7 8,700.5
Gross profit 2,788.1 2,136.8 1,910.4
Selling and administrative expenses 2,392.3 1,878.9 1,675.6
Operating profit 395.8 257.9 234.8
Interest and other expense 26.3 35.8 46.8
Earnings before income taxes 369.5 222.1 188.0
Provision for income taxes 123.8 84.4 74.8
Net earnings $ 245.7 $ 137.7 $ 113.2
Net earnings per share $ 2.76 $ 1.77 $ 1.48
Net earnings per share – diluted $ 2.59 $ 1.69 $ 1.42
The accompanying notes to consolidated financial statements are an integral part of these statements.
C O N S O L I D A T E D S T A T E M E N T S O F O P E R A T I O N Si n m i l l i o n s , e x c e p t p e r s h a r e d a t a

2004 Annua l Repo r t M A N P O W E R I N C .60
December 31 2004 2003
A S S E T S
Current Assets
Cash and cash equivalents $ 531.8 $ 426.2
Accounts receivable, less allowance for doubtful accounts of $91.4 and $79.1, respectively 3,227.8 2,600.9
Prepaid expenses and other assets 161.4 100.1
Future income tax benefits 96.5 101.4
Total current assets 4,017.5 3,228.6
Other Assets
Goodwill and other intangible assets, less accumulated amortization of $65.0 and $53.6, respectively 1,297.0 544.3
Other assets 305.5 416.4
Total other assets 1,602.5 960.7
Property and Equipment
Land, buildings, leasehold improvements and equipment 669.8 606.3
Less: accumulated depreciation and amortization 446.7 419.2
Net property and equipment 223.1 187.1
Total assets $ 5,843.1 $ 4,376.4
L I A B I L I T I E S A N D S H A R E H O L D E R S ’ E Q U I T Y
Current L iabi l i t ies
Accounts payable $ 687.1 $ 555.4
Employee compensation payable 156.0 105.6
Accrued liabilities 505.7 360.0
Accrued payroll taxes and insurance 569.6 476.6
Value added taxes payable 457.8 368.2
Short-term borrowings and current maturities of long-term debt 225.7 12.1
Total current liabilities 2,601.9 1,877.9
Other L iabi l i t ies
Long-term debt 676.1 829.6
Other long-term liabilities 391.1 358.6
Total other liabilities 1,067.2 1,188.2
Shareholders ’ Equi ty
Preferred stock, $.01 par value, authorized 25,000,000 shares, none issued — —
Common stock, $.01 par value, authorized 125,000,000 shares, issued 100,236,635 and 88,604,575 shares, respectively 1.0 0.9
Capital in excess of par value 2,296.4 1,732.5
Retained earnings (accumulated deficit) 51.0 (167.6)
Accumulated other comprehensive income 109.4 28.3
Treasury stock at cost, 9,946,475 and 9,945,200 shares, respectively (283.8) (283.8)
Total shareholders’ equity 2,174.0 1,310.3
Total liabilities and shareholders’ equity $ 5,843.1 $ 4,376.4
The accompanying notes to consolidated financial statements are an integral part of these balance sheets.
C O N S O L I D A T E D B A L A N C E S H E E T Si n m i l l i o n s , e x c e p t s h a r e a n d p e r s h a r e d a t a
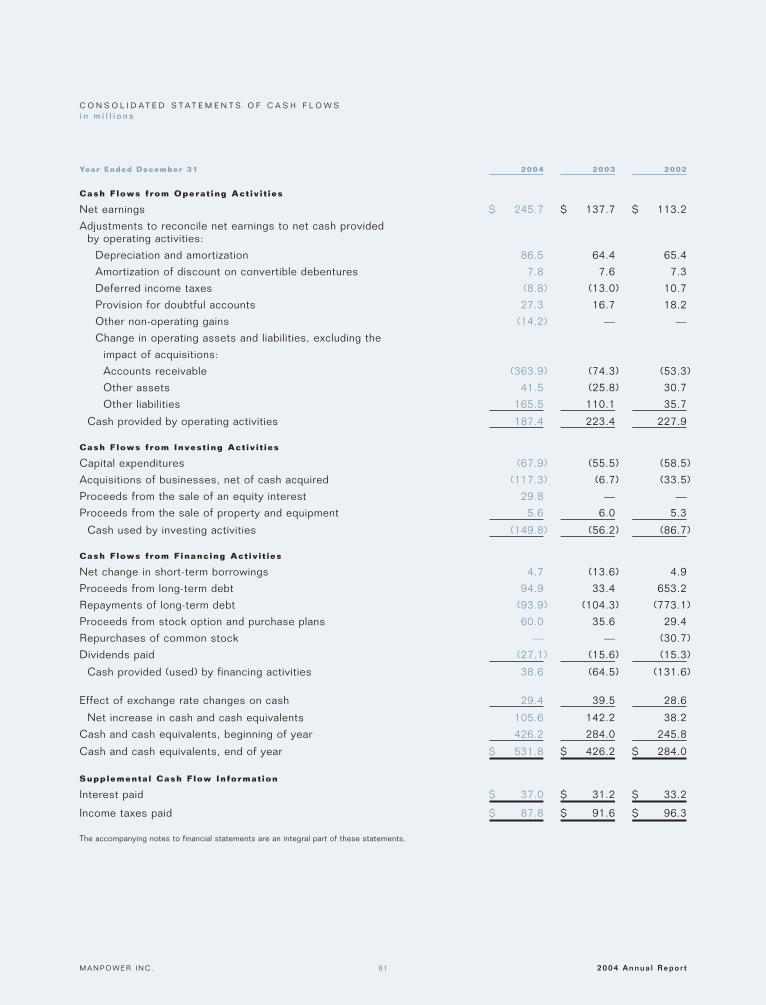
M A N P O W E R I N C . 2004 Annua l Repo r t61
Year Ended December 31 2004 2003 2002
Cash F lows from Operat ing Act iv i t ies
Net earnings $ 245.7 $ 137.7 $ 113.2
Adjustments to reconcile net earnings to net cash provided by operating activities:
Depreciation and amortization 86.5 64.4 65.4
Amortization of discount on convertible debentures 7.8 7.6 7.3
Deferred income taxes (8.8) (13.0) 10.7
Provision for doubtful accounts 27.3 16.7 18.2
Other non-operating gains (14.2) — —
Change in operating assets and liabilities, excluding the
impact of acquisitions:
Accounts receivable (363.9) (74.3) (53.3)
Other assets 41.5 (25.8) 30.7
Other liabilities 165.5 110.1 35.7
Cash provided by operating activities 187.4 223.4 227.9
Cash F lows from Invest ing Act iv i t ies
Capital expenditures (67.9) (55.5) (58.5)
Acquisitions of businesses, net of cash acquired (117.3) (6.7) (33.5)
Proceeds from the sale of an equity interest 29.8 — —
Proceeds from the sale of property and equipment 5.6 6.0 5.3
Cash used by investing activities (149.8) (56.2) (86.7)
Cash F lows from Financing Act iv i t ies
Net change in short-term borrowings 4.7 (13.6) 4.9
Proceeds from long-term debt 94.9 33.4 653.2
Repayments of long-term debt (93.9) (104.3) (773.1)
Proceeds from stock option and purchase plans 60.0 35.6 29.4
Repurchases of common stock — — (30.7)
Dividends paid (27.1) (15.6) (15.3)
Cash provided (used) by financing activities 38.6 (64.5) (131.6)
Effect of exchange rate changes on cash 29.4 39.5 28.6
Net increase in cash and cash equivalents 105.6 142.2 38.2
Cash and cash equivalents, beginning of year 426.2 284.0 245.8
Cash and cash equivalents, end of year $ 531.8 $ 426.2 $ 284.0
Supplementa l Cash F low Informat ion
Interest paid $ 37.0 $ 31.2 $ 33.2
Income taxes paid $ 87.8 $ 91.6 $ 96.3
The accompanying notes to financial statements are an integral part of these statements.
C O N S O L I D A T E D S T A T E M E N T S O F C A S H F L O W Si n m i l l i o n s

2004 Annua l Repo r t M A N P O W E R I N C .62
Retained AccumulatedCapi ta l in Earnings Other
Common Excess of Par (Accumulated Comprehensive TreasuryStock Value Def ic i t ) Income (Loss) Stock Tota l
Balance, December 31, 2001 $ .9 $ 1,644.9 $ (387.6) $ (190.8) $ (253.1) $ 814.3Comprehensive Income:
Net earnings 113.2Foreign currency translation 75.3Unrealized loss on derivatives,
net of tax (6.6)Unrealized loss on investments,
net of tax (5.8)Reclassification adjustment for
losses included in net earnings, net of tax 5.1
Minimum pension liability adjustment, net of tax (.9)
Total comprehensive income 180.3Issuances for franchise acquisitions — 21.9 21.9Issuances under equity plans — 29.4 29.4Dividends ($.20 per share) (15.3) (15.3)
Repurchases of common stock (30.7) (30.7)Balance, December 31, 2002 .9 1,696.2 (289.7) (123.7) (283.8) 999.9
Comprehensive Income:Net earnings 137.7Foreign currency translation 146.8Unrealized gain on derivatives,
net of tax 3.4Unrealized gain on investments,
net of tax 3.2Reclassification adjustment for
losses included in net earnings, net of tax 1.6
Minimum pension liability adjustment, net of tax (3.0)
Total comprehensive income 289.7Issuances for acquisitions — .7 .7Issuances under equity plans — 35.6 35.6
Dividends ($.20 per share) (15.6) (15.6)Balance, December 31, 2003 .9 1,732.5 (167.6) 28.3 (283.8) 1,310.3
Comprehensive Income:Net earnings 245.7Foreign currency translation 86.3Unrealized loss on derivatives,
net of tax (2.5)Unrealized gain on investments,
net of tax 3.4Minimum pension liability
adjustment, net of tax (6.1)Total comprehensive income 326.8Issuances for acquisitions .1 487.8 487.9Issuances under equity plans — 76.1 76.1Dividends ($.30 per share) (27.1) (27.1)
Balance, December 31, 2004 $ 1.0 $ 2,296.4 $ 51.0 $ 109.4 $ (283.8) $ 2,174.0
The accompanying notes to consolidated financial statements are an integral part of these statements.
C O N S O L I D A T E D S T A T E M E N T S O F S H A R E H O L D E R S ’ E Q U I T Yi n m i l l i o n s , e x c e p t p e r s h a r e d a t a

M A N P O W E R I N C . 2004 Annua l Repo r t63
01.S U M M A R Y O F S I G N I F I C A N T A C C O U N T I N G P O L I C I E S
Nature of Operat ions
Manpower Inc. is a world leading provider of contemporary work services to the world’s labor markets. Our worldwidenetwork of over 4,300 offices in 67 countries and territories enables us to meet the needs of our customers in all industrysegments. Our largest operations, based on revenues, are located in the United States, France and the UnitedKingdom. We specialize in permanent, temporary and contract recruitment; employee assessment; training; internal audit,accounting, technology and tax services; career transition and organizational consulting services. We provide servicesto a wide variety of customers, none of which individually comprises a significant portion of revenues for us as a whole.
Use of Est imates
The preparation of financial statements in conformity with accounting principles generally accepted in the United Statesrequires us to make estimates and assumptions that affect the reported amounts of assets and liabilities and disclosureof contingent assets and liabilities at the date of the financial statements and the reported amounts of revenues andexpenses for the reporting period. Actual results could differ from these estimates.
We have used estimates to establish liability balances for various items, including amounts related to social programremittances in France and payroll tax audit exposures. The liabilities are determined at each entity, based on our his-torical experience and related trends, and will be adjusted to the extent that our actual experience differs from our cur-rent estimates. In France, we are currently under audit for payroll tax remittances made during 2001 and for remittancesmade during 2002 and 2003. We have received a preliminary notification related to 2001 and have responded to thenotification with additional information. We currently do not expect a significant adjustment to our December 31, 2004estimate of additional remittances as a result of this notification. In the fourth quarter of 2003, we reduced our estimatedliability related to the social program remittances in France by $16.1 due to recent historical trends in the amountsremitted to customers. During 2004, we increased our liability for payroll tax remittances by $12.8.
In the Netherlands, we are currently under audit for compliance with regulations related to the collection and maintenanceof payroll-related documents for our temporary employees. We have not received any notification of findings relatedto this audit, however we currently do not expect an assessment to have a significant impact on the consolidatedfinancial statements.
Reclass i f icat ions
Certain amounts in the 2003 and 2002 notes to consolidated financial statements have been reclassified to be consistentwith the current year presentation.
Basis of Consol idat ion
The consolidated financial statements include our operating results and the operating results of all of our subsidiaries.For subsidiaries in which we have an ownership interest of 50% or less, but more than 20%, the consolidated financialstatements reflect our ownership share of those earnings using the equity method of accounting. These investments,as well as certain other relationships, are also evaluated for consolidation under FASB (Financial Accounting StandardsBoard) Interpretation No. 46R, “Consolidation of Variable Interest Entities.” These investments were $82.7 and $95.7 asof December 31, 2004 and 2003, respectively, and are included as Other Assets in the consolidated balance sheets.Included in Shareholders’ Equity as of December 31, 2004 are $45.7 of unremitted earnings from investments accountedfor using the equity method. All significant intercompany accounts and transactions have been eliminated in consolidation.
N O T E S T O C O N S O L I D A T E D F I N A N C I A L S T A T E M E N T Si n m i l l i o n s , e x c e p t s h a r e a n d p e r s h a r e d a t a

2004 Annua l Repo r t M A N P O W E R I N C .64
Revenues and Receivables
We generate revenues from sales of services by our company-owned branch operations and from fees earned on salesof services by our franchise operations. Revenues are recognized on the accrual basis. The majority of our revenuesare generated by our staffing business, where billings are generally negotiated and invoiced on a per-hour basis.Accordingly, as the temporary employees are placed, we record revenue based on the hours worked. Our franchiseagreements generally state that franchise fees are calculated based on a percentage of revenues. We record franchisefee revenues monthly based on the amounts due under the franchise agreements for that month. Franchise fees, whichare included in Revenues from Services, were $34.5, $26.5, and $25.8 for the years ended December 31, 2004, 2003and 2002, respectively.
In our career transition business, we recognize revenue from individual programs on a straight-line basis over the averagelength of time for candidates to find jobs based on statistically valid data for the specific type of program. For groupprograms and large projects within the career transition business, we defer and recognize revenue over the period withinwhich the contracts are completed. The difference between the amount billed for career transition services and theamount recognized as revenue is recorded as Deferred Revenue and included in Accrued Liabilities on our consolidatedbalance sheet. We had $43.8 recorded as Deferred Revenue as of December 31, 2004.
In our organizational consulting business, revenue is recognized upon the performance of the obligations under the con-sulting service contract.
Allowance for Doubtfu l Accounts
We have an Allowance for Doubtful Accounts recorded as an estimate of the accounts receivable balance that may not becollected. This allowance is calculated on an entity-by-entity basis with consideration for historical write-off experience,the current aging of receivables and a specific review for potential bad debts. Items that affect this balance mainlyinclude bad debt expense and the write-off of accounts receivable balances.
Bad debt expense, which increases our Allowance for Doubtful Accounts, is recorded as a Selling and AdministrativeExpense in our consolidated statements of operations and was $27.3, $16.7, and $18.2 in 2004, 2003, and 2002,respectively. Factors that would cause this provision to increase primarily relate to increased bankruptcies by our customersand other difficulties collecting amounts billed. On the other hand, an improved write-off experience and aging of receivableswould result in a decrease to the provision.
Write-offs, which decrease our allowance for doubtful accounts, are recorded as a reduction to our accounts receivablebalance and were $21.9, $19.5, and $18.4, for 2004, 2003, and 2002, respectively.
Advert is ing Costs
We generally expense production costs of advertising as they are incurred. Advertising expenses were $43.2, $28.1,and $30.8 in 2004, 2003 and 2002, respectively.
Income Taxes
We account for income taxes in accordance with Statement of Financial Accounting Standards (“SFAS”) No. 109,“Accounting for Income Taxes” (“SFAS 109”). Deferred tax assets and liabilities are recognized for the future taxconsequences attributable to differences between financial statement carrying amounts of existing assets and liabilitiesand their respective tax bases, net operating loss and tax credit carryforwards, and tax contingencies. Deferred taxassets and liabilities are measured using enacted tax rates expected to apply to taxable income in the years in whichthose temporary differences are expected to be recovered or settled. We record a valuation allowance against deferredtax assets for which utilization of the asset is not likely.
N O T E S T O C O N S O L I D A T E D F I N A N C I A L S T A T E M E N T Si n m i l l i o n s , e x c e p t s h a r e a n d p e r s h a r e d a t a

M A N P O W E R I N C . 2004 Annua l Repo r t65
Accounts Receivable Secur i t i zat ion
We account for the securitization of accounts receivable in accordance with SFAS No. 140, “Accounting for Transfers andServicing of Financial Assets and Extinguishments of Liabilities” (“SFAS 140”). Accordingly, transfers of receivablesare evaluated for sale accounting treatment and if such a transfer qualifies as a sale under SFAS 140, the related receivablebalance is removed from our consolidated balance sheets and the loss related to the transfer is recorded as otherexpense. If the transfer of receivables does not qualify for sale accounting, the related receivable balance remains on ourconsolidated balance sheets, the corresponding advance is recorded as debt and the related cost of the transaction isrecorded as interest expense. (See note 5 for further information.)
Goodwi l l and Intangib le Assets
We have goodwill, amortizable intangible assets and indefinite-lived intangible assets, as follows:
2004 2003
Accumulated AccumulatedDecember 31 Gross Amort izat ion Net Gross Amort izat ion Net
Goodwill $ 999.0 $ 49.1 $ 949.9 $ 592.9 $ 52.4 $ 540.5
Intangible assets:
Amortizable intangible assets 171.3 15.9 155.4 4.6 1.2 3.4
Indefinite-lived intangible assets 191.7 — 191.7 0.4 — 0.4
Total intangible assets 363.0 15.9 347.1 5.0 1.2 3.8
Goodwill and intangible assets $ 1,362.0 $ 65.0 $ 1,297.0 $ 597.9 $ 53.6 $ 544.3
The increase in Goodwill and Intangible Assets from 2003 to 2004 is primarily a result of the acquisition of RightManagement Consultants, Inc. (“RMC”). (See note 2 for further information.)
Amortization expense related to intangibles was $12.3 in 2004 and immaterial in 2003 and 2002. Amortization expenseexpected in each of the next five years is as follows: 2005 – $14.1, 2006 – $14.1, 2007 – $14.1, 2008 – $14.1, and2009 – $10.0.
In connection with SFAS No. 142, “Goodwill and Other Intangible Assets,” we are required to perform goodwill andindefinite-lived intangible asset impairment reviews, at least annually, using a fair-value-based approach. The majority ofour Goodwill and indefinite-lived intangible assets result from our acquisition of RMC. Our remaining Goodwill relatesprimarily to our acquisitions of Elan and Jefferson Wells.
As part of our impairment reviews, we estimate fair value primarily by using a discounted cash flow analysis and, forcertain larger reporting units, we may also consider market comparables. Significant assumptions used in our discountedcash flow analysis include: expected future revenue growth rates, operating unit profit margins, and working capital levels;a discount rate; and a terminal value multiple.
We completed our annual impairment review for 2004 and determined there to be no impairment of either goodwill orindefinite-lived intangible assets. We plan to perform our next annual impairment review during the third quarter of 2005.
We may be required to perform an impairment review prior to our scheduled annual review if certain events occur,including lower-than-forecasted earnings levels for various reporting units. In addition, changes to other assumptionscould significantly impact our estimate of the fair value of our reporting units. Such a change may result in an impairmentcharge, which could have a significant impact on the reportable segments that include the related reporting units andour consolidated financial statements.
N O T E S T O C O N S O L I D A T E D F I N A N C I A L S T A T E M E N T Si n m i l l i o n s , e x c e p t s h a r e a n d p e r s h a r e d a t a

2004 Annua l Repo r t M A N P O W E R I N C .66
Marketable Secur i t ies
We account for our security investments under SFAS No. 115, “Accounting for Certain Investments in Debt and EquitySecurities,” and have determined that all such investments are classified as available-for-sale. Accordingly, unrealized gainsand unrealized losses that are determined to be temporary, net of related income taxes, are included in AccumulatedOther Comprehensive Income, which is a separate component of Shareholders’ Equity. Realized gains and losses, andunrealized losses determined to be other-than-temporary, are recorded in our consolidated statements of operations. Asof December 31, 2004 and 2003, our available-for-sale investments had a market value of $8.8 and $6.4, respectively,and an adjusted cost basis of $6.3 in 2004 and 2003. As of December 31, 2004, none of these available-for-sale invest-ments had unrealized losses.
We hold a 49% interest in our Swiss franchise, which maintains an investment portfolio with a market value of $115.2as of December 31, 2004. This portfolio is comprised of a wide variety of European and U.S. debt and equity securitiesas well as various professionally-managed funds, all of which are classified as available-for-sale. Our net share of realizedgains and losses, and declines in value determined to be other-than-temporary, are included in our consolidated state-ments of operations. Our share of net unrealized gains and unrealized losses that are determined to be temporary relatedto these investments are included in Accumulated Other Comprehensive Income, with the offsetting amount increasingor decreasing our investment in the franchise. In this portfolio, there were no unrealized losses by investment type asof December 31, 2004.
Capita l i zed Software
We capitalize purchased software as well as internally developed software. Internal software development costs arecapitalized from the time the internal use software is considered probable of completion until the software is ready foruse. Business analysis, system evaluation, selection and software maintenance costs are expensed as incurred.Capitalized software costs are amortized using the straight-line method over the estimated useful life of the software.The net capitalized software balance of $47.2 and $46.7 as of December 31, 2004 and 2003, respectively, is includedin Other Assets in the consolidated balance sheets. Amortization expense related to the capitalized software costs was$9.3, $5.5, and $4.7 for 2004, 2003, and 2002, respectively.
Property and Equipment
A summary of property and equipment as of December 31 is as follows:
2004 2003
Land $ 2.5 $ 2.3
Buildings 32.4 29.7
Furniture, fixtures and autos 221.2 200.0
Computer equipment 169.8 163.3
Leasehold improvements 243.9 211.0
$ 669.8 $ 606.3
Property and equipment are stated at cost and are depreciated using primarily the straight-line method over the followingestimated useful lives: buildings – up to 40 years; leasehold improvements – lesser of life of asset or lease term;furniture and equipment – 3 to 15 years. Expenditures for renewals and betterments are capitalized whereas expendituresfor repairs and maintenance are charged to income as incurred. Upon sale or disposition of property and equipment,the difference between the unamortized cost and the proceeds is recorded as either a gain or a loss and is included inour consolidated statements of operations.
N O T E S T O C O N S O L I D A T E D F I N A N C I A L S T A T E M E N T Si n m i l l i o n s , e x c e p t s h a r e a n d p e r s h a r e d a t a

M A N P O W E R I N C . 2004 Annua l Repo r t67
Derivat ive F inancia l Instruments
We account for our derivative instruments in accordance with SFAS Nos. 133, 137, and 149 related to “Accountingfor Derivative Instruments and Hedging Activities” (“SFAS 133, as amended”). Derivative instruments are recorded onthe balance sheet as either an asset or liability measured at their fair value. If the derivative is designated as a fair valuehedge, the changes in the fair value of the derivative and of the hedged item attributable to the hedged risk are recognizedin earnings. If the derivative is designated as a cash flow hedge, the effective portions of the changes in the fair valueof the derivative are recorded as a component of Accumulated Other Comprehensive Income and recognized in theconsolidated statements of operations when the hedged item affects earnings. Ineffective portions of changes in thefair value of hedges are recognized in earnings.
Foreign Currency Translat ion
The financial statements of our non-U.S. subsidiaries have been translated in accordance with SFAS No. 52, “ForeignCurrency Translation” (“SFAS 52”). Under SFAS 52, asset and liability accounts are translated at the current exchangerate and income statement items are translated at the weighted-average exchange rate for the year. The resulting trans-lation adjustments are recorded as a component of Accumulated Other Comprehensive Income, which is included inShareholders’ Equity. In accordance with SFAS 109, no deferred taxes have been recorded related to the cumulativetranslation adjustments.
Certain foreign currency denominated borrowings are accounted for as a hedge of our net investment in our subsidiarieswith the related functional currencies. Since our net investment in these subsidiaries exceeds the amount of the relatedborrowings, all translation gains or losses related to these borrowings are included as a component of AccumulatedOther Comprehensive Income.
Shareholders ’ Equi ty
In October 2004, the Board of Directors authorized the repurchase of 5 million shares of our common stock, not to exceeda total purchase price of $250.0. Share repurchases may be made from time to time and may be implemented through avariety of methods, including open market purchases, block transactions, privately negotiated transactions, acceleratedshare repurchase programs, forward repurchase agreements or similar facilities. This repurchase authorization replacesall previous authorizations. As of December 31, 2004, there were no shares repurchased under this authorization.There were no share repurchases in 2003 and a total of 900,000 shares at a cost of $30.7 were repurchased in 2002under a previous authorization.
Statement of Cash F lows
We consider all highly liquid investments with a maturity of three months or less when purchased to be cash equivalents.
Stock Compensat ion Plans
We account for all of our fixed stock option plans and our 1990 Employee Stock Purchase Plan in accordance with APBOpinion No. 25, “Accounting for Stock Issued to Employees,” and related Interpretations (“APB 25”). No compensationexpense for employee stock options is reflected in Net Earnings as all options granted under those plans had an exerciseprice equal to the market value of the underlying common stock on the date of grant. The following table (page 68) illus-trates the effect on Net Earnings and Net Earnings Per Share if we had applied the fair value recognition provisions ofSFAS No. 123, “Accounting for Stock-Based Compensation,” (“SFAS 123”) to stock-based employee compensation.
N O T E S T O C O N S O L I D A T E D F I N A N C I A L S T A T E M E N T Si n m i l l i o n s , e x c e p t s h a r e a n d p e r s h a r e d a t a
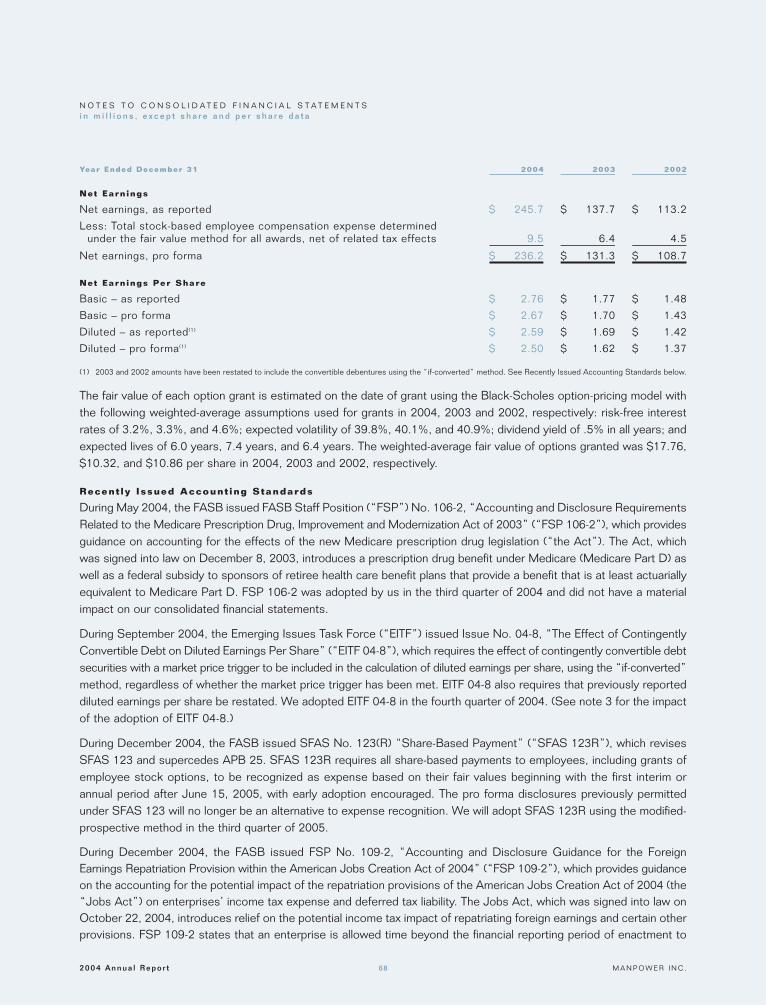
2004 Annua l Repo r t M A N P O W E R I N C .68
Year Ended December 31 2004 2003 2002
Net Earnings
Net earnings, as reported $ 245.7 $ 137.7 $ 113.2
Less: Total stock-based employee compensation expense determined under the fair value method for all awards, net of related tax effects 9.5 6.4 4.5
Net earnings, pro forma $ 236.2 $ 131.3 $ 108.7
Net Earnings Per Share
Basic – as reported $ 2.76 $ 1.77 $ 1.48
Basic – pro forma $ 2.67 $ 1.70 $ 1.43
Diluted – as reported(1) $ 2.59 $ 1.69 $ 1.42
Diluted – pro forma(1) $ 2.50 $ 1.62 $ 1.37
(1) 2003 and 2002 amounts have been restated to include the convertible debentures using the “if-converted” method. See Recently Issued Accounting Standards below.
The fair value of each option grant is estimated on the date of grant using the Black-Scholes option-pricing model withthe following weighted-average assumptions used for grants in 2004, 2003 and 2002, respectively: risk-free interestrates of 3.2%, 3.3%, and 4.6%; expected volatility of 39.8%, 40.1%, and 40.9%; dividend yield of .5% in all years; andexpected lives of 6.0 years, 7.4 years, and 6.4 years. The weighted-average fair value of options granted was $17.76,$10.32, and $10.86 per share in 2004, 2003 and 2002, respectively.
Recent ly Issued Account ing Standards
During May 2004, the FASB issued FASB Staff Position (“FSP”) No. 106-2, “Accounting and Disclosure RequirementsRelated to the Medicare Prescription Drug, Improvement and Modernization Act of 2003” (“FSP 106-2”), which providesguidance on accounting for the effects of the new Medicare prescription drug legislation (“the Act”). The Act, whichwas signed into law on December 8, 2003, introduces a prescription drug benefit under Medicare (Medicare Part D) aswell as a federal subsidy to sponsors of retiree health care benefit plans that provide a benefit that is at least actuariallyequivalent to Medicare Part D. FSP 106-2 was adopted by us in the third quarter of 2004 and did not have a materialimpact on our consolidated financial statements.
During September 2004, the Emerging Issues Task Force (“EITF”) issued Issue No. 04-8, “The Effect of ContingentlyConvertible Debt on Diluted Earnings Per Share” (“EITF 04-8”), which requires the effect of contingently convertible debtsecurities with a market price trigger to be included in the calculation of diluted earnings per share, using the “if-converted”method, regardless of whether the market price trigger has been met. EITF 04-8 also requires that previously reporteddiluted earnings per share be restated. We adopted EITF 04-8 in the fourth quarter of 2004. (See note 3 for the impactof the adoption of EITF 04-8.)
During December 2004, the FASB issued SFAS No. 123(R) “Share-Based Payment” (“SFAS 123R”), which revisesSFAS 123 and supercedes APB 25. SFAS 123R requires all share-based payments to employees, including grants ofemployee stock options, to be recognized as expense based on their fair values beginning with the first interim orannual period after June 15, 2005, with early adoption encouraged. The pro forma disclosures previously permittedunder SFAS 123 will no longer be an alternative to expense recognition. We will adopt SFAS 123R using the modified-prospective method in the third quarter of 2005.
During December 2004, the FASB issued FSP No. 109-2, “Accounting and Disclosure Guidance for the ForeignEarnings Repatriation Provision within the American Jobs Creation Act of 2004” (“FSP 109-2”), which provides guidanceon the accounting for the potential impact of the repatriation provisions of the American Jobs Creation Act of 2004 (the“Jobs Act”) on enterprises’ income tax expense and deferred tax liability. The Jobs Act, which was signed into law onOctober 22, 2004, introduces relief on the potential income tax impact of repatriating foreign earnings and certain otherprovisions. FSP 109-2 states that an enterprise is allowed time beyond the financial reporting period of enactment to
N O T E S T O C O N S O L I D A T E D F I N A N C I A L S T A T E M E N T Si n m i l l i o n s , e x c e p t s h a r e a n d p e r s h a r e d a t a

M A N P O W E R I N C . 2004 Annua l Repo r t69
evaluate the effect of the Jobs Act on its plan for reinvestment or repatriation of foreign earnings for purposes of applyingSFAS 109. Based on our analysis to date, we are not yet in a position to decide on whether, or to what extent, wemight repatriate foreign earnings under the provision of the Jobs Act. However, we expect to be in a position to finalizeour assessment by June 2005.
02.A C Q U I S I T I O N S O F B U S I N E S S E S
From time to time, we acquire and invest in companies throughout the world, including U.S. franchises. The total cashconsideration for acquisitions was $117.3, $6.7, and $33.5 in 2004, 2003 and 2002, respectively. The 2004 amountincludes acquisition-related costs and the $123.8 repayment of RMC’s long-term debt that we were required to makedue to change of control provisions contained in the agreements. We financed the acquisition-related costs and thisrepayment with excess cash and borrowings under our Receivables Facility, which was repaid in 2004. Cash acquiredof approximately $39.5 offsets these payments.
Right Acquis i t ion
On January 22, 2004, we completed our exchange offer to acquire RMC, the world’s largest career transition andorganizational consulting services firm, operating through over 300 offices in 35 countries. The results of RMC’soperations are included in our consolidated financial statements since that date. The acquisition of RMC expands therange of services that we offer to customers as a strategic partner throughout every stage of the employment cycle.We have merged our Empower operations into RMC, and the results of the combined entity are reported as theRight segment.
Substantially all of RMC’s outstanding shares were tendered and exchanged at a rate of 0.3874 of a share of our commonstock and cash was paid for fractional shares. The remaining outstanding shares were converted into the right to acquireour common stock at the same exchange rate.
The purchase price comprised of the following items:
Fair value of our common stock issued $ 428.4Fair value of RMC stock options assumed 59.5Long-term debt repaid upon change of control 123.8Severance and additional SERP liabilities, net of deferred tax assets 6.0Acquisition-related costs, net of deferred tax assets 11.5Other 1.4
Total purchase price $ 630.6
We issued 8,852,000 shares of our common stock in the exchange. The value of these shares was calculated basedon an average share price over a two-day period prior to the completion of the transaction.
We assumed both of RMC’s stock option plans, converting outstanding options to purchase shares of RMC commonstock into options to purchase 1,962,000 shares of our common stock. The fair value of these options was based onan independent valuation using the Black-Scholes option-pricing model.
We were required to repay certain of RMC’s long-term debt due to change of control provisions contained in theseagreements. We financed this repayment with excess cash and borrowings under our Receivables Facility which weresubsequently repaid.
The purchase price also includes amounts paid or accrued for a severance agreement and the liability resulting fromthe accelerated vesting of RMC’s Supplemental Executive Retirement Plan (“SERP”). The liability resulting from theaccelerated vesting of the SERP was based on an independent valuation. Deferred tax assets of $3.8 were recordedrelated to these items.
N O T E S T O C O N S O L I D A T E D F I N A N C I A L S T A T E M E N T Si n m i l l i o n s , e x c e p t s h a r e a n d p e r s h a r e d a t a

2004 Annua l Repo r t M A N P O W E R I N C .70
The acquisition-related costs consist primarily of investment banking, legal and accounting fees, printing costs and otherexternal costs directly related to the acquisition.
In connection with this acquisition, we have also established reserves for severances and other office closure costsrelated to streamlining RMC’s worldwide operations that total $24.5. We have recorded a net deferred tax asset of $6.5related to these items. During 2004, approximately $7.8 was paid from these reserves. Of the remaining balance,approximately $15.1 will be paid during 2005, with the remaining $1.6 to be paid thereafter.
Based on an independent valuation, we have identified $162.5 of amortizable intangible assets related to RMC’s customerlist, technology and franchise agreements. These items were assigned a weighted-average useful life of approximately15 years. We have also identified $191.3 as an indefinite-lived intangible asset related to RMC’s tradename. A deferredtax liability of $136.3 was established for the difference between book and tax basis related to RMC’s intangible assets.Based on the independent valuation and the fair value of tangible assets acquired, $389.6 was recorded as Goodwill.Approximately $8.0 of Goodwill, related to the acquisition fees, will be deductible for tax purposes. Therefore we’ve recordeda deferred tax asset of $2.9.
The following represents the assets acquired and liabilities assumed to arrive at net cash paid and equity issued for theacquisition of RMC as of January 22, 2004.
Current Assets
Cash $ 10.8
Accounts receivable, net 86.0
Other current assets 20.4
Goodwill 389.6
Intangible assets 353.8
Other assets 18.6
Property and equipment 41.8
Total assets acquired 921.0
Current L iabi l i t ies
Accounts payable (17.2)
Accrued liabilities (122.4)
Long-term debt (4.4)
Long-term deferred tax liability (123.7)
Other long-term liabilities (22.7)
Total liabilities assumed (290.4)
Cash paid and value of equity issued $ 630.6
The pro forma consolidated results below combine the historical results of our operations and RMC’s operations forthe years ended December 31, 2004 and 2003 and have been prepared to reflect the acquisition as if it had beenconsummated as of the beginning of each period.
Year ended December 31 2004 2003
Revenue from services $ 14,954.0 $ 12,636.1
Net earnings 246.4 173.5
Net earnings per share $ 2.75 $ 1.98
Net earnings per share – diluted 2.58 1.88
N O T E S T O C O N S O L I D A T E D F I N A N C I A L S T A T E M E N T Si n m i l l i o n s , e x c e p t s h a r e a n d p e r s h a r e d a t a
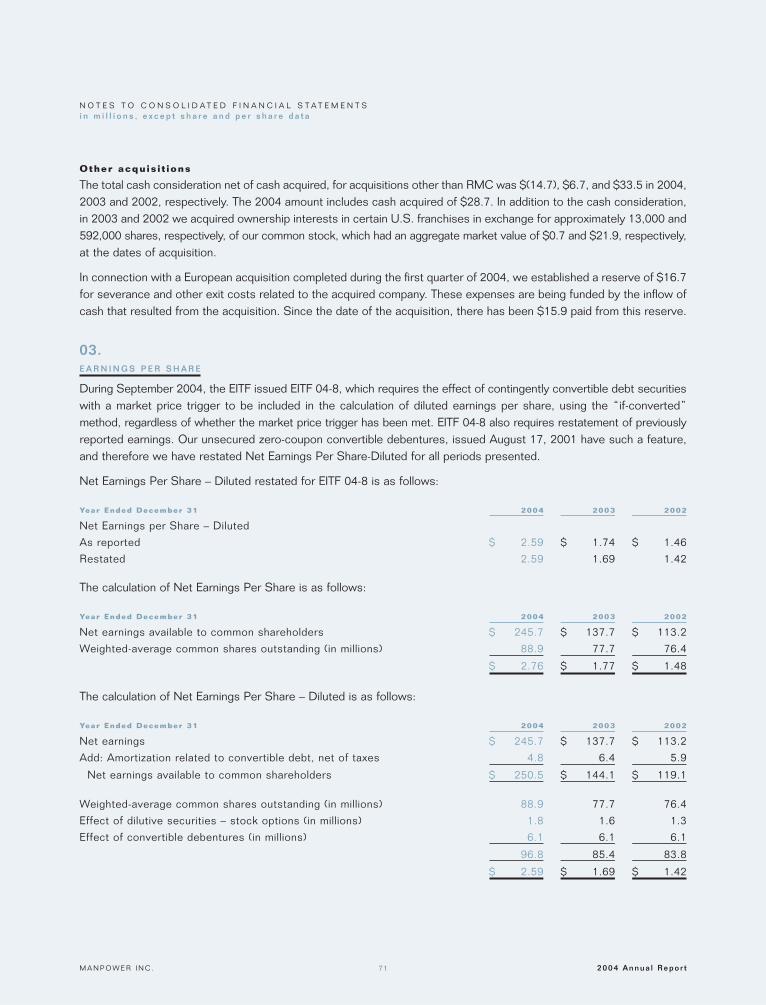
M A N P O W E R I N C . 2004 Annua l Repo r t71
Other acquis i t ions
The total cash consideration net of cash acquired, for acquisitions other than RMC was $(14.7), $6.7, and $33.5 in 2004,2003 and 2002, respectively. The 2004 amount includes cash acquired of $28.7. In addition to the cash consideration,in 2003 and 2002 we acquired ownership interests in certain U.S. franchises in exchange for approximately 13,000 and592,000 shares, respectively, of our common stock, which had an aggregate market value of $0.7 and $21.9, respectively,at the dates of acquisition.
In connection with a European acquisition completed during the first quarter of 2004, we established a reserve of $16.7for severance and other exit costs related to the acquired company. These expenses are being funded by the inflow ofcash that resulted from the acquisition. Since the date of the acquisition, there has been $15.9 paid from this reserve.
03.E A R N I N G S P E R S H A R E
During September 2004, the EITF issued EITF 04-8, which requires the effect of contingently convertible debt securitieswith a market price trigger to be included in the calculation of diluted earnings per share, using the “if-converted”method, regardless of whether the market price trigger has been met. EITF 04-8 also requires restatement of previouslyreported earnings. Our unsecured zero-coupon convertible debentures, issued August 17, 2001 have such a feature,and therefore we have restated Net Earnings Per Share-Diluted for all periods presented.
Net Earnings Per Share – Diluted restated for EITF 04-8 is as follows:
Year Ended December 31 2004 2003 2002
Net Earnings per Share – Diluted
As reported $ 2.59 $ 1.74 $ 1.46
Restated 2.59 1.69 1.42
The calculation of Net Earnings Per Share is as follows:
Year Ended December 31 2004 2003 2002
Net earnings available to common shareholders $ 245.7 $ 137.7 $ 113.2
Weighted-average common shares outstanding (in millions) 88.9 77.7 76.4
$ 2.76 $ 1.77 $ 1.48
The calculation of Net Earnings Per Share – Diluted is as follows:
Year Ended December 31 2004 2003 2002
Net earnings $ 245.7 $ 137.7 $ 113.2
Add: Amortization related to convertible debt, net of taxes 4.8 6.4 5.9
Net earnings available to common shareholders $ 250.5 $ 144.1 $ 119.1
Weighted-average common shares outstanding (in millions) 88.9 77.7 76.4
Effect of dilutive securities – stock options (in millions) 1.8 1.6 1.3
Effect of convertible debentures (in millions) 6.1 6.1 6.1
96.8 85.4 83.8
$ 2.59 $ 1.69 $ 1.42
N O T E S T O C O N S O L I D A T E D F I N A N C I A L S T A T E M E N T Si n m i l l i o n s , e x c e p t s h a r e a n d p e r s h a r e d a t a

2004 Annua l Repo r t M A N P O W E R I N C .72
The calculation of Net Earnings Per Share – Diluted for the years ended December 31, 2004, 2003 and 2002 does notinclude certain stock option grants because the exercise price for these options is greater than the average marketprice of the common shares during that year. The number, exercise prices and weighted-average remaining life of theseantidilutive options is as follows:
2 0 0 4 2 0 0 3 2 0 0 2
Shares (in thousands) 7 217 207
Exercise price ranges $48 - $49 $37- $44 $36 - $41
Weighted-average remaining life 9.1 years 7.3 years 5.6 years
04.I N C O M E T A X E S
The provision for income taxes consists of:
Year Ended December 31 2004 2003 2002
Current
United States:
Federal $ 29.9 $ 1.0 $ 3.4
State 3.7 0.7 (0.3)
Foreign 99.0 95.7 61.0
Total current 132.6 97.4 64.1
Deferred
United States:
Federal 12.0 (4.5) 8.0
State 0.9 0.3 0.7
Foreign (21.7) (8.8) 2.0
Total deferred (8.8) (13.0) 10.7
Total provision $ 123.8 $ 84.4 $ 74.8
A reconciliation between taxes computed at the United States Federal statutory tax rate of 35% and the consolidatedeffective tax rate is as follows:
Year Ended December 31 2004 2003 2002
Income tax based on statutory rate $ 129.3 $ 77.7 $ 65.8
Increase (decrease) resulting from:
Foreign tax rate differences 9.2 7.7 4.5
Tax effect of foreign earnings (12.2) (6.8) 0.7
Change in valuation reserve (1.1) 6.3 5.6
Reversal of tax contingency reserve (8.0) — —
Other, net 6.6 (0.5) (1.8)
Total provision $ 123.8 $ 84.4 $ 74.8
N O T E S T O C O N S O L I D A T E D F I N A N C I A L S T A T E M E N T Si n m i l l i o n s , e x c e p t s h a r e a n d p e r s h a r e d a t a

M A N P O W E R I N C . 2004 Annua l Repo r t73
Deferred income taxes are recorded on temporary differences at the tax rate expected to be in effect when the temporarydifferences reverse. Temporary differences, which gave rise to the deferred tax assets, are as follows:
Year Ended December 31 2004 2003
Current Future Income Tax Benef i ts
Accrued payroll taxes and insurance $ 15.9 $ 16.9
Employee compensation payable 23.6 20.6
Pension and postretirement benefits 4.7 13.6
Other 52.6 55.5
Valuation allowance (0.3) (5.2)
96.5 101.4
Noncurrent Future Income Tax Benef i ts
Accrued payroll taxes and insurance 36.1 27.4
Pension and postretirement benefits 34.3 30.6
Intangible assets (a) (131.5) —
Net operating losses and other 174.2 90.5
Valuation allowance (53.0) (28.9)
60.1 119.6
Total future tax benefits $ 156.6 $ 221.0
(a) See note 2 for further information.
The noncurrent future income tax benefits have been classified as Other Assets in the consolidated balance sheets.
We have U.S. Federal and foreign net operating loss carryforwards and U.S. state net operating loss carryforwardstotaling $291.6 and $176.0, respectively as of December 31, 2004. The net operating loss carryforwards expire as follows:
Year U.S. Federaland Fore ign U.S. State
2005 $ 0.4 $ 53.3
2006 1.4 15.2
2007 0.9 10.1
2008 2.5 10.7
2009 4.3 9.2
Thereafter 79.8 77.5
No expiration 202.3 —
Total net operating loss carryforwards $ 291.6 $ 176.0
We have recorded a deferred tax asset of $108.3 as of December 31, 2004, for the benefit of these net operatinglosses. Realization of this asset is dependent on generating sufficient taxable income prior to the expiration of the losscarryforwards. A valuation allowance of $53.3 has been recorded as of December 31, 2004, as management believesthat realization of certain loss carryforwards and other deferred tax assets is unlikely. During 2004, we reversed a $16.7valuation allowance on certain loss carryforwards that are expected to be utilized as a result of certain internal corporaterestructurings and transactions.
N O T E S T O C O N S O L I D A T E D F I N A N C I A L S T A T E M E N T Si n m i l l i o n s , e x c e p t s h a r e a n d p e r s h a r e d a t a

2004 Annua l Repo r t M A N P O W E R I N C .74
Pretax income of foreign operations was $170.9, $169.5, and $162.9 in 2004, 2003 and 2002, respectively. We havenot provided United States income taxes and foreign withholding taxes on $339.5 of unremitted earnings of foreignsubsidiaries that is considered to be reinvested indefinitely. Deferred taxes are provided on unremitted earnings offoreign subsidiaries when we determine that we may remit the earnings. As of December 31, 2004, we have recordeda deferred tax liability of $9.5 related to foreign earnings that may be remitted.
On October 22, 2004, the President signed the American Jobs Creation Act of 2004, (the “Jobs Act”). The JobsAct creates a temporary incentive for United States corporations to repatriate accumulated earnings from foreignsubsidiaries by providing an 85% dividends received deduction for certain dividends from controlled foreign corporations.The deduction is subject to a number of limitations and, as of today, uncertainty remains as to how to interpret numerousprovisions of the Jobs Act. Based on our analysis to date, we are not yet in a position to decide on whether, or to whatextent, we might repatriate foreign earnings under the provisions of the Jobs Act. However, we expect to be in a positionto finalize our assessment by June 2005.
We have tax contingencies recorded related to items in various countries, which are included in Other Long-TermLiabilities. These reserve balances will be adjusted to the extent that these items are settled for amounts different thanthe amounts we have recorded. In 2004, we received notification that income tax audits for certain years have beencompleted. Based on the results of these audits, we reversed a tax contingency of $8.0 to income in the third quarterof 2004 ($0.08 per diluted share).
05.A C C O U N T S R E C E I V A B L E S E C U R I T I Z A T I O N
We and certain of our U.S. subsidiaries have an agreement (the “Receivables Facility”) with a financial institutionwhereby we may transfer on a continuous basis an interest in all eligible trade accounts receivable. Pursuant to theReceivables Facility, we formed Ironwood Capital Corporation, a wholly owned, special purpose, bankruptcy-remotesubsidiary (“ICC”) that is fully consolidated in our financial statements. ICC was formed for the sole purpose oftransferring receivables that we and certain of our subsidiaries generate. Under the Receivables Facility, we and certainof our subsidiaries, irrevocably and without recourse, may transfer all of our accounts receivable to ICC. ICC, in turn,subject to certain conditions, may from time to time transfer an undivided interest in these receivables and is permittedto receive advances of up to $200.0 for the transfer of such undivided interest. The agreement was amended in July2004 to extend the expiration to July 2005 and it may be extended further with the financial institution’s consent.
Under the Receivables Facility, ICC has the ability to repurchase, in full or in part, the accounts receivable it transferred tothe third party. Therefore, transfers made do not qualify for sale accounting, and accordingly, the receivables transferredto the third party remain on our consolidated balance sheet with the corresponding advance being recorded as debt.No amounts were advanced under this facility as of December 31, 2004 and 2003.
Costs associated with the transfer of receivables primarily relate to the discount and fees associated with the amountsadvanced. Such costs were $0.4 in each of 2004, 2003, and 2002 respectively, and were recorded as other expensesin the consolidated statements of operations.
N O T E S T O C O N S O L I D A T E D F I N A N C I A L S T A T E M E N T Si n m i l l i o n s , e x c e p t s h a r e a n d p e r s h a r e d a t a

M A N P O W E R I N C . 2004 Annua l Repo r t75
06.G O O D W I L L
Changes in the carrying value of goodwill by reportable segment are as follows:
Jefferson OtherUnited States EMEA Wel ls Right Operat ions Tota l
Balance, December 31, 2002 $ 79.8 $ 177.2 $ 149.9 $ 67.2 $ 44.6 $ 518.7
Goodwill acquired throughoutthe year 1.3 1.8 — 2.6 — 5.7
Currency impact and other — 17.2 — (7.9) 6.8 16.1
Balance, December 31, 2003 81.1 196.2 149.9 61.9 51.4 540.5
Goodwill acquired throughout the year — 3.2 — 389.6 1.0 393.8
Currency impact and other — 15.8 (1.0) (0.6) 1.4 15.6
Balance, December 31, 2004 $ 81.1 $ 215.2 $ 148.9 $ 450.9 $ 53.8 $ 949.9
There were no significant reductions to goodwill as a result of dispositions during 2004 or 2003.
07.D E B T
Information concerning Short-Term Borrowings is as follows:
December 31 2004 2003
Short-term borrowings $ 10.1 $ 5.3
Weighted-average interest rates 7.0% 6.0%
We maintain separate bank facilities with foreign financial institutions to meet working capital needs of our foreign oper-ations. As of December 31, 2004, such facilities totaled $295.0, of which $284.9 was unused. We have no significantcompensating balance requirements or commitment fees related to these lines.
A summary of Long-Term Debt is as follows:
December 31 2004 2003
Zero-coupon convertible debentures $ 265.3 $ 257.6
Euro-denominated notes due July 2006 271.1 251.9
Euro-denominated notes due March 2005 203.7 191.1
Revolving credit agreement:
Euro-denominated borrowings, at a rate of 3.0%, and 3.3%, respectively 135.5 126.0
Other 16.1 9.8
891.7 836.4
Less – current maturities 215.6 6.8
Long-term debt $ 676.1 $ 829.6
N O T E S T O C O N S O L I D A T E D F I N A N C I A L S T A T E M E N T Si n m i l l i o n s , e x c e p t s h a r e a n d p e r s h a r e d a t a
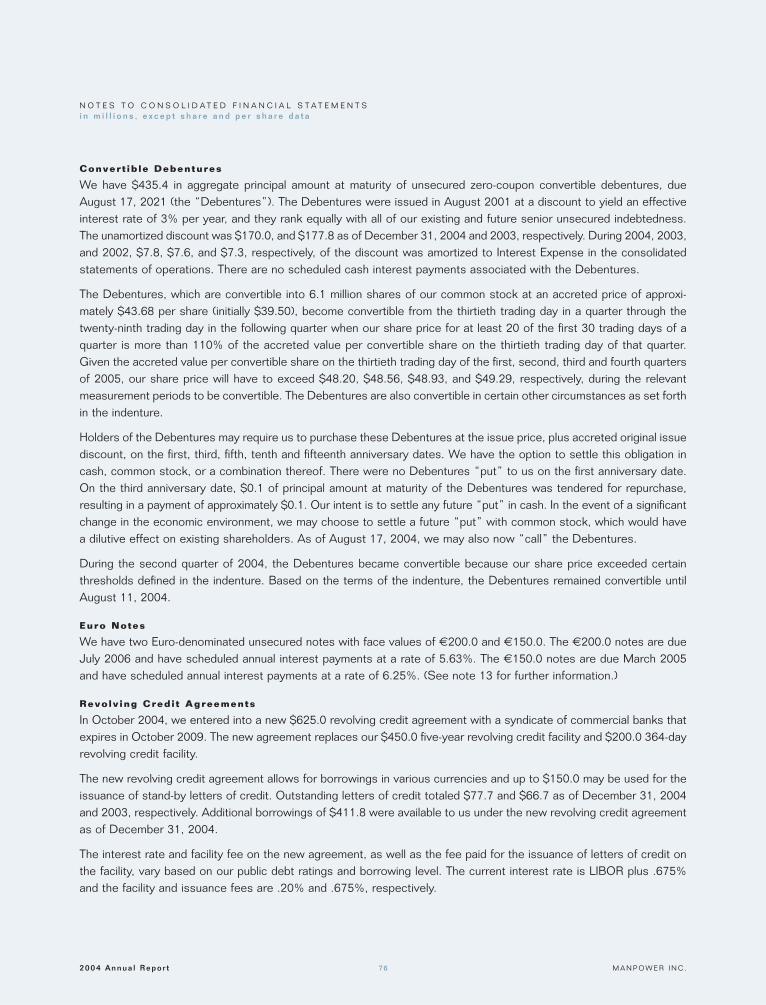
2004 Annua l Repo r t M A N P O W E R I N C .76
Convert ib le Debentures
We have $435.4 in aggregate principal amount at maturity of unsecured zero-coupon convertible debentures, dueAugust 17, 2021 (the “Debentures”). The Debentures were issued in August 2001 at a discount to yield an effectiveinterest rate of 3% per year, and they rank equally with all of our existing and future senior unsecured indebtedness.The unamortized discount was $170.0, and $177.8 as of December 31, 2004 and 2003, respectively. During 2004, 2003,and 2002, $7.8, $7.6, and $7.3, respectively, of the discount was amortized to Interest Expense in the consolidatedstatements of operations. There are no scheduled cash interest payments associated with the Debentures.
The Debentures, which are convertible into 6.1 million shares of our common stock at an accreted price of approxi-mately $43.68 per share (initially $39.50), become convertible from the thirtieth trading day in a quarter through thetwenty-ninth trading day in the following quarter when our share price for at least 20 of the first 30 trading days of aquarter is more than 110% of the accreted value per convertible share on the thirtieth trading day of that quarter.Given the accreted value per convertible share on the thirtieth trading day of the first, second, third and fourth quartersof 2005, our share price will have to exceed $48.20, $48.56, $48.93, and $49.29, respectively, during the relevantmeasurement periods to be convertible. The Debentures are also convertible in certain other circumstances as set forthin the indenture.
Holders of the Debentures may require us to purchase these Debentures at the issue price, plus accreted original issuediscount, on the first, third, fifth, tenth and fifteenth anniversary dates. We have the option to settle this obligation incash, common stock, or a combination thereof. There were no Debentures “put” to us on the first anniversary date.On the third anniversary date, $0.1 of principal amount at maturity of the Debentures was tendered for repurchase,resulting in a payment of approximately $0.1. Our intent is to settle any future “put” in cash. In the event of a significantchange in the economic environment, we may choose to settle a future “put” with common stock, which would havea dilutive effect on existing shareholders. As of August 17, 2004, we may also now “call” the Debentures.
During the second quarter of 2004, the Debentures became convertible because our share price exceeded certainthresholds defined in the indenture. Based on the terms of the indenture, the Debentures remained convertible untilAugust 11, 2004.
Euro Notes
We have two Euro-denominated unsecured notes with face values of €200.0 and €150.0. The €200.0 notes are dueJuly 2006 and have scheduled annual interest payments at a rate of 5.63%. The €150.0 notes are due March 2005and have scheduled annual interest payments at a rate of 6.25%. (See note 13 for further information.)
Revolv ing Credi t Agreements
In October 2004, we entered into a new $625.0 revolving credit agreement with a syndicate of commercial banks thatexpires in October 2009. The new agreement replaces our $450.0 five-year revolving credit facility and $200.0 364-dayrevolving credit facility.
The new revolving credit agreement allows for borrowings in various currencies and up to $150.0 may be used for theissuance of stand-by letters of credit. Outstanding letters of credit totaled $77.7 and $66.7 as of December 31, 2004and 2003, respectively. Additional borrowings of $411.8 were available to us under the new revolving credit agreementas of December 31, 2004.
The interest rate and facility fee on the new agreement, as well as the fee paid for the issuance of letters of credit onthe facility, vary based on our public debt ratings and borrowing level. The current interest rate is LIBOR plus .675%and the facility and issuance fees are .20% and .675%, respectively.
N O T E S T O C O N S O L I D A T E D F I N A N C I A L S T A T E M E N T Si n m i l l i o n s , e x c e p t s h a r e a n d p e r s h a r e d a t a
M A N P O W E R I N C . 2004 Annua l Repo r t77
The new agreement requires, among other things, that we comply with a Debt-to-EBITDA ratio of less than 3.25 to 1and a fixed charge ratio of greater than 2.00 to 1. As defined in the agreement, we had a Debt-to-EBITDA ratio of 1.84to 1 and a Fixed Charge Ratio of 2.69 to 1 as of December 31, 2004.
There were no borrowings outstanding under our commercial paper program at December 31, 2004 and 2003, respectively.
Swap Agreements
We have entered into various interest rate swap agreements to manage the interest rate and currency risk associatedwith our debt instruments. (See note 13 for further information.)
Fair Value of Debt
The carrying value of Long-Term Debt approximates fair value, except for the Euro-denominated notes and theDebentures, which had a fair value, as determined by quoted market prices, as of December 31, as follows:
2004 2003
Euro-denominated notes $ 486.1 $ 456.7Zero-coupon convertible debentures 299.8 303.2
Debt Matur i t ies
The maturities of Long-Term Debt payable within each of the four years subsequent to December 31, 2005 are asfollows: 2006 – $539.0, 2007 – $0.6, 2008 – $1.0, 2009 – $135.5, and none thereafter.
08.S T O C K C O M P E N S A T I O N P L A N S
In April 2003, our shareholders approved the 2003 Equity Incentive Plan of Manpower Inc. (“2003 Plan”) which authorized4,500,000 shares for grant. Under this plan, all of our full-time employees and non-employee directors are eligible toreceive stock options, stock appreciation rights, restricted stock and deferred stock. As of December 31, 2004, wehad approximately 3,353,000 shares of common stock remaining available for grant under this plan. As a result of theadoption of this plan, we no longer make any grants under our 1994 Executive Stock Option and Restricted Stock Plan.
Awards may be granted under the plan to eligible employees at the discretion of the plan administrator, which may be theBoard of Directors or a committee of the Board of Directors. All options and stock appreciation rights are granted at aprice determined by the administrator, not less than 100% of the fair market value of the common stock at the date ofgrant. The administrator also determines the period during which options and stock appreciation rights are exercisable andwhen restricted stock vests. Generally, options are granted with a vesting period of up to four years and expire ten yearsfrom the date of grant. As of December 31, 2004, no stock appreciation rights had been granted or were outstanding.
Under the current compensation arrangement, all of our non-employee directors may elect to receive deferred stock inlieu of the portion of the annual cash retainer as to which there was not an election in effect as of July 29, 2003 underthe prior compensation arrangement. Non-employee directors who were in office prior to July 29, 2003 for whom anelection was not in effect through November 4, 2006 will continue to have the right to elect to receive an option topurchase shares of our common stock under the prior compensation arrangement, with respect to a portion of theannual cash retainer through November 2006. The number of shares of deferred stock is determined pursuant to aformula set forth in the terms and conditions adopted under the 2003 Plan and the number of shares covered by theoption are determined in accordance with the terms of the prior compensation arrangement. Deferred stock is settledin shares of common stock following the directors’ termination from the board. Non-employee directors also receivean annual option grant as additional compensation for board service. The per share purchase price for each optionawarded is equal to the fair market value of our common stock at the date of grant. Options are exercisable for thevested portion during the director’s tenure and a limited period thereafter.
N O T E S T O C O N S O L I D A T E D F I N A N C I A L S T A T E M E N T Si n m i l l i o n s , e x c e p t s h a r e a n d p e r s h a r e d a t a

2004 Annua l Repo r t M A N P O W E R I N C .78
The value of restricted stock granted is charged to equity and amortized to expense over the restriction period. Therewere 41,000 and 66,500 restricted shares granted during 2004 and 2003, respectively. During 2004, 2003, and 2002we recognized $0.9, $0.5, and $0.1, respectively, of expense, net of tax, related to restricted stock grants. As ofDecember 31, 2004 there were 97,000 restricted shares that had not vested.
In addition to the stock option plan discussed above, we have the Savings Related Share Option Scheme for UnitedKingdom employees with at least one year of service. As of December 31, 2004, there were approximately 918,000shares of common stock remaining available for grant under this plan. The employees are offered the opportunity toobtain an option for a specified number of shares of common stock at not less than 85% of its market value on the dayprior to the offer to participate in the plan. Options vest after either three, five or seven years, but may lapse earlier.Funds used to purchase the shares are accumulated through specified payroll deductions over a 60-month period.
Information related to options outstanding under our plans, and the related weighted-average exercise prices is as follows:
December 31 2004 2003 2002
Shares (000) Pr ice Shares (000) Pr ice Shares (000) Pr ice
Options outstanding, beginning of period 5,064 $ 31 5,641 $ 29 5,437 $ 26
Granted 1,243 43 982 32 1,645 34
Assumed in RMC acquisition(a) 1,962 18 — — — —
Exercised (2,542) 21 (1,345) 23 (1,211) 21
Expired or cancelled (470) 40 (214) 32 (230) 36
Options outstanding, end of period 5,257 $ 33 5,064 $ 31 5,641 $ 29
Options exercisable, end of period 2,925 $ 31 3,008 $ 31 2,991 $ 27
(a) See note 2 for further information.
Options outstanding and exercisable as of December 31, 2004 are as follows:
Options Opt ionsOutstanding Exerc isable
Weighted-Average Weighted- Weighted-
Remaining Average AverageContractual Exerc ise Exerc ise
Exerc ise Pr ice Shares (000) Li fe Pr ice Shares (000) Pr ice
$ 7 – $29 783 4.6 $ 23 718 $ 23
30 – 33 1,652 6.9 31 1,045 31
34 1,371 6.9 34 670 34
35 – 49 1,451 8.3 41 492 39
5,257 6.9 $ 33 2,925 $ 31
Other Stock Plans
We have reserved 2,250,000 shares of common stock for issuance under the 1990 Employee Stock Purchase Plan,of which 340,000 shares remained available for future issuance as of December 31, 2004. Under the plan, designatedManpower employees meeting certain service requirements may purchase shares of our common stock through payrolldeductions. These shares may be purchased at the lesser of 85% of their fair market value at the beginning or end ofeach year. During 2004, 2003, and 2002, employees purchased 92,000, 193,000, and 136,000 shares, respectively,under the plan.
N O T E S T O C O N S O L I D A T E D F I N A N C I A L S T A T E M E N T Si n m i l l i o n s , e x c e p t s h a r e a n d p e r s h a r e d a t a
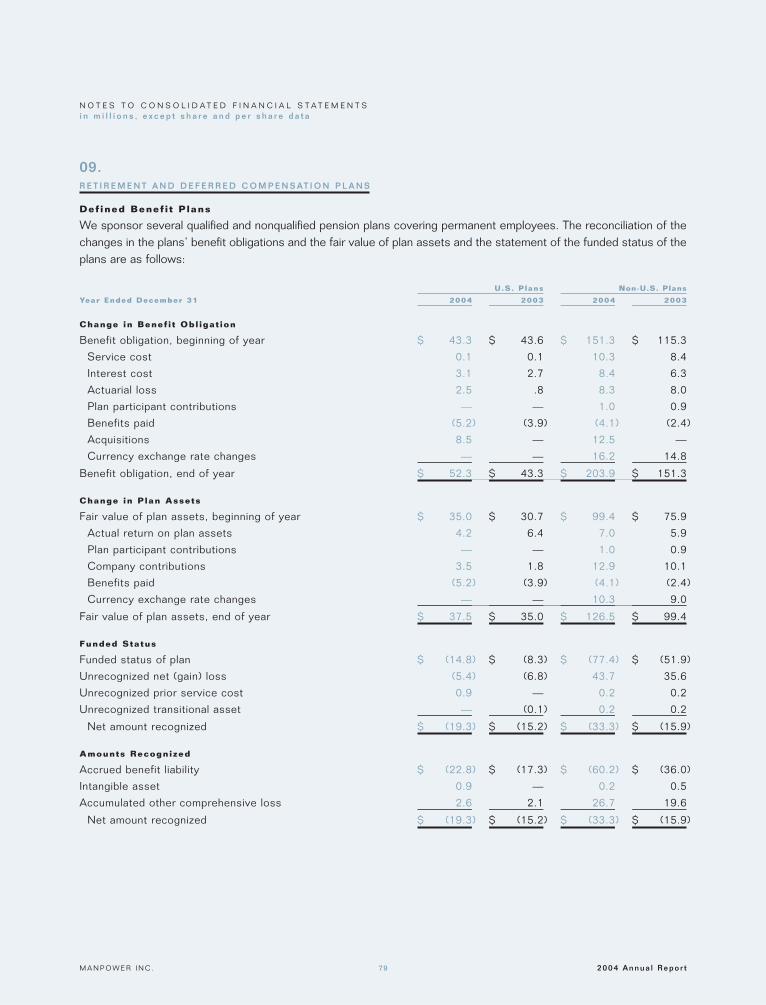
M A N P O W E R I N C . 2004 Annua l Repo r t79
09.R E T I R E M E N T A N D D E F E R R E D C O M P E N S A T I O N P L A N S
Def ined Benef i t P lans
We sponsor several qualified and nonqualified pension plans covering permanent employees. The reconciliation of thechanges in the plans’ benefit obligations and the fair value of plan assets and the statement of the funded status of theplans are as follows:
U.S. Plans Non-U.S. Plans
Year Ended December 31 2004 2003 2004 2003
Change in Benef i t Obl igat ion
Benefit obligation, beginning of year $ 43.3 $ 43.6 $ 151.3 $ 115.3
Service cost 0.1 0.1 10.3 8.4
Interest cost 3.1 2.7 8.4 6.3
Actuarial loss 2.5 .8 8.3 8.0
Plan participant contributions — — 1.0 0.9
Benefits paid (5.2) (3.9) (4.1) (2.4)
Acquisitions 8.5 — 12.5 —
Currency exchange rate changes — — 16.2 14.8
Benefit obligation, end of year $ 52.3 $ 43.3 $ 203.9 $ 151.3
Change in Plan Assets
Fair value of plan assets, beginning of year $ 35.0 $ 30.7 $ 99.4 $ 75.9
Actual return on plan assets 4.2 6.4 7.0 5.9
Plan participant contributions — — 1.0 0.9
Company contributions 3.5 1.8 12.9 10.1
Benefits paid (5.2) (3.9) (4.1) (2.4)
Currency exchange rate changes — — 10.3 9.0
Fair value of plan assets, end of year $ 37.5 $ 35.0 $ 126.5 $ 99.4
Funded Status
Funded status of plan $ (14.8) $ (8.3) $ (77.4) $ (51.9)
Unrecognized net (gain) loss (5.4) (6.8) 43.7 35.6
Unrecognized prior service cost 0.9 — 0.2 0.2
Unrecognized transitional asset — (0.1) 0.2 0.2
Net amount recognized $ (19.3) $ (15.2) $ (33.3) $ (15.9)
Amounts Recognized
Accrued benefit liability $ (22.8) $ (17.3) $ (60.2) $ (36.0)
Intangible asset 0.9 — 0.2 0.5
Accumulated other comprehensive loss 2.6 2.1 26.7 19.6
Net amount recognized $ (19.3) $ (15.2) $ (33.3) $ (15.9)
N O T E S T O C O N S O L I D A T E D F I N A N C I A L S T A T E M E N T Si n m i l l i o n s , e x c e p t s h a r e a n d p e r s h a r e d a t a

2004 Annua l Repo r t M A N P O W E R I N C .80
The measurement dates for our U.S. plans are primarily September 30 and for our non-U.S. plans are December 31.
The accumulated benefit obligation for our plans that have plan assets was $181.8 and $145.6 as of December 31,2004 and 2003, respectively. The accumulated benefit obligation for certain of these plans exceeded the fair value ofplan assets as follows:
December 31 2004 2003
Projected benefit obligation $ 147.1 $ 115.9
Accumulated benefit obligation 128.7 99.3
Plan assets 101.4 79.4
By their nature, certain of our plans do not have plan assets. The accumulated benefit obligation for these plans was$42.8 and $20.0 as of December 31, 2004 and 2003, respectively.
The components of the net periodic benefit cost for all plans are as follows:
Year Ended December 31 2004 2003 2002
Service cost $ 10.4 $ 8.5 $ 7.7
Interest cost 11.5 9.0 8.3
Expected return on assets (9.0) (7.5) (7.1)
Amortization of:
unrecognized loss 2.5 2.4 0.1
unrecognized prior service cost 0.3 — —
unrecognized transitional asset (0.1) (0.1) (0.2)
Total benefit cost $ 15.6 $ 12.3 $ 8.8
The weighted-average assumptions used in the measurement of the benefit obligation are as follows:
U.S. Plans Non - U.S. Plans
Year Ended December 31 2004 2003 2004 2003
Discount rate 5.9% 6.3% 4.9% 5.1%
Rate of compensation increase 4.5% 4.5% 3.7% 3.8%
The weighted-average assumptions used in the measurement of the net periodic benefit cost are as follows:
U.S. Plans Non - U.S. Plans
Year Ended December 31 2004 2003 2002 2004 2003 2002
Discount rate 6.3% 6.5% 7.5% 5.1% 5.3% 5.4%
Expected long-term return on plan assets 8.5% 8.5% 8.5% 5.7% 6.1% 6.1%
Rate of compensation increase 4.5% 5.0% 6.0% 3.8% 3.7% 4.1%
Our overall expected long-term rate of return on U.S. plan assets is 8.5%. Our overall expected long-term rate of returnon our non-U.S. plans varies by country and ranges from 1.3% to 7.0%. For a majority of our plans, a building blockapproach has been employed to establish this return. Historical markets are studied and long-term historical relationshipsbetween equity securities and fixed income instruments are preserved consistent with the widely accepted capital marketprinciple that assets with higher volatility generate a greater return over time. Current market factors such as inflationand interest rates are evaluated before long-term capital market assumptions are determined. The long-term portfolioreturn is established via a building block approach with proper consideration of diversification and rebalancing. We alsouse guaranteed insurance contracts for one of our foreign plans. Peer data and historical returns are reviewed to checkfor reasonableness and appropriateness of our expected rate of return.
N O T E S T O C O N S O L I D A T E D F I N A N C I A L S T A T E M E N T Si n m i l l i o n s , e x c e p t s h a r e a n d p e r s h a r e d a t a

M A N P O W E R I N C . 2004 Annua l Repo r t81
Projected salary levels utilized in the determination of the projected benefit obligation for the pension plans are basedupon historical experience. The unrecognized transitional assets are being amortized over the estimated remainingservice lives of the employees.
We generally use an external investment manager to assist us in establishing our investment strategies and policies.Our long-term objective is to minimize plan expenses and contributions by outperforming plan liabilities. We havehistorically used a balanced portfolio strategy based primarily on a target allocation of equity securities and fixed-incomeinstruments, which vary by location. These target allocations, which are similar to the 2004 allocations, are determinedbased on the favorable risk tolerance characteristics of the plan and, at times, may be adjusted within a specified rangeto advance our overall objective.
The weighted-average asset allocations of our plans as of December 31 are as follows:
2004 2003
Asset Category
Equity securities 40.3% 42.4%
Fixed-income securities 43.2% 40.3%
Cash and other 16.5% 17.3%
Plan assets are primarily comprised of domestic and foreign equity securities, professionally-managed equity and bondfunds, government and agency securities, and guaranteed insurance contracts. None of our plan assets include any ofour debt or equity securities.
Ret iree Heal th Care Plan
We provide medical and dental benefits to certain eligible retired employees in the United States. Due to the nature ofthe plan, there are no plan assets. The reconciliation of the changes in the plan’s benefit obligation and the statementof the funded status of the plan are as follows:
Year Ended December 31 2004 2003
Benefit obligation, beginning of year $ 21.6 $ 20.6
Service cost 0.4 0.4
Interest cost 1.3 1.3
Actuarial loss 1.3 0.3
Benefits paid (1.1) (1.0)
Benefit obligation, end of year 23.5 21.6
Unrecognized net gain 5.0 6.8
Accrued liability recognized $ 28.5 $ 28.4
N O T E S T O C O N S O L I D A T E D F I N A N C I A L S T A T E M E N T Si n m i l l i o n s , e x c e p t s h a r e a n d p e r s h a r e d a t a
2004 Annua l Repo r t M A N P O W E R I N C .82
We use a December 31 measurement date for this plan. The discount rate used in the measurement of the benefitobligation was 5.8% and 6.3% in 2004 and 2003, respectively. The discount rate used in the measurement of net periodicbenefit cost was 6.3%, 6.5%, and 7.5% in 2004, 2003 and 2002, respectively. The components of net periodic benefitcost for this plan are as follows:
Year Ended December 31 2004 2003 2002
Service cost $ 0.4 $ 0.4 $ 0.3
Interest cost 1.3 1.3 1.3
Amortization of unrecognized gain (0.5) (0.6) (1.0)
$ 1.2 $ 1.1 $ 0.6
The health care cost trend rate was assumed to be 10.0% for 2004, decreasing gradually to 5.5% for the years 2009and beyond. Assumed health care cost trend rates have a significant effect on the amounts reported. A one-percentagepoint change in the assumed health care cost trend rate would have the following effects:
1% Increase 1% Decrease
Effect on total of service and interest cost components $ 0.2 $ (0.2)
Effect on postretirement benefit obligation 3.2 (2.8)
Plan Contr ibut ions and Benef i t Payments
We plan to contribute $17.9 to our defined benefit plans and $1.2 to our retiree health care plan in 2005. Projectedbenefit payments from the plans as of December 31, 2004 are estimated as follows:
Year Pension Ret i reePlans Heal th
2005 $ 7.4 $ 1.2
2006 7.5 1.2
2007 8.2 1.2
2008 8.0 1.3
2009 8.5 1.3
2010-2014 51.3 7.6
Def ined Contr ibut ion Plans
We have defined contribution plans covering substantially all permanent United States employees and various otheremployees throughout the world. Employees may generally elect to contribute a portion of their salary to the plans and wematch a portion of their contribution up to a maximum percentage of the employee’s salary. In addition, profit sharingcontributions are made to certain U.S. plans if a targeted earnings level is reached in the United States. The total expensefor our match and any profit sharing contributions was $14.2, $7.9, and $6.9 for 2004, 2003, and 2002, respectively.
Deferred Compensat ion Plans
In February 2004, we established the Senior Management Performance-Based Deferred Compensation Plan. The planis intended to focus our corporate executives on the achievement of certain annual operating goals, shareholder valuecreation, and execution of our business strategies over the longer term by aligning company executives’ interests withshareholders’ interests. Under the plan, incentives are focused on improving our Net Earnings Per Share – Diluted andeconomic profit. Participation in the plan is determined annually by a Committee of the Board of Directors. Deferredcompensation benefits are earned by participants for the plan year based on our attainment of certain established goals
N O T E S T O C O N S O L I D A T E D F I N A N C I A L S T A T E M E N T Si n m i l l i o n s , e x c e p t s h a r e a n d p e r s h a r e d a t a

M A N P O W E R I N C . 2004 Annua l Repo r t83
and any deferred benefits earn interest based on the effective yield on a fixed 10-year U.S. Treasury note at the beginningof each year. Participants become vested in the deferred benefits if they are still employed by Manpower when theyreach age 50 with 15 years of service, when they reach age 62, or in certain other circumstances. As of December 31,approximately $1.2 million has been earned under this plan.
We also maintain a non-qualified deferred compensation plan for certain employees at RMC. Under the plan, participantsmay defer from their pre-tax income, payments of up to a maximum of 15% of their total compensation. A matchingcontribution is made of 25% of the participating employees’ contributions to the plan. Additional contributions are madeto the plan if certain internal financial targets are met. In 2004, no additional contributions were made to the plan. Contributionsvest at 33.3% over a three-year period from the employee’s date of hire. Our contributions were $0.2 for 2004.
10.A C C U M U L A T E D O T H E R C O M P R E H E N S I V E I N C O M E ( L O S S )
The components of Accumulated Other Comprehensive Income (Loss), net of tax, are as follows:
December 31 2004 2003 2002
Foreign currency translation $ 133.6 $ 47.3 $ (99.5)
Unrealized gain (loss) on investments 4.7 1.3 (3.5)
Unrealized loss on derivatives (11.4) (8.9) (12.3)
Minimum pension liability adjustment (17.5) (11.4) (8.4)
$ 109.4 $ 28.3 $ (123.7)
11.L E A S E S
We lease property and equipment primarily under operating leases. Renewal options exist for substantially all leases.Future minimum payments, by year and in the aggregate, under noncancelable operating leases with any remaining termconsist of the following as of December 31, 2004:
Year
2005 $ 172.1
2006 136.0
2007 95.2
2008 67.2
2009 49.4
Thereafter 92.5
Total minimum lease payments $ 612.4
Rental expense for all operating leases was $215.7, $167.2, and $148.3 for the years ended December 31, 2004,2003, and 2002, respectively.
N O T E S T O C O N S O L I D A T E D F I N A N C I A L S T A T E M E N T Si n m i l l i o n s , e x c e p t s h a r e a n d p e r s h a r e d a t a
2004 Annua l Repo r t M A N P O W E R I N C .84
12.I N T E R E S T A N D O T H E R E X P E N S E
Interest and Other Expense consists of the following:
Year Ended December 31 2004 2003 2002
Interest expense $ 45.4 $ 41.4 $ 42.4
Interest income (9.4) (8.0) (9.0)
Foreign exchange gains (1.6) (1.3) (1.8)
Fees and loss on sale of accounts receivable 0.4 0.4 0.4
Miscellaneous (income) expense, net (8.5) 3.3 14.8
Interest and other expense $ 26.3 $ 35.8 $ 46.8
Miscellaneous (Income) Expense, Net in 2004, includes non-operating gains of $14.2, primarily related to the sale ofour equity interest in a European internet job board. In 2002, Miscellaneous Expenses included a charge of $5.1 relatedto a writedown of equity security investments where the decline in market value was determined to be other-than-temporary, as defined by SFAS 115.
13.D E R I V A T I V E F I N A N C I A L I N S T R U M E N T S
Foreign Currency Exchange Rate Risk Management
In certain circumstances, we enter into foreign currency forward exchange contracts to reduce the effects of fluctuatingforeign currency exchange rates on cash flows with foreign subsidiaries. All such contracts entered into during 2004 and2003 were designated as cash flow hedges and were considered highly effective, as defined by SFAS 133, as amended.As of December 31, 2004, there were no forward contracts outstanding. As of December 31, 2003, there were twoforward contracts outstanding totaling $24.7 relating to cash flows to be received from our foreign subsidiaries, bothof which were designated as cash flow hedges and were considered highly effective as of December 31, 2003.
Our revolving credit agreement borrowings of €100.0 ($135.5) and the €200.0 ($271.1) unsecured notes, havebeen designated and are effective as economic hedges of our net investment in our foreign subsidiaries with a Euro-functional currency. Therefore, all translation gains or losses related to these borrowings are recorded as a componentof Accumulated Other Comprehensive Income.
During September 2002, we entered into derivative financial instruments to swap our €150.0 ($203.7) unsecurednotes, at 6.25% due March 2005, to floating U.S. LIBOR, with a current effective interest rate of 4.64%. These instrumentsexpire in March 2005. Gains and losses arising from foreign exchange fluctuations throughout the contract term on thederivative instruments are recorded in the consolidated statements of operations, offsetting the foreign exchange gainor loss recorded on the notes.
Interest Rate Risk Management
Our exposure to market risk for changes in interest rates relates primarily to our Long-Term Debt obligations. We havehistorically managed interest rates through the use of a combination of fixed and variable rate borrowings and interestrate swap agreements.
As previously mentioned, we entered into derivative instruments to swap our €150.0 ($203.7) unsecured notes, at6.25% due March 2005, to floating U.S. LIBOR, with a current effective interest rate of 4.64%. We designated theseinterest rate swaps as a fair value hedge, offsetting changes in the fair value of the notes that are due to interest rate
N O T E S T O C O N S O L I D A T E D F I N A N C I A L S T A T E M E N T Si n m i l l i o n s , e x c e p t s h a r e a n d p e r s h a r e d a t a

M A N P O W E R I N C . 2004 Annua l Repo r t85
fluctuations. Changes in the fair value hedge and the fair value of the notes throughout the contract term will be reflectedin the consolidated statements of operations. These instruments had a $4.7 favorable impact on interest expense in2004, a $5.0 favorable impact in 2003, and an immaterial impact in 2002. Any ineffectiveness on the swaps is recordedin the consolidated statements of operations and was immaterial for 2004, 2003, and 2002.
We have various interest rate swap agreements to fix our interest costs on a portion of our Euro-denominated variablerate borrowings. The Euro interest rate swap agreements have a notional value of €100.0 ($135.5), which fix the interestrate, on a weighted-average basis, at 5.7% and expire in 2010. Such contracts have been designated as cash flowhedges and were considered highly effective, as defined by SFAS 133, as amended, as of December 31, 2004. Forthe years ended December 31, 2004, 2003 and 2002 these instruments increased interest expense by $4.6, $3.9, and$2.3, respectively.
During March 2003, we terminated our interest rate swap agreement with a notional value of ¥4,000.0 ($34.0), whichwas scheduled to expire in June 2003 for $0.1. In September 2003, we terminated our interest rate swap agreementwith a notional value of ¥4,150.0 ($36.1), which was scheduled to expire in 2006 for $0.5.
Fair Value of Der ivat ive F inancia l Instruments
The fair value of our derivative financial instruments are reflected in the consolidated balance sheets as follows:
December 31 2004 2003
Other assets:
€150.0 Swaps $ 64.5 $ 52.0
Other long-term liabilities:
€100.0 Interest Rate Swaps (18.4) (14.4)
Forward contracts — (0.4)
$ 46.1 $ 37.2
14.C O N T I N G E N C I E S
Li t igat ion
We are involved in a number of lawsuits arising in the ordinary course of business which will not, in the opinion of man-agement, have a material effect on our consolidated financial statements.
A search warrant was executed on November 30, 2004, at our French headquarters authorizing the French RegionalDirector on Inquiries of Competition to enter the office and review and obtain documents that may be pertinent to theinvestigation. According to the search warrant, the investigation stems from a complaint submitted during 2003 tothe European Commission and subsequently transferred to France’s Direction Generale de la Concurrence, de laConsommation et de la Repression des Fraudes. We understand that the purpose of the investigation is to search forevidence of price fixing and allocation of market share within the French market. The investigation is continuing, and wecurrently are not able to predict the outcome.
Guarantees
We have entered into certain guarantee contracts and stand-by letters of credit that total $115.3 ($37.6 for guaranteesand $77.7 for stand-by letters of credit). The guarantees primarily relate to indebtedness, bank accounts and leases.The stand-by letters of credit relate to workers’ compensation, operating leases and indebtedness. If certain conditions weremet under these arrangements, we would be required to satisfy our obligation in cash. Due to the nature of these arrange-ments and our historical experience, we do not expect to make any significant payments under these arrangements.
N O T E S T O C O N S O L I D A T E D F I N A N C I A L S T A T E M E N T Si n m i l l i o n s , e x c e p t s h a r e a n d p e r s h a r e d a t a

2004 Annua l Repo r t M A N P O W E R I N C .86
15.S E G M E N T D A T A
We are organized and managed primarily on a geographic basis, with the exception of Jefferson Wells and Right, whichare operated as separate global business units. Each country and business unit primarily has its own distinct operations,is managed locally by its own management team and maintains its own financial reports. Each operation reports directly,or indirectly through a regional manager, to a member of executive management. Given this reporting structure, all of ouroperations have been segregated into the following segments: United States; France; EMEA (Europe, Middle East andAfrica, excluding France); Jefferson Wells; Right (including the Empower Group); and Other Operations.
Historically, the results of Jefferson Wells and the Empower Group have been included in the Other Operations segment.Prior year results have been reclassified to conform to the current year presentation.
The United States, France, EMEA, and Other Operations segments derive a significant majority of their revenues fromthe placement of temporary workers. The remaining revenues within these segments are derived from other humanresource services, including permanent employee recruitment, temporary and permanent employee testing, selection,and training and development. Jefferson Wells’ revenues are derived from internal audit and controls, technology riskmanagement, tax, financial and accounting services. The Right segment revenues are derived from career transition(outplacement) services and organizational consulting services. Segment revenues represent sales to external customersprimarily within a single segment. Due to the nature of our business, we do not have export or intersegment sales. Weprovide services to a wide variety of customers, none of which individually comprise a significant portion of revenue for usas a whole, however approximately 19% of Jefferson Wells’ revenues for 2004 were generated from providing servicesto one customer.
The accounting policies of the segments are the same as those described in the summary of significant accounting policies.We evaluate performance based on Operating Unit Profit, which is equal to segment revenues less direct costs andbranch and national headquarters operating costs. This profit measure does not include interest and other income andexpense amounts or income taxes. Total assets for the segments are reported after the elimination of investments insubsidiaries and intercompany accounts. Corporate Assets include the Goodwill and Intangible Assets related to ouracquisitions of Jefferson Wells and RMC as this presentation is consistent with how segment assets are evaluated.
N O T E S T O C O N S O L I D A T E D F I N A N C I A L S T A T E M E N T Si n m i l l i o n s , e x c e p t s h a r e a n d p e r s h a r e d a t a

M A N P O W E R I N C . 2004 Annua l Repo r t87
Year Ended December 31 2004 2003 2002
Revenues from Serv ices (a)
United States (b) $ 2,041.1 $ 1,945.8 $ 1,911.4
France 5,226.7 4,638.8 3,848.2
EMEA 5,084.3 3,920.2 3,434.9
Jefferson Wells 340.6 136.4 141.7
Right (c) 431.1 66.9 54.4
Other Operations 1,806.2 1,476.4 1,220.3
$ 14,930.0 $ 12,184.5 $ 10,610.9
Operat ing Uni t Prof i t
United States $ 49.3 $ 33.7 $ 29.2
France 178.8 184.0 143.6
EMEA 115.1 51.7 83.0
Jefferson Wells 51.4 (9.9) (8.3)
Right 24.5 (2.3) (4.5)
Other Operations 46.0 40.1 19.4
465.1 297.3 262.4
Corporate expenses 57.0 39.4 27.5
Amortization of intangible assets 12.3 — 0.1
Interest and other expense 26.3 35.8 46.8
Earnings before income taxes $ 369.5 $ 222.1 $ 188.0
Depreciat ion and Amort izat ion Expense
United States $ 7.3 $ 8.9 $ 10.9
France 17.9 19.4 16.5
EMEA 23.6 26.0 26.9
Jefferson Wells 2.2 2.3 3.2
Right 14.7 1.0 0.8
Other Operations 8.5 6.8 7.0
$ 74.2 $ 64.4 $ 65.3
Earnings f rom Investments in L icensees
United States $ 0.8 $ (0.7) $ (0.2)
France (0.3) — —
EMEA 0.6 6.3 3.5
Other Operations (0.5) — (0.4)
$ 0.6 $ 5.6 $ 2.9
(a) Supplemental geographic information is as follows:
Revenues from Services: 2004 2003 2002
United States $ 2,542.7 $ 2,092.4 $ 2,063.9
France 5,258.4 4,638.8 3,848.2
United Kingdom 1,791.5 1,371.8 1,287.4
Total Foreign 12,387.3 10,092.1 8,547.0
(b) U.S. revenues above represent revenues from our Company-owned branches and franchise fees received from our franchise operations. These fees are primarilybased on revenues generated by our franchise operations, which are discussed further on the financial highlights page.
(c) Represents the operations of Right Management Consultants, Inc., since its acquisition in January 2004, and the Empower Group.
N O T E S T O C O N S O L I D A T E D F I N A N C I A L S T A T E M E N T Si n m i l l i o n s , e x c e p t s h a r e a n d p e r s h a r e d a t a

2004 Annua l Repo r t M A N P O W E R I N C .88
As Of and For The Year Ended December 31 2004 2003 2002
Tota l Assets
United States $ 687.6 $ 655.4 $ 623.7
France 1,829.8 1,555.2 1,218.5
EMEA 1,563.6 1,362.9 1,134.0
Jefferson Wells 60.9 38.4 41.0
Right(a) 282.0 109.1 104.2
Other Operations 550.0 416.4 332.5
Corporate(b) 869.2 239.0 236.0
$ 5,843.1 $ 4,376.4 $ 3,689.9
Investments in L icensees
United States $ 15.3 $ 14.5 $ 14.7
France 0.9 — —
EMEA 45.3 61.0 54.1
Other Operations 21.2 20.2 18.4
$ 82.7 $ 95.7 $ 87.2
Long-L ived Assets (c)
United States $ 50.4 $ 55.8 $ 57.0
France 80.1 79.2 72.3
EMEA 66.8 65.4 73.5
Jefferson Wells 5.2 3.8 5.3
Right 38.0 2.6 3.0
Other Operations 28.0 24.4 20.4
Corporate 3.9 4.4 —
$ 272.4 $ 235.6 $ 231.5
Addit ions to Long-L ived Assets
United States $ 7.5 $ 11.4 $ 23.4
France 14.4 13.7 13.3
EMEA 22.8 18.5 17.5
Jefferson Wells 3.7 1.1 0.4
Right 7.5 0.5 0.8
Other Operations 13.1 10.9 6.1
Corporate — 4.4 —
$ 69.0 $ 60.5 $ 61.5
(a) Represents the operations of Right Management Consultants, Inc., since its acquisition in January 2004, and the Empower Group.(b) Corporate assets include assets that are not used in the operations of any segment or allocated for management reporting. (c) Supplemental geographic information is as follows:
Long-Lived Assets 2004 2003 2002
United States $ 73.6 $ 59.8 $ 62.7
France 83.9 79.2 72.3
United Kingdom 27.1 24.2 30.8
Total Foreign 198.8 175.8 168.8
N O T E S T O C O N S O L I D A T E D F I N A N C I A L S T A T E M E N T Si n m i l l i o n s , e x c e p t s h a r e a n d p e r s h a r e d a t a

M A N P O W E R I N C . 2004 Annua l Repo r t89
First Second Third FourthQuarter Quarter Quarter Quarter Tota l
Year Ended December 31, 2004
Revenues from services $ 3,334.1 $ 3,622.4 $ 3,900.8 $ 4,072.7 $ 14,930.0
Gross profit 616.5 679.3 728.1 764.2 2,788.1
Operating profit 56.2 95.2 126.9 117.5 395.8
Net earnings 39.6 53.1 83.4 69.6 245.7
Net earnings per share $ 0.46 $ 0.59 $ 0.93 $ 0.77 $ 2.76
Net earnings per share – diluted (a) $ 0.43 $ 0.56 $ 0.87 $ 0.73 $ 2.59
Dividends per share $ — $ 0.10 $ — $ 0.20 $ 0.30
Market price:
High $ 49.14 $ 50.77 $ 49.30 $ 49.67
Low 41.20 46.00 38.71 41.99
Year Ended December 31, 2003
Revenues from services $ 2,678.7 $ 3,013.4 $ 3,203.2 $ 3,289.2 $ 12,184.5
Gross profit 466.0 521.5 549.6 599.7 2,136.8
Operating profit 33.0 57.0 78.8 89.1 257.9
Net earnings 14.9 29.1 43.8 49.9 137.7
Net earnings per share $ 0.19 $ 0.38 $ 0.56 $ 0.64 $ 1.77
Net earnings per share – diluted (a) $ 0.19 $ 0.36 $ 0.53 $ 0.61 $ 1.69
Dividends per share $ — $ 0.10 $ — $ 0.10 $ 0.20
Market price:
High $ 34.71 $ 38.28 $ 39.99 $ 47.54
Low 27.50 29.91 34.64 37.55
(a) In the fourth quarter of 2004, we adopted EITF 04-8. Previously reported Net Earnings Per Share – Diluted amounts have been restated to reflect the impact ofapplying the “if-converted” method to our Debentures. (See note 3 for further information.)
Q U A R T E R L Y D A T A ( U N A U D I T E D )i n m i l l i o n s , e x c e p t s h a r e a n d p e r s h a r e d a t a
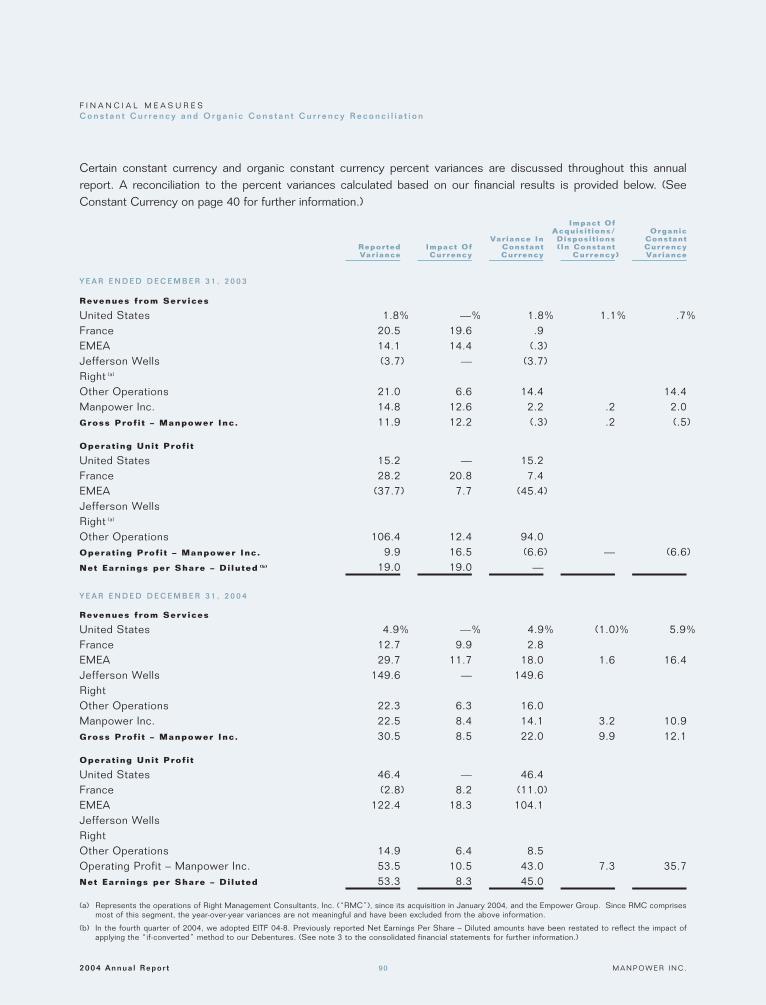
2004 Annua l Repo r t M A N P O W E R I N C .90
Certain constant currency and organic constant currency percent variances are discussed throughout this annualreport. A reconciliation to the percent variances calculated based on our financial results is provided below. (SeeConstant Currency on page 40 for further information.)
Impact OfAcquis i t ions/ Organic
Var iance In Disposi t ions ConstantReported Impact Of Constant ( In Constant CurrencyVar iance Currency Currency Currency) Var iance
Y E A R E N D E D D E C E M B E R 3 1 , 2 0 0 3
Revenues from Serv ices
United States 1.8% —% 1.8% 1.1% .7%France 20.5 19.6 .9EMEA 14.1 14.4 (.3)Jefferson Wells (3.7) — (3.7)Right (a)
Other Operations 21.0 6.6 14.4 14.4Manpower Inc. 14.8 12.6 2.2 .2 2.0Gross Prof i t – Manpower Inc. 11.9 12.2 (.3) .2 (.5)
Operat ing Uni t Prof i t
United States 15.2 — 15.2France 28.2 20.8 7.4EMEA (37.7) 7.7 (45.4)Jefferson WellsRight (a)
Other Operations 106.4 12.4 94.0Operat ing Prof i t – Manpower Inc. 9.9 16.5 (6.6) — (6.6)Net Earnings per Share – Di luted (b) 19.0 19.0 —
Y E A R E N D E D D E C E M B E R 3 1 , 2 0 0 4
Revenues from Serv ices
United States 4.9% —% 4.9% (1.0)% 5.9%France 12.7 9.9 2.8EMEA 29.7 11.7 18.0 1.6 16.4Jefferson Wells 149.6 — 149.6RightOther Operations 22.3 6.3 16.0Manpower Inc. 22.5 8.4 14.1 3.2 10.9Gross Prof i t – Manpower Inc. 30.5 8.5 22.0 9.9 12.1
Operat ing Uni t Prof i t
United States 46.4 — 46.4France (2.8) 8.2 (11.0)EMEA 122.4 18.3 104.1Jefferson WellsRightOther Operations 14.9 6.4 8.5Operating Profit – Manpower Inc. 53.5 10.5 43.0 7.3 35.7Net Earnings per Share – Di luted 53.3 8.3 45.0
(a) Represents the operations of Right Management Consultants, Inc. (“RMC”), since its acquisition in January 2004, and the Empower Group. Since RMC comprisesmost of this segment, the year-over-year variances are not meaningful and have been excluded from the above information.
(b) In the fourth quarter of 2004, we adopted EITF 04-8. Previously reported Net Earnings Per Share – Diluted amounts have been restated to reflect the impact ofapplying the “if-converted” method to our Debentures. (See note 3 to the consolidated financial statements for further information.)
F I N A N C I A L M E A S U R E SC o n s t a n t C u r r e n c y a n d O r g a n i c C o n s t a n t C u r r e n c y R e c o n c i l i a t i o n

M A N P O W E R I N C . 2004 Annua l Repo r t91
As Of And For The Year Ended December 31 2004 2003 2002 2001 2000
Operat ions Data
Revenues from services $ 14,930.0 $ 12,184.5 $ 10,610.9 $ 10,483.8 $ 10,842.8
Gross profit 2,788.1 2,136.8 1,910.4 1,956.5 1,946.7
Operating profit(a) 395.8 257.9 234.8 237.6 311.0
Net earnings(a) 245.7 137.7 113.2 124.5 171.2
Per Share Data
Net earnings(a) $ 2.76 $ 1.77 $ 1.48 $ 1.64 $ 2.26
Net earnings – diluted(a)(b) 2.59 1.69 1.42 1.59 2.22
Dividends 0.30 0.20 0.20 0.20 0.20
Balance Sheet Data
Total assets $ 5,843.1 $ 4,376.4 $ 3,689.9 $ 3,228.0 $ 3,033.9
Long-term debt 676.1 829.6 799.0 811.1 491.6
The notes to consolidated financial statements should be read in conjunction with the above summary.
(a) On January 1, 2002, we adopted SFAS No. 142, “Goodwill and Other Intangible Assets,” which prohibits the amortization of goodwill and identifiable intangibleassets with an indefinite life. (See note 1 to the consolidated financial statements for further information.)
(b) In the fourth quarter of 2004, we adopted EITF 04-8. Previously reported Net Earnings Per Share - Diluted amounts have been restated to reflect the impact ofapplying the “if-converted” method to our Debentures. (See note 3 to the consolidated financial statements for further information.) As the 2001 and 2000 amountswere previously audited by Arthur Andersen LLP, these restated figures are unaudited.
S E L E C T E D F I N A N C I A L D A T Ai n m i l l i o n s , e x c e p t p e r s h a r e d a t a

2004 Annua l Repo r t M A N P O W E R I N C .92
I N T E R N A T I O N A L H E A D Q U A R T E R S
P.O. Box 20535301 N. Ironwood Rd.Milwaukee, WI 53201 USA+1.414.961.1000www.manpower.com
T R A N S F E R A G E N T A N D R E G I S T R A R
Mellon Investor Services, L.L.C.P.O. Box 3315South Hackensack, NJ 07606 USAwww.mellon-investor.com
S T O C K E X C H A N G E L I S T I N G
NYSE Symbol: MAN
F O R M 1 0 - K
A copy of Form 10-K filed with the Securities and Exchange Commission for the year endedDecember 31, 2004 is available without charge afterFebruary 22, 2005 and can be obtained online atwww.investor.manpower.com or by writing to:
Michael J. Van HandelManpower Inc.P.O. Box 20535301 N. Ironwood Rd.Milwaukee, WI 53201 USA
S H A R E H O L D E R S
As of February 15, 2005, Manpower Inc. commonstock was held by approximately 6,900 record holders.
A N N U A L M E E T I N G O F S H A R E H O L D E R S
April 26, 2005 at 9 a.m.Manpower International Headquarters5301 N. Ironwood Rd.Milwaukee, WI 53217USA
I N V E S T O R R E L A T I O N S W E B S I T E
The most current corporate and investor informationcan be found on the Manpower Inc. corporate websiteat www.manpower.com. Interested individuals may alsochoose to receive Manpower press releases and otherinformation via e-mail by subscribing to our E-mail Alertservice at www.investor.manpower.com.
G O V E R N A N C E
Manpower’s governance structure is designed toensure transparency in our operations and adherenceto the regulations set forth by the U.S. Securities and Exchange Commission (SEC). Information onManpower’s corporate governance structure and policies can be found at www.manpower.com in thesection titled, “About Manpower.”
As of November 3, 2004, the Corporate GovernanceQuotient indicated that Manpower outperformed 91.9%of the companies in the S&P 400 and 96.3% of thecompanies in the Commercial Services & Suppliesgroup. The Corporate Governance Quotient index isissued by Institutional Shareholder Services, a respectedauthority on proxy voting and corporate governance.
Governance Metrics International, an independent corporate governance rating agency, rated Manpower a 7 on a scale of 1 to 10, with 10 being the highestranking, in August 2004. The average score of all companies rated by GMI is 6.5.
C O R P O R A T E I N F O R M A T I O N
M A N P O W E R I N C . 2004 Annua l Repo r t93
D I R E C T O R S
Jeffrey A. Joerres
Chairman, CEO and President Manpower Inc.
Marc J. Bol land 2
Executive Board MemberHeineken N.V.
J. Thomas Bouchard 1,2*
Retired Senior Vice President, Human ResourcesIBM
Stephanie A. Burns 1,3
President and CEO Dow Corning
Wil l ie D. Davis 1,3
President All Pro Broadcasting Inc.
Jack M. Greenberg 2
Retired Chairman and CEOMcDonald’s Corporation
Terry A. Hueneke
Retired Executive Vice President Manpower Inc.
Rozanne L. Ridgway 2,3
Former Assistant Secretary of State for Europe and Canada
Dennis Stevenson
Chairman HBOS plc and Pearson plc
John R. Wal ter 2,3*
Retired President and COO AT&T Corp.Former Chairman, President and CEO R.R. Donnelley & Sons
Edward J. Zore 1*,3
President and CEO Northwestern Mutual
M A N A G E M E N T
Jeffrey A. Joerres
Chairman, CEO and President
Michael J . Van Handel
Executive Vice President and CFO
Barbara J . Beck
Executive Vice President United States and Canadian Operations
Jean-Pierre Lemonnier
Executive Vice President France and Region
Yoav Michaely
Executive Vice President Europe, Middle East and Africa (excluding France)
Owen Sul l ivan
Executive Vice PresidentCEO of Right Management Consultants and Jefferson Wells
David Arkless
Senior Vice President Corporate Affairs
Richard B. Davidson
Senior Vice President Global Chief Information Officer
Ia in Herbertson
Senior Vice President Asia Pacific
Tammy Johns
Senior Vice President Global Sales
Board Committees 1 Audit Committee2 Executive Compensation Committee3 Nominating and Governance Committee* Denotes Committee Chair
C O R P O R A T E I N F O R M A T I O N

2004 Annua l Repo r t M A N P O W E R I N C .94
Manpower Inc. (NYSE: MAN) is a world leader in the employment services industry, offering customers a continuum of servicesto meet their needs throughout the employment and business cycle. The company specializes in permanent, temporary and contractrecruitment; employee assessment; training; career transition and organizational consulting services. Manpower’s worldwide networkof 4,300 offices in 67 countries and territories enables the company to meet the needs of its 400,000 customers per year, includingsmall and medium size enterprises in all industry sectors, as well as the world’s largest multinational corporations. The focus ofManpower’s work is on raising productivity through improved quality, efficiency and cost-reduction, enabling customers to concentrateon their core business activities. In addition to the Manpower brand, the company operates under the brand names of RightManagement Consultants, Jefferson Wells, Elan and Brook Street. More information on Manpower Inc. is available at www.manpower.com.
Jefferson Wel ls Internat ional , Inc. , a wholly owned subsidiary of Manpower Inc., was acquired in July of 2001. JeffersonWells delivers professional services in the areas of internal audit and controls, technology risk management, tax, finance and accounting.The firm serves clients, including Fortune 500 and Global 1000 companies, through highly experienced professionals working from 37offices across North America and in Europe.
Right Management Consul tants , Inc. , the world’s largest career transition and organizational consulting firm, was acquiredby Manpower in January of 2004. It offers its services to corporations of all sizes through a global network of approximately 300 servicelocations in 35 countries and via the Internet. The Empower Group, Manpower’s organizational performance consulting subsidiaryheadquartered in London, merged with Right Management Consultants in 2004.
Elan Group Ltd. , a wholly owned subsidiary of Manpower Inc., is the world’s leading IT and technical recruitment specialists.Having provided IT and telecommunications professionals to over 1,400 companies worldwide, the company has built a reputationfor quality delivery of personnel in all technologies and disciplines on a contract, permanent and managed service basis. Elan servesits clients via a network of 52 offices throughout 16 countries in Europe and Asia Pacific.
Brook Street Bureau is a wholly owned subsidiary of Manpower Inc. in the United Kingdom. Its core business is the supply oftemporary, permanent and contract staff to office, secretarial and light industrial positions.
P R I N C I P A L O P E R A T I N G U N I T S
M A N P O W E R O P E R A T I O N S
Argentina, Australia, Austria, Belgium, Bolivia, Brazil, Canada, Chile, China, Colombia, Costa Rica, CzechRepublic, Denmark, Ecuador, El Salvador, Estonia, Finland, France, Germany, Greece, Guadeloupe, Guatemala,Honduras, Hong Kong, Hungary, India, Ireland, Israel, Italy, Japan, Korea, Luxembourg, Malaysia, Martinique,Mexico, Monaco, Morocco, New Caledonia, New Zealand, Nicaragua, Netherlands, Norway, Panama, Paraguay,Peru, Philippines, Poland, Portugal, Puerto Rico, Reunion, Romania, Russia, Singapore, Slovakia, Slovenia, SouthAfrica, Spain, Sweden, Switzerland, Taiwan, Thailand, Tunisia, Turkey, UK, USA, Uruguay, and Venezuela.
DE
SIG
N:
Sa
ma
taM
as
on
PO
RT
RA
IT P
HO
TO
GR
AP
HY
:M
arc
No
rbe
rgP
RIN
TIN
G:
La
ke
Co
un
ty P
res
s

P O W E R A W A R D I N D I V I D U A L W I N N E R S A N N O U N C E M E N T
The Manpower Power Award has been part of the company’s culture since 1959. The Award recognizes specific operationsaround the world for their outstanding performance during the year in representing the values, culture and brand ofManpower and for their financial achievements over the past year.
This year, for the first time in the program’s history, three individual winners also received the Power Award. Thesewinners include:
Nancy Creuz iger , Manpower Vice President and Corporate Controller, for her leadership of Manpower’s successfulSarbanes-Oxley compliance program;
Doug Klemp , Director of Customer Implementation, for his leadership role in ensuring the successful integrationof Right Management Consultants after Manpower acquired the business in 2004, in addition to his responsibilitiesmanaging a key global account and developing customer implementation programs; and
Jonas Pr is ing , Managing Director of Manpower Italy, in recognition of the organization’s outstanding performance in2004, as well as his leading role in managing a global team on a significant corporate initiative.
Congratulations to all of our Power Award winners this year.

INTERNATIONAL HEADQUARTERSP.O. BOX 2053
5301 NORTH IRONWOOD ROADMILWAUKEE, WISCONSIN 53201
USA+ 1 414 961 1000
WWW.MANPOWER.COM
AR-108 (03/05)©2005 MANPOWER INC.